|
chr4_+_54660954
|
3.308
|
NM_133267
|
GSX2
|
GS homeobox 2
|
|
chr8_+_120289735
|
2.813
|
NM_052886
|
MAL2
|
mal, T-cell differentiation protein 2 (gene/pseudogene)
|
|
chr7_-_27162688
|
2.655
|
NM_006896
|
HOXA7
|
homeobox A7
|
|
chr12_-_47604930
|
2.535
|
NM_001143781
|
FKBP11
|
FK506 binding protein 11, 19 kDa
|
|
chr17_-_36469869
|
2.493
|
NM_001165252
|
LOC730755
|
keratin associated protein 2-4-like
|
|
chr7_-_1562272
|
2.461
|
NM_001097620
|
TMEM184A
|
transmembrane protein 184A
|
|
chr2_-_219826854
|
2.350
|
NM_006000
|
TUBA4A
|
tubulin, alpha 4a
|
|
chr16_-_66827449
|
2.274
|
NM_024939
|
ESRP2
|
epithelial splicing regulatory protein 2
|
|
chr4_-_17392232
|
2.208
|
NM_015688
|
FAM184B
|
family with sequence similarity 184, member B
|
|
chr12_-_50871953
|
2.195
|
NM_001081492
NM_182507
|
KRT80
|
keratin 80
|
|
chr17_+_36515166
|
2.153
|
NM_001146041
|
KRTAP4-9
|
keratin associated protein 4-9
|
|
chr11_+_126378507
|
2.138
|
|
NCRNA00288
|
non-protein coding RNA 288
|
|
chr3_-_11585264
|
2.118
|
NM_001128221
|
VGLL4
|
vestigial like 4 (Drosophila)
|
|
chr9_+_696744
|
2.115
|
NM_153186
|
KANK1
|
KN motif and ankyrin repeat domains 1
|
|
chr1_+_201364050
|
2.104
|
|
ADORA1
|
adenosine A1 receptor
|
|
chr2_-_217267742
|
2.090
|
|
IGFBP5
|
insulin-like growth factor binding protein 5
|
|
chr19_+_1226510
|
1.967
|
NM_017914
|
C19orf24
|
chromosome 19 open reading frame 24
|
|
chrX_-_114703273
|
1.953
|
|
|
|
|
chr16_+_639278
|
1.942
|
NM_145294
|
WDR90
|
WD repeat domain 90
|
|
chr2_-_133144094
|
1.892
|
|
LYPD1
|
LY6/PLAUR domain containing 1
|
|
chr11_-_116168316
|
1.823
|
NM_001166598
NM_052968
|
APOA5
|
apolipoprotein A-V
|
|
chr6_-_18230829
|
1.819
|
NM_198586
|
NHLRC1
|
NHL repeat containing 1
|
|
chr2_-_219633481
|
1.817
|
NM_002181
|
IHH
|
Indian hedgehog
|
|
chr16_+_84204424
|
1.805
|
NM_014615
|
KIAA0182
|
KIAA0182
|
|
chr3_-_126414252
|
1.787
|
NM_024628
|
SLC12A8
|
solute carrier family 12 (potassium/chloride transporters), member 8
|
|
chr13_+_112999538
|
1.776
|
|
LAMP1
|
lysosomal-associated membrane protein 1
|
|
chr10_+_112826774
|
1.747
|
NM_000681
|
ADRA2A
|
adrenergic, alpha-2A-, receptor
|
|
chr9_-_129869211
|
1.739
|
NM_197956
|
NAIF1
|
nuclear apoptosis inducing factor 1
|
|
chr22_+_34107087
|
1.729
|
|
HMOX1
|
heme oxygenase (decycling) 1
|
|
chr3_-_49370755
|
1.721
|
NM_000581
NM_201397
|
GPX1
|
glutathione peroxidase 1
|
|
chr19_-_10625449
|
1.710
|
|
LOC147727
|
hypothetical LOC147727
|
|
chr8_-_75396016
|
1.698
|
NM_020647
|
JPH1
|
junctophilin 1
|
|
chr11_+_66915997
|
1.686
|
NM_004584
|
RAD9A
|
RAD9 homolog A (S. pombe)
|
|
chr12_+_6703686
|
1.644
|
NM_001164093
|
COPS7A
|
COP9 constitutive photomorphogenic homolog subunit 7A (Arabidopsis)
|
|
chr2_+_176680251
|
1.626
|
NM_021192
|
HOXD11
|
homeobox D11
|
|
chr17_-_17050326
|
1.623
|
|
PLD6
|
phospholipase D family, member 6
|
|
chr3_-_49370682
|
1.613
|
|
GPX1
|
glutathione peroxidase 1
|
|
chr3_+_49034494
|
1.595
|
|
NDUFAF3
|
NADH dehydrogenase (ubiquinone) 1 alpha subcomplex, assembly factor 3
|
|
chrX_+_55760774
|
1.573
|
NM_006064
NM_016656
|
RRAGB
|
Ras-related GTP binding B
|
|
chr8_+_22492198
|
1.568
|
NM_021630
|
PDLIM2
|
PDZ and LIM domain 2 (mystique)
|
|
chr14_-_19999475
|
1.557
|
NM_001100814
NM_144568
|
TMEM55B
|
transmembrane protein 55B
|
|
chr11_+_7491789
|
1.557
|
|
PPFIBP2
|
PTPRF interacting protein, binding protein 2 (liprin beta 2)
|
|
chr19_-_19599973
|
1.544
|
NM_004720
|
LPAR2
|
lysophosphatidic acid receptor 2
|
|
chr17_-_17050355
|
1.538
|
NM_178836
|
PLD6
|
phospholipase D family, member 6
|
|
chr17_-_36507900
|
1.536
|
NM_031960
|
KRTAP4-8
|
keratin associated protein 4-8
|
|
chr10_+_101079099
|
1.533
|
|
CNNM1
|
cyclin M1
|
|
chrX_-_107866262
|
1.532
|
NM_003604
|
IRS4
|
insulin receptor substrate 4
|
|
chr13_+_112999462
|
1.521
|
NM_005561
|
LAMP1
|
lysosomal-associated membrane protein 1
|
|
chr11_+_7491576
|
1.497
|
NM_003621
|
PPFIBP2
|
PTPRF interacting protein, binding protein 2 (liprin beta 2)
|
|
chr2_+_176761552
|
1.445
|
NM_024501
|
HOXD1
|
homeobox D1
|
|
chr20_-_43953036
|
1.422
|
NM_080749
|
NEURL2
|
neuralized homolog 2 (Drosophila)
|
|
chr9_+_17124974
|
1.392
|
NM_001114395
NM_017738
|
CNTLN
|
centlein, centrosomal protein
|
|
chr1_-_152459506
|
1.376
|
|
C1orf43
|
chromosome 1 open reading frame 43
|
|
chr4_-_15694407
|
1.361
|
|
PROM1
|
prominin 1
|
|
chr1_-_152459667
|
1.337
|
|
C1orf43
|
chromosome 1 open reading frame 43
|
|
chr20_+_43952997
|
1.337
|
NM_000308
NM_001127695
NM_001167594
|
CTSA
|
cathepsin A
|
|
chr10_-_91285290
|
1.331
|
NM_213606
|
SLC16A12
|
solute carrier family 16, member 12 (monocarboxylic acid transporter 12)
|
|
chr16_-_52876390
|
1.313
|
|
IRX3
|
iroquois homeobox 3
|
|
chr20_+_46971618
|
1.279
|
NM_006420
|
ARFGEF2
|
ADP-ribosylation factor guanine nucleotide-exchange factor 2 (brefeldin A-inhibited)
|
|
chr7_-_27149750
|
1.268
|
NM_019102
|
HOXA5
|
homeobox A5
|
|
chr2_-_154043403
|
1.260
|
NM_019845
|
RPRM
|
reprimo, TP53 dependent G2 arrest mediator candidate
|
|
chr17_-_29930431
|
1.254
|
NM_207454
|
C17orf102
|
chromosome 17 open reading frame 102
|
|
chr17_-_71362971
|
1.253
|
NM_012478
|
WBP2
|
WW domain binding protein 2
|
|
chr3_+_139636104
|
1.237
|
NM_031913
|
ESYT3
|
extended synaptotagmin-like protein 3
|
|
chr22_-_49317408
|
1.229
|
|
ODF3B
|
outer dense fiber of sperm tails 3B
|
|
chr6_+_96570565
|
1.212
|
NM_006581
|
FUT9
|
fucosyltransferase 9 (alpha (1,3) fucosyltransferase)
|
|
chr18_+_17076166
|
1.206
|
NM_001142966
|
GREB1L
|
growth regulation by estrogen in breast cancer-like
|
|
chr2_+_215885063
|
1.195
|
|
ATIC
|
5-aminoimidazole-4-carboxamide ribonucleotide formyltransferase/IMP cyclohydrolase
|
|
chr2_-_133144950
|
1.195
|
NM_144586
|
LYPD1
|
LY6/PLAUR domain containing 1
|
|
chr1_+_148137778
|
1.180
|
NM_016074
|
BOLA1
|
bolA homolog 1 (E. coli)
|
|
chr20_+_37024383
|
1.157
|
NM_001190809
NM_021931
|
DHX35
|
DEAH (Asp-Glu-Ala-His) box polypeptide 35
|
|
chr10_+_101078784
|
1.156
|
NM_020348
|
CNNM1
|
cyclin M1
|
|
chr16_-_65742323
|
1.149
|
NM_033309
|
B3GNT9
|
UDP-GlcNAc:betaGal beta-1,3-N-acetylglucosaminyltransferase 9
|
|
chr12_+_6703549
|
1.148
|
|
COPS7A
|
COP9 constitutive photomorphogenic homolog subunit 7A (Arabidopsis)
|
|
chr3_+_139636111
|
1.148
|
|
ESYT3
|
extended synaptotagmin-like protein 3
|
|
chr13_+_27392136
|
1.144
|
NM_000209
|
PDX1
|
pancreatic and duodenal homeobox 1
|
|
chr3_-_172109119
|
1.137
|
NM_020390
|
EIF5A2
|
eukaryotic translation initiation factor 5A2
|
|
chr17_+_7416780
|
1.120
|
NM_001416
|
EIF4A1
|
eukaryotic translation initiation factor 4A1
|
|
chr8_-_109165012
|
1.111
|
NM_178565
|
RSPO2
|
R-spondin 2 homolog (Xenopus laevis)
|
|
chr20_-_2769245
|
1.109
|
NM_022760
|
FAM113A
|
family with sequence similarity 113, member A
|
|
chr2_-_11727705
|
1.105
|
NM_012344
|
NTSR2
|
neurotensin receptor 2
|
|
chr17_-_4405367
|
1.098
|
NM_001105538
NM_014520
|
MYBBP1A
|
MYB binding protein (P160) 1a
|
|
chr3_-_50304706
|
1.096
|
NM_006764
|
IFRD2
|
interferon-related developmental regulator 2
|
|
chr22_-_42619139
|
1.094
|
NM_001177675
NM_138814
|
PNPLA5
|
patatin-like phospholipase domain containing 5
|
|
chr1_+_152459918
|
1.092
|
NM_014847
|
UBAP2L
|
ubiquitin associated protein 2-like
|
|
chr17_-_74433048
|
1.091
|
NM_003255
|
TIMP2
|
TIMP metallopeptidase inhibitor 2
|
|
chr20_+_18066473
|
1.086
|
NM_001164811
|
PET117
|
cytochrome c oxidase assembly factor-like
|
|
chr3_-_50335113
|
1.075
|
NM_003773
NM_033158
|
HYAL2
|
hyaluronoglucosaminidase 2
|
|
chr17_-_7078399
|
1.068
|
|
DVL2
|
dishevelled, dsh homolog 2 (Drosophila)
|
|
chr6_-_80713589
|
1.053
|
NM_022726
|
ELOVL4
|
elongation of very long chain fatty acids (FEN1/Elo2, SUR4/Elo3, yeast)-like 4
|
|
chr1_+_222870573
|
1.044
|
|
CNIH3
|
cornichon homolog 3 (Drosophila)
|
|
chr1_+_148521852
|
1.023
|
NM_144697
|
C1orf51
|
chromosome 1 open reading frame 51
|
|
chr12_+_6703525
|
1.023
|
|
COPS7A
|
COP9 constitutive photomorphogenic homolog subunit 7A (Arabidopsis)
|
|
chr5_+_80292213
|
1.023
|
|
RASGRF2
|
Ras protein-specific guanine nucleotide-releasing factor 2
|
|
chr8_+_32525269
|
1.018
|
NM_001160002
NM_001160004
NM_001160005
NM_001160007
NM_001160008
NM_004495
NM_013956
NM_013957
NM_013958
NM_013960
NM_013964
|
NRG1
|
neuregulin 1
|
|
chr7_-_47588652
|
1.008
|
|
TNS3
|
tensin 3
|
|
chr3_+_98016114
|
1.005
|
NM_001080448
|
EPHA6
|
EPH receptor A6
|
|
chr5_+_94981735
|
1.000
|
NM_199243
|
GPR150
|
G protein-coupled receptor 150
|
|
chr16_+_29374479
|
1.000
|
NM_001017389
NM_003166
|
SULT1A4
SULT1A3
SLX1B
|
sulfotransferase family, cytosolic, 1A, phenol-preferring, member 4
sulfotransferase family, cytosolic, 1A, phenol-preferring, member 3
SLX1 structure-specific endonuclease subunit homolog B (S. cerevisiae)
|
|
chr17_-_7078446
|
1.000
|
NM_004422
|
DVL2
|
dishevelled, dsh homolog 2 (Drosophila)
|
|
chr16_+_57106883
|
0.996
|
NM_001160305
NM_024860
|
SETD6
|
SET domain containing 6
|
|
chr6_-_42218692
|
0.995
|
NM_001164446
|
C6orf132
|
chromosome 6 open reading frame 132
|
|
chr10_-_14090459
|
0.984
|
|
FRMD4A
|
FERM domain containing 4A
|
|
chr1_-_152459697
|
0.984
|
NM_001098616
NM_015449
NM_138740
|
C1orf43
|
chromosome 1 open reading frame 43
|
|
chr2_+_215885053
|
0.981
|
|
ATIC
|
5-aminoimidazole-4-carboxamide ribonucleotide formyltransferase/IMP cyclohydrolase
|
|
chr5_+_80292313
|
0.968
|
NM_006909
|
RASGRF2
|
Ras protein-specific guanine nucleotide-releasing factor 2
|
|
chr20_-_2769120
|
0.962
|
|
FAM113A
|
family with sequence similarity 113, member A
|
|
chr22_+_48740432
|
0.959
|
|
PIM3
|
pim-3 oncogene
|
|
chr2_+_215884923
|
0.958
|
NM_004044
|
ATIC
|
5-aminoimidazole-4-carboxamide ribonucleotide formyltransferase/IMP cyclohydrolase
|
|
chr20_+_43953372
|
0.956
|
|
CTSA
|
cathepsin A
|
|
chr17_-_68769613
|
0.953
|
NM_001129885
|
CPSF4L
|
cleavage and polyadenylation specific factor 4-like
|
|
chr21_+_36993302
|
0.952
|
|
|
|
|
chr14_-_67051773
|
0.947
|
NM_182526
|
TMEM229B
|
transmembrane protein 229B
|
|
chr16_+_2510323
|
0.945
|
NM_001145815
NM_015944
|
AMDHD2
|
amidohydrolase domain containing 2
|
|
chr8_-_121893468
|
0.944
|
NM_021021
|
SNTB1
|
syntrophin, beta 1 (dystrophin-associated protein A1, 59kDa, basic component 1)
|
|
chr16_-_69277355
|
0.941
|
NM_138383
|
MTSS1L
|
metastasis suppressor 1-like
|
|
chr7_-_23476497
|
0.935
|
NM_006547
|
IGF2BP3
|
insulin-like growth factor 2 mRNA binding protein 3
|
|
chr12_+_32546243
|
0.935
|
NM_139241
|
FGD4
|
FYVE, RhoGEF and PH domain containing 4
|
|
chr1_-_92721633
|
0.933
|
|
GFI1
|
growth factor independent 1 transcription repressor
|
|
chr7_-_84654106
|
0.930
|
|
SEMA3D
|
sema domain, immunoglobulin domain (Ig), short basic domain, secreted, (semaphorin) 3D
|
|
chr6_-_46566969
|
0.929
|
|
RCAN2
|
regulator of calcineurin 2
|
|
chr17_-_2561676
|
0.926
|
NM_015229
|
KIAA0664
|
KIAA0664
|
|
chr13_-_19665036
|
0.926
|
|
GJB2
|
gap junction protein, beta 2, 26kDa
|
|
chr4_+_146820805
|
0.925
|
NM_001080531
|
C4orf51
|
chromosome 4 open reading frame 51
|
|
chr17_+_4434582
|
0.923
|
NM_001114974
|
SMTNL2
|
smoothelin-like 2
|
|
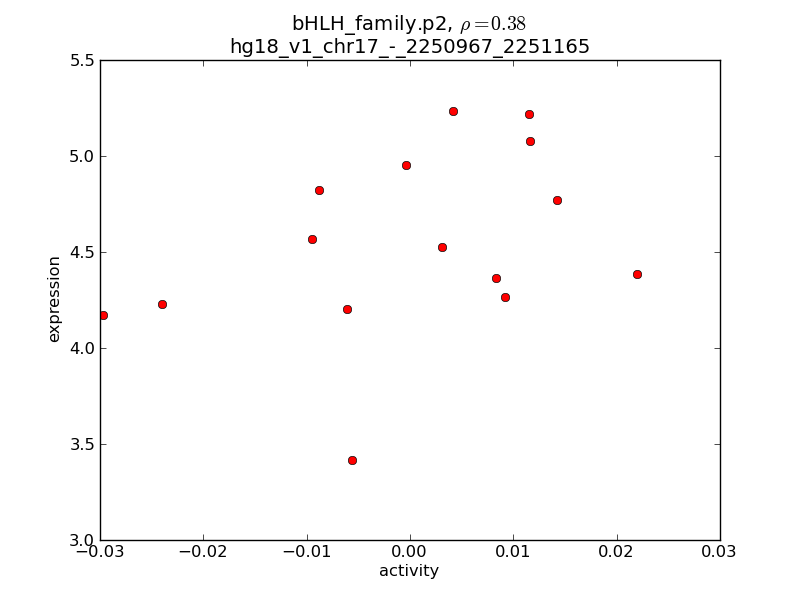
chr17_-_2250967
|
0.916
|
NM_020310
|
MNT
|
MAX binding protein
|
|
chr2_-_139254273
|
0.916
|
NM_007226
|
NXPH2
|
neurexophilin 2
|
|
chr11_-_106394039
|
0.915
|
NM_000855
|
GUCY1A2
|
guanylate cyclase 1, soluble, alpha 2
|
|
chr9_-_34038869
|
0.914
|
|
UBAP2
|
ubiquitin associated protein 2
|
|
chr14_+_23575460
|
0.912
|
NM_001082488
|
DHRS4L1
|
dehydrogenase/reductase (SDR family) member 4 like 1
|
|
chr10_-_120504267
|
0.905
|
|
|
|
|
chr8_-_99375739
|
0.904
|
NM_024759
|
NIPAL2
|
NIPA-like domain containing 2
|
|
chrX_+_102749489
|
0.903
|
NM_001006933
NM_032926
|
TCEAL3
|
transcription elongation factor A (SII)-like 3
|
|
chr14_-_23981493
|
0.896
|
NM_020195
|
SDR39U1
|
short chain dehydrogenase/reductase family 39U, member 1
|
|
chr1_+_95058488
|
0.895
|
NM_001114106
|
SLC44A3
|
solute carrier family 44, member 3
|
|
chr17_-_18848713
|
0.894
|
NM_001039999
|
FAM83G
|
family with sequence similarity 83, member G
|
|
chr17_+_74542066
|
0.893
|
NM_198593
|
C1QTNF1
|
C1q and tumor necrosis factor related protein 1
|
|
chr20_+_43953331
|
0.888
|
|
CTSA
|
cathepsin A
|
|
chr3_-_69064364
|
0.886
|
NM_001005527
NM_182522
|
FAM19A4
|
family with sequence similarity 19 (chemokine (C-C motif)-like), member A4
|
|
chr19_+_60688349
|
0.886
|
NM_020378
|
NAT14
|
N-acetyltransferase 14 (GCN5-related, putative)
|
|
chr14_+_104226769
|
0.883
|
NM_001031714
NM_022489
NM_032714
|
INF2
|
inverted formin, FH2 and WH2 domain containing
|
|
chr15_-_98699628
|
0.879
|
NM_139057
|
ADAMTS17
|
ADAM metallopeptidase with thrombospondin type 1 motif, 17
|
|
chr7_+_55054416
|
0.878
|
|
EGFR
|
epidermal growth factor receptor
|
|
chr13_+_112999590
|
0.878
|
|
LAMP1
|
lysosomal-associated membrane protein 1
|
|
chr19_-_40938251
|
0.876
|
|
HSPB6
|
heat shock protein, alpha-crystallin-related, B6
|
|
chr20_+_61054443
|
0.876
|
NM_022082
|
SLC17A9
|
solute carrier family 17, member 9
|
|
chr2_+_74594093
|
0.874
|
|
TLX2
|
T-cell leukemia homeobox 2
|
|
chr3_+_51992339
|
0.874
|
NM_000666
NM_001198895
NM_001198896
NM_001198897
NM_001198898
|
ACY1
|
aminoacylase 1
|
|
chr9_+_115265827
|
0.865
|
NM_017790
|
RGS3
|
regulator of G-protein signaling 3
|
|
chr12_-_47605478
|
0.858
|
NM_001143782
NM_016594
|
FKBP11
|
FK506 binding protein 11, 19 kDa
|
|
chr7_-_11838260
|
0.855
|
NM_015204
|
THSD7A
|
thrombospondin, type I, domain containing 7A
|
|
chr17_+_36493927
|
0.854
|
NM_033061
|
KRTAP4-7
|
keratin associated protein 4-7
|
|
chr1_-_20931288
|
0.849
|
|
SH2D5
|
SH2 domain containing 5
|
|
chr2_-_133145539
|
0.849
|
NM_001077427
|
LYPD1
|
LY6/PLAUR domain containing 1
|
|
chr12_+_48641545
|
0.847
|
NM_001651
|
AQP5
|
aquaporin 5
|
|
chr7_-_45927263
|
0.843
|
NM_000598
NM_001013398
|
IGFBP3
|
insulin-like growth factor binding protein 3
|
|
chr2_+_217206327
|
0.842
|
NM_000597
|
IGFBP2
|
insulin-like growth factor binding protein 2, 36kDa
|
|
chr14_-_19999324
|
0.839
|
|
TMEM55B
|
transmembrane protein 55B
|
|
chr19_+_748444
|
0.835
|
|
PTBP1
|
polypyrimidine tract binding protein 1
|
|
chr17_+_77529070
|
0.829
|
|
ASPSCR1
|
alveolar soft part sarcoma chromosome region, candidate 1
|
|
chr14_+_64240902
|
0.829
|
NM_015549
|
PLEKHG3
|
pleckstrin homology domain containing, family G (with RhoGef domain) member 3
|
|
chrX_-_131919896
|
0.827
|
|
HS6ST2
|
heparan sulfate 6-O-sulfotransferase 2
|
|
chr20_+_43953428
|
0.824
|
|
CTSA
|
cathepsin A
|
|
chr2_-_216944911
|
0.818
|
NM_020814
|
MARCH4
|
membrane-associated ring finger (C3HC4) 4
|
|
chr17_-_74487527
|
0.818
|
NM_005567
|
LGALS3BP
|
lectin, galactoside-binding, soluble, 3 binding protein
|
|
chr1_+_150937463
|
0.817
|
NM_178428
|
LCE2A
|
late cornified envelope 2A
|
|
chr8_+_22492586
|
0.817
|
|
PDLIM2
|
PDZ and LIM domain 2 (mystique)
|
|
chr2_+_223625105
|
0.816
|
NM_080671
|
KCNE4
|
potassium voltage-gated channel, Isk-related family, member 4
|
|
chr14_-_76807302
|
0.809
|
NM_021257
|
NGB
|
neuroglobin
|
|
chr17_-_40866062
|
0.807
|
NM_174919
|
SH3D20
|
SH3 domain containing 20
|
|
chr14_-_63830830
|
0.806
|
NM_001040275
NM_001437
|
ESR2
|
estrogen receptor 2 (ER beta)
|
|
chr16_+_65790514
|
0.806
|
NM_024712
|
ELMO3
|
engulfment and cell motility 3
|
|
chr6_-_33822659
|
0.801
|
NM_001142883
NM_054111
|
IP6K3
|
inositol hexakisphosphate kinase 3
|
|
chr19_+_10673105
|
0.796
|
NM_031209
|
QTRT1
|
queuine tRNA-ribosyltransferase 1
|
|
chr12_+_52806103
|
0.795
|
|
LOC400043
|
hypothetical LOC400043
|
|
chr10_-_104463947
|
0.795
|
NM_004311
|
ARL3
|
ADP-ribosylation factor-like 3
|
|
chr7_-_27136876
|
0.793
|
NM_002141
|
HOXA4
|
homeobox A4
|
|
chr6_+_37245860
|
0.792
|
NM_002648
|
PIM1
|
pim-1 oncogene
|
|
chr19_-_40938046
|
0.792
|
|
HSPB6
|
heat shock protein, alpha-crystallin-related, B6
|
|
chr1_+_45565126
|
0.788
|
NM_032756
|
HPDL
|
4-hydroxyphenylpyruvate dioxygenase-like
|
|
chr7_-_72822471
|
0.788
|
NM_001306
|
CLDN3
|
claudin 3
|
|
chr5_+_63838183
|
0.788
|
NM_001029875
|
RGS7BP
|
regulator of G-protein signaling 7 binding protein
|
|
chr3_-_172109075
|
0.787
|
|
EIF5A2
|
eukaryotic translation initiation factor 5A2
|
|
chr17_-_77478835
|
0.785
|
NM_002359
|
MAFG
|
v-maf musculoaponeurotic fibrosarcoma oncogene homolog G (avian)
|
|
chr15_+_38082041
|
0.783
|
|
EIF2AK4
|
eukaryotic translation initiation factor 2 alpha kinase 4
|
|
chr17_+_21131940
|
0.782
|
NM_002756
|
MAP2K3
|
mitogen-activated protein kinase kinase 3
|
|
chr10_+_52421120
|
0.778
|
|
PRKG1
|
protein kinase, cGMP-dependent, type I
|
|
chr3_+_49482474
|
0.771
|
NM_001165928
NM_001177634
NM_001177635
NM_001177636
NM_001177637
NM_001177638
NM_001177639
NM_001177640
NM_001177641
NM_001177642
NM_001177644
NM_004393
|
DAG1
|
dystroglycan 1 (dystrophin-associated glycoprotein 1)
|
|
chr20_+_61796731
|
0.768
|
NM_032945
|
TNFRSF6B
|
tumor necrosis factor receptor superfamily, member 6b, decoy
|
|
chr5_-_94646033
|
0.767
|
NM_024717
|
MCTP1
|
multiple C2 domains, transmembrane 1
|
|
chr17_-_76064842
|
0.762
|
NM_002522
|
NPTX1
|
neuronal pentraxin I
|
|
chr2_-_232037308
|
0.761
|
NM_005381
|
NCL
|
nucleolin
|
|
chr19_+_748390
|
0.761
|
NM_002819
NM_031990
NM_031991
NM_175847
|
PTBP1
|
polypyrimidine tract binding protein 1
|
|
chr18_-_72973750
|
0.760
|
NM_001025100
NM_001025101
|
MBP
|
myelin basic protein
|
|
chr22_+_34107051
|
0.759
|
NM_002133
|
HMOX1
|
heme oxygenase (decycling) 1
|
|
chr16_+_51646292
|
0.757
|
NM_025134
|
CHD9
|
chromodomain helicase DNA binding protein 9
|
|
chr9_+_132309914
|
0.757
|
NM_000050
NM_054012
|
ASS1
|
argininosuccinate synthase 1
|
|
chr12_-_57600564
|
0.755
|
|
LRIG3
|
leucine-rich repeats and immunoglobulin-like domains 3
|
|
chr5_+_122452739
|
0.754
|
NM_001136239
|
PRDM6
|
PR domain containing 6
|
|
chr4_+_8251818
|
0.751
|
NM_018986
|
SH3TC1
|
SH3 domain and tetratricopeptide repeats 1
|