|
chr1_+_50342168
|
1.996
|
NM_001144776
|
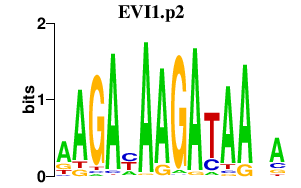
ELAVL4
|
ELAV (embryonic lethal, abnormal vision, Drosophila)-like 4 (Hu antigen D)
|
|
chr9_+_33230165
|
1.740
|
NM_014471
|
SPINK4
|
serine peptidase inhibitor, Kazal type 4
|
|
chrX_+_50670474
|
1.694
|
NM_005448
|
BMP15
|
bone morphogenetic protein 15
|
|
chr1_+_202033273
|
1.645
|
NM_001174108
|
ZBED6
|
zinc finger, BED-type containing 6
|
|
chr6_-_32892705
|
1.528
|
NM_002120
|
HLA-DOB
|
major histocompatibility complex, class II, DO beta
|
|
chr12_-_27126721
|
1.523
|
NM_001080406
|
C12orf71
|
chromosome 12 open reading frame 71
|
|
chr11_-_113935789
|
1.488
|
NM_152315
|
FAM55A
|
family with sequence similarity 55, member A
|
|
chr4_+_70928718
|
1.403
|
NM_000200
|
HTN3
|
histatin 3
|
|
chr6_+_126282078
|
1.360
|
|
NCOA7
|
nuclear receptor coactivator 7
|
|
chr5_-_96175560
|
1.341
|
NM_001198541
|
ERAP1
|
endoplasmic reticulum aminopeptidase 1
|
|
chr12_-_55293131
|
1.340
|
|
BAZ2A
|
bromodomain adjacent to zinc finger domain, 2A
|
|
chr12_-_21649019
|
1.326
|
NM_021957
|
GYS2
|
glycogen synthase 2 (liver)
|
|
chr1_-_110735158
|
1.303
|
NM_004696
|
SLC16A4
|
solute carrier family 16, member 4 (monocarboxylic acid transporter 5)
|
|
chr11_-_55815113
|
1.296
|
NM_001005199
|
OR8H1
|
olfactory receptor, family 8, subfamily H, member 1
|
|
chr15_-_100280784
|
1.294
|
NM_001004195
|
OR4F4
OR4F17
|
olfactory receptor, family 4, subfamily F, member 4
olfactory receptor, family 4, subfamily F, member 17
|
|
chr16_+_24475129
|
1.294
|
|
RBBP6
|
retinoblastoma binding protein 6
|
|
chr6_+_52637116
|
1.288
|
|
LOC730101
|
hypothetical LOC730101
|
|
chr6_+_26548678
|
1.277
|
NM_006994
NM_197974
|
BTN3A3
|
butyrophilin, subfamily 3, member A3
|
|
chr5_+_140568451
|
1.277
|
NM_018932
|
PCDHB12
|
protocadherin beta 12
|
|
chr9_+_124355211
|
1.239
|
NM_001004457
|
OR1N2
|
olfactory receptor, family 1, subfamily N, member 2
|
|
chr5_-_137502975
|
1.231
|
NM_003551
|
NME5
|
non-metastatic cells 5, protein expressed in (nucleoside-diphosphate kinase)
|
|
chr15_+_64661560
|
1.212
|
|
|
|
|
chrX_-_11194015
|
1.194
|
NM_013423
|
ARHGAP6
|
Rho GTPase activating protein 6
|
|
chr20_-_55368284
|
1.189
|
NM_001190472
|
MTRNR2L3
|
MT-RNR2-like 3
|
|
chr1_-_246912227
|
1.175
|
NM_001004734
|
OR14I1
|
olfactory receptor, family 14, subfamily I, member 1
|
|
chr6_+_154373323
|
1.175
|
NM_001145279
NM_001145280
NM_001145281
|
OPRM1
|
opioid receptor, mu 1
|
|
chr6_+_142510034
|
1.153
|
|
VTA1
|
Vps20-associated 1 homolog (S. cerevisiae)
|
|
chr17_-_35911340
|
1.151
|
NM_032865
|
TNS4
|
tensin 4
|
|
chr9_+_5646582
|
1.150
|
NM_020829
|
KIAA1432
|
KIAA1432
|
|
chr2_-_135498716
|
1.106
|
NM_001018046
NM_025052
|
YSK4
|
YSK4 Sps1/Ste20-related kinase homolog (S. cerevisiae)
|
|
chr12_+_21059896
|
1.051
|
NM_001009562
|
LST-3TM12
|
organic anion transporter LST-3b
|
|
chr1_+_200698493
|
1.049
|
NM_032103
NM_032104
|
PPP1R12B
|
protein phosphatase 1, regulatory (inhibitor) subunit 12B
|
|
chr20_+_15125503
|
1.025
|
NM_001033087
|
MACROD2
|
MACRO domain containing 2
|
|
chr1_-_148854503
|
1.000
|
|
|
|
|
chr11_+_12917369
|
0.988
|
|
TEAD1
|
TEA domain family member 1 (SV40 transcriptional enhancer factor)
|
|
chr16_+_52037186
|
0.956
|
|
RBL2
|
retinoblastoma-like 2 (p130)
|
|
chr7_+_142053693
|
0.947
|
NM_001190487
|
MTRNR2L6
|
MT-RNR2-like 6
|
|
chr3_-_194579207
|
0.942
|
NM_198505
|
ATP13A5
|
ATPase type 13A5
|
|
chr19_+_53189719
|
0.942
|
NM_022142
|
ELSPBP1
|
epididymal sperm binding protein 1
|
|
chr11_-_10487212
|
0.939
|
NM_001190702
|
MTRNR2L8
|
MT-RNR2-like 8
|
|
chr3_-_57301749
|
0.934
|
NM_001142733
|
ASB14
|
ankyrin repeat and SOCS box containing 14
|
|
chrX_+_14457340
|
0.924
|
NM_001118885
NM_001118886
NM_001171942
NM_002063
|
GLRA2
|
glycine receptor, alpha 2
|
|
chr5_+_132460779
|
0.923
|
|
HSPA4
|
heat shock 70kDa protein 4
|
|
chr6_+_29732736
|
0.911
|
NM_001008228
NM_001008229
NM_001170418
NM_002433
NM_206809
NM_206810
NM_206811
NM_206812
NM_206814
|
MOG
|
myelin oligodendrocyte glycoprotein
|
|
chr10_+_90474280
|
0.908
|
NM_001080518
|
LIPK
|
lipase, family member K
|
|
chr4_-_72868598
|
0.900
|
NM_000583
|
GC
|
group-specific component (vitamin D binding protein)
|
|
chr6_-_41276901
|
0.896
|
NM_024807
|
TREML2
|
triggering receptor expressed on myeloid cells-like 2
|
|
chr2_-_39310176
|
0.896
|
NM_001009565
|
CDKL4
|
cyclin-dependent kinase-like 4
|
|
chr4_-_70115037
|
0.887
|
NM_001073
|
UGT2B11
|
UDP glucuronosyltransferase 2 family, polypeptide B11
|
|
chr12_-_49708279
|
0.879
|
NM_001174125
|
SLC11A2
|
solute carrier family 11 (proton-coupled divalent metal ion transporters), member 2
|
|
chr12_-_9804682
|
0.874
|
NM_001781
|
CD69
|
CD69 molecule
|
|
chr3_+_133798770
|
0.873
|
NM_016557
|
CCRL1
|
chemokine (C-C motif) receptor-like 1
|
|
chr3_-_58175437
|
0.869
|
NM_004944
|
DNASE1L3
|
deoxyribonuclease I-like 3
|
|
chr6_+_64289585
|
0.868
|
|
PTP4A1
|
protein tyrosine phosphatase type IVA, member 1
|
|
chr5_+_72504778
|
0.861
|
NM_153217
|
TMEM174
|
transmembrane protein 174
|
|
chr6_-_116488458
|
0.858
|
NM_002031
|
FRK
|
fyn-related kinase
|
|
chr6_-_50025115
|
0.850
|
NM_001166478
|
DEFB133
|
defensin, beta 133
|
|
chr1_-_156078115
|
0.840
|
NM_005894
|
CD5L
|
CD5 molecule-like
|
|
chr3_+_85858321
|
0.836
|
NM_153184
|
CADM2
|
cell adhesion molecule 2
|
|
chr15_+_71953020
|
0.829
|
NM_153356
|
TBC1D21
|
TBC1 domain family, member 21
|
|
chr5_+_161045235
|
0.826
|
NM_000811
|
GABRA6
|
gamma-aminobutyric acid (GABA) A receptor, alpha 6
|
|
chr5_+_175241449
|
0.822
|
|
CPLX2
|
complexin 2
|
|
chr6_+_123142559
|
0.815
|
|
FABP7
|
fatty acid binding protein 7, brain
|
|
chr11_-_47467094
|
0.811
|
NM_001025596
NM_001172640
|
CELF1
|
CUGBP, Elav-like family member 1
|
|
chr9_+_676640
|
0.811
|
|
|
|
|
chr3_-_46224791
|
0.807
|
NM_001295
|
CCR1
|
chemokine (C-C motif) receptor 1
|
|
chr4_-_40212670
|
0.805
|
NM_019027
|
RBM47
|
RNA binding motif protein 47
|
|
chr4_-_89963177
|
0.804
|
NM_001015045
|
FAM13A
|
family with sequence similarity 13, member A
|
|
chr1_+_19807168
|
0.800
|
|
|
|
|
chr1_-_111908085
|
0.798
|
NM_001081976
|
ADORA3
|
adenosine A3 receptor
|
|
chr2_+_165858586
|
0.793
|
NM_021007
|
SCN2A
|
sodium channel, voltage-gated, type II, alpha subunit
|
|
chrX_-_65752570
|
0.793
|
NM_021783
|
EDA2R
|
ectodysplasin A2 receptor
|
|
chr9_+_112470871
|
0.793
|
NM_001166280
NM_001166281
NM_005592
|
MUSK
|
muscle, skeletal, receptor tyrosine kinase
|
|
chr8_-_81155564
|
0.786
|
NM_001025252
|
TPD52
|
tumor protein D52
|
|
chr18_+_53865455
|
0.782
|
NM_001144964
|
NEDD4L
|
neural precursor cell expressed, developmentally down-regulated 4-like
|
|
chr6_-_29081015
|
0.780
|
NM_001010877
|
ZNF311
|
zinc finger protein 311
|
|
chrX_-_131375217
|
0.778
|
NM_001170701
NM_001170702
NM_001170703
|
MBNL3
|
muscleblind-like 3 (Drosophila)
|
|
chr5_-_79982584
|
0.762
|
NM_001190470
|
MTRNR2L2
|
MT-RNR2-like 2
|
|
chr12_+_49634048
|
0.762
|
NM_001109619
|
HIGD1C
|
HIG1 hypoxia inducible domain family, member 1C
|
|
chr10_+_18669619
|
0.747
|
NM_201590
|
CACNB2
|
calcium channel, voltage-dependent, beta 2 subunit
|
|
chrX_+_135558001
|
0.746
|
NM_000074
|
CD40LG
|
CD40 ligand
|
|
chr11_+_22646229
|
0.743
|
NM_177553
|
GAS2
|
growth arrest-specific 2
|
|
chr5_-_158567411
|
0.737
|
NM_144726
|
RNF145
|
ring finger protein 145
|
|
chr7_-_93027057
|
0.736
|
NM_001164738
|
CALCR
|
calcitonin receptor
|
|
chrX_+_154880439
|
0.734
|
NM_002186
|
IL9R
|
interleukin 9 receptor
|
|
chr8_-_110411283
|
0.730
|
NM_001128211
|
NUDCD1
|
NudC domain containing 1
|
|
chr7_-_87180499
|
0.728
|
NM_000927
|
ABCB1
|
ATP-binding cassette, sub-family B (MDR/TAP), member 1
|
|
chr19_+_61624
|
0.717
|
NM_001005240
|
OR4F4
OR4F17
|
olfactory receptor, family 4, subfamily F, member 4
olfactory receptor, family 4, subfamily F, member 17
|
|
chr1_+_110795271
|
0.716
|
NM_032414
|
PROK1
|
prokineticin 1
|
|
chr4_-_69218909
|
0.716
|
NM_001076
|
UGT2B15
|
UDP glucuronosyltransferase 2 family, polypeptide B15
|
|
chr10_-_116241572
|
0.715
|
|
|
|
|
chrX_+_15435351
|
0.712
|
NM_001721
|
BMX
|
BMX non-receptor tyrosine kinase
|
|
chr13_+_20081940
|
0.710
|
|
|
|
|
chr6_+_168161401
|
0.698
|
NM_005355
NM_030615
|
KIF25
|
kinesin family member 25
|
|
chr11_+_64950074
|
0.691
|
|
NEAT1
|
nuclear paraspeckle assembly transcript 1 (non-protein coding)
|
|
chr11_-_56267862
|
0.688
|
NM_001005284
|
OR9G4
|
olfactory receptor, family 9, subfamily G, member 4
|
|
chr12_+_79362256
|
0.678
|
NM_001145026
|
PTPRQ
|
protein tyrosine phosphatase, receptor type, Q
|
|
chr10_-_48426868
|
0.677
|
NM_001042357
NM_001042389
|
PTPN20B
PTPN20A
|
protein tyrosine phosphatase, non-receptor type 20B
protein tyrosine phosphatase, non-receptor type 20A
|
|
chr15_-_49184764
|
0.670
|
NM_207381
|
TNFAIP8L3
|
tumor necrosis factor, alpha-induced protein 8-like 3
|
|
chr11_-_55460451
|
0.666
|
NM_006637
|
OR5I1
|
olfactory receptor, family 5, subfamily I, member 1
|
|
chr3_+_63859114
|
0.662
|
NM_001177387
|
ATXN7
|
ataxin 7
|
|
chr11_+_125208420
|
0.662
|
NM_001144874
|
PATE4
|
prostate and testis expressed 4
|
|
chr9_+_83733162
|
0.657
|
NM_001145197
|
FAM75D4
|
family with sequence similarity 75, member D4
|
|
chr8_+_42671718
|
0.653
|
NM_000749
|
CHRNB3
|
cholinergic receptor, nicotinic, beta 3
|
|
chrX_+_101388810
|
0.649
|
NM_022053
|
NXF2
|
nuclear RNA export factor 2
|
|
chrX_-_55225668
|
0.643
|
NM_001190708
|
MTRNR2L10
|
MT-RNR2-like 10
|
|
chr11_-_119499188
|
0.634
|
|
TRIM29
|
tripartite motif containing 29
|
|
chr7_-_111216180
|
0.633
|
|
DOCK4
|
dedicator of cytokinesis 4
|
|
chrX_-_106129854
|
0.631
|
|
MORC4
|
MORC family CW-type zinc finger 4
|
|
chr22_-_30885200
|
0.629
|
NM_001010859
|
C22orf42
|
chromosome 22 open reading frame 42
|
|
chr12_+_46799279
|
0.626
|
NM_000289
|
PFKM
|
phosphofructokinase, muscle
|
|
chr10_-_64698831
|
0.625
|
NM_004241
|
JMJD1C
|
jumonji domain containing 1C
|
|
chr1_-_196776697
|
0.625
|
NM_133262
NM_133326
|
ATP6V1G3
|
ATPase, H+ transporting, lysosomal 13kDa, V1 subunit G3
|
|
chr5_+_175444454
|
0.622
|
NM_001079529
|
FAM153B
|
family with sequence similarity 153, member B
|
|
chr12_-_10042956
|
0.617
|
NM_001099431
NM_016509
|
CLEC1B
|
C-type lectin domain family 1, member B
|
|
chr4_+_123311207
|
0.617
|
NM_015312
|
KIAA1109
|
KIAA1109
|
|
chr13_+_96592051
|
0.611
|
|
MBNL2
|
muscleblind-like 2 (Drosophila)
|
|
chr2_+_211166323
|
0.609
|
NM_001122634
|
CPS1
|
carbamoyl-phosphate synthase 1, mitochondrial
|
|
chr19_-_41083288
|
0.608
|
NM_139239
|
NFKBID
|
nuclear factor of kappa light polypeptide gene enhancer in B-cells inhibitor, delta
|
|
chrX_+_37777730
|
0.607
|
NM_001163334
|
SYTL5
|
synaptotagmin-like 5
|
|
chr11_+_61005160
|
0.606
|
NM_001170753
NM_145017
|
C11orf66
|
chromosome 11 open reading frame 66
|
|
chr8_-_143958234
|
0.606
|
NM_000497
NM_001026213
|
CYP11B1
|
cytochrome P450, family 11, subfamily B, polypeptide 1
|
|
chr16_-_30254189
|
0.604
|
|
LOC595101
|
PI-3-kinase-related kinase SMG-1 pseudogene
|
|
chr7_+_139750311
|
0.603
|
NM_001008749
|
RAB19
|
RAB19, member RAS oncogene family
|
|
chr19_-_40673185
|
0.597
|
NM_207392
|
KRTDAP
|
keratinocyte differentiation-associated protein
|
|
chr5_+_140583098
|
0.597
|
NM_018934
|
PCDHB14
|
protocadherin beta 14
|
|
chr19_-_52427698
|
0.594
|
NM_001127240
NM_001127241
NM_001127242
|
BBC3
|
BCL2 binding component 3
|
|
chr11_+_59564323
|
0.594
|
NM_173801
|
PLAC1L
|
placenta-specific 1-like
|
|
chr6_-_150109324
|
0.589
|
NM_198887
|
NUP43
|
nucleoporin 43kDa
|
|
chr11_-_104274606
|
0.588
|
NM_001191016
|
CASP12
|
caspase 12 (gene/pseudogene)
|
|
chr9_-_111253484
|
0.586
|
NM_001145369
NM_001145370
|
PTPN3
|
protein tyrosine phosphatase, non-receptor type 3
|
|
chr5_-_160044844
|
0.584
|
|
ATP10B
|
ATPase, class V, type 10B
|
|
chr3_-_153541468
|
0.579
|
NM_001123228
|
TMEM14E
|
transmembrane protein 14E
|
|
chr3_-_45858566
|
0.577
|
NM_020347
|
LZTFL1
|
leucine zipper transcription factor-like 1
|
|
chr4_+_71235259
|
0.577
|
NM_033122
|
CABS1
|
calcium-binding protein, spermatid-specific 1
|
|
chr19_-_56825400
|
0.577
|
NM_003830
|
SIGLEC5
|
sialic acid binding Ig-like lectin 5
|
|
chr6_+_46822657
|
0.574
|
NM_001162435
|
LOC100287718
|
ankyrin repeat domain containing gene
|
|
chr4_-_186537145
|
0.571
|
NM_018409
|
LRP2BP
|
LRP2 binding protein
|
|
chr1_+_28134090
|
0.569
|
NM_001009568
NM_014474
|
SMPDL3B
|
sphingomyelin phosphodiesterase, acid-like 3B
|
|
chr21_+_17841297
|
0.561
|
|
CXADR
|
coxsackie virus and adenovirus receptor
|
|
chr5_-_131907071
|
0.555
|
NM_000879
|
IL5
|
interleukin 5 (colony-stimulating factor, eosinophil)
|
|
chr5_-_134290789
|
0.555
|
|
|
|
|
chr4_+_77214886
|
0.555
|
NM_001130016
NM_001179
|
ART3
|
ADP-ribosyltransferase 3
|
|
chr22_-_37214480
|
0.554
|
NM_001098505
NM_030881
|
DDX17
|
DEAD (Asp-Glu-Ala-Asp) box polypeptide 17
|
|
chr13_-_43101608
|
0.554
|
NM_001127615
|
ENOX1
|
ecto-NOX disulfide-thiol exchanger 1
|
|
chr17_-_64462976
|
0.551
|
NM_007168
|
ABCA8
|
ATP-binding cassette, sub-family A (ABC1), member 8
|
|
chr4_-_77163609
|
0.550
|
NM_001565
|
CXCL10
|
chemokine (C-X-C motif) ligand 10
|
|
chr6_+_44418374
|
0.549
|
NM_145026
|
SPATS1
|
spermatogenesis associated, serine-rich 1
|
|
chr21_-_31041390
|
0.548
|
NM_181617
|
KRTAP21-2
|
keratin associated protein 21-2
|
|
chr3_-_120861959
|
0.547
|
NM_022135
|
POPDC2
|
popeye domain containing 2
|
|
chrX_+_150653873
|
0.546
|
NM_005140
|
CNGA2
|
cyclic nucleotide gated channel alpha 2
|
|
chr1_-_245942679
|
0.544
|
NM_001005286
|
OR6F1
|
olfactory receptor, family 6, subfamily F, member 1
|
|
chr3_-_27473248
|
0.541
|
NM_003615
|
SLC4A7
|
solute carrier family 4, sodium bicarbonate cotransporter, member 7
|
|
chr1_-_178100204
|
0.538
|
|
|
|
|
chr2_+_138438277
|
0.533
|
NM_001024074
NM_001024075
NM_006895
|
HNMT
|
histamine N-methyltransferase
|
|
chr8_-_110724594
|
0.528
|
NM_001099756
|
SYBU
|
syntabulin (syntaxin-interacting)
|
|
chr3_+_42825957
|
0.528
|
NM_001296
|
CCBP2
|
chemokine binding protein 2
|
|
chr17_+_21946563
|
0.527
|
NM_001190452
|
MTRNR2L1
|
MT-RNR2-like 1
|
|
chrX_+_129301493
|
0.527
|
NM_003951
NM_022810
|
SLC25A14
|
solute carrier family 25 (mitochondrial carrier, brain), member 14
|
|
chr12_-_14024187
|
0.525
|
NM_000834
|
GRIN2B
|
glutamate receptor, ionotropic, N-methyl D-aspartate 2B
|
|
chrX_-_114158388
|
0.523
|
NM_000640
|
IL13RA2
|
interleukin 13 receptor, alpha 2
|
|
chr19_-_48401532
|
0.523
|
NM_002780
NM_213633
|
PSG4
|
pregnancy specific beta-1-glycoprotein 4
|
|
chr12_-_9976173
|
0.520
|
NM_001130711
|
CLEC2A
|
C-type lectin domain family 2, member A
|
|
chr8_+_134272463
|
0.518
|
NM_003882
NM_080838
|
WISP1
|
WNT1 inducible signaling pathway protein 1
|
|
chr1_+_181028016
|
0.517
|
NM_030769
|
NPL
|
N-acetylneuraminate pyruvate lyase (dihydrodipicolinate synthase)
|
|
chr2_+_201755865
|
0.514
|
NM_001230
NM_032974
NM_032977
|
CASP10
|
caspase 10, apoptosis-related cysteine peptidase
|
|
chr3_+_23904086
|
0.505
|
|
UBE2E1
|
ubiquitin-conjugating enzyme E2E 1 (UBC4/5 homolog, yeast)
|
|
chr12_-_14858358
|
0.505
|
NM_001013698
|
C12orf69
|
chromosome 12 open reading frame 69
|
|
chr14_+_98247702
|
0.504
|
NM_182560
|
C14orf177
|
chromosome 14 open reading frame 177
|
|
chr2_-_113526910
|
0.502
|
NM_014438
NM_173178
|
IL1F8
|
interleukin 1 family, member 8 (eta)
|
|
chr1_+_151147646
|
0.502
|
NM_005547
|
IVL
|
involucrin
|
|
chr5_-_39400319
|
0.501
|
NM_001737
|
C9
|
complement component 9
|
|
chr2_+_170259195
|
0.496
|
NM_144711
NM_001008489
|
PHOSPHO2-KLHL23
KLHL23
PHOSPHO2
|
PHOSPHO2-KLHL23 read-through transcript
kelch-like 23 (Drosophila)
phosphatase, orphan 2
|
|
chr6_-_56515640
|
0.496
|
|
|
|
|
chr2_+_206847658
|
0.494
|
NM_020923
|
ZDBF2
|
zinc finger, DBF-type containing 2
|
|
chr1_+_152229861
|
0.493
|
NM_001030
|
RPS27
|
ribosomal protein S27
|
|
chr2_-_229844198
|
0.491
|
NM_001100818
NM_017933
|
PID1
|
phosphotyrosine interaction domain containing 1
|
|
chr10_-_98315090
|
0.490
|
|
TM9SF3
|
transmembrane 9 superfamily member 3
|
|
chr2_-_21106291
|
0.490
|
|
APOB
|
apolipoprotein B (including Ag(x) antigen)
|
|
chr6_-_22410993
|
0.489
|
NM_001163558
|
PRL
|
prolactin
|
|
chr4_+_189297591
|
0.487
|
NM_178556
|
TRIML1
|
tripartite motif family-like 1
|
|
chr4_+_71418886
|
0.487
|
NM_212557
|
AMTN
|
amelotin
|
|
chr6_+_37030186
|
0.484
|
NM_153370
|
PI16
|
peptidase inhibitor 16
|
|
chr1_+_239762179
|
0.483
|
NM_003679
|
KMO
|
kynurenine 3-monooxygenase (kynurenine 3-hydroxylase)
|
|
chr3_+_40522533
|
0.483
|
NM_175888
|
ZNF620
|
zinc finger protein 620
|
|
chr12_-_15757114
|
0.482
|
|
EPS8
|
epidermal growth factor receptor pathway substrate 8
|
|
chr6_-_32482877
|
0.482
|
NM_019602
|
BTNL2
|
butyrophilin-like 2 (MHC class II associated)
|
|
chr12_+_54796640
|
0.478
|
NM_001035267
NM_021104
|
RPL41
|
ribosomal protein L41
|
|
chr5_-_36337756
|
0.478
|
NM_001161429
NM_145000
|
RANBP3L
|
RAN binding protein 3-like
|
|
chr19_-_39777329
|
0.478
|
NM_001025591
|
SCGBL
|
secretoglobin-like
|
|
chr2_-_26395420
|
0.477
|
NM_001145168
NM_001145169
|
GPR113
|
G protein-coupled receptor 113
|
|
chr1_+_207668787
|
0.476
|
NM_001104548
|
LOC642587
|
NPC-A-5
|
|
chr3_-_152478843
|
0.476
|
NM_014879
|
P2RY14
|
purinergic receptor P2Y, G-protein coupled, 14
|
|
chr19_+_14982538
|
0.475
|
NM_173482
|
CCDC105
|
coiled-coil domain containing 105
|
|
chr1_-_165112157
|
0.473
|
NM_053053
|
TADA1
|
transcriptional adaptor 1
|
|
chr10_+_35575958
|
0.473
|
NM_181698
|
CCNY
|
cyclin Y
|
|
chr7_+_137411717
|
0.473
|
NM_001190906
NM_001190907
NM_005989
|
AKR1D1
|
aldo-keto reductase family 1, member D1 (delta 4-3-ketosteroid-5-beta-reductase)
|
|
chr21_+_29322100
|
0.471
|
|
USP16
|
ubiquitin specific peptidase 16
|
|
chr20_+_57966865
|
0.471
|
NM_177980
|
CDH26
|
cadherin 26
|
|
chr3_+_98641143
|
0.470
|
NM_173655
|
EPHA6
|
EPH receptor A6
|