|
chr4_-_69218909
|
3.916
|
NM_001076
|
UGT2B15
|
UDP glucuronosyltransferase 2 family, polypeptide B15
|
|
chr6_+_131190237
|
2.564
|
NM_001195597
|
LOC285733
|
hypothetical LOC285733
|
|
chr20_+_54257194
|
2.105
|
NM_019888
|
MC3R
|
melanocortin 3 receptor
|
|
chr20_+_29492071
|
1.757
|
NM_153324
|
DEFB123
|
defensin, beta 123
|
|
chr3_-_150422474
|
1.729
|
NM_000096
|
CP
|
ceruloplasmin (ferroxidase)
|
|
chr7_-_50596238
|
1.702
|
NM_000790
|
DDC
|
dopa decarboxylase (aromatic L-amino acid decarboxylase)
|
|
chr14_-_37134050
|
1.583
|
|
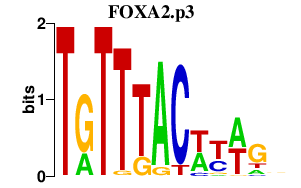
FOXA1
|
forkhead box A1
|
|
chr9_+_135276940
|
1.564
|
NM_139025
NM_139026
NM_139027
|
ADAMTS13
|
ADAM metallopeptidase with thrombospondin type 1 motif, 13
|
|
chr9_+_135277264
|
1.545
|
|
ADAMTS13
|
ADAM metallopeptidase with thrombospondin type 1 motif, 13
|
|
chr3_+_176059763
|
1.430
|
NM_207015
|
NAALADL2
|
N-acetylated alpha-linked acidic dipeptidase-like 2
|
|
chr2_+_11591692
|
1.394
|
NM_014668
|
GREB1
|
growth regulation by estrogen in breast cancer 1
|
|
chr3_-_150569574
|
1.390
|
|
TM4SF1
|
transmembrane 4 L six family member 1
|
|
chr16_-_86527608
|
1.370
|
NM_001739
|
CA5A
|
carbonic anhydrase VA, mitochondrial
|
|
chr17_+_69939130
|
1.284
|
NM_022036
|
GPRC5C
|
G protein-coupled receptor, family C, group 5, member C
|
|
chr14_-_93859394
|
1.278
|
NM_001756
|
SERPINA6
|
serpin peptidase inhibitor, clade A (alpha-1 antiproteinase, antitrypsin), member 6
|
|
chr2_-_20390601
|
1.210
|
NM_015317
|
PUM2
|
pumilio homolog 2 (Drosophila)
|
|
chr17_-_23721430
|
1.195
|
|
VTN
|
vitronectin
|
|
chr4_-_70115037
|
1.192
|
NM_001073
|
UGT2B11
|
UDP glucuronosyltransferase 2 family, polypeptide B11
|
|
chr10_-_21475493
|
1.166
|
NM_001010896
NM_001177483
|
C10orf113
|
chromosome 10 open reading frame 113
|
|
chr19_-_59003770
|
1.133
|
NM_033297
|
NLRP12
|
NLR family, pyrin domain containing 12
|
|
chr1_-_20682541
|
1.131
|
|
|
|
|
chr7_-_158304062
|
1.128
|
|
ESYT2
|
extended synaptotagmin-like protein 2
|
|
chr20_-_49612745
|
1.120
|
|
NFATC2
|
nuclear factor of activated T-cells, cytoplasmic, calcineurin-dependent 2
|
|
chr4_-_152368492
|
1.115
|
|
SH3D19
|
SH3 domain containing 19
|
|
chr17_-_3142625
|
1.100
|
NM_002550
|
OR3A1
|
olfactory receptor, family 3, subfamily A, member 1
|
|
chr5_+_128468785
|
1.096
|
|
ISOC1
|
isochorismatase domain containing 1
|
|
chr8_-_30121741
|
1.083
|
NM_001100916
|
MBOAT4
|
membrane bound O-acyltransferase domain containing 4
|
|
chr2_-_165133239
|
1.075
|
|
GRB14
|
growth factor receptor-bound protein 14
|
|
chr5_+_140583098
|
1.071
|
NM_018934
|
PCDHB14
|
protocadherin beta 14
|
|
chr4_+_70896236
|
1.063
|
NM_001009181
NM_003154
|
STATH
|
statherin
|
|
chr2_+_214984705
|
1.055
|
NM_001080500
|
VWC2L
|
von Willebrand factor C domain containing protein 2-like
|
|
chr3_-_191650291
|
1.020
|
NM_207316
|
TMEM207
|
transmembrane protein 207
|
|
chr5_+_173405343
|
1.009
|
|
HMP19
|
HMP19 protein
|
|
chr5_+_173405298
|
1.006
|
NM_015980
|
HMP19
|
HMP19 protein
|
|
chr3_+_173043832
|
0.993
|
NM_001164436
|
TMEM212
|
transmembrane protein 212
|
|
chr2_-_233586145
|
0.990
|
|
NGEF
|
neuronal guanine nucleotide exchange factor
|
|
chrX_-_55037235
|
0.985
|
NM_002625
|
PFKFB1
|
6-phosphofructo-2-kinase/fructose-2,6-biphosphatase 1
|
|
chr1_+_26376611
|
0.973
|
|
CNKSR1
|
connector enhancer of kinase suppressor of Ras 1
|
|
chr10_+_102722275
|
0.957
|
NM_017893
|
SEMA4G
|
sema domain, immunoglobulin domain (Ig), transmembrane domain (TM) and short cytoplasmic domain, (semaphorin) 4G
|
|
chr20_+_31334601
|
0.950
|
NM_033197
|
C20orf114
|
chromosome 20 open reading frame 114
|
|
chr20_-_52120421
|
0.929
|
|
BCAS1
|
breast carcinoma amplified sequence 1
|
|
chr4_+_187385618
|
0.917
|
NM_000892
|
KLKB1
|
kallikrein B, plasma (Fletcher factor) 1
|
|
chr18_+_30589937
|
0.912
|
NM_001390
NM_001391
|
DTNA
|
dystrobrevin, alpha
|
|
chr11_+_125258718
|
0.909
|
NM_145014
|
HYLS1
|
hydrolethalus syndrome 1
|
|
chr20_+_31219543
|
0.906
|
NM_080574
|
C20orf70
|
chromosome 20 open reading frame 70
|
|
chr2_-_32344192
|
0.903
|
NM_021209
|
NLRC4
|
NLR family, CARD domain containing 4
|
|
chr17_-_23721420
|
0.894
|
|
VTN
|
vitronectin
|
|
chr5_+_140227951
|
0.888
|
NM_018902
NM_031861
|
PCDHA11
|
protocadherin alpha 11
|
|
chr2_-_233586164
|
0.886
|
NM_019850
|
NGEF
|
neuronal guanine nucleotide exchange factor
|
|
chr11_+_55319607
|
0.886
|
NM_001004735
|
OR5D14
|
olfactory receptor, family 5, subfamily D, member 14
|
|
chr3_-_121065112
|
0.878
|
|
|
|
|
chr20_+_31287462
|
0.877
|
NM_016583
NM_130852
|
PLUNC
|
palate, lung and nasal epithelium associated
|
|
chr17_-_23721351
|
0.870
|
|
VTN
|
vitronectin
|
|
chr20_-_49612574
|
0.866
|
NM_001136021
|
NFATC2
|
nuclear factor of activated T-cells, cytoplasmic, calcineurin-dependent 2
|
|
chr3_-_194579207
|
0.856
|
NM_198505
|
ATP13A5
|
ATPase type 13A5
|
|
chr2_-_169596078
|
0.854
|
NM_003742
|
ABCB11
|
ATP-binding cassette, sub-family B (MDR/TAP), member 11
|
|
chr17_-_23721468
|
0.852
|
|
VTN
|
vitronectin
|
|
chr17_-_31332568
|
0.843
|
NM_004590
|
CCL16
|
chemokine (C-C motif) ligand 16
|
|
chrX_-_131375217
|
0.839
|
NM_001170701
NM_001170702
NM_001170703
|
MBNL3
|
muscleblind-like 3 (Drosophila)
|
|
chr12_-_51629874
|
0.830
|
|
KRT8
|
keratin 8
|
|
chrX_+_49718954
|
0.826
|
NM_000084
|
CLCN5
|
chloride channel 5
|
|
chr17_-_23721485
|
0.812
|
NM_000638
|
VTN
|
vitronectin
|
|
chr1_+_34997928
|
0.808
|
NM_153212
|
GJB4
|
gap junction protein, beta 4, 30.3kDa
|
|
chr3_+_152970904
|
0.806
|
|
LOC201651
|
arylacetamide deacetylase (esterase) pseudogene
|
|
chr17_+_64922420
|
0.806
|
NM_002758
|
MAP2K6
|
mitogen-activated protein kinase kinase 6
|
|
chr11_-_121492010
|
0.804
|
NM_001001786
|
BLID
|
BH3-like motif containing, cell death inducer
|
|
chr10_-_49152918
|
0.804
|
NM_001018071
|
FRMPD2
|
FERM and PDZ domain containing 2
|
|
chr14_+_104337923
|
0.785
|
NM_001137601
|
ZBTB42
|
zinc finger and BTB domain containing 42
|
|
chr11_+_124294355
|
0.782
|
NM_001037558
|
HEPN1
|
hepatocellular carcinoma, down-regulated 1
|
|
chr6_+_26548678
|
0.769
|
NM_006994
NM_197974
|
BTN3A3
|
butyrophilin, subfamily 3, member A3
|
|
chr6_+_55147029
|
0.765
|
NM_001526
|
HCRTR2
|
hypocretin (orexin) receptor 2
|
|
chr17_-_46296376
|
0.765
|
NM_005749
|
TOB1
|
transducer of ERBB2, 1
|
|
chr7_+_143402207
|
0.763
|
NM_001004488
|
OR2A25
|
olfactory receptor, family 2, subfamily A, member 25
|
|
chr22_+_19458378
|
0.763
|
NM_000185
|
SERPIND1
|
serpin peptidase inhibitor, clade D (heparin cofactor), member 1
|
|
chr15_+_64661560
|
0.758
|
|
|
|
|
chr14_-_106282128
|
0.749
|
|
IGHG1
|
immunoglobulin heavy constant gamma 1 (G1m marker)
|
|
chr5_+_132237253
|
0.732
|
NM_052971
|
LEAP2
|
liver expressed antimicrobial peptide 2
|
|
chr12_-_119249938
|
0.732
|
NM_000928
|
PLA2G1B
|
phospholipase A2, group IB (pancreas)
|
|
chr3_+_70131572
|
0.724
|
|
|
|
|
chr14_-_105542441
|
0.724
|
|
IGLJ3
IGHA1
IGHG1
IGHM
|
immunoglobulin lambda joining 3
immunoglobulin heavy constant alpha 1
immunoglobulin heavy constant gamma 1 (G1m marker)
immunoglobulin heavy constant mu
|
|
chr5_+_140460240
|
0.709
|
NM_018937
|
PCDHB3
|
protocadherin beta 3
|
|
chr7_+_116238309
|
0.704
|
|
CAPZA2
|
capping protein (actin filament) muscle Z-line, alpha 2
|
|
chr2_+_38009405
|
0.703
|
NM_001170792
|
FAM82A1
|
family with sequence similarity 82, member A1
|
|
chr7_+_94953148
|
0.703
|
NM_016116
NM_145872
|
ASB4
|
ankyrin repeat and SOCS box containing 4
|
|
chr2_-_172458970
|
0.703
|
NM_003705
|
SLC25A12
|
solute carrier family 25 (mitochondrial carrier, Aralar), member 12
|
|
chr14_+_22136968
|
0.699
|
NM_022060
|
ABHD4
|
abhydrolase domain containing 4
|
|
chr4_+_70180805
|
0.697
|
NM_053039
|
UGT2B28
|
UDP glucuronosyltransferase 2 family, polypeptide B28
|
|
chr15_-_23204887
|
0.694
|
NM_000462
|
UBE3A
|
ubiquitin protein ligase E3A
|
|
chr17_+_7732759
|
0.694
|
NM_001005273
NM_005852
|
CHD3
|
chromodomain helicase DNA binding protein 3
|
|
chr6_+_154449334
|
0.689
|
NM_001145287
|
OPRM1
|
opioid receptor, mu 1
|
|
chr7_+_28305464
|
0.686
|
NM_182899
|
CREB5
|
cAMP responsive element binding protein 5
|
|
chr1_-_150070849
|
0.678
|
NM_005060
|
RORC
|
RAR-related orphan receptor C
|
|
chr5_-_13997588
|
0.675
|
NM_001369
|
DNAH5
|
dynein, axonemal, heavy chain 5
|
|
chr2_+_71016503
|
0.674
|
NM_001692
|
ATP6V1B1
|
ATPase, H+ transporting, lysosomal 56/58kDa, V1 subunit B1
|
|
chr1_-_176205672
|
0.670
|
NM_033127
|
SEC16B
|
SEC16 homolog B (S. cerevisiae)
|
|
chr6_+_112481970
|
0.668
|
NM_003880
NM_198239
|
WISP3
|
WNT1 inducible signaling pathway protein 3
|
|
chr14_+_38772870
|
0.667
|
NM_054024
|
MIA2
|
melanoma inhibitory activity 2
|
|
chr18_+_28023984
|
0.659
|
NM_005925
|
MEP1B
|
meprin A, beta
|
|
chr14_+_87560646
|
0.655
|
|
LOC283587
|
hypothetical protein LOC283587
|
|
chr2_+_241776596
|
0.651
|
NM_001001666
NM_001001891
|
ANO7
|
anoctamin 7
|
|
chr20_-_14266200
|
0.647
|
NM_013281
NM_198391
|
FLRT3
|
fibronectin leucine rich transmembrane protein 3
|
|
chr2_-_39201631
|
0.647
|
|
SOS1
|
son of sevenless homolog 1 (Drosophila)
|
|
chr6_-_41823056
|
0.639
|
NM_001166424
NM_002630
|
PGC
|
progastricsin (pepsinogen C)
|
|
chr14_-_105589467
|
0.639
|
|
LOC100126583
IGHA1
IGHG1
IGHG2
IGHM
|
hypothetical LOC100126583
immunoglobulin heavy constant alpha 1
immunoglobulin heavy constant gamma 1 (G1m marker)
immunoglobulin heavy constant gamma 2 (G2m marker)
immunoglobulin heavy constant mu
|
|
chr10_+_18729518
|
0.638
|
NM_201570
|
CACNB2
|
calcium channel, voltage-dependent, beta 2 subunit
|
|
chr22_+_33792125
|
0.632
|
NM_001008494
|
ISX
|
intestine-specific homeobox
|
|
chr2_+_113591940
|
0.615
|
NM_000577
NM_173841
NM_173843
|
IL1RN
|
interleukin 1 receptor antagonist
|
|
chr4_-_69852090
|
0.611
|
NM_024743
|
UGT2A3
|
UDP glucuronosyltransferase 2 family, polypeptide A3
|
|
chr20_+_9406460
|
0.611
|
|
PLCB4
|
phospholipase C, beta 4
|
|
chr3_-_49434874
|
0.609
|
|
AMT
|
aminomethyltransferase
|
|
chr6_+_154373323
|
0.599
|
NM_001145279
NM_001145280
NM_001145281
|
OPRM1
|
opioid receptor, mu 1
|
|
chr6_+_144227265
|
0.599
|
NM_001013623
|
C6orf94
|
chromosome 6 open reading frame 94
|
|
chr5_+_140509803
|
0.595
|
NM_018939
|
PCDHB6
|
protocadherin beta 6
|
|
chr18_+_27425727
|
0.593
|
NM_000371
|
TTR
|
transthyretin
|
|
chr2_-_21081694
|
0.593
|
|
APOB
|
apolipoprotein B (including Ag(x) antigen)
|
|
chr2_-_135498716
|
0.592
|
NM_001018046
NM_025052
|
YSK4
|
YSK4 Sps1/Ste20-related kinase homolog (S. cerevisiae)
|
|
chr19_-_45424403
|
0.582
|
NM_024877
|
CNTD2
|
cyclin N-terminal domain containing 2
|
|
chr12_+_119900931
|
0.581
|
NM_000545
|
HNF1A
|
HNF1 homeobox A
|
|
chr4_-_70861301
|
0.579
|
NM_001891
|
CSN2
|
casein beta
|
|
chr12_-_10464308
|
0.577
|
NM_002261
NM_007333
|
KLRC3
|
killer cell lectin-like receptor subfamily C, member 3
|
|
chr6_+_31698447
|
0.574
|
|
|
|
|
chr12_-_18134319
|
0.572
|
NM_024730
|
RERGL
|
RERG/RAS-like
|
|
chr11_+_3622933
|
0.572
|
NM_004314
|
ART1
|
ADP-ribosyltransferase 1
|
|
chr6_-_47030492
|
0.570
|
NM_015234
|
GPR116
|
G protein-coupled receptor 116
|
|
chr2_+_170149348
|
0.565
|
|
PPIG
|
peptidylprolyl isomerase G (cyclophilin G)
|
|
chr6_-_31953425
|
0.563
|
NM_001178045
|
SLC44A4
|
solute carrier family 44, member 4
|
|
chr3_+_52786642
|
0.560
|
NM_002215
|
ITIH1
|
inter-alpha (globulin) inhibitor H1
|
|
chr7_+_129693938
|
0.559
|
NM_001869
|
CPA2
|
carboxypeptidase A2 (pancreatic)
|
|
chr11_+_22646229
|
0.549
|
NM_177553
|
GAS2
|
growth arrest-specific 2
|
|
chrX_-_15198093
|
0.547
|
NM_001031739
NM_001168530
NM_024087
|
ASB9
|
ankyrin repeat and SOCS box containing 9
|
|
chr11_-_104332631
|
0.544
|
NM_033306
|
CASP4
|
caspase 4, apoptosis-related cysteine peptidase
|
|
chr3_-_25658829
|
0.537
|
|
TOP2B
|
topoisomerase (DNA) II beta 180kDa
|
|
chr1_-_150079656
|
0.536
|
NM_001136003
|
C2CD4D
|
C2 calcium-dependent domain containing 4D
|
|
chr6_-_76838944
|
0.534
|
NM_001563
|
IMPG1
|
interphotoreceptor matrix proteoglycan 1
|
|
chr11_-_104411065
|
0.532
|
NM_001223
NM_033292
NM_033293
NM_033294
NM_033295
|
CASP1
|
caspase 1, apoptosis-related cysteine peptidase (interleukin 1, beta, convertase)
|
|
chr21_-_42608531
|
0.530
|
|
TFF3
|
trefoil factor 3 (intestinal)
|
|
chr5_-_135729062
|
0.528
|
NM_001167576
NM_001167577
NM_020389
|
TRPC7
|
transient receptor potential cation channel, subfamily C, member 7
|
|
chr20_-_52120710
|
0.525
|
NM_003657
|
BCAS1
|
breast carcinoma amplified sequence 1
|
|
chr12_-_6356783
|
0.522
|
NM_001159575
|
SCNN1A
|
sodium channel, nonvoltage-gated 1 alpha
|
|
chr1_-_57204208
|
0.514
|
NM_000066
|
C8B
|
complement component 8, beta polypeptide
|
|
chr19_-_63715135
|
0.508
|
NM_012254
|
SLC27A5
|
solute carrier family 27 (fatty acid transporter), member 5
|
|
chr2_+_170149092
|
0.506
|
NM_004792
|
PPIG
|
peptidylprolyl isomerase G (cyclophilin G)
|
|
chr14_-_57133361
|
0.505
|
NM_001080455
|
SLC35F4
|
solute carrier family 35, member F4
|
|
chr1_-_167822334
|
0.502
|
NM_000130
|
F5
|
coagulation factor V (proaccelerin, labile factor)
|
|
chr6_+_127940011
|
0.502
|
NM_001010905
|
C6orf58
|
chromosome 6 open reading frame 58
|
|
chr6_-_155818728
|
0.498
|
NM_015718
|
NOX3
|
NADPH oxidase 3
|
|
chr3_-_71376919
|
0.494
|
|
FOXP1
|
forkhead box P1
|
|
chr20_-_31055892
|
0.491
|
NM_080675
|
SUN5
|
Sad1 and UNC84 domain containing 5
|
|
chr1_+_153232685
|
0.486
|
NM_018655
|
LENEP
|
lens epithelial protein
|
|
chr10_+_101532544
|
0.486
|
|
ABCC2
|
ATP-binding cassette, sub-family C (CFTR/MRP), member 2
|
|
chr1_-_167822248
|
0.485
|
|
F5
|
coagulation factor V (proaccelerin, labile factor)
|
|
chr12_+_32578513
|
0.484
|
|
FGD4
|
FYVE, RhoGEF and PH domain containing 4
|
|
chr3_+_99334230
|
0.480
|
NM_001005338
|
OR5H1
|
olfactory receptor, family 5, subfamily H, member 1
|
|
chr18_+_50409387
|
0.479
|
NM_173629
|
C18orf26
|
chromosome 18 open reading frame 26
|
|
chr5_-_36337756
|
0.477
|
NM_001161429
NM_145000
|
RANBP3L
|
RAN binding protein 3-like
|
|
chr17_+_38259620
|
0.477
|
|
AOC3
|
amine oxidase, copper containing 3 (vascular adhesion protein 1)
|
|
chr11_+_55842358
|
0.474
|
NM_001005202
|
OR8K3
|
olfactory receptor, family 8, subfamily K, member 3
|
|
chr6_+_32003180
|
0.471
|
NM_000063
NM_001145903
|
C2
|
complement component 2
|
|
chr12_-_21379098
|
0.466
|
NM_021094
|
SLCO1A2
|
solute carrier organic anion transporter family, member 1A2
|
|
chr6_+_26359805
|
0.462
|
NM_003524
|
HIST1H2BH
|
histone cluster 1, H2bh
|
|
chr2_+_183316574
|
0.461
|
|
DNAJC10
|
DnaJ (Hsp40) homolog, subfamily C, member 10
|
|
chr12_+_119900677
|
0.460
|
|
HNF1A
|
HNF1 homeobox A
|
|
chr14_-_105644300
|
0.460
|
|
IGHV4-31
IGHA1
IGHA2
IGHG1
IGHG3
IGHM
|
immunoglobulin heavy variable 4-31
immunoglobulin heavy constant alpha 1
immunoglobulin heavy constant alpha 2 (A2m marker)
immunoglobulin heavy constant gamma 1 (G1m marker)
immunoglobulin heavy constant gamma 3 (G3m marker)
immunoglobulin heavy constant mu
|
|
chr4_+_86615275
|
0.460
|
NM_001025616
|
ARHGAP24
|
Rho GTPase activating protein 24
|
|
chr15_-_88578195
|
0.459
|
NM_006384
|
CIB1
|
calcium and integrin binding 1 (calmyrin)
|
|
chr13_+_110653407
|
0.459
|
|
ARHGEF7
|
Rho guanine nucleotide exchange factor (GEF) 7
|
|
chr14_-_106270497
|
0.459
|
|
IGHG3
|
immunoglobulin heavy constant gamma 3 (G3m marker)
|
|
chr15_-_48198697
|
0.457
|
NM_024837
|
ATP8B4
|
ATPase, class I, type 8B, member 4
|
|
chr2_+_102456193
|
0.456
|
NM_001011552
|
SLC9A4
|
solute carrier family 9 (sodium/hydrogen exchanger), member 4
|
|
chr4_-_185963859
|
0.455
|
|
ACSL1
|
acyl-CoA synthetase long-chain family member 1
|
|
chr2_-_21079145
|
0.455
|
|
APOB
|
apolipoprotein B (including Ag(x) antigen)
|
|
chr17_-_36418869
|
0.454
|
NM_031958
|
KRTAP3-1
|
keratin associated protein 3-1
|
|
chr21_-_30510113
|
0.454
|
NM_199328
|
CLDN8
|
claudin 8
|
|
chr11_-_128399218
|
0.453
|
NM_014715
|
ARHGAP32
|
Rho GTPase activating protein 32
|
|
chr14_+_20226762
|
0.451
|
NM_001097577
NM_194431
|
ANG
RNASE4
|
angiogenin, ribonuclease, RNase A family, 5
ribonuclease, RNase A family, 4
|
|
chr9_-_14900992
|
0.451
|
NM_144966
|
FREM1
|
FRAS1 related extracellular matrix 1
|
|
chr11_-_16953135
|
0.450
|
|
RPL36A
|
ribosomal protein L36a
|
|
chr11_-_102156531
|
0.450
|
NM_002425
|
MMP10
|
matrix metallopeptidase 10 (stromelysin 2)
|
|
chr6_+_154402135
|
0.449
|
NM_000914
NM_001008503
NM_001008504
NM_001008505
NM_001145282
NM_001145283
NM_001145285
NM_001145286
NM_001145284
|
OPRM1
|
opioid receptor, mu 1
|
|
chr4_+_72321113
|
0.447
|
|
SLC4A4
|
solute carrier family 4, sodium bicarbonate cotransporter, member 4
|
|
chr5_+_150138489
|
0.446
|
|
C5orf62
|
chromosome 5 open reading frame 62
|
|
chr1_+_40635058
|
0.443
|
NM_001198980
|
SMAP2
|
small ArfGAP2
|
|
chr2_+_191009265
|
0.441
|
|
MFSD6
|
major facilitator superfamily domain containing 6
|
|
chr8_+_18072250
|
0.439
|
NM_001160179
|
NAT1
|
N-acetyltransferase 1 (arylamine N-acetyltransferase)
|
|
chr17_-_36409632
|
0.438
|
NM_031959
|
KRTAP3-2
|
keratin associated protein 3-2
|
|
chrX_+_26066380
|
0.437
|
NM_173699
|
MAGEB18
|
melanoma antigen family B, 18
|
|
chr6_-_159386007
|
0.437
|
NM_054114
NM_138810
NM_152133
|
TAGAP
|
T-cell activation RhoGTPase activating protein
|
|
chr6_+_31838751
|
0.436
|
NM_001039651
|
C6orf26
|
chromosome 6 open reading frame 26
|
|
chr2_-_167058829
|
0.435
|
|
SCN7A
|
sodium channel, voltage-gated, type VII, alpha
|
|
chr17_-_52393364
|
0.434
|
NM_004645
|
COIL
|
coilin
|
|
chr4_-_40211324
|
0.434
|
|
RBM47
|
RNA binding motif protein 47
|
|
chr17_+_36647795
|
0.433
|
NM_031963
|
KRTAP9-8
|
keratin associated protein 9-8
|
|
chr14_+_36200815
|
0.433
|
|
PAX9
|
paired box 9
|
|
chr5_+_52892217
|
0.432
|
NM_002495
|
NDUFS4
|
NADH dehydrogenase (ubiquinone) Fe-S protein 4, 18kDa (NADH-coenzyme Q reductase)
|
|
chr1_+_154855709
|
0.430
|
NM_021817
|
HAPLN2
|
hyaluronan and proteoglycan link protein 2
|
|
chr20_+_16676997
|
0.429
|
NM_020157
|
OTOR
|
otoraplin
|
|
chr12_+_5473558
|
0.428
|
NM_002527
|
NTF3
|
neurotrophin 3
|
|
chr10_+_123738678
|
0.425
|
NM_206861
NM_206862
|
TACC2
|
transforming, acidic coiled-coil containing protein 2
|
|
chr5_+_76150637
|
0.424
|
|
F2RL1
|
coagulation factor II (thrombin) receptor-like 1
|
|
chr7_+_45899621
|
0.423
|
|
|
|