|
chr19_-_40995564
|
10.367
|
|
PRODH2
|
proline dehydrogenase (oxidase) 2
|
|
chr19_-_40995606
|
8.443
|
|
PRODH2
|
proline dehydrogenase (oxidase) 2
|
|
chr16_-_86527608
|
6.610
|
NM_001739
|
CA5A
|
carbonic anhydrase VA, mitochondrial
|
|
chr7_-_44547382
|
5.595
|
NM_001101648
NM_013389
|
NPC1L1
|
NPC1 (Niemann-Pick disease, type C1, gene)-like 1
|
|
chr6_-_52060327
|
5.520
|
NM_138694
NM_170724
|
PKHD1
|
polycystic kidney and hepatic disease 1 (autosomal recessive)
|
|
chr2_-_88208650
|
4.713
|
NM_001443
|
FABP1
|
fatty acid binding protein 1, liver
|
|
chr6_-_24491498
|
4.696
|
NM_001195610
|
DCDC2
|
doublecortin domain containing 2
|
|
chr4_-_69852090
|
4.559
|
NM_024743
|
UGT2A3
|
UDP glucuronosyltransferase 2 family, polypeptide A3
|
|
chr17_+_71065478
|
4.547
|
|
LLGL2
|
lethal giant larvae homolog 2 (Drosophila)
|
|
chr21_-_46399900
|
4.545
|
NM_006657
NM_206965
|
FTCD
|
formiminotransferase cyclodeaminase
|
|
chr6_+_31731667
|
4.455
|
|
APOM
|
apolipoprotein M
|
|
chr3_-_162572441
|
4.441
|
NM_001040100
|
C3orf57
|
chromosome 3 open reading frame 57
|
|
chr17_+_71154240
|
4.376
|
NM_001162997
|
LOC100130933
|
hypothetical protein LOC100130933
|
|
chr6_+_31731647
|
4.312
|
NM_019101
|
APOM
|
apolipoprotein M
|
|
chr4_-_69116839
|
4.144
|
NM_001077
|
UGT2B17
|
UDP glucuronosyltransferase 2 family, polypeptide B17
|
|
chr14_+_38772870
|
4.073
|
NM_054024
|
MIA2
|
melanoma inhibitory activity 2
|
|
chr4_-_977163
|
4.006
|
NM_022042
NM_134425
NM_213613
|
SLC26A1
|
solute carrier family 26 (sulfate transporter), member 1
|
|
chr1_+_48460943
|
3.958
|
NM_001011547
NM_001135181
|
SLC5A9
|
solute carrier family 5 (sodium/glucose cotransporter), member 9
|
|
chr20_+_42417752
|
3.780
|
NM_001030003
NM_001030004
NM_175914
|
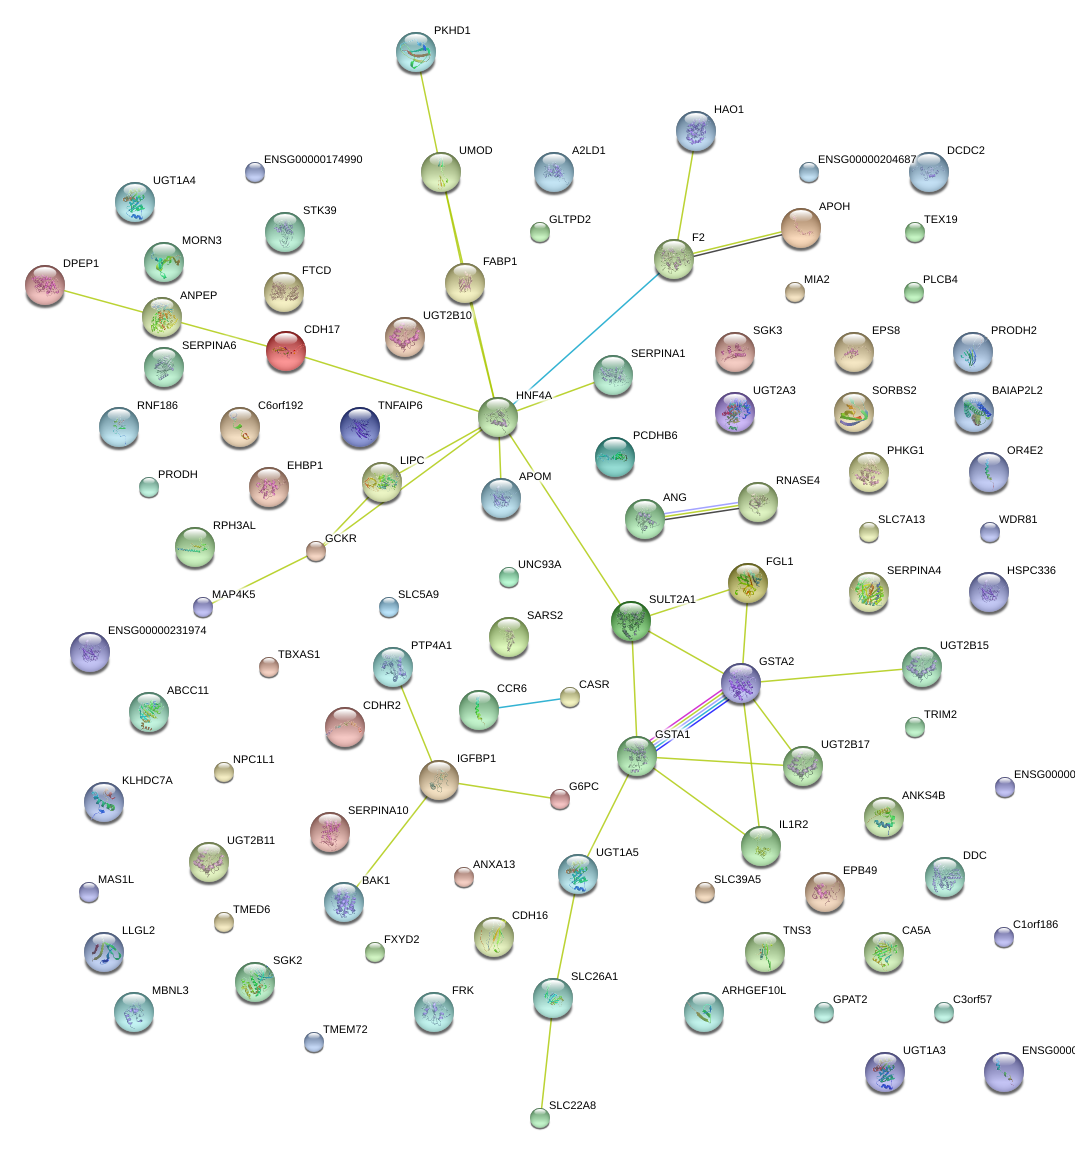
HNF4A
|
hepatocyte nuclear factor 4, alpha
|
|
chr2_+_27573206
|
3.684
|
NM_001486
|
GCKR
|
glucokinase (hexokinase 4) regulator
|
|
chr11_-_117200618
|
3.605
|
NM_001127489
NM_001680
|
FXYD2
|
FXYD domain containing ion transport regulator 2
|
|
chr16_-_46826588
|
3.536
|
NM_032583
NM_145186
|
ABCC11
|
ATP-binding cassette, sub-family C (CFTR/MRP), member 11
|
|
chr10_+_99334411
|
3.499
|
|
HOGA1
|
4-hydroxy-2-oxoglutarate aldolase 1
|
|
chr8_+_21967008
|
3.432
|
NM_001114137
|
EPB49
|
erythrocyte membrane protein band 4.9 (dematin)
|
|
chr5_+_175908948
|
3.418
|
NM_017675
|
CDHR2
|
cadherin-related family member 2
|
|
chr1_+_17779528
|
3.345
|
NM_001011722
|
ARHGEF10L
|
Rho guanine nucleotide exchange factor (GEF) 10-like
|
|
chr2_+_234302511
|
3.221
|
NM_019093
|
UGT1A3
|
UDP glucuronosyltransferase 1 family, polypeptide A3
|
|
chr17_+_4638966
|
3.208
|
NM_001014985
|
GLTPD2
|
glycolipid transfer protein domain containing 2
|
|
chr5_+_140509803
|
3.188
|
NM_018939
|
PCDHB6
|
protocadherin beta 6
|
|
chr16_+_21152516
|
3.152
|
NM_145865
|
ANKS4B
|
ankyrin repeat and sterile alpha motif domain containing 4B
|
|
chr6_-_116488458
|
3.101
|
NM_002031
|
FRK
|
fyn-related kinase
|
|
chr7_-_50600536
|
3.042
|
NM_001082971
|
DDC
|
dopa decarboxylase (aromatic L-amino acid decarboxylase)
|
|
chr15_+_56511466
|
2.997
|
NM_000236
|
LIPC
|
lipase, hepatic
|
|
chr20_+_42463419
|
2.984
|
|
HNF4A
|
hepatocyte nuclear factor 4, alpha
|
|
chr20_+_42417502
|
2.955
|
|
HNF4A
|
hepatocyte nuclear factor 4, alpha
|
|
chr16_-_67943157
|
2.811
|
NM_144676
|
TMED6
|
transmembrane emp24 protein transport domain containing 6
|
|
chr20_+_42463387
|
2.709
|
|
HNF4A
|
hepatocyte nuclear factor 4, alpha
|
|
chr10_+_44726635
|
2.705
|
NM_001123376
|
TMEM72
|
transmembrane protein 72
|
|
chr7_-_47545717
|
2.670
|
NM_022748
|
TNS3
|
tensin 3
|
|
chr17_-_202557
|
2.650
|
|
RPH3AL
|
rabphilin 3A-like (without C2 domains)
|
|
chr20_-_7869068
|
2.642
|
NM_017545
|
HAO1
|
hydroxyacid oxidase (glycolate oxidase) 1
|
|
chr20_+_42463350
|
2.632
|
|
HNF4A
|
hepatocyte nuclear factor 4, alpha
|
|
chr7_+_45894480
|
2.616
|
NM_000596
|
IGFBP1
|
insulin-like growth factor binding protein 1
|
|
chr4_-_69570919
|
2.587
|
NM_001076
|
UGT2B15
|
UDP glucuronosyltransferase 2 family, polypeptide B15
|
|
chr20_+_41621079
|
2.563
|
NM_170693
|
SGK2
|
serum/glucocorticoid regulated kinase 2
|
|
chr19_-_44135166
|
2.455
|
NM_148169
|
FBXO17
|
F-box protein 17
|
|
chr14_-_93924663
|
2.441
|
|
SERPINA1
|
serpin peptidase inhibitor, clade A (alpha-1 antiproteinase, antitrypsin), member 1
|
|
chr14_-_93859394
|
2.428
|
NM_001756
|
SERPINA6
|
serpin peptidase inhibitor, clade A (alpha-1 antiproteinase, antitrypsin), member 6
|
|
chr20_+_41621119
|
2.415
|
|
SGK2
|
serum/glucocorticoid regulated kinase 2
|
|
chr15_-_88150823
|
2.381
|
|
ANPEP
|
alanyl (membrane) aminopeptidase
|
|
chr16_+_88224175
|
2.330
|
|
DPEP1
|
dipeptidase 1 (renal)
|
|
chr16_+_88224276
|
2.256
|
|
DPEP1
|
dipeptidase 1 (renal)
|
|
chr14_-_93829113
|
2.225
|
NM_016186
|
SERPINA10
|
serpin peptidase inhibitor, clade A (alpha-1 antiproteinase, antitrypsin), member 10
|
|
chr14_+_20226762
|
2.194
|
NM_001097577
NM_194431
|
ANG
RNASE4
|
angiogenin, ribonuclease, RNase A family, 5
ribonuclease, RNase A family, 4
|
|
chr20_+_42463279
|
2.131
|
NM_000457
NM_178849
NM_178850
|
HNF4A
|
hepatocyte nuclear factor 4, alpha
|
|
chr2_+_101981888
|
2.092
|
NM_173343
|
IL1R2
|
interleukin 1 receptor, type II
|
|
chr6_-_29563657
|
2.078
|
NM_052967
|
MAS1L
|
MAS1 oncogene-like
|
|
chr14_-_93829309
|
2.042
|
|
SERPINA10
|
serpin peptidase inhibitor, clade A (alpha-1 antiproteinase, antitrypsin), member 10
|
|
chr16_-_65510230
|
1.983
|
NM_004062
|
CDH16
|
cadherin 16, KSP-cadherin
|
|
chr7_-_104354325
|
1.956
|
|
LOC723809
|
hypothetical LOC723809
|
|
chr17_-_202617
|
1.879
|
NM_001190411
NM_001190412
NM_001190413
NM_006987
|
RPH3AL
|
rabphilin 3A-like (without C2 domains)
|
|
chr14_-_93829347
|
1.859
|
NM_001100607
|
SERPINA10
|
serpin peptidase inhibitor, clade A (alpha-1 antiproteinase, antitrypsin), member 10
|
|
chr12_+_54910767
|
1.834
|
NM_001135195
|
SLC39A5
|
solute carrier family 39 (metal ion transporter), member 5
|
|
chr2_-_168812132
|
1.833
|
NM_013233
|
STK39
|
serine threonine kinase 39
|
|
chrX_-_131375217
|
1.831
|
NM_001170701
NM_001170702
NM_001170703
|
MBNL3
|
muscleblind-like 3 (Drosophila)
|
|
chr4_-_186970366
|
1.828
|
NM_003603
NM_001145670
|
SORBS2
|
sorbin and SH3 domain containing 2
|
|
chr1_+_18680010
|
1.782
|
NM_152375
|
KLHDC7A
|
kelch domain containing 7A
|
|
chr17_+_1586034
|
1.767
|
|
WDR81
|
WD repeat domain 81
|
|
chr11_-_62539857
|
1.761
|
NM_001184732
NM_001184733
NM_001184736
NM_004254
|
SLC22A8
|
solute carrier family 22 (organic anion transporter), member 8
|
|
chr2_+_62787534
|
1.754
|
NM_001142614
|
EHBP1
|
EH domain binding protein 1
|
|
chr14_+_94097513
|
1.734
|
NM_006215
|
SERPINA4
|
serpin peptidase inhibitor, clade A (alpha-1 antiproteinase, antitrypsin), member 4
|
|
chr1_-_204455269
|
1.726
|
NM_001007544
|
C1orf186
|
chromosome 1 open reading frame 186
|
|
chr17_+_38306339
|
1.725
|
NM_000151
|
G6PC
|
glucose-6-phosphatase, catalytic subunit
|
|
chr2_-_63518589
|
1.692
|
NM_001042692
|
WDPCP
|
WD repeat containing planar cell polarity effector
|
|
chr6_-_33655811
|
1.666
|
|
BAK1
|
BCL2-antagonist/killer 1
|
|
chr1_-_20014180
|
1.633
|
NM_019062
|
RNF186
|
ring finger protein 186
|
|
chr11_+_46697312
|
1.584
|
NM_000506
|
F2
|
coagulation factor II (thrombin)
|
|
chr11_+_46697345
|
1.575
|
|
F2
|
coagulation factor II (thrombin)
|
|
chr11_+_46697335
|
1.568
|
|
F2
|
coagulation factor II (thrombin)
|
|
chr12_-_15757114
|
1.508
|
|
EPS8
|
epidermal growth factor receptor pathway substrate 8
|
|
chr8_-_87311624
|
1.501
|
NM_138817
|
SLC7A13
|
solute carrier family 7, (cationic amino acid transporter, y+ system) member 13
|
|
chr14_-_93924873
|
1.477
|
NM_000295
|
SERPINA1
|
serpin peptidase inhibitor, clade A (alpha-1 antiproteinase, antitrypsin), member 1
|
|
chr17_-_61655915
|
1.437
|
NM_000042
|
APOH
|
apolipoprotein H (beta-2-glycoprotein I)
|
|
chr6_+_167624792
|
1.437
|
NM_001143947
NM_018974
|
UNC93A
|
unc-93 homolog A (C. elegans)
|
|
chr19_-_53081383
|
1.414
|
NM_003167
|
SULT2A1
|
sulfotransferase family, cytosolic, 2A, dehydroepiandrosterone (DHEA)-preferring, member 1
|
|
chr6_-_33655995
|
1.402
|
NM_001188
|
BAK1
|
BCL2-antagonist/killer 1
|
|
chr4_+_154345039
|
1.383
|
NM_015271
|
TRIM2
|
tripartite motif containing 2
|
|
chr6_-_133161318
|
1.379
|
NM_052831
|
C6orf192
|
chromosome 6 open reading frame 192
|
|
chr8_-_17797127
|
1.373
|
NM_147203
NM_201553
NM_004467
NM_201552
|
FGL1
|
fibrinogen-like 1
|
|
chr2_+_151922350
|
1.333
|
NM_007115
|
TNFAIP6
|
tumor necrosis factor, alpha-induced protein 6
|
|
chr19_-_53081326
|
1.333
|
|
SULT2A1
|
sulfotransferase family, cytosolic, 2A, dehydroepiandrosterone (DHEA)-preferring, member 1
|
|
chr22_-_36836620
|
1.329
|
NM_025045
|
BAIAP2L2
|
BAI1-associated protein 2-like 2
|
|
chr22_-_36836478
|
1.325
|
|
BAIAP2L2
|
BAI1-associated protein 2-like 2
|
|
chr20_+_9236446
|
1.318
|
NM_000933
|
PLCB4
|
phospholipase C, beta 4
|
|
chr14_+_21203136
|
1.317
|
NM_001001912
|
OR4E2
|
olfactory receptor, family 4, subfamily E, member 2
|
|
chr6_+_167456230
|
1.278
|
NM_031409
|
CCR6
|
chemokine (C-C motif) receptor 6
|
|
chr17_+_77910411
|
1.276
|
NM_207459
|
TEX19
|
testis expressed 19
|
|
chr6_+_64289585
|
1.267
|
|
PTP4A1
|
protein tyrosine phosphatase type IVA, member 1
|
|
chr6_-_52736231
|
1.260
|
NM_000846
|
GSTA2
|
glutathione S-transferase alpha 2
|
|
chr8_-_124818754
|
1.237
|
NM_001003954
NM_004306
|
ANXA13
|
annexin A13
|
|
chr16_-_20271530
|
1.224
|
NM_001008389
NM_003361
|
UMOD
|
uromodulin
|
|
chr7_+_139175420
|
1.216
|
NM_001061
NM_001166253
NM_030984
|
TBXAS1
|
thromboxane A synthase 1 (platelet)
|
|
chr13_-_99983945
|
1.184
|
NM_033110
|
A2LD1
|
AIG2-like domain 1
|
|
chr11_-_121492010
|
1.183
|
NM_001001786
|
BLID
|
BH3-like motif containing, cell death inducer
|
|
chr12_-_122400937
|
1.168
|
NM_001167856
NM_018183
|
SBNO1
|
strawberry notch homolog 1 (Drosophila)
|
|
chr4_+_3413489
|
1.158
|
NM_001528
|
HGFAC
|
HGF activator
|
|
chr3_+_185430910
|
1.125
|
NM_138345
|
VWA5B2
|
von Willebrand factor A domain containing 5B2
|
|
chr2_-_207291364
|
1.090
|
NM_001093730
|
DYTN
|
dystrotelin
|
|
chr19_-_47790820
|
1.082
|
NM_001816
|
CEACAM8
|
carcinoembryonic antigen-related cell adhesion molecule 8
|
|
chr10_+_101532450
|
1.077
|
NM_000392
|
ABCC2
|
ATP-binding cassette, sub-family C (CFTR/MRP), member 2
|
|
chr8_-_101802911
|
1.071
|
|
PABPC1
|
poly(A) binding protein, cytoplasmic 1
|
|
chr2_+_234245243
|
1.065
|
NM_021027
|
UGT1A9
|
UDP glucuronosyltransferase 1 family, polypeptide A9
|
|
chr19_+_750281
|
1.043
|
|
PTBP1
|
polypyrimidine tract binding protein 1
|
|
chr1_-_42402973
|
1.035
|
NM_033553
|
GUCA2A
|
guanylate cyclase activator 2A (guanylin)
|
|
chr2_+_234266250
|
1.032
|
NM_001072
|
UGT1A6
|
UDP glucuronosyltransferase 1 family, polypeptide A6
|
|
chr10_+_114144512
|
1.029
|
|
ACSL5
|
acyl-CoA synthetase long-chain family member 5
|
|
chr2_+_101874809
|
1.024
|
|
MAP4K4
|
mitogen-activated protein kinase kinase kinase kinase 4
|
|
chr3_-_171070314
|
1.012
|
NM_024727
|
LRRC31
|
leucine rich repeat containing 31
|
|
chr20_+_31713750
|
1.010
|
NM_080825
|
C20orf144
|
chromosome 20 open reading frame 144
|
|
chr6_-_26038817
|
1.007
|
NM_005835
|
SLC17A2
|
solute carrier family 17 (sodium phosphate), member 2
|
|
chr1_+_42391678
|
0.993
|
NM_007102
|
GUCA2B
|
guanylate cyclase activator 2B (uroguanylin)
|
|
chr8_+_76482661
|
0.992
|
|
HNF4G
|
hepatocyte nuclear factor 4, gamma
|
|
chr4_+_155703581
|
0.990
|
NM_001184741
NM_005141
|
FGB
|
fibrinogen beta chain
|
|
chr19_-_63556632
|
0.987
|
NM_130786
|
A1BG
|
alpha-1-B glycoprotein
|
|
chr4_+_74566325
|
0.987
|
NM_001133
|
AFM
|
afamin
|
|
chr2_+_234292162
|
0.986
|
NM_007120
|
UGT1A4
|
UDP glucuronosyltransferase 1 family, polypeptide A4
|
|
chr17_+_65009986
|
0.951
|
|
MAP2K6
|
mitogen-activated protein kinase kinase 6
|
|
chr3_+_63928459
|
0.932
|
NM_001128149
|
ATXN7
|
ataxin 7
|
|
chr4_+_3413457
|
0.932
|
|
HGFAC
|
HGF activator
|
|
chr2_+_101874765
|
0.918
|
|
MAP4K4
|
mitogen-activated protein kinase kinase kinase kinase 4
|
|
chr6_-_31007905
|
0.914
|
NM_205854
|
SFTA2
|
surfactant associated 2
|
|
chr20_-_17589122
|
0.908
|
|
RRBP1
|
ribosome binding protein 1 homolog 180kDa (dog)
|
|
chr10_-_69736600
|
0.905
|
|
PBLD
|
phenazine biosynthesis-like protein domain containing
|
|
chr3_-_57209319
|
0.896
|
NM_003865
|
HESX1
|
HESX homeobox 1
|
|
chr2_+_28892366
|
0.883
|
NM_001008779
|
SPDYA
|
speedy homolog A (Xenopus laevis)
|
|
chr13_-_32658215
|
0.869
|
NM_178007
|
STARD13
|
StAR-related lipid transfer (START) domain containing 13
|
|
chr12_+_21175394
|
0.858
|
NM_006446
|
SLCO1B1
|
solute carrier organic anion transporter family, member 1B1
|
|
chr9_+_80134302
|
0.857
|
|
PSAT1
|
phosphoserine aminotransferase 1
|
|
chr15_+_60726801
|
0.854
|
NM_015059
|
TLN2
|
talin 2
|
|
chr19_-_40996040
|
0.827
|
NM_021232
|
PRODH2
|
proline dehydrogenase (oxidase) 2
|
|
chr10_+_101532544
|
0.827
|
|
ABCC2
|
ATP-binding cassette, sub-family C (CFTR/MRP), member 2
|
|
chr6_-_137536412
|
0.799
|
NM_052962
NM_181309
NM_181310
|
IL22RA2
|
interleukin 22 receptor, alpha 2
|
|
chr2_+_234286376
|
0.797
|
NM_019078
|
UGT1A5
|
UDP glucuronosyltransferase 1 family, polypeptide A5
|
|
chr3_-_166278969
|
0.788
|
NM_001041
|
SI
|
sucrase-isomaltase (alpha-glucosidase)
|
|
chr20_+_35406497
|
0.780
|
NM_005417
|
SRC
|
v-src sarcoma (Schmidt-Ruppin A-2) viral oncogene homolog (avian)
|
|
chr2_-_101370355
|
0.774
|
NM_153836
|
CREG2
|
cellular repressor of E1A-stimulated genes 2
|
|
chrX_-_105169370
|
0.767
|
NM_000354
|
SERPINA7
|
serpin peptidase inhibitor, clade A (alpha-1 antiproteinase, antitrypsin), member 7
|
|
chr5_-_147191334
|
0.757
|
|
SPINK1
|
serine peptidase inhibitor, Kazal type 1
|
|
chr21_-_18697829
|
0.755
|
NM_002772
|
TMPRSS15
|
transmembrane protease, serine 15
|
|
chr11_+_26310253
|
0.740
|
NM_031418
|
ANO3
|
anoctamin 3
|
|
chr11_+_64114857
|
0.738
|
NM_144585
NM_153378
|
SLC22A12
|
solute carrier family 22 (organic anion/urate transporter), member 12
|
|
chr14_+_87560646
|
0.736
|
|
LOC283587
|
hypothetical protein LOC283587
|
|
chr16_-_56389176
|
0.733
|
NM_001130099
|
KIFC3
|
kinesin family member C3
|
|
chr3_+_187866464
|
0.727
|
NM_000412
|
HRG
|
histidine-rich glycoprotein
|
|
chr20_-_43972061
|
0.725
|
|
PLTP
|
phospholipid transfer protein
|
|
chr4_-_100359353
|
0.712
|
NM_000672
NM_001102470
|
ADH6
|
alcohol dehydrogenase 6 (class V)
|
|
chr1_-_228916559
|
0.691
|
|
AGT
|
angiotensinogen (serpin peptidase inhibitor, clade A, member 8)
|
|
chr1_-_151852128
|
0.689
|
NM_080388
|
S100A16
|
S100 calcium binding protein A16
|
|
chrX_+_117410693
|
0.684
|
|
WDR44
|
WD repeat domain 44
|
|
chr16_-_21344158
|
0.670
|
NM_130464
|
NPIPL3
|
nuclear pore complex interacting protein-like 3
|
|
chr16_+_56286212
|
0.653
|
NM_032269
|
CCDC135
|
coiled-coil domain containing 135
|
|
chr2_-_87102453
|
0.646
|
NM_002665
NM_001032392
|
PLGLB2
PLGLB1
|
plasminogen-like B2
plasminogen-like B1
|
|
chr3_-_168674502
|
0.634
|
NM_006217
|
SERPINI2
|
serpin peptidase inhibitor, clade I (pancpin), member 2
|
|
chr20_+_61841553
|
0.625
|
NM_020062
|
SLC2A4RG
|
SLC2A4 regulator
|
|
chr17_+_1592879
|
0.613
|
NM_000934
NM_001165921
|
SERPINF2
|
serpin peptidase inhibitor, clade F (alpha-2 antiplasmin, pigment epithelium derived factor), member 2
|
|
chr9_+_130257254
|
0.609
|
NM_153436
|
ODF2
|
outer dense fiber of sperm tails 2
|
|
chr2_-_227952249
|
0.607
|
NM_024795
|
TM4SF20
|
transmembrane 4 L six family member 20
|
|
chr7_-_158304062
|
0.606
|
|
ESYT2
|
extended synaptotagmin-like protein 2
|
|
chrX_+_70351812
|
0.600
|
|
GJB1
|
gap junction protein, beta 1, 32kDa
|
|
chr5_-_160044844
|
0.598
|
|
ATP10B
|
ATPase, class V, type 10B
|
|
chr22_+_43476755
|
0.598
|
NM_181334
|
PRR5-ARHGAP8
PRR5
|
PRR5-ARHGAP8 readthrough
proline rich 5 (renal)
|
|
chr16_+_30118036
|
0.594
|
NM_001017390
NM_177552
|
SULT1A4
SULT1A3
|
sulfotransferase family, cytosolic, 1A, phenol-preferring, member 4
sulfotransferase family, cytosolic, 1A, phenol-preferring, member 3
|
|
chr6_-_31789824
|
0.579
|
|
|
|
|
chr20_-_4938913
|
0.576
|
NM_203327
|
SLC23A2
|
solute carrier family 23 (nucleobase transporters), member 2
|
|
chr6_+_155453114
|
0.571
|
NM_012454
|
TIAM2
|
T-cell lymphoma invasion and metastasis 2
|
|
chr4_-_40211324
|
0.570
|
|
RBM47
|
RNA binding motif protein 47
|
|
chr21_-_42219849
|
0.570
|
NM_199050
|
C2CD2
|
C2 calcium-dependent domain containing 2
|
|
chr3_+_150675117
|
0.569
|
NM_004617
|
TM4SF4
|
transmembrane 4 L six family member 4
|
|
chr10_-_121592020
|
0.567
|
|
MCMBP
|
minichromosome maintenance complex binding protein
|
|
chr10_-_32707549
|
0.567
|
|
EPC1
|
enhancer of polycomb homolog 1 (Drosophila)
|
|
chr16_+_22432344
|
0.549
|
NM_001135865
|
LOC100132247
NPIPL3
|
nuclear pore complex interacting protein related gene
nuclear pore complex interacting protein-like 3
|
|
chr2_+_28572441
|
0.544
|
NM_001170585
NM_153021
|
PLB1
|
phospholipase B1
|
|
chr17_+_1592893
|
0.540
|
|
SERPINF2
|
serpin peptidase inhibitor, clade F (alpha-2 antiplasmin, pigment epithelium derived factor), member 2
|
|
chr5_-_147191428
|
0.537
|
NM_003122
|
SPINK1
|
serine peptidase inhibitor, Kazal type 1
|
|
chr7_-_87694218
|
0.535
|
NM_198901
|
SRI
|
sorcin
|
|
chr11_+_61794205
|
0.534
|
NM_002411
|
SCGB2A2
|
secretoglobin, family 2A, member 2
|
|
chr6_+_25862905
|
0.533
|
NM_005495
|
SLC17A4
|
solute carrier family 17 (sodium phosphate), member 4
|
|
chr7_+_129913271
|
0.527
|
NM_177524
|
MEST
|
mesoderm specific transcript homolog (mouse)
|
|
chr22_+_21027538
|
0.519
|
|
|
|
|
chr9_-_115901157
|
0.516
|
NM_138424
|
KIF12
|
kinesin family member 12
|
|
chr12_-_18134319
|
0.515
|
NM_024730
|
RERGL
|
RERG/RAS-like
|
|
chr10_+_99334069
|
0.514
|
NM_001134670
NM_138413
|
HOGA1
|
4-hydroxy-2-oxoglutarate aldolase 1
|
|
chr2_+_182558795
|
0.514
|
NM_001080545
|
PPP1R1C
|
protein phosphatase 1, regulatory (inhibitor) subunit 1C
|
|
chr20_+_56848127
|
0.501
|
|
GNAS
|
GNAS complex locus
|
|
chr5_+_140552087
|
0.491
|
NM_018930
|
PCDHB10
|
protocadherin beta 10
|
|
chr18_+_27425727
|
0.489
|
NM_000371
|
TTR
|
transthyretin
|
|
chr1_+_209586328
|
0.488
|
NM_145759
|
TRAF5
|
TNF receptor-associated factor 5
|
|
chr2_+_208932813
|
0.473
|
|
PTH2R
|
parathyroid hormone 2 receptor
|
|
chr9_-_27287106
|
0.472
|
NM_001161585
NM_020641
|
C9orf11
|
chromosome 9 open reading frame 11
|
|
chr17_-_53335748
|
0.469
|
NM_017949
|
CUEDC1
|
CUE domain containing 1
|