|
chr6_+_47857733
|
1.147
|
NM_181744
|
OPN5
|
opsin 5
|
|
chr15_+_19883745
|
0.805
|
NM_001005241
|
OR4N4
|
olfactory receptor, family 4, subfamily N, member 4
|
|
chr22_+_21065202
|
0.713
|
|
|
|
|
chr6_+_7524691
|
0.701
|
|
DSP
|
desmoplakin
|
|
chr10_+_77212524
|
0.694
|
NM_032024
|
C10orf11
|
chromosome 10 open reading frame 11
|
|
chr22_+_21116283
|
0.687
|
|
|
|
|
chr22_+_21065134
|
0.677
|
|
LOC100290481
|
immunoglobulin lambda light chain-like
|
|
chr4_-_145281237
|
0.666
|
NM_002099
|
GYPA
|
glycophorin A (MNS blood group)
|
|
chr6_+_152053323
|
0.653
|
NM_001122742
|
ESR1
|
estrogen receptor 1
|
|
chr2_-_180135559
|
0.631
|
NM_001113398
|
ZNF385B
|
zinc finger protein 385B
|
|
chr1_+_46151845
|
0.620
|
|
MAST2
|
microtubule associated serine/threonine kinase 2
|
|
chr4_-_145159889
|
0.611
|
NM_002100
|
GYPB
|
glycophorin B (MNS blood group)
|
|
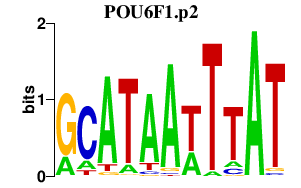
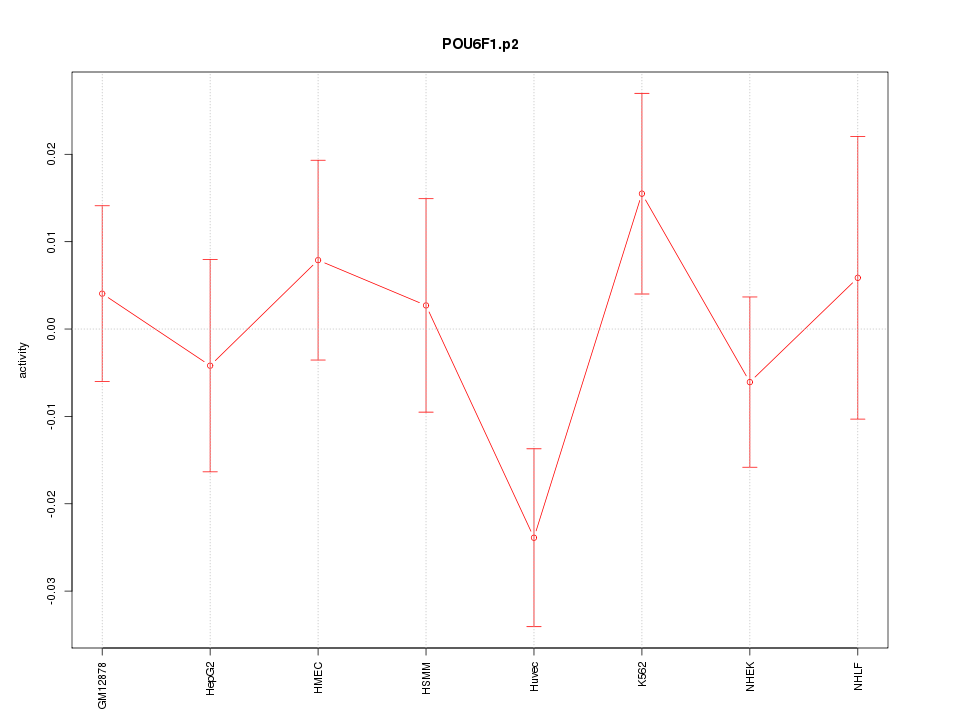
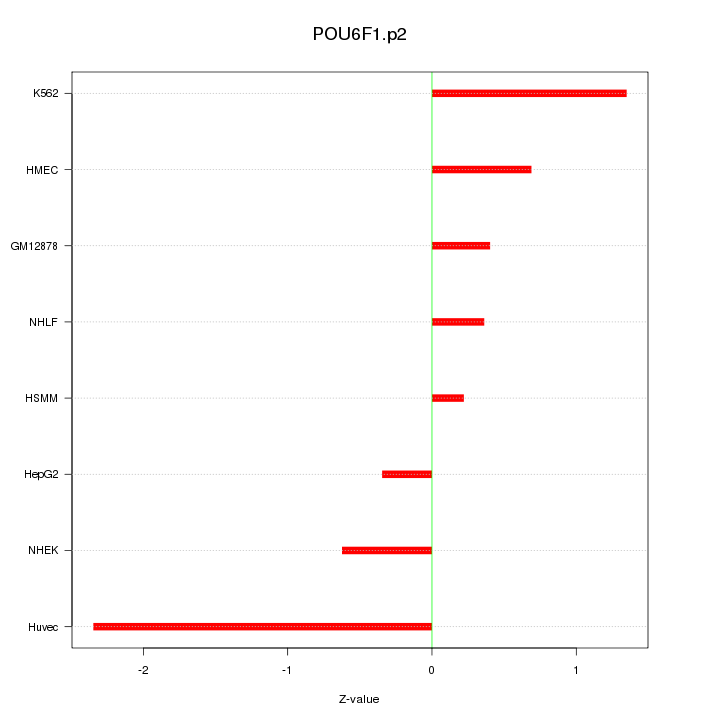
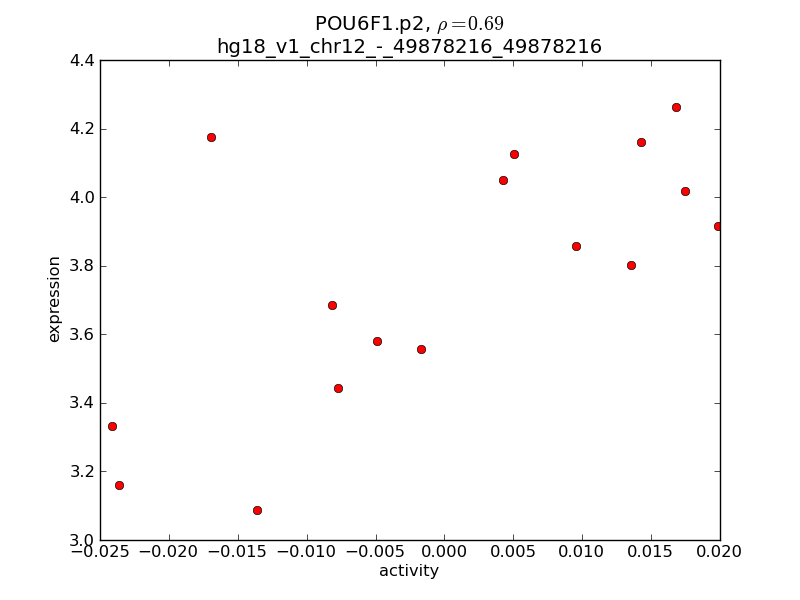
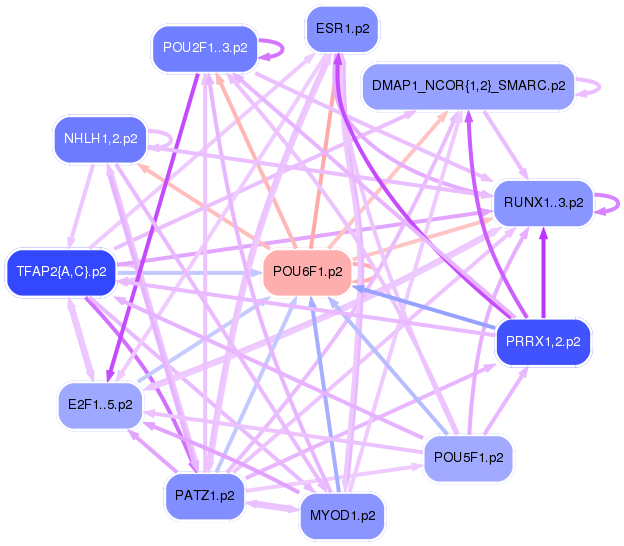
chr12_-_49897743
|
0.567
|
|
POU6F1
|
POU class 6 homeobox 1
|
|
chrX_+_65299157
|
0.561
|
NM_138737
|
HEPH
|
hephaestin
|
|
chr18_-_55136673
|
0.553
|
NM_181654
|
CPLX4
|
complexin 4
|
|
chr9_+_107464558
|
0.514
|
NM_005421
|
TAL2
|
T-cell acute lymphocytic leukemia 2
|
|
chrX_+_46938136
|
0.513
|
NM_003334
|
UBA1
|
ubiquitin-like modifier activating enzyme 1
|
|
chr1_-_67366807
|
0.512
|
NM_001013674
|
C1orf141
|
chromosome 1 open reading frame 141
|
|
chr10_+_29617995
|
0.494
|
NM_032517
|
LYZL1
|
lysozyme-like 1
|
|
chr10_-_128199986
|
0.471
|
NM_001004298
|
C10orf90
|
chromosome 10 open reading frame 90
|
|
chrX_+_46938171
|
0.463
|
|
UBA1
|
ubiquitin-like modifier activating enzyme 1
|
|
chrX_+_46938157
|
0.462
|
|
UBA1
|
ubiquitin-like modifier activating enzyme 1
|
|
chrX_+_46938215
|
0.459
|
|
UBA1
|
ubiquitin-like modifier activating enzyme 1
|
|
chr22_+_21065207
|
0.455
|
|
IGLJ3
|
immunoglobulin lambda joining 3
|
|
chr10_+_96433240
|
0.446
|
NM_000772
NM_001128925
|
CYP2C18
|
cytochrome P450, family 2, subfamily C, polypeptide 18
|
|
chr4_+_35962038
|
0.434
|
NM_001170700
|
DTHD1
|
death domain containing 1
|
|
chr13_+_112746908
|
0.421
|
|
MCF2L
|
MCF.2 cell line derived transforming sequence-like
|
|
chr12_-_9777126
|
0.415
|
NM_172004
|
CLECL1
|
C-type lectin-like 1
|
|
chr1_+_165565006
|
0.408
|
|
POU2F1
|
POU class 2 homeobox 1
|
|
chr7_+_38984133
|
0.403
|
NM_001166018
NM_007252
|
POU6F2
|
POU class 6 homeobox 2
|
|
chr6_-_26216299
|
0.401
|
NM_005323
|
HIST1H1T
|
histone cluster 1, H1t
|
|
chr7_-_38915306
|
0.392
|
NM_014396
NM_080631
|
VPS41
|
vacuolar protein sorting 41 homolog (S. cerevisiae)
|
|
chr3_+_129682434
|
0.389
|
|
|
|
|
chr11_-_59390518
|
0.381
|
NM_001062
|
TCN1
|
transcobalamin I (vitamin B12 binding protein, R binder family)
|
|
chrX_-_77801480
|
0.370
|
NM_152694
|
ZCCHC5
|
zinc finger, CCHC domain containing 5
|
|
chr14_-_106270497
|
0.366
|
|
IGHG3
|
immunoglobulin heavy constant gamma 3 (G3m marker)
|
|
chr1_-_89437098
|
0.366
|
NM_052941
|
GBP4
|
guanylate binding protein 4
|
|
chr1_-_178100204
|
0.360
|
|
|
|
|
chr12_+_21175394
|
0.360
|
NM_006446
|
SLCO1B1
|
solute carrier organic anion transporter family, member 1B1
|
|
chr3_-_57301749
|
0.360
|
NM_001142733
|
ASB14
|
ankyrin repeat and SOCS box containing 14
|
|
chr6_-_29431950
|
0.359
|
NM_030876
|
OR5V1
|
olfactory receptor, family 5, subfamily V, member 1
|
|
chrX_+_46938178
|
0.356
|
|
UBA1
|
ubiquitin-like modifier activating enzyme 1
|
|
chr3_-_191650291
|
0.351
|
NM_207316
|
TMEM207
|
transmembrane protein 207
|
|
chr13_-_25687062
|
0.349
|
|
RNF6
|
ring finger protein (C3H2C3 type) 6
|
|
chr7_+_106897737
|
0.345
|
NM_005295
|
GPR22
|
G protein-coupled receptor 22
|
|
chr5_-_145232723
|
0.340
|
NM_001080516
|
GRXCR2
|
glutaredoxin, cysteine rich 2
|
|
chr6_+_26548678
|
0.337
|
NM_006994
NM_197974
|
BTN3A3
|
butyrophilin, subfamily 3, member A3
|
|
chr7_+_94135384
|
0.335
|
|
PEG10
|
paternally expressed 10
|
|
chr22_+_21006814
|
0.334
|
|
|
|
|
chr14_-_60022487
|
0.332
|
NM_174978
|
C14orf39
|
chromosome 14 open reading frame 39
|
|
chrX_-_106033202
|
0.321
|
NM_001171706
NM_138382
|
RIPPLY1
|
ripply1 homolog (zebrafish)
|
|
chr22_-_38619739
|
0.312
|
NM_152512
|
ENTHD1
|
ENTH domain containing 1
|
|
chr8_-_13018123
|
0.302
|
NM_001164271
|
DLC1
|
deleted in liver cancer 1
|
|
chr6_-_155818728
|
0.301
|
NM_015718
|
NOX3
|
NADPH oxidase 3
|
|
chr17_-_36232366
|
0.301
|
NM_000421
|
KRT10
|
keratin 10
|
|
chr14_-_106119742
|
0.297
|
|
IGLJ3
IGHG1
|
immunoglobulin lambda joining 3
immunoglobulin heavy constant gamma 1 (G1m marker)
|
|
chr1_+_165564904
|
0.295
|
NM_001198783
|
POU2F1
|
POU class 2 homeobox 1
|
|
chr9_-_124981125
|
0.295
|
|
STRBP
|
spermatid perinuclear RNA binding protein
|
|
chr15_+_47502666
|
0.291
|
NM_002009
|
FGF7
|
fibroblast growth factor 7
|
|
chr8_+_17440664
|
0.291
|
NM_001164771
NM_003046
|
SLC7A2
|
solute carrier family 7 (cationic amino acid transporter, y+ system), member 2
|
|
chr2_+_24660849
|
0.290
|
NM_003743
NM_147223
NM_147233
|
NCOA1
|
nuclear receptor coactivator 1
|
|
chr15_-_100280784
|
0.289
|
NM_001004195
|
OR4F4
OR4F17
|
olfactory receptor, family 4, subfamily F, member 4
olfactory receptor, family 4, subfamily F, member 17
|
|
chr1_+_166516901
|
0.284
|
NM_005149
|
TBX19
|
T-box 19
|
|
chr1_+_158603480
|
0.283
|
NM_005598
|
NHLH1
|
nescient helix loop helix 1
|
|
chr17_-_53847937
|
0.280
|
|
RNF43
|
ring finger protein 43
|
|
chr15_+_38082041
|
0.279
|
|
EIF2AK4
|
eukaryotic translation initiation factor 2 alpha kinase 4
|
|
chr9_+_19280748
|
0.277
|
NM_017925
|
DENND4C
|
DENN/MADD domain containing 4C
|
|
chr3_+_153074118
|
0.277
|
NM_033050
|
SUCNR1
|
succinate receptor 1
|
|
chr7_+_133862883
|
0.271
|
NM_020299
|
AKR1B10
|
aldo-keto reductase family 1, member B10 (aldose reductase)
|
|
chr7_+_104468614
|
0.271
|
|
MLL5
|
myeloid/lymphoid or mixed-lineage leukemia 5 (trithorax homolog, Drosophila)
|
|
chr6_-_123999640
|
0.271
|
NM_006073
|
TRDN
|
triadin
|
|
chr7_+_91762227
|
0.269
|
|
|
|
|
chr7_+_138469029
|
0.268
|
NM_001144920
NM_001144923
NM_024926
|
TTC26
|
tetratricopeptide repeat domain 26
|
|
chr2_-_215953818
|
0.267
|
|
FN1
|
fibronectin 1
|
|
chr21_-_26269298
|
0.266
|
|
APP
|
amyloid beta (A4) precursor protein
|
|
chr5_+_140583098
|
0.264
|
NM_018934
|
PCDHB14
|
protocadherin beta 14
|
|
chrX_+_41468351
|
0.260
|
NM_080817
|
GPR82
|
G protein-coupled receptor 82
|
|
chr4_-_152368492
|
0.255
|
|
SH3D19
|
SH3 domain containing 19
|
|
chr13_-_102209422
|
0.253
|
NM_001146197
|
C13orf40
|
chromosome 13 open reading frame 40
|
|
chr2_+_161701711
|
0.251
|
NM_004180
NM_133484
|
TANK
|
TRAF family member-associated NFKB activator
|
|
chr4_-_45820686
|
0.251
|
NM_173536
|
GABRG1
|
gamma-aminobutyric acid (GABA) A receptor, gamma 1
|
|
chr7_-_83116414
|
0.247
|
NM_012431
|
SEMA3E
|
sema domain, immunoglobulin domain (Ig), short basic domain, secreted, (semaphorin) 3E
|
|
chr9_-_106420305
|
0.246
|
NM_001001956
|
OR13C9
|
olfactory receptor, family 13, subfamily C, member 9
|
|
chr11_+_5466490
|
0.243
|
NM_001005163
|
OR52D1
|
olfactory receptor, family 52, subfamily D, member 1
|
|
chr8_-_82769761
|
0.243
|
NM_001010893
|
SLC10A5
|
solute carrier family 10 (sodium/bile acid cotransporter family), member 5
|
|
chr3_+_99288706
|
0.242
|
NM_054106
|
OR5AC2
|
olfactory receptor, family 5, subfamily AC, member 2
|
|
chr10_+_38339531
|
0.238
|
NM_006954
NM_006974
|
ZNF33A
|
zinc finger protein 33A
|
|
chr8_-_38324809
|
0.236
|
|
WHSC1L1
|
Wolf-Hirschhorn syndrome candidate 1-like 1
|
|
chr7_-_107930170
|
0.234
|
|
PNPLA8
|
patatin-like phospholipase domain containing 8
|
|
chr1_+_67404756
|
0.229
|
NM_144701
|
IL23R
|
interleukin 23 receptor
|
|
chr22_+_38652555
|
0.228
|
|
GRAP2
|
GRB2-related adaptor protein 2
|
|
chrX_+_78087484
|
0.223
|
NM_014499
NM_198333
|
P2RY10
|
purinergic receptor P2Y, G-protein coupled, 10
|
|
chr16_+_2593351
|
0.222
|
|
LOC652276
|
hypothetical LOC652276
|
|
chrX_+_46938246
|
0.222
|
|
UBA1
|
ubiquitin-like modifier activating enzyme 1
|
|
chr19_+_61624
|
0.222
|
NM_001005240
|
OR4F4
OR4F17
|
olfactory receptor, family 4, subfamily F, member 4
olfactory receptor, family 4, subfamily F, member 17
|
|
chr1_+_109057078
|
0.220
|
NM_001144937
|
FNDC7
|
fibronectin type III domain containing 7
|
|
chr5_+_139485703
|
0.220
|
NM_001007189
|
C5orf53
|
chromosome 5 open reading frame 53
|
|
chr13_+_108079570
|
0.218
|
NM_001198950
|
MYO16
|
myosin XVI
|
|
chr2_+_128009782
|
0.217
|
NM_001080527
|
MYO7B
|
myosin VIIB
|
|
chr14_+_38719462
|
0.216
|
|
PNN
|
pinin, desmosome associated protein
|
|
chr16_+_33112480
|
0.215
|
NM_016212
|
TP53TG3
|
TP53 target 3
|
|
chr1_+_17954394
|
0.215
|
NM_030812
|
ACTL8
|
actin-like 8
|
|
chr5_-_27074407
|
0.213
|
NM_016279
|
CDH9
|
cadherin 9, type 2 (T1-cadherin)
|
|
chr17_+_20712337
|
0.212
|
|
|
|
|
chr7_-_50596238
|
0.211
|
NM_000790
|
DDC
|
dopa decarboxylase (aromatic L-amino acid decarboxylase)
|
|
chr14_-_105589467
|
0.209
|
|
LOC100126583
IGHA1
IGHG1
IGHG2
IGHM
|
hypothetical LOC100126583
immunoglobulin heavy constant alpha 1
immunoglobulin heavy constant gamma 1 (G1m marker)
immunoglobulin heavy constant gamma 2 (G2m marker)
immunoglobulin heavy constant mu
|
|
chr14_-_105524207
|
0.209
|
|
IGHG1
|
immunoglobulin heavy constant gamma 1 (G1m marker)
|
|
chr2_+_28572441
|
0.208
|
NM_001170585
NM_153021
|
PLB1
|
phospholipase B1
|
|
chr3_-_13032130
|
0.204
|
|
|
|
|
chr3_+_162697289
|
0.203
|
NM_001080440
|
OTOL1
|
otolin 1 homolog (zebrafish)
|
|
chrX_+_36163971
|
0.200
|
NM_001098843
|
CXorf30
|
chromosome X open reading frame 30
|
|
chr1_+_74473672
|
0.198
|
NM_015978
|
TNNI3K
|
TNNI3 interacting kinase
|
|
chrX_-_32083506
|
0.196
|
NM_004013
NM_004020
NM_004021
NM_004022
NM_004023
|
DMD
|
dystrophin
|
|
chr18_-_58946858
|
0.194
|
|
BCL2
|
B-cell CLL/lymphoma 2
|
|
chr3_+_142175329
|
0.194
|
|
SLC25A36
|
solute carrier family 25, member 36
|
|
chr4_-_151990061
|
0.193
|
|
LRBA
|
LPS-responsive vesicle trafficking, beach and anchor containing
|
|
chr6_-_130072971
|
0.192
|
NM_033515
|
ARHGAP18
|
Rho GTPase activating protein 18
|
|
chr6_+_72982865
|
0.190
|
NM_001168409
|
RIMS1
|
regulating synaptic membrane exocytosis 1
|
|
chr6_+_105511615
|
0.190
|
NM_001004317
|
LIN28B
|
lin-28 homolog B (C. elegans)
|
|
chr6_-_29163027
|
0.189
|
NM_001005226
|
OR2B3
|
olfactory receptor, family 2, subfamily B, member 3
|
|
chr11_-_57927457
|
0.188
|
NM_001005469
|
OR5B3
|
olfactory receptor, family 5, subfamily B, member 3
|
|
chr14_-_56342097
|
0.187
|
NM_172337
|
OTX2
|
orthodenticle homeobox 2
|
|
chr22_+_21370394
|
0.186
|
|
IGL@
|
immunoglobulin lambda locus
|
|
chr14_-_93512647
|
0.183
|
|
ASB2
|
ankyrin repeat and SOCS box containing 2
|
|
chr4_+_70896236
|
0.183
|
NM_001009181
NM_003154
|
STATH
|
statherin
|
|
chr2_-_1905508
|
0.177
|
|
MYT1L
|
myelin transcription factor 1-like
|
|
chrX_+_65299352
|
0.175
|
|
HEPH
|
hephaestin
|
|
chr1_-_214963279
|
0.172
|
NM_001438
|
ESRRG
|
estrogen-related receptor gamma
|
|
chr7_+_128136347
|
0.172
|
|
FAM71F1
|
family with sequence similarity 71, member F1
|
|
chr6_-_150099352
|
0.172
|
|
NUP43
|
nucleoporin 43kDa
|
|
chrX_-_117003310
|
0.172
|
NM_001168299
|
KLHL13
|
kelch-like 13 (Drosophila)
|
|
chr14_-_94669547
|
0.171
|
NM_001195573
|
DICER1
|
dicer 1, ribonuclease type III
|
|
chr2_+_201464884
|
0.171
|
NM_001142356
|
NIF3L1
|
NIF3 NGG1 interacting factor 3-like 1 (S. pombe)
|
|
chr11_+_55799604
|
0.171
|
NM_001004745
|
OR5T1
|
olfactory receptor, family 5, subfamily T, member 1
|
|
chr19_-_51236113
|
0.170
|
NM_001002923
|
IGFL4
|
IGF-like family member 4
|
|
chr6_-_169392771
|
0.170
|
|
|
|
|
chr7_-_5533621
|
0.169
|
|
ACTB
|
actin, beta
|
|
chr10_-_30958631
|
0.169
|
NM_183058
|
LYZL2
|
lysozyme-like 2
|
|
chr6_+_45404031
|
0.168
|
NM_001015051
NM_001024630
|
RUNX2
|
runt-related transcription factor 2
|
|
chr22_-_21193504
|
0.168
|
NM_080764
|
ZNF280B
|
zinc finger protein 280B
|
|
chr7_-_93027057
|
0.163
|
NM_001164738
|
CALCR
|
calcitonin receptor
|
|
chr2_-_138762909
|
0.163
|
|
|
|
|
chr15_+_91244422
|
0.162
|
NM_001042572
NM_001271
|
CHD2
|
chromodomain helicase DNA binding protein 2
|
|
chr3_+_143858428
|
0.162
|
NM_001172312
|
PLS1
|
plastin 1
|
|
chr6_+_29187565
|
0.162
|
NM_001005216
|
OR2J3
|
olfactory receptor, family 2, subfamily J, member 3
|
|
chr12_+_108310906
|
0.160
|
NM_001101421
|
MYO1H
|
myosin IH
|
|
chr17_-_36294962
|
0.159
|
NM_019010
|
KRT20
|
keratin 20
|
|
chr10_-_42507180
|
0.156
|
|
|
|
|
chr14_-_100420936
|
0.156
|
NM_001134888
|
RTL1
|
retrotransposon-like 1
|
|
chr7_-_92693716
|
0.154
|
NM_001039372
|
HEPACAM2
|
HEPACAM family member 2
|
|
chr11_+_4965996
|
0.154
|
NM_021801
|
MMP26
|
matrix metallopeptidase 26
|
|
chr14_-_105762742
|
0.152
|
|
|
|
|
chr3_-_152641248
|
0.152
|
NM_001178145
NM_001178146
|
IGSF10
|
immunoglobulin superfamily, member 10
|
|
chr10_-_5035967
|
0.152
|
NM_001135241
|
AKR1C1
AKR1C2
|
aldo-keto reductase family 1, member C1 (dihydrodiol dehydrogenase 1; 20-alpha (3-alpha)-hydroxysteroid dehydrogenase)
aldo-keto reductase family 1, member C2 (dihydrodiol dehydrogenase 2; bile acid binding protein; 3-alpha hydroxysteroid dehydrogenase, type III)
|
|
chr10_+_70172257
|
0.150
|
|
CCAR1
|
cell division cycle and apoptosis regulator 1
|
|
chr12_+_54172413
|
0.149
|
NM_001005519
|
OR6C68
|
olfactory receptor, family 6, subfamily C, member 68
|
|
chr9_-_106407728
|
0.149
|
NM_001004481
|
OR13C2
|
olfactory receptor, family 13, subfamily C, member 2
|
|
chr5_+_125723686
|
0.148
|
NM_001146319
|
GRAMD3
|
GRAM domain containing 3
|
|
chr7_-_107667728
|
0.147
|
NM_001037132
|
NRCAM
|
neuronal cell adhesion molecule
|
|
chr16_-_69392568
|
0.145
|
|
VAC14
|
Vac14 homolog (S. cerevisiae)
|
|
chr12_-_16652202
|
0.142
|
NM_001001395
|
LMO3
|
LIM domain only 3 (rhombotin-like 2)
|
|
chr11_+_86710076
|
0.142
|
|
TMEM135
|
transmembrane protein 135
|
|
chr16_-_32595553
|
0.142
|
NM_016212
|
TP53TG3
|
TP53 target 3
|
|
chr11_-_123772456
|
0.141
|
NM_001005467
|
OR8B3
|
olfactory receptor, family 8, subfamily B, member 3
|
|
chr7_+_120490054
|
0.141
|
|
C7orf58
|
chromosome 7 open reading frame 58
|
|
chr2_+_183290912
|
0.139
|
|
DNAJC10
|
DnaJ (Hsp40) homolog, subfamily C, member 10
|
|
chr17_-_15914485
|
0.136
|
|
NCOR1
|
nuclear receptor corepressor 1
|
|
chr16_+_4842077
|
0.136
|
NM_016936
|
UBN1
|
ubinuclein 1
|
|
chr1_+_178466064
|
0.135
|
NM_033343
|
LHX4
|
LIM homeobox 4
|
|
chr11_-_83071084
|
0.134
|
NM_001142702
|
DLG2
|
discs, large homolog 2 (Drosophila)
|
|
chr6_+_163904564
|
0.134
|
|
QKI
|
quaking homolog, KH domain RNA binding (mouse)
|
|
chr11_-_57173823
|
0.132
|
NM_145008
|
YPEL4
|
yippee-like 4 (Drosophila)
|
|
chr6_+_53991672
|
0.132
|
NM_138569
|
C6orf142
|
chromosome 6 open reading frame 142
|
|
chr11_+_19328846
|
0.131
|
NM_001111018
|
NAV2
|
neuron navigator 2
|
|
chrX_+_67830204
|
0.131
|
NM_001142504
|
STARD8
|
StAR-related lipid transfer (START) domain containing 8
|
|
chr6_-_132980901
|
0.129
|
NM_014626
|
TAAR2
|
trace amine associated receptor 2
|
|
chr2_-_166638376
|
0.129
|
NM_001165963
NM_001165964
NM_006920
|
SCN1A
|
sodium channel, voltage-gated, type I, alpha subunit
|
|
chr6_+_54281161
|
0.129
|
NM_014464
|
TINAG
|
tubulointerstitial nephritis antigen
|
|
chr16_-_69392385
|
0.128
|
|
VAC14
|
Vac14 homolog (S. cerevisiae)
|
|
chr9_+_122923864
|
0.125
|
|
CEP110
|
centrosomal protein 110kDa
|
|
chr8_+_54926920
|
0.125
|
NM_170587
|
RGS20
|
regulator of G-protein signaling 20
|
|
chr15_-_48626193
|
0.124
|
NM_203494
|
USP50
|
ubiquitin specific peptidase 50
|
|
chrX_-_102828238
|
0.124
|
NM_001142418
NM_001142423
NM_001142424
NM_001142425
NM_001142426
NM_001142429
NM_001142430
NM_012286
|
MORF4L2
|
mortality factor 4 like 2
|
|
chr11_+_122214415
|
0.123
|
NM_019604
|
CRTAM
|
cytotoxic and regulatory T cell molecule
|
|
chr4_+_160408447
|
0.123
|
NM_014247
|
RAPGEF2
|
Rap guanine nucleotide exchange factor (GEF) 2
|
|
chr19_+_62872114
|
0.121
|
NM_152677
|
ZSCAN4
|
zinc finger and SCAN domain containing 4
|
|
chr3_+_14691609
|
0.120
|
NM_001184957
NM_001184958
NM_032137
|
C3orf20
|
chromosome 3 open reading frame 20
|
|
chr18_+_8707368
|
0.120
|
NM_015210
|
KIAA0802
|
KIAA0802
|
|
chr9_+_106496480
|
0.119
|
NM_001004484
|
OR13D1
|
olfactory receptor, family 13, subfamily D, member 1
|
|
chr3_+_46894239
|
0.118
|
NM_000316
|
PTH1R
|
parathyroid hormone 1 receptor
|
|
chr14_-_106289751
|
0.115
|
|
IGHA1
IGHG1
IGHM
|
immunoglobulin heavy constant alpha 1
immunoglobulin heavy constant gamma 1 (G1m marker)
immunoglobulin heavy constant mu
|
|
chr6_-_49942147
|
0.115
|
NM_001131
NM_170609
|
CRISP1
|
cysteine-rich secretory protein 1
|
|
chr11_-_58736897
|
0.114
|
NM_001039396
|
MPEG1
|
macrophage expressed 1
|
|
chr8_+_36760999
|
0.114
|
NM_001031836
|
KCNU1
|
potassium channel, subfamily U, member 1
|
|
chr10_+_90474280
|
0.113
|
NM_001080518
|
LIPK
|
lipase, family member K
|
|
chr2_-_55090759
|
0.113
|
NM_007008
|
RTN4
|
reticulon 4
|
|
chr2_+_178893216
|
0.113
|
NM_145739
|
OSBPL6
|
oxysterol binding protein-like 6
|
|
chr6_+_72653126
|
0.112
|
|
RIMS1
|
regulating synaptic membrane exocytosis 1
|
|
chr12_+_73217889
|
0.112
|
|
ATXN7L3B
|
ataxin 7-like 3B
|
|
chr14_-_105523735
|
0.112
|
|
IGHG1
|
immunoglobulin heavy constant gamma 1 (G1m marker)
|