|
chr11_+_63829616
|
5.000
|
NM_004451
|
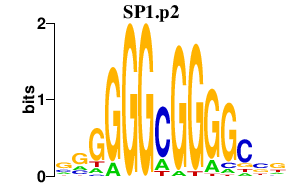
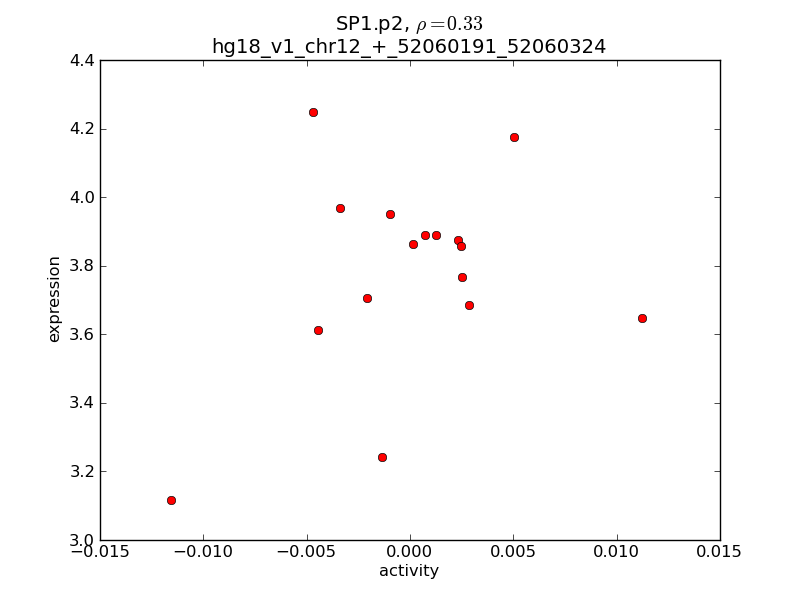
ESRRA
|
estrogen-related receptor alpha
|
|
chr1_-_32574185
|
4.342
|
NM_023009
|
MARCKSL1
|
MARCKS-like 1
|
|
chr1_-_40903897
|
4.325
|
NM_014747
|
RIMS3
|
regulating synaptic membrane exocytosis 3
|
|
chr1_-_40903700
|
3.949
|
|
RIMS3
|
regulating synaptic membrane exocytosis 3
|
|
chr19_-_55524445
|
3.862
|
NM_004977
|
KCNC3
|
potassium voltage-gated channel, Shaw-related subfamily, member 3
|
|
chr20_+_1154763
|
3.374
|
NM_001136566
|
RAD21L1
|
RAD21-like 1 (S. pombe)
|
|
chr16_-_8870343
|
3.328
|
NM_014316
|
CARHSP1
|
calcium regulated heat stable protein 1, 24kDa
|
|
chr16_-_88295595
|
3.257
|
NM_152339
|
SPATA2L
|
spermatogenesis associated 2-like
|
|
chr20_-_3102169
|
3.216
|
|
ProSAPiP1
|
ProSAPiP1 protein
|
|
chr21_+_42946719
|
3.010
|
NM_001001567
NM_001001568
NM_001001569
NM_001001570
NM_001001571
NM_001001572
NM_001001573
NM_001001574
NM_001001575
NM_001001576
NM_001001577
NM_001001578
NM_001001579
NM_001001580
NM_001001581
NM_001001582
NM_001001583
NM_001001584
NM_001001585
NM_002606
|
PDE9A
|
phosphodiesterase 9A
|
|
chr6_-_31805547
|
2.939
|
|
DDAH2
|
dimethylarginine dimethylaminohydrolase 2
|
|
chr20_-_51644187
|
2.891
|
|
ZNF217
|
zinc finger protein 217
|
|
chr17_+_77582774
|
2.781
|
NM_005052
|
RAC3
|
ras-related C3 botulinum toxin substrate 3 (rho family, small GTP binding protein Rac3)
|
|
chr2_+_46623396
|
2.746
|
|
RHOQ
|
ras homolog gene family, member Q
|
|
chr21_-_44583696
|
2.732
|
NM_004928
|
C21orf2
|
chromosome 21 open reading frame 2
|
|
chr1_+_27925054
|
2.677
|
NM_001143912
NM_001143913
NM_001143914
NM_001143915
NM_152660
|
FAM76A
|
family with sequence similarity 76, member A
|
|
chr17_+_52266451
|
2.647
|
NM_003647
|
DGKE
|
diacylglycerol kinase, epsilon 64kDa
|
|
chr6_+_7052798
|
2.566
|
NM_001168344
|
RREB1
|
ras responsive element binding protein 1
|
|
chr19_+_659766
|
2.553
|
NM_001040134
NM_002579
|
PALM
|
paralemmin
|
|
chr21_-_44583662
|
2.538
|
|
C21orf2
|
chromosome 21 open reading frame 2
|
|
chr8_+_144706699
|
2.514
|
NM_001166237
|
GSDMD
|
gasdermin D
|
|
chr22_+_20101661
|
2.495
|
NM_015094
|
HIC2
|
hypermethylated in cancer 2
|
|
chr22_-_21231421
|
2.465
|
NM_206955
NM_206956
NM_006115
NM_206953
NM_206954
|
PRAME
|
preferentially expressed antigen in melanoma
|
|
chr10_+_76256305
|
2.453
|
NM_012330
|
MYST4
|
MYST histone acetyltransferase (monocytic leukemia) 4
|
|
chr22_-_20419975
|
2.417
|
NM_013313
|
YPEL1
|
yippee-like 1 (Drosophila)
|
|
chr8_-_144722141
|
2.414
|
|
C8orf73
|
chromosome 8 open reading frame 73
|
|
chr3_+_47004457
|
2.374
|
|
NBEAL2
|
neurobeachin-like 2
|
|
chr9_+_132961723
|
2.353
|
|
AIF1L
|
allograft inflammatory factor 1-like
|
|
chr20_-_62151216
|
2.304
|
NM_018419
|
SOX18
|
SRY (sex determining region Y)-box 18
|
|
chr5_-_175969697
|
2.273
|
NM_052899
|
GPRIN1
|
G protein regulated inducer of neurite outgrowth 1
|
|
chr3_+_173240983
|
2.261
|
NM_001135095
|
FNDC3B
|
fibronectin type III domain containing 3B
|
|
chr12_-_123617962
|
2.239
|
NM_001077261
NM_006312
|
NCOR2
|
nuclear receptor corepressor 2
|
|
chr3_-_38041281
|
2.229
|
NM_001130964
|
PLCD1
|
phospholipase C, delta 1
|
|
chr19_-_60350122
|
2.207
|
|
TNNT1
|
troponin T type 1 (skeletal, slow)
|
|
chr17_-_24062998
|
2.201
|
NM_152465
|
PROCA1
|
protein interacting with cyclin A1
|
|
chr19_+_54786723
|
2.192
|
NM_020719
|
PRR12
|
proline rich 12
|
|
chr5_+_176446425
|
2.184
|
NM_002011
NM_213647
|
FGFR4
|
fibroblast growth factor receptor 4
|
|
chr9_-_122679387
|
2.138
|
NM_001009936
NM_015651
|
PHF19
|
PHD finger protein 19
|
|
chr6_-_31805932
|
2.107
|
|
DDAH2
|
dimethylarginine dimethylaminohydrolase 2
|
|
chr6_-_31806012
|
2.095
|
NM_013974
|
DDAH2
|
dimethylarginine dimethylaminohydrolase 2
|
|
chr12_+_119562737
|
2.042
|
NM_001033677
|
CABP1
|
calcium binding protein 1
|
|
chr16_-_65287967
|
2.035
|
NM_178818
NM_181521
|
CMTM4
|
CKLF-like MARVEL transmembrane domain containing 4
|
|
chr19_+_12805747
|
1.979
|
|
MAST1
|
microtubule associated serine/threonine kinase 1
|
|
chr6_+_34312979
|
1.946
|
|
HMGA1
|
high mobility group AT-hook 1
|
|
chr19_-_60350118
|
1.943
|
|
TNNT1
|
troponin T type 1 (skeletal, slow)
|
|
chr2_+_46623325
|
1.940
|
NM_012249
|
RHOQ
|
ras homolog gene family, member Q
|
|
chr9_-_122679283
|
1.936
|
|
PHF19
|
PHD finger protein 19
|
|
chr16_+_29373365
|
1.933
|
NM_001014999
NM_001015000
NM_024044
NM_178044
|
SLX1A-SULT1A3
SLX1A
SLX1B
|
SLX1A-SULT1A3 read-through transcript
SLX1 structure-specific endonuclease subunit homolog A (S. cerevisiae)
SLX1 structure-specific endonuclease subunit homolog B (S. cerevisiae)
|
|
chr17_-_77421980
|
1.931
|
NM_001185077
|
ARHGDIA
|
Rho GDP dissociation inhibitor (GDI) alpha
|
|
chr17_-_34157962
|
1.898
|
NM_007144
|
PCGF2
|
polycomb group ring finger 2
|
|
chr22_-_17546296
|
1.870
|
NM_005984
|
SLC25A1
|
solute carrier family 25 (mitochondrial carrier; citrate transporter), member 1
|
|
chr1_+_945331
|
1.825
|
NM_198576
|
AGRN
|
agrin
|
|
chr19_-_47619992
|
1.809
|
|
LIPE
|
lipase, hormone-sensitive
|
|
chr17_-_75427644
|
1.807
|
NM_003655
|
CBX4
|
chromobox homolog 4
|
|
chr1_-_1840564
|
1.801
|
NM_178545
|
TMEM52
|
transmembrane protein 52
|
|
chr7_-_4889772
|
1.799
|
NM_018059
|
RADIL
|
Ras association and DIL domains
|
|
chr8_-_146023228
|
1.789
|
|
LOC100130027
|
hypothetical LOC100130027
|
|
chr22_-_18807805
|
1.788
|
|
PI4KAP2
PI4KAP1
|
phosphatidylinositol 4-kinase, catalytic, alpha pseudogene 2
phosphatidylinositol 4-kinase, catalytic, alpha pseudogene 1
|
|
chr2_+_112372671
|
1.785
|
|
MERTK
|
c-mer proto-oncogene tyrosine kinase
|
|
chr9_+_138680064
|
1.783
|
|
EGFL7
|
EGF-like-domain, multiple 7
|
|
chr1_+_945399
|
1.782
|
|
|
|
|
chr19_+_59064471
|
1.764
|
NM_001020821
NM_001020818
|
MYADM
|
myeloid-associated differentiation marker
|
|
chr16_+_1143241
|
1.754
|
NM_001005407
NM_021098
|
CACNA1H
|
calcium channel, voltage-dependent, T type, alpha 1H subunit
|
|
chr7_-_86526880
|
1.742
|
NM_001142749
|
KIAA1324L
|
KIAA1324-like
|
|
chr9_+_132961683
|
1.735
|
NM_001185095
NM_001185096
NM_031426
|
AIF1L
|
allograft inflammatory factor 1-like
|
|
chr8_-_71478041
|
1.733
|
|
NCOA2
|
nuclear receptor coactivator 2
|
|
chr7_+_64136078
|
1.731
|
|
CCT6P3
|
chaperonin containing TCP1, subunit 6 (zeta) pseudogene 3
|
|
chr20_-_61600834
|
1.730
|
NM_001958
|
EEF1A2
|
eukaryotic translation elongation factor 1 alpha 2
|
|
chr20_+_44083667
|
1.721
|
NM_001134771
|
SLC12A5
|
solute carrier family 12 (potassium/chloride transporter), member 5
|
|
chr21_-_44583505
|
1.706
|
|
C21orf2
|
chromosome 21 open reading frame 2
|
|
chr8_-_124355670
|
1.702
|
NM_001017926
NM_007222
|
ZHX1
|
zinc fingers and homeoboxes 1
|
|
chr1_-_52791309
|
1.693
|
NM_001009881
NM_015269
|
ZCCHC11
|
zinc finger, CCHC domain containing 11
|
|
chr11_+_45900731
|
1.692
|
|
GYLTL1B
|
glycosyltransferase-like 1B
|
|
chrX_+_9392980
|
1.687
|
NM_005647
|
TBL1X
|
transducin (beta)-like 1X-linked
|
|
chr19_+_45389356
|
1.677
|
NM_002446
|
MAP3K10
|
mitogen-activated protein kinase kinase kinase 10
|
|
chr6_-_18263262
|
1.675
|
NM_000367
|
TPMT
|
thiopurine S-methyltransferase
|
|
chr22_-_17546276
|
1.673
|
|
SLC25A1
|
solute carrier family 25 (mitochondrial carrier; citrate transporter), member 1
|
|
chr14_+_104337923
|
1.659
|
NM_001137601
|
ZBTB42
|
zinc finger and BTB domain containing 42
|
|
chr6_+_34313007
|
1.655
|
|
HMGA1
|
high mobility group AT-hook 1
|
|
chr19_-_43570503
|
1.653
|
NM_152657
|
GGN
|
gametogenetin
|
|
chr22_+_19649417
|
1.646
|
NM_001018060
NM_144704
|
AIFM3
|
apoptosis-inducing factor, mitochondrion-associated, 3
|
|
chr22_-_17545872
|
1.639
|
|
SLC25A1
|
solute carrier family 25 (mitochondrial carrier; citrate transporter), member 1
|
|
chr19_-_54636425
|
1.635
|
NM_020309
|
SLC17A7
|
solute carrier family 17 (sodium-dependent inorganic phosphate cotransporter), member 7
|
|
chr8_-_145609737
|
1.634
|
|
SLC39A4
|
solute carrier family 39 (zinc transporter), member 4
|
|
chr19_-_45642078
|
1.633
|
NM_203344
|
SERTAD3
|
SERTA domain containing 3
|
|
chr1_+_945472
|
1.631
|
|
AGRN
|
agrin
|
|
chr5_-_176671897
|
1.621
|
NM_001142935
NM_031300
|
MXD3
|
MAX dimerization protein 3
|
|
chr22_-_18635614
|
1.620
|
NM_023004
|
RTN4R
|
reticulon 4 receptor
|
|
chr1_-_39910296
|
1.617
|
NM_032526
|
NT5C1A
|
5'-nucleotidase, cytosolic IA
|
|
chr8_-_144722027
|
1.613
|
|
C8orf73
|
chromosome 8 open reading frame 73
|
|
chr19_+_59064795
|
1.601
|
|
MYADM
|
myeloid-associated differentiation marker
|
|
chr22_-_20551722
|
1.592
|
|
MAPK1
|
mitogen-activated protein kinase 1
|
|
chr22_+_18085891
|
1.591
|
|
SEPT5
|
septin 5
|
|
chr17_-_39556535
|
1.589
|
NM_001015053
NM_005474
|
HDAC5
|
histone deacetylase 5
|
|
chr12_-_112057650
|
1.584
|
NM_001193521
|
RASAL1
|
RAS protein activator like 1 (GAP1 like)
|
|
chr2_+_112372651
|
1.573
|
NM_006343
|
MERTK
|
c-mer proto-oncogene tyrosine kinase
|
|
chr18_+_75256702
|
1.572
|
NM_006162
NM_172388
NM_172390
|
NFATC1
|
nuclear factor of activated T-cells, cytoplasmic, calcineurin-dependent 1
|
|
chr11_-_69228286
|
1.564
|
NM_005117
|
FGF19
|
fibroblast growth factor 19
|
|
chr11_+_64705989
|
1.562
|
|
CAPN1
|
calpain 1, (mu/I) large subunit
|
|
chr19_-_3013191
|
1.553
|
NM_001130
NM_198970
|
AES
|
amino-terminal enhancer of split
|
|
chr1_+_243200275
|
1.543
|
|
EFCAB2
|
EF-hand calcium binding domain 2
|
|
chr2_+_69995656
|
1.541
|
NM_002357
|
MXD1
|
MAX dimerization protein 1
|
|
chr22_+_18081968
|
1.540
|
NM_002688
|
SEPT5
|
septin 5
|
|
chr22_-_17546234
|
1.538
|
|
SLC25A1
|
solute carrier family 25 (mitochondrial carrier; citrate transporter), member 1
|
|
chr19_-_10540620
|
1.537
|
NM_001800
NM_079421
|
CDKN2D
|
cyclin-dependent kinase inhibitor 2D (p19, inhibits CDK4)
|
|
chr1_+_46485946
|
1.533
|
NM_001142548
NM_003579
|
RAD54L
|
RAD54-like (S. cerevisiae)
|
|
chr3_-_185461768
|
1.532
|
NM_033259
|
CAMK2N2
|
calcium/calmodulin-dependent protein kinase II inhibitor 2
|
|
chr6_+_7052985
|
1.532
|
NM_001003698
NM_001003699
NM_001003700
|
RREB1
|
ras responsive element binding protein 1
|
|
chr6_-_31890765
|
1.514
|
NM_005527
|
HSPA1L
|
heat shock 70kDa protein 1-like
|
|
chr16_-_1404635
|
1.512
|
NM_001037125
NM_001193388
|
UNKL
|
unkempt homolog (Drosophila)-like
|
|
chr20_+_34357604
|
1.510
|
|
DLGAP4
|
discs, large (Drosophila) homolog-associated protein 4
|
|
chr9_+_70509925
|
1.504
|
NM_003558
|
PIP5K1B
|
phosphatidylinositol-4-phosphate 5-kinase, type I, beta
|
|
chr17_-_34015631
|
1.500
|
NM_025248
|
SRCIN1
|
SRC kinase signaling inhibitor 1
|
|
chr1_-_203579932
|
1.493
|
|
KLHDC8A
|
kelch domain containing 8A
|
|
chr8_-_144887876
|
1.488
|
NM_198488
|
FAM83H
|
family with sequence similarity 83, member H
|
|
chr1_-_1699723
|
1.487
|
NM_023018
|
NADK
|
NAD kinase
|
|
chr12_-_46499834
|
1.485
|
NM_001098416
NM_015401
|
HDAC7
|
histone deacetylase 7
|
|
chr22_+_18085990
|
1.484
|
|
SEPT5-GP1BB
SEPT5
|
SEPT5-GP1BB read-through transcript
septin 5
|
|
chrX_+_138060
|
1.482
|
NM_018390
|
PLCXD1
|
phosphatidylinositol-specific phospholipase C, X domain containing 1
|
|
chr19_+_50702525
|
1.481
|
NM_003370
|
VASP
|
vasodilator-stimulated phosphoprotein
|
|
chr1_+_46486020
|
1.477
|
|
RAD54L
|
RAD54-like (S. cerevisiae)
|
|
chr19_-_45416112
|
1.475
|
NM_152479
|
TTC9B
|
tetratricopeptide repeat domain 9B
|
|
chr6_-_35572694
|
1.469
|
NM_003214
|
TEAD3
|
TEA domain family member 3
|
|
chr8_-_145661545
|
1.468
|
NM_032687
NM_001129888
|
CYHR1
|
cysteine/histidine-rich 1
|
|
chr19_-_18409788
|
1.468
|
NM_001170939
|
ISYNA1
|
inositol-3-phosphate synthase 1
|
|
chr11_+_359723
|
1.467
|
NM_178537
|
B4GALNT4
|
beta-1,4-N-acetyl-galactosaminyl transferase 4
|
|
chr6_+_34313347
|
1.465
|
|
HMGA1
|
high mobility group AT-hook 1
|
|
chr1_+_32979930
|
1.459
|
NM_020888
|
KIAA1522
|
KIAA1522
|
|
chr22_-_18384251
|
1.443
|
NM_001670
|
ARVCF
|
armadillo repeat gene deleted in velocardiofacial syndrome
|
|
chr3_-_38040999
|
1.438
|
|
PLCD1
|
phospholipase C, delta 1
|
|
chr4_+_1330957
|
1.431
|
NM_020894
|
KIAA1530
|
KIAA1530
|
|
chr1_+_243200251
|
1.430
|
NM_001143943
|
EFCAB2
|
EF-hand calcium binding domain 2
|
|
chr4_+_995395
|
1.428
|
|
FGFRL1
|
fibroblast growth factor receptor-like 1
|
|
chr14_+_102659464
|
1.426
|
|
TNFAIP2
|
tumor necrosis factor, alpha-induced protein 2
|
|
chr17_+_24944605
|
1.424
|
NM_152345
|
ANKRD13B
|
ankyrin repeat domain 13B
|
|
chr6_+_33495824
|
1.421
|
NM_006772
|
SYNGAP1
|
synaptic Ras GTPase activating protein 1
|
|
chr5_+_172193826
|
1.416
|
NM_001031711
|
ERGIC1
|
endoplasmic reticulum-golgi intermediate compartment (ERGIC) 1
|
|
chr12_+_110328126
|
1.416
|
NM_005475
|
SH2B3
|
SH2B adaptor protein 3
|
|
chr7_-_97868101
|
1.414
|
|
BAIAP2L1
|
BAI1-associated protein 2-like 1
|
|
chr3_+_157071173
|
1.403
|
|
GMPS
|
guanine monphosphate synthetase
|
|
chr16_+_2016807
|
1.402
|
NM_001130012
NM_004785
|
SLC9A3R2
|
solute carrier family 9 (sodium/hydrogen exchanger), member 3 regulator 2
|
|
chr1_-_23683214
|
1.399
|
|
ASAP3
|
ArfGAP with SH3 domain, ankyrin repeat and PH domain 3
|
|
chr19_+_540849
|
1.391
|
NM_001194
|
HCN2
|
hyperpolarization activated cyclic nucleotide-gated potassium channel 2
|
|
chr1_+_199259664
|
1.387
|
|
|
|
|
chr17_+_75366524
|
1.383
|
NM_005189
NM_032647
|
CBX2
|
chromobox homolog 2
|
|
chr14_-_36059084
|
1.383
|
NM_001079668
|
NKX2-1
|
NK2 homeobox 1
|
|
chr9_+_108665168
|
1.377
|
NM_021224
|
ZNF462
|
zinc finger protein 462
|
|
chr18_-_43711452
|
1.372
|
NM_001003652
NM_001135937
|
SMAD2
|
SMAD family member 2
|
|
chr1_-_21868380
|
1.372
|
NM_001145657
NM_002885
|
RAP1GAP
|
RAP1 GTPase activating protein
|
|
chr19_+_50692325
|
1.366
|
|
|
|
|
chr2_-_70848621
|
1.358
|
NM_001185055
NM_001617
NM_017482
NM_017488
|
ADD2
|
adducin 2 (beta)
|
|
chr1_+_9217444
|
1.358
|
NM_004285
|
H6PD
|
hexose-6-phosphate dehydrogenase (glucose 1-dehydrogenase)
|
|
chrX_+_118254233
|
1.351
|
NM_006667
|
PGRMC1
|
progesterone receptor membrane component 1
|
|
chr19_+_45996881
|
1.350
|
NM_080732
|
EGLN2
|
egl nine homolog 2 (C. elegans)
|
|
chr19_-_3013441
|
1.346
|
|
AES
|
amino-terminal enhancer of split
|
|
chr1_+_9217384
|
1.346
|
|
H6PD
|
hexose-6-phosphate dehydrogenase (glucose 1-dehydrogenase)
|
|
chr12_+_55896844
|
1.344
|
NM_007224
|
NXPH4
|
neurexophilin 4
|
|
chr5_+_154115046
|
1.342
|
|
LARP1
|
La ribonucleoprotein domain family, member 1
|
|
chr21_+_34367678
|
1.337
|
NM_032476
NM_006933
|
MRPS6
SLC5A3
|
mitochondrial ribosomal protein S6
solute carrier family 5 (sodium/myo-inositol cotransporter), member 3
|
|
chr7_-_97868362
|
1.334
|
NM_018842
|
BAIAP2L1
|
BAI1-associated protein 2-like 1
|
|
chr19_+_868285
|
1.332
|
NM_032551
|
KISS1R
|
KISS1 receptor
|
|
chr1_+_210525397
|
1.324
|
|
PPP2R5A
|
protein phosphatase 2, regulatory subunit B', alpha
|
|
chr2_+_10360471
|
1.322
|
NM_002149
|
HPCAL1
|
hippocalcin-like 1
|
|
chr2_+_136005423
|
1.320
|
NM_015361
|
R3HDM1
|
R3H domain containing 1
|
|
chr17_-_39556483
|
1.319
|
|
HDAC5
|
histone deacetylase 5
|
|
chr22_-_17659183
|
1.316
|
NM_001835
NM_007098
|
CLTCL1
|
clathrin, heavy chain-like 1
|
|
chr6_+_3204184
|
1.316
|
|
PSMG4
|
proteasome (prosome, macropain) assembly chaperone 4
|
|
chr8_+_126511739
|
1.313
|
NM_025195
|
TRIB1
|
tribbles homolog 1 (Drosophila)
|
|
chr22_+_19649460
|
1.312
|
|
AIFM3
|
apoptosis-inducing factor, mitochondrion-associated, 3
|
|
chr5_+_140997171
|
1.310
|
|
RELL2
|
RELT-like 2
|
|
chr9_+_130142607
|
1.303
|
NM_005094
|
SLC27A4
|
solute carrier family 27 (fatty acid transporter), member 4
|
|
chr16_+_2504001
|
1.301
|
|
ATP6V0C
|
ATPase, H+ transporting, lysosomal 16kDa, V0 subunit c
|
|
chr10_-_43224312
|
1.300
|
NM_001098205
|
HNRNPF
|
heterogeneous nuclear ribonucleoprotein F
|
|
chr1_-_36624071
|
1.300
|
NM_032017
|
STK40
|
serine/threonine kinase 40
|
|
chr3_-_50624114
|
1.298
|
NM_013324
NM_145071
|
CISH
|
cytokine inducible SH2-containing protein
|
|
chr19_-_47450991
|
1.298
|
|
ERF
|
Ets2 repressor factor
|
|
chr18_+_75256931
|
1.297
|
|
NFATC1
|
nuclear factor of activated T-cells, cytoplasmic, calcineurin-dependent 1
|
|
chr9_-_100510657
|
1.296
|
NM_005458
|
GABBR2
|
gamma-aminobutyric acid (GABA) B receptor, 2
|
|
chr6_+_33486750
|
1.295
|
NM_002636
NM_024165
|
PHF1
|
PHD finger protein 1
|
|
chr6_+_33046636
|
1.294
|
NM_001113182
|
BRD2
|
bromodomain containing 2
|
|
chr19_-_13977875
|
1.289
|
|
RFX1
|
regulatory factor X, 1 (influences HLA class II expression)
|
|
chr1_+_46485972
|
1.287
|
|
RAD54L
|
RAD54-like (S. cerevisiae)
|
|
chr11_-_64167361
|
1.280
|
NM_138734
|
NRXN2
|
neurexin 2
|
|
chr1_+_210525792
|
1.278
|
|
PPP2R5A
|
protein phosphatase 2, regulatory subunit B', alpha
|
|
chr3_-_48569213
|
1.270
|
NM_004567
|
PFKFB4
|
6-phosphofructo-2-kinase/fructose-2,6-biphosphatase 4
|
|
chr7_+_73080362
|
1.264
|
NM_000501
NM_001081752
NM_001081753
NM_001081754
NM_001081755
|
ELN
|
elastin
|
|
chr6_-_29703913
|
1.263
|
NM_021903
|
GABBR1
|
gamma-aminobutyric acid (GABA) B receptor, 1
|
|
chr4_+_52403922
|
1.263
|
NM_001040402
NM_015115
|
DCUN1D4
|
DCN1, defective in cullin neddylation 1, domain containing 4 (S. cerevisiae)
|
|
chr22_+_21742364
|
1.261
|
NM_002073
|
GNAZ
|
guanine nucleotide binding protein (G protein), alpha z polypeptide
|
|
chr7_-_100262971
|
1.256
|
NM_004444
|
EPHB4
|
EPH receptor B4
|
|
chr16_+_4948318
|
1.249
|
NM_014692
|
SEC14L5
|
SEC14-like 5 (S. cerevisiae)
|
|
chr16_+_31036474
|
1.247
|
NM_032188
NM_182958
|
MYST1
|
MYST histone acetyltransferase 1
|
|
chr17_-_76622967
|
1.241
|
|
FLJ90757
|
hypothetical LOC440465
|
|
chr11_+_131286513
|
1.236
|
|
NTM
|
neurotrimin
|
|
chr3_+_31549123
|
1.233
|
|
STT3B
|
STT3, subunit of the oligosaccharyltransferase complex, homolog B (S. cerevisiae)
|
|
chr16_+_1143738
|
1.231
|
|
CACNA1H
|
calcium channel, voltage-dependent, T type, alpha 1H subunit
|
|
chr6_+_33046706
|
1.231
|
|
BRD2
|
bromodomain containing 2
|
|
chr16_+_83618804
|
1.231
|
NM_014732
|
KIAA0513
|
KIAA0513
|
|
chr5_-_121440704
|
1.227
|
NM_001178102
|
LOX
|
lysyl oxidase
|
|
chr19_-_17306538
|
1.224
|
NM_020959
|
ANO8
|
anoctamin 8
|