|
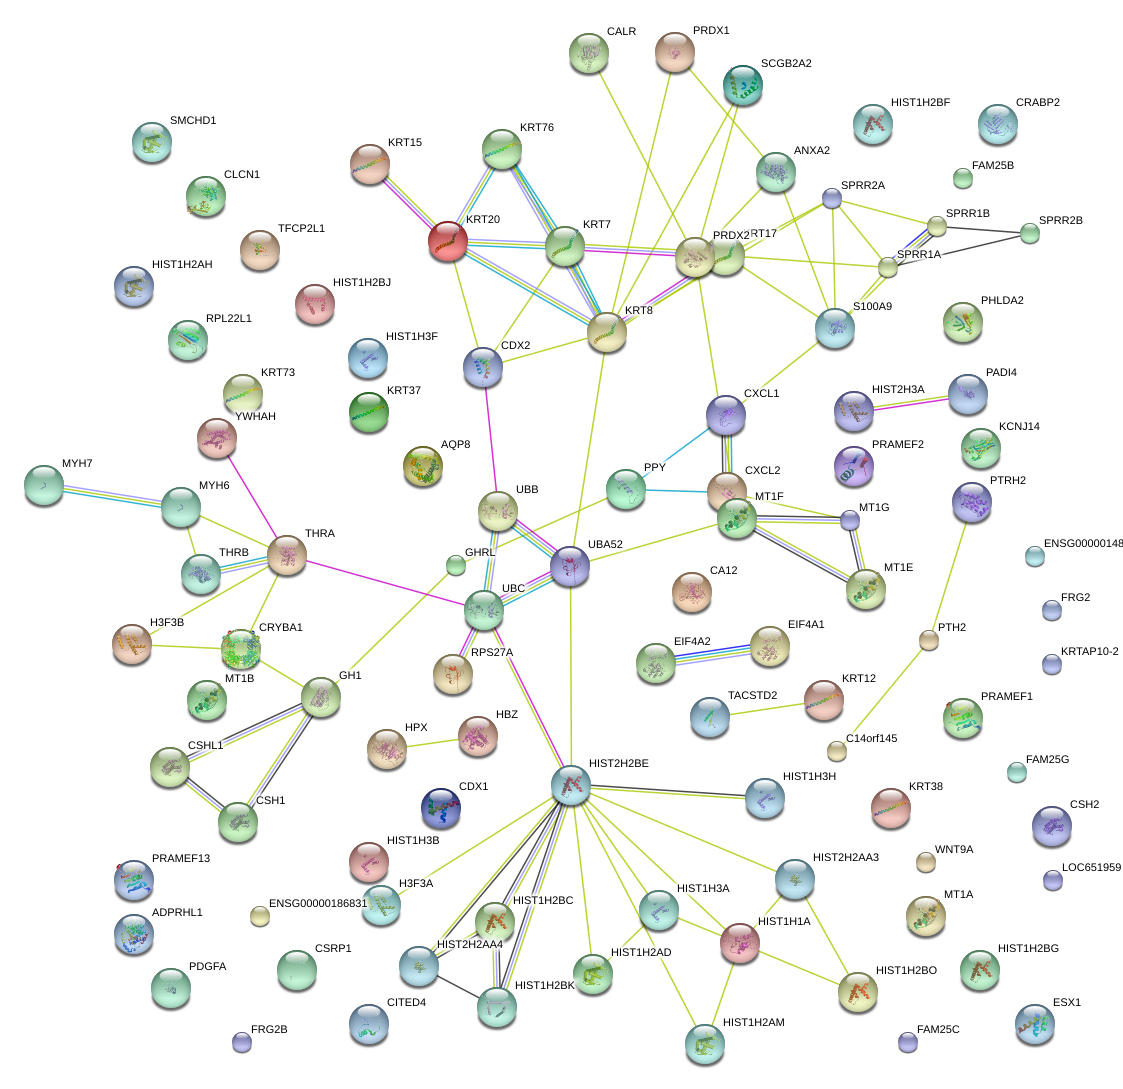
chr12_-_51585004
|
2.165
|
NM_002273
|
KRT8
|
keratin 8
|
|
chr1_+_151596953
|
1.522
|
NM_002965
|
S100A9
|
S100 calcium binding protein A9
|
|
chr4_+_74953971
|
1.497
|
NM_001511
|
CXCL1
|
chemokine (C-X-C motif) ligand 1 (melanoma growth stimulating activity, alpha)
|
|
chr1_-_151296611
|
1.135
|
NM_005988
|
SPRR2A
|
small proline-rich protein 2A
|
|
chr19_-_12773591
|
1.066
|
NM_005809
NM_181738
|
PRDX2
|
peroxiredoxin 2
|
|
chr17_-_37034288
|
1.045
|
NM_000422
|
KRT17
|
keratin 17
|
|
chr7_-_526005
|
0.952
|
NM_002607
NM_033023
|
PDGFA
|
platelet-derived growth factor alpha polypeptide
|
|
chr1_-_41100589
|
0.911
|
NM_133467
|
CITED4
|
Cbp/p300-interacting transactivator, with Glu/Asp-rich carboxy-terminal domain, 4
|
|
chr1_+_151270301
|
0.906
|
NM_003125
|
SPRR1B
|
small proline-rich protein 1B
|
|
chr21_+_44729875
|
0.894
|
|
|
|
|
chr12_-_123965099
|
0.888
|
|
UBC
|
ubiquitin C
|
|
chr17_+_24598000
|
0.881
|
NM_005208
|
CRYBA1
|
crystallin, beta A1
|
|
chr11_-_2907169
|
0.875
|
NM_003311
|
PHLDA2
|
pleckstrin homology-like domain, family A, member 2
|
|
chr4_-_75183700
|
0.868
|
|
CXCL2
|
chemokine (C-X-C motif) ligand 2
|
|
chr11_-_6418705
|
0.862
|
NM_000613
|
HPX
|
hemopexin
|
|
chr15_-_61461127
|
0.854
|
NM_001218
NM_206925
|
CA12
|
carbonic anhydrase XII
|
|
chrX_-_103386215
|
0.842
|
NM_153448
|
ESX1
|
ESX homeobox 1
|
|
chr1_+_12774132
|
0.781
|
NM_023013
|
PRAMEF1
|
PRAME family member 1
|
|
chr1_-_154941861
|
0.776
|
NM_001878
|
CRABP2
|
cellular retinoic acid binding protein 2
|
|
chr21_-_44795769
|
0.772
|
NM_198693
|
KRTAP10-2
|
keratin associated protein 10-2
|
|
chr1_+_17507276
|
0.770
|
NM_012387
|
PADI4
|
peptidyl arginine deiminase, type IV
|
|
chr17_-_71287417
|
0.758
|
NM_005324
|
H3F3B
|
H3 histone, family 3B (H3.3B)
|
|
chr17_-_36294962
|
0.755
|
NM_019010
|
KRT20
|
keratin 20
|
|
chr1_-_199732323
|
0.726
|
NM_001193572
|
CSRP1
|
cysteine and glycine-rich protein 1
|
|
chr16_+_142853
|
0.710
|
NM_005332
|
HBZ
|
hemoglobin, zeta
|
|
chr19_+_53650577
|
0.702
|
NM_013348
|
KCNJ14
|
potassium inwardly-rectifying channel, subfamily J, member 14
|
|
chr7_+_142723340
|
0.699
|
NM_000083
|
CLCN1
|
chloride channel 1, skeletal muscle
|
|
chr6_-_26232109
|
0.698
|
NM_003526
|
HIST1H2BG
HIST1H2BC
|
histone cluster 1, H2bg
histone cluster 1, H2bc
|
|
chr16_+_25135783
|
0.697
|
NM_001169
|
AQP8
|
aquaporin 8
|
|
chr15_-_61460967
|
0.681
|
|
CA12
|
carbonic anhydrase XII
|
|
chr5_+_149526533
|
0.680
|
NM_001804
|
CDX1
|
caudal type homeobox 1
|
|
chr6_-_27222556
|
0.664
|
NM_080593
|
HIST1H2BK
|
histone cluster 1, H2bk
|
|
chr22_+_30670435
|
0.649
|
NM_003405
|
YWHAH
|
tyrosine 3-monooxygenase/tryptophan 5-monooxygenase activation protein, eta polypeptide
|
|
chr12_-_51298599
|
0.641
|
NM_175068
|
KRT73
|
keratin 73
|
|
chr12_+_50913274
|
0.635
|
|
KRT7
|
keratin 7
|
|
chr19_+_12910428
|
0.623
|
|
CALR
|
calreticulin
|
|
chr17_-_39375327
|
0.621
|
NM_002722
|
PPY
|
pancreatic polypeptide
|
|
chr3_-_10307408
|
0.610
|
NM_001134941
NM_016362
|
GHRL
|
ghrelin/obestatin prepropeptide
|
|
chr19_+_12910440
|
0.609
|
|
CALR
|
calreticulin
|
|
chr17_-_59304729
|
0.597
|
NM_020991
NM_022644
NM_022645
|
CSH2
|
chorionic somatomammotropin hormone 2
|
|
chr10_-_135290288
|
0.595
|
NM_001080998
|
FRG2B
FRG2
|
FSHD region gene 2 family, member B
FSHD region gene 2
|
|
chr6_+_27222839
|
0.591
|
NM_080596
|
HIST1H2AH
|
histone cluster 1, H2ah
|
|
chr1_-_58815415
|
0.588
|
|
TACSTD2
|
tumor-associated calcium signal transducer 2
|
|
chr13_-_113155839
|
0.585
|
NM_138430
|
ADPRHL1
|
ADP-ribosylhydrolase like 1
|
|
chr17_-_36276987
|
0.582
|
NM_000223
|
KRT12
|
keratin 12
|
|
chr1_-_151310707
|
0.581
|
NM_001017418
|
SPRR2B
|
small proline-rich protein 2B
|
|
chr6_-_26358811
|
0.580
|
NM_021018
|
HIST1H3F
|
histone cluster 1, H3f
|
|
chr17_-_36834183
|
0.578
|
NM_003770
|
KRT37
|
keratin 37
|
|
chr14_-_22947320
|
0.574
|
NM_002471
|
MYH6
|
myosin, heavy chain 6, cardiac muscle, alpha
|
|
chr16_-_55259405
|
0.567
|
NM_005950
|
MT1G
|
metallothionein 1G
|
|
chr15_-_58477407
|
0.553
|
NM_001002857
NM_001002858
NM_001136015
NM_004039
|
ANXA2
|
annexin A2
|
|
chr16_+_55243311
|
0.551
|
NM_005947
|
MT1B
|
metallothionein 1B
|
|
chr6_-_26125939
|
0.549
|
NM_005325
|
HIST1H1A
|
histone cluster 1, H1a
|
|
chr10_+_47867667
|
0.542
|
NM_001137556
NM_001137549
NM_001137548
|
FAM25B
FAM25G
FAM25C
|
family with sequence similarity 25, member B
family with sequence similarity 25, member G
family with sequence similarity 25, member C
|
|
chr1_-_226202210
|
0.540
|
NM_003395
|
WNT9A
|
wingless-type MMTV integration site family, member 9A
|
|
chr1_+_148089251
|
0.537
|
NM_001040874
NM_003516
|
HIST2H2AA4
HIST2H2AA3
|
histone cluster 2, H2aa4
histone cluster 2, H2aa3
|
|
chr2_-_121759237
|
0.536
|
NM_014553
|
TFCP2L1
|
transcription factor CP2-like 1
|
|
chr3_+_187984029
|
0.535
|
NM_001967
|
EIF4A2
|
eukaryotic translation initiation factor 4A2
|
|
chr3_-_24511456
|
0.530
|
|
THRB
|
thyroid hormone receptor, beta (erythroblastic leukemia viral (v-erb-a) oncogene homolog 2, avian)
|
|
chr19_+_12910391
|
0.527
|
NM_004343
|
CALR
|
calreticulin
|
|
chr6_-_26140266
|
0.522
|
NM_003537
|
HIST1H3B
|
histone cluster 1, H3b
|
|
chr1_-_172103745
|
0.519
|
|
GAS5
|
growth arrest-specific 5 (non-protein coding)
|
|
chr12_-_51457371
|
0.517
|
NM_015848
|
KRT76
|
keratin 76
|
|
chr17_-_36928604
|
0.514
|
NM_002275
|
KRT15
|
keratin 15
|
|
chr3_-_172070641
|
0.512
|
NM_001099645
|
RPL22L1
|
ribosomal protein L22-like 1
|
|
chr10_-_46601687
|
0.510
|
NM_001137556
NM_001137549
NM_001137548
|
FAM25B
FAM25G
FAM25C
|
family with sequence similarity 25, member B
family with sequence similarity 25, member G
family with sequence similarity 25, member C
|
|
chr1_-_45760115
|
0.506
|
NM_002574
NM_181696
NM_181697
|
PRDX1
|
peroxiredoxin 1
|
|
chr11_+_61794205
|
0.501
|
NM_002411
|
SCGB2A2
|
secretoglobin, family 2A, member 2
|
|
chr19_-_54618410
|
0.500
|
NM_178449
|
PTH2
|
parathyroid hormone 2
|
|
chr12_-_123965539
|
0.494
|
NM_021009
|
UBC
|
ubiquitin C
|
|
chr17_-_59327602
|
0.494
|
NM_001317
NM_022640
NM_022641
|
CSH1
CSH2
|
chorionic somatomammotropin hormone 1 (placental lactogen)
chorionic somatomammotropin hormone 2
|
|
chr1_+_148090804
|
0.494
|
NM_021059
NM_001005464
|
HIST2H3C
HIST2H3A
|
histone cluster 2, H3c
histone cluster 2, H3a
|
|
chr21_+_44818033
|
0.487
|
NM_198687
|
KRTAP10-4
|
keratin associated protein 10-4
|
|
chr21_+_33320080
|
0.482
|
NM_005806
|
OLIG2
|
oligodendrocyte lineage transcription factor 2
|
|
chr7_+_100399623
|
0.481
|
NM_001164462
|
MUC12
|
mucin 12, cell surface associated
|
|
chr11_-_122438016
|
0.478
|
NM_006597
NM_153201
|
HSPA8
|
heat shock 70kDa protein 8
|
|
chr6_+_3009120
|
0.469
|
|
RIPK1
|
receptor (TNFRSF)-interacting serine-threonine kinase 1
|
|
chr1_-_148050534
|
0.465
|
NM_001024599
NM_001161334
|
HIST2H2BF
|
histone cluster 2, H2bf
|
|
chr5_-_141318810
|
0.463
|
NM_016580
|
PCDH12
|
protocadherin 12
|
|
chr22_+_29810981
|
0.460
|
|
SMTN
|
smoothelin
|
|
chr17_-_37144408
|
0.457
|
NM_001079870
NM_001079871
NM_177977
|
HAP1
|
huntingtin-associated protein 1
|
|
chrX_-_115508164
|
0.457
|
NM_001017978
|
CXorf61
|
chromosome X open reading frame 61
|
|
chr9_+_130354490
|
0.457
|
NM_001130438
NM_001195532
NM_003127
|
SPTAN1
|
spectrin, alpha, non-erythrocytic 1 (alpha-fodrin)
|
|
chr7_+_100399409
|
0.455
|
|
|
|
|
chr11_-_122438054
|
0.454
|
|
HSPA8
|
heat shock 70kDa protein 8
|
|
chr11_-_2863536
|
0.453
|
NM_000076
NM_001122630
NM_001122631
|
CDKN1C
|
cyclin-dependent kinase inhibitor 1C (p57, Kip2)
|
|
chr17_-_59312892
|
0.447
|
NM_002059
NM_022556
NM_022557
NM_022558
|
GH2
|
growth hormone 2
|
|
chr1_-_150599105
|
0.446
|
NM_001014342
|
FLG2
|
filaggrin family member 2
|
|
chr12_-_51360439
|
0.446
|
NM_006121
|
KRT1
|
keratin 1
|
|
chrX_-_52843112
|
0.441
|
NM_001009616
|
SPANXN5
|
SPANX family, member N5
|
|
chr11_+_2355099
|
0.440
|
|
CD81
|
CD81 molecule
|
|
chr12_-_51153788
|
0.433
|
NM_173086
|
KRT6C
|
keratin 6C
|
|
chr19_+_40465249
|
0.429
|
NM_021175
|
HAMP
|
hepcidin antimicrobial peptide
|
|
chr2_-_240728745
|
0.424
|
NM_148961
|
OTOS
|
otospiralin
|
|
chr9_+_129951552
|
0.423
|
NM_005564
|
LCN2
|
lipocalin 2
|
|
chr14_+_74815233
|
0.422
|
NM_005252
|
FOS
|
FBJ murine osteosarcoma viral oncogene homolog
|
|
chr4_-_75123193
|
0.422
|
NM_002090
|
CXCL3
|
chemokine (C-X-C motif) ligand 3
|
|
chrX_-_30237403
|
0.422
|
NM_000475
|
NR0B1
|
nuclear receptor subfamily 0, group B, member 1
|
|
chr11_+_62189354
|
0.422
|
NM_001043229
|
METTL12
|
methyltransferase like 12
|
|
chr19_-_2002222
|
0.421
|
NM_017572
NM_199054
|
MKNK2
|
MAP kinase interacting serine/threonine kinase 2
|
|
chr5_+_132037271
|
0.418
|
NM_000589
NM_172348
|
IL4
|
interleukin 4
|
|
chr12_+_8866416
|
0.417
|
NM_144670
|
A2ML1
|
alpha-2-macroglobulin-like 1
|
|
chr4_-_175680157
|
0.416
|
|
HPGD
|
hydroxyprostaglandin dehydrogenase 15-(NAD)
|
|
chr17_+_29606408
|
0.415
|
NM_002982
|
CCL2
|
chemokine (C-C motif) ligand 2
|
|
chr17_-_77386212
|
0.414
|
NM_001007533
|
DYSFIP1
|
dysferlin interacting protein 1
|
|
chr19_+_18357966
|
0.413
|
NM_004864
|
GDF15
|
growth differentiation factor 15
|
|
chr1_+_85819004
|
0.412
|
NM_001554
|
CYR61
|
cysteine-rich, angiogenic inducer, 61
|
|
chr17_+_29621352
|
0.412
|
NM_006273
|
CCL7
|
chemokine (C-C motif) ligand 7
|
|
chr1_+_184532027
|
0.411
|
NM_001127708
NM_001127709
NM_001127710
NM_005807
|
PRG4
|
proteoglycan 4
|
|
chr1_-_151630168
|
0.409
|
NM_002964
|
S100A8
|
S100 calcium binding protein A8
|
|
chr1_-_148079357
|
0.409
|
NM_021059
NM_001005464
|
HIST2H3C
HIST2H3A
|
histone cluster 2, H3c
histone cluster 2, H3a
|
|
chr11_-_102250876
|
0.409
|
NM_002426
|
MMP12
|
matrix metallopeptidase 12 (macrophage elastase)
|
|
chr17_+_53625084
|
0.402
|
NM_000502
|
EPX
|
eosinophil peroxidase
|
|
chrX_+_153339814
|
0.402
|
NM_017514
|
PLXNA3
|
plexin A3
|
|
chr1_+_42391678
|
0.402
|
NM_007102
|
GUCA2B
|
guanylate cyclase activator 2B (uroguanylin)
|
|
chr11_+_30209138
|
0.400
|
NM_000510
NM_001018080
|
FSHB
|
follicle stimulating hormone, beta polypeptide
|
|
chr19_+_54160468
|
0.398
|
|
FTL
|
ferritin, light polypeptide
|
|
chr12_-_51173238
|
0.398
|
NM_005554
|
KRT6A
|
keratin 6A
|
|
chr4_+_74825138
|
0.390
|
NM_000584
|
IL8
|
interleukin 8
|
|
chr3_+_62279707
|
0.378
|
|
C3orf14
|
chromosome 3 open reading frame 14
|
|
chr1_+_12839527
|
0.372
|
NM_023014
|
PRAMEF2
|
PRAME family member 2
|
|
chr6_+_26232351
|
0.370
|
NM_003512
|
HIST1H2AC
|
histone cluster 1, H2ac
|
|
chr12_-_87498225
|
0.369
|
NM_000899
NM_003994
|
KITLG
|
KIT ligand
|
|
chr1_-_148051859
|
0.367
|
NM_001123375
|
HIST2H3D
|
histone cluster 2, H3d
|
|
chr7_+_115650240
|
0.365
|
NM_152829
|
TES
|
testis derived transcript (3 LIM domains)
|
|
chr16_-_4794749
|
0.365
|
|
GLYR1
|
glyoxylate reductase 1 homolog (Arabidopsis)
|
|
chr11_+_64946848
|
0.365
|
|
|
|
|
chr17_-_36113502
|
0.364
|
NM_019016
|
KRT24
|
keratin 24
|
|
chr7_+_75769927
|
0.362
|
|
HSPB1
|
heat shock 27kDa protein 1
|
|
chr11_-_18226743
|
0.352
|
NM_001127380
NM_030754
|
SAA2
|
serum amyloid A2
|
|
chr6_-_27907283
|
0.352
|
NM_003541
|
HIST1H4A
HIST1H4F
HIST1H4K
HIST1H4J
|
histone cluster 1, H4a
histone cluster 1, H4f
histone cluster 1, H4k
histone cluster 1, H4j
|
|
chr11_+_2355119
|
0.347
|
NM_004356
|
CD81
|
CD81 molecule
|
|
chr11_+_64946820
|
0.347
|
|
NEAT1
|
nuclear paraspeckle assembly transcript 1 (non-protein coding)
|
|
chr16_+_2747491
|
0.346
|
|
|
|
|
chr19_+_523575
|
0.346
|
|
BSG
|
basigin (Ok blood group)
|
|
chr1_+_157824239
|
0.344
|
NM_001639
|
APCS
|
amyloid P component, serum
|
|
chr10_-_62373828
|
0.344
|
NM_014836
|
RHOBTB1
|
Rho-related BTB domain containing 1
|
|
chr12_+_12935759
|
0.343
|
|
GPRC5A
|
G protein-coupled receptor, family C, group 5, member A
|
|
chr20_+_43269051
|
0.342
|
NM_003007
|
SEMG1
|
semenogelin I
|
|
chr22_-_38045555
|
0.339
|
NM_000967
NM_001033853
|
RPL3
|
ribosomal protein L3
|
|
chr17_+_36493927
|
0.338
|
NM_033061
|
KRTAP4-7
|
keratin associated protein 4-7
|
|
chr12_-_51001407
|
0.337
|
NM_002282
|
KRT83
|
keratin 83
|
|
chr11_+_1064869
|
0.335
|
NM_002457
|
MUC2
|
mucin 2, oligomeric mucus/gel-forming
|
|
chr11_-_1026654
|
0.334
|
NM_005961
|
MUC6
|
mucin 6, oligomeric mucus/gel-forming
|
|
chr1_-_26266571
|
0.330
|
NM_032588
|
TRIM63
|
tripartite motif containing 63
|
|
chr19_+_54160369
|
0.330
|
NM_000146
|
FTL
|
ferritin, light polypeptide
|
|
chr3_+_195336625
|
0.327
|
NM_005524
|
HES1
|
hairy and enhancer of split 1, (Drosophila)
|
|
chr6_-_74287453
|
0.325
|
NM_001402
|
EEF1A1
|
eukaryotic translation elongation factor 1 alpha 1
|
|
chr17_-_77386156
|
0.320
|
|
DYSFIP1
|
dysferlin interacting protein 1
|
|
chr11_-_102001259
|
0.318
|
NM_004771
|
MMP20
|
matrix metallopeptidase 20
|
|
chr1_+_40715888
|
0.317
|
NM_198494
|
ZNF642
|
zinc finger protein 642
|
|
chr15_+_43510054
|
0.314
|
NM_032413
NM_197955
|
C15orf48
|
chromosome 15 open reading frame 48
|
|
chr19_+_12763285
|
0.313
|
|
JUNB
|
jun B proto-oncogene
|
|
chr7_+_73826244
|
0.308
|
NM_000265
|
NCF1
NCF1B
NCF1C
|
neutrophil cytosolic factor 1
neutrophil cytosolic factor 1B pseudogene
neutrophil cytosolic factor 1C pseudogene
|
|
chr21_+_43462209
|
0.308
|
NM_000394
|
CRYAA
|
crystallin, alpha A
|
|
chr11_-_5204769
|
0.307
|
NM_000518
|
HBB
|
hemoglobin, beta
|
|
chr4_+_101090648
|
0.307
|
|
LOC256880
|
hypothetical LOC256880
|
|
chr5_+_145698779
|
0.305
|
NM_002700
|
POU4F3
|
POU class 4 homeobox 3
|
|
chr4_-_75183860
|
0.304
|
NM_002089
|
CXCL2
|
chemokine (C-X-C motif) ligand 2
|
|
chr8_+_22075112
|
0.303
|
NM_001172357
NM_001172410
NM_003018
|
SFTPC
|
surfactant protein C
|
|
chr10_-_3817418
|
0.301
|
NM_001160124
NM_001160125
NM_001300
|
KLF6
|
Kruppel-like factor 6
|
|
chr4_+_75393053
|
0.299
|
NM_001013442
|
EPGN
|
epithelial mitogen homolog (mouse)
|
|
chr12_-_52187638
|
0.298
|
NM_003717
|
NPFF
|
neuropeptide FF-amide peptide precursor
|
|
chr3_+_110338250
|
0.298
|
|
FLJ22763
|
hypothetical LOC401081
|
|
chr10_+_81360646
|
0.296
|
NM_001093770
NM_001164644
NM_001164645
NM_001164646
NM_001164647
NM_005411
|
SFTPA1
|
surfactant protein A1
|
|
chrX_+_16578201
|
0.296
|
NM_004057
|
S100G
|
S100 calcium binding protein G
|
|
chr1_-_202402043
|
0.295
|
NM_000537
|
REN
|
renin
|
|
chr5_-_140033310
|
0.292
|
NM_194249
|
DND1
|
dead end homolog 1 (zebrafish)
|
|
chr6_-_50025115
|
0.292
|
NM_001166478
|
DEFB133
|
defensin, beta 133
|
|
chr9_+_139255563
|
0.290
|
|
TUBB2C
|
tubulin, beta 2C
|
|
chr12_-_51476047
|
0.289
|
NM_057088
|
KRT3
|
keratin 3
|
|
chrX_+_118486419
|
0.287
|
|
SLC25A5
|
solute carrier family 25 (mitochondrial carrier; adenine nucleotide translocator), member 5
|
|
chr9_-_135074364
|
0.283
|
NM_014581
|
OBP2B
OBP2A
|
odorant binding protein 2B
odorant binding protein 2A
|
|
chr18_+_55038369
|
0.283
|
NM_001012512
NM_001012513
NM_002091
|
GRP
|
gastrin-releasing peptide
|
|
chr2_+_107969410
|
0.282
|
NM_021815
|
SLC5A7
|
solute carrier family 5 (choline transporter), member 7
|
|
chr15_+_39008822
|
0.282
|
NM_019074
|
DLL4
|
delta-like 4 (Drosophila)
|
|
chr11_+_18244383
|
0.280
|
NM_000331
NM_001178006
NM_199161
|
SAA1
|
serum amyloid A1
|
|
chr10_-_44794146
|
0.279
|
NM_007021
|
C10orf10
|
chromosome 10 open reading frame 10
|
|
chr6_+_33280396
|
0.278
|
NM_014234
|
HSD17B8
|
hydroxysteroid (17-beta) dehydrogenase 8
|
|
chr19_+_54160399
|
0.276
|
|
FTL
|
ferritin, light polypeptide
|
|
chr19_-_51856129
|
0.276
|
NM_145056
|
DACT3
|
dapper, antagonist of beta-catenin, homolog 3 (Xenopus laevis)
|
|
chr6_-_74287483
|
0.275
|
|
EEF1A1
|
eukaryotic translation elongation factor 1 alpha 1
|
|
chr6_+_31791063
|
0.275
|
NM_021246
|
LY6G6D
|
lymphocyte antigen 6 complex, locus G6D
|
|
chr6_-_2848460
|
0.275
|
NM_004155
|
SERPINB9
|
serpin peptidase inhibitor, clade B (ovalbumin), member 9
|
|
chr9_+_33785558
|
0.270
|
NM_002771
|
PRSS3
|
protease, serine, 3
|
|
chr17_-_10362583
|
0.268
|
NM_005963
|
MYH1
|
myosin, heavy chain 1, skeletal muscle, adult
|
|
chr1_-_150805852
|
0.268
|
NM_178435
|
LCE3E
|
late cornified envelope 3E
|
|
chr15_-_32875040
|
0.267
|
NM_005159
|
ACTC1
|
actin, alpha, cardiac muscle 1
|
|
chr8_+_23016271
|
0.264
|
NM_003841
|
TNFRSF10C
|
tumor necrosis factor receptor superfamily, member 10c, decoy without an intracellular domain
|
|
chr20_+_36365965
|
0.263
|
NM_001725
|
BPI
|
bactericidal/permeability-increasing protein
|
|
chr8_+_70567634
|
0.263
|
|
SULF1
|
sulfatase 1
|
|
chr9_+_138677197
|
0.259
|
NM_201446
NM_016215
|
EGFL7
|
EGF-like-domain, multiple 7
|
|
chr11_-_76059435
|
0.259
|
NM_001128922
|
LRRC32
|
leucine rich repeat containing 32
|
|
chr5_+_179180695
|
0.259
|
|
SQSTM1
|
sequestosome 1
|
|
chr1_-_117554999
|
0.258
|
NM_024626
|
VTCN1
|
V-set domain containing T cell activation inhibitor 1
|
|
chr11_-_102219450
|
0.255
|
NM_002422
|
MMP3
|
matrix metallopeptidase 3 (stromelysin 1, progelatinase)
|
|
chr16_-_87378872
|
0.254
|
NM_001142864
|
FAM38A
|
family with sequence similarity 38, member A
|
|
chr15_+_72828235
|
0.253
|
NM_000761
|
CYP1A2
|
cytochrome P450, family 1, subfamily A, polypeptide 2
|
|
chr12_-_51047521
|
0.253
|
NM_002283
|
KRT85
|
keratin 85
|
|
chr19_-_11452439
|
0.253
|
NM_001420
NM_032281
|
ELAVL3
|
ELAV (embryonic lethal, abnormal vision, Drosophila)-like 3 (Hu antigen C)
|