Project
ENCODE cell lines, expression (Ernst 2011)
Navigation
Downloads
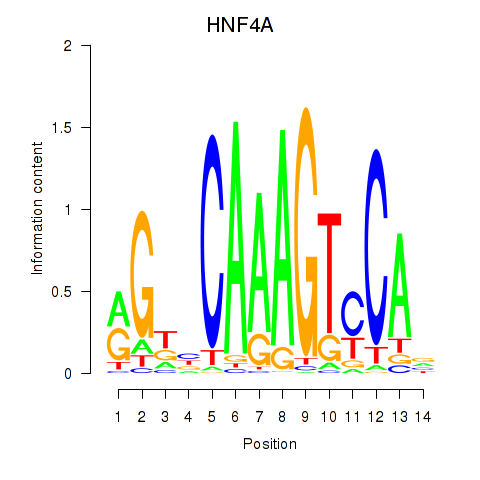
Results for HNF4A
Z-value: 2.25
Motif logo
Transcription factors associated with HNF4A
| Gene Symbol | Gene ID | Gene Info |
|---|---|---|
|
HNF4A
|
ENSG00000101076.12 | HNF4A |
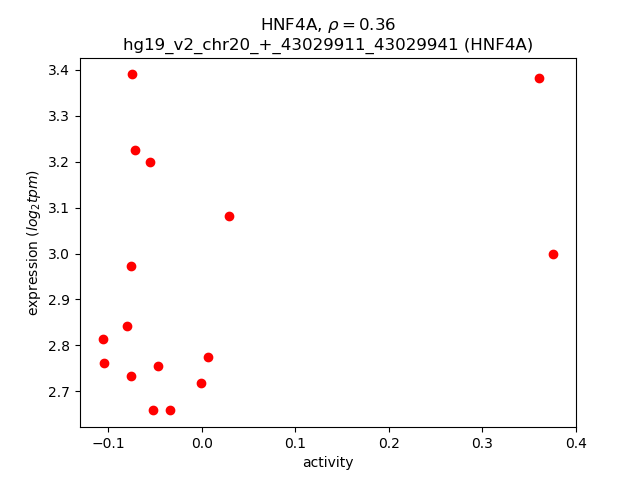
Activity-expression correlation:
| Gene | Promoter | Pearson corr. coef. | P-value | Plot |
|---|---|---|---|---|
| HNF4A | hg19_v2_chr20_+_43029911_43029941 | 0.36 | 1.7e-01 | Click! |
Activity profile of HNF4A motif
Sorted Z-values of HNF4A motif
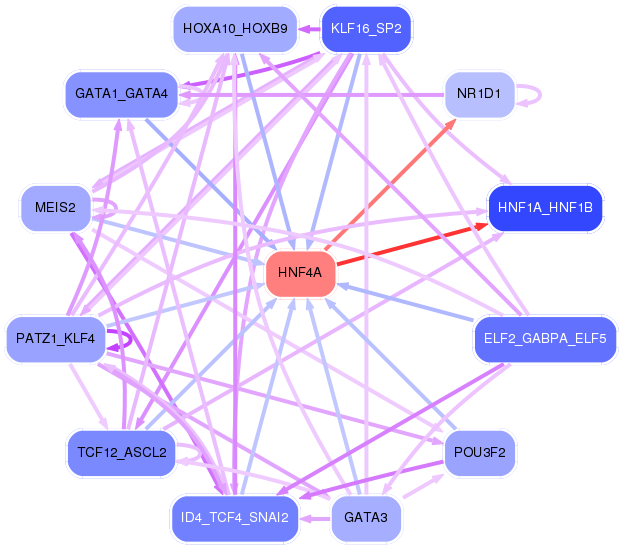
Network of associatons between targets according to the STRING database.

First level regulatory network of HNF4A
| Promoter | Score | Transcript | Gene | Gene Info |
|---|---|---|---|---|
| chr6_+_31949801 | 10.25 |
ENST00000428956.2 ENST00000498271.1 |
C4A |
complement component 4A (Rodgers blood group) |
| chr6_+_31982539 | 10.01 |
ENST00000435363.2 ENST00000425700.2 |
C4B |
complement component 4B (Chido blood group) |
| chr5_-_42812143 | 9.94 |
ENST00000514985.1 |
SEPP1 |
selenoprotein P, plasma, 1 |
| chr5_-_42811986 | 9.86 |
ENST00000511224.1 ENST00000507920.1 ENST00000510965.1 |
SEPP1 |
selenoprotein P, plasma, 1 |
| chr17_-_7082668 | 9.73 |
ENST00000573083.1 ENST00000574388.1 |
ASGR1 |
asialoglycoprotein receptor 1 |
| chr2_-_21266935 | 9.72 |
ENST00000233242.1 |
APOB |
apolipoprotein B |
| chr17_+_27369918 | 9.12 |
ENST00000323372.4 |
PIPOX |
pipecolic acid oxidase |
| chr17_-_7082861 | 8.94 |
ENST00000269299.3 |
ASGR1 |
asialoglycoprotein receptor 1 |
| chr1_-_161193349 | 8.78 |
ENST00000469730.2 ENST00000463273.1 ENST00000464492.1 ENST00000367990.3 ENST00000470459.2 ENST00000468465.1 ENST00000463812.1 |
APOA2 |
apolipoprotein A-II |
| chr19_+_45449228 | 8.47 |
ENST00000252490.4 |
APOC2 |
apolipoprotein C-II |
| chr19_+_45449301 | 8.47 |
ENST00000591597.1 |
APOC2 |
apolipoprotein C-II |
| chr19_+_45449266 | 8.25 |
ENST00000592257.1 |
APOC2 |
apolipoprotein C-II |
| chr6_+_30130969 | 8.08 |
ENST00000376694.4 |
TRIM15 |
tripartite motif containing 15 |
| chr12_+_53497263 | 7.91 |
ENST00000551896.1 ENST00000301466.3 |
SOAT2 |
sterol O-acyltransferase 2 |
| chr13_+_113777105 | 7.87 |
ENST00000409306.1 ENST00000375551.3 ENST00000375559.3 |
F10 |
coagulation factor X |
| chr17_+_4675175 | 7.23 |
ENST00000270560.3 |
TM4SF5 |
transmembrane 4 L six family member 5 |
| chr7_+_45927956 | 7.18 |
ENST00000275525.3 ENST00000457280.1 |
IGFBP1 |
insulin-like growth factor binding protein 1 |
| chr7_+_45928079 | 6.99 |
ENST00000468955.1 |
IGFBP1 |
insulin-like growth factor binding protein 1 |
| chr20_+_56136136 | 6.84 |
ENST00000319441.4 ENST00000543666.1 |
PCK1 |
phosphoenolpyruvate carboxykinase 1 (soluble) |
| chr19_+_18496957 | 6.50 |
ENST00000252809.3 |
GDF15 |
growth differentiation factor 15 |
| chr16_-_16317321 | 5.69 |
ENST00000205557.7 ENST00000575728.1 |
ABCC6 |
ATP-binding cassette, sub-family C (CFTR/MRP), member 6 |
| chr1_+_145727681 | 5.63 |
ENST00000417171.1 ENST00000451928.2 |
PDZK1 |
PDZ domain containing 1 |
| chr16_+_8768422 | 5.20 |
ENST00000268251.8 ENST00000564714.1 |
ABAT |
4-aminobutyrate aminotransferase |
| chr17_+_41052808 | 4.78 |
ENST00000592383.1 ENST00000253801.2 ENST00000585489.1 |
G6PC |
glucose-6-phosphatase, catalytic subunit |
| chr1_+_78511586 | 4.14 |
ENST00000370759.3 |
GIPC2 |
GIPC PDZ domain containing family, member 2 |
| chr17_+_1646130 | 4.03 |
ENST00000453066.1 ENST00000324015.3 ENST00000450523.2 ENST00000453723.1 ENST00000382061.4 |
SERPINF2 |
serpin peptidase inhibitor, clade F (alpha-2 antiplasmin, pigment epithelium derived factor), member 2 |
| chr4_+_113152978 | 3.70 |
ENST00000309703.6 |
AP1AR |
adaptor-related protein complex 1 associated regulatory protein |
| chr3_-_194072019 | 3.64 |
ENST00000429275.1 ENST00000323830.3 |
CPN2 |
carboxypeptidase N, polypeptide 2 |
| chr13_+_76334567 | 3.64 |
ENST00000321797.8 |
LMO7 |
LIM domain 7 |
| chr13_+_76334795 | 3.48 |
ENST00000526202.1 ENST00000465261.2 |
LMO7 |
LIM domain 7 |
| chr2_+_241544834 | 3.47 |
ENST00000319838.5 ENST00000403859.1 ENST00000438013.2 |
GPR35 |
G protein-coupled receptor 35 |
| chr16_+_29690358 | 3.44 |
ENST00000395384.4 ENST00000562473.1 |
QPRT |
quinolinate phosphoribosyltransferase |
| chr4_+_113152881 | 3.22 |
ENST00000274000.5 |
AP1AR |
adaptor-related protein complex 1 associated regulatory protein |
| chr14_-_39572279 | 2.96 |
ENST00000536508.1 |
SEC23A |
Sec23 homolog A (S. cerevisiae) |
| chr19_+_35629702 | 2.93 |
ENST00000351325.4 |
FXYD1 |
FXYD domain containing ion transport regulator 1 |
| chr19_+_35630022 | 2.92 |
ENST00000589209.1 |
FXYD1 |
FXYD domain containing ion transport regulator 1 |
| chr12_-_51422017 | 2.91 |
ENST00000394904.3 |
SLC11A2 |
solute carrier family 11 (proton-coupled divalent metal ion transporter), member 2 |
| chr14_-_39572345 | 2.90 |
ENST00000548032.2 ENST00000556092.1 ENST00000557280.1 ENST00000545328.2 ENST00000553970.1 |
SEC23A |
Sec23 homolog A (S. cerevisiae) |
| chr16_-_87970122 | 2.77 |
ENST00000309893.2 |
CA5A |
carbonic anhydrase VA, mitochondrial |
| chr6_-_32145861 | 2.51 |
ENST00000336984.6 |
AGPAT1 |
1-acylglycerol-3-phosphate O-acyltransferase 1 |
| chr6_+_32146131 | 2.39 |
ENST00000375094.3 |
RNF5 |
ring finger protein 5, E3 ubiquitin protein ligase |
| chr4_-_10023095 | 2.38 |
ENST00000264784.3 |
SLC2A9 |
solute carrier family 2 (facilitated glucose transporter), member 9 |
| chr6_-_86099898 | 2.32 |
ENST00000455071.1 |
RP11-30P6.6 |
RP11-30P6.6 |
| chr19_-_36304201 | 2.30 |
ENST00000301175.3 |
PRODH2 |
proline dehydrogenase (oxidase) 2 |
| chr6_+_30131318 | 2.30 |
ENST00000376688.1 |
TRIM15 |
tripartite motif containing 15 |
| chr3_+_124303539 | 2.26 |
ENST00000428018.2 |
KALRN |
kalirin, RhoGEF kinase |
| chr19_-_10687948 | 2.18 |
ENST00000592285.1 |
AP1M2 |
adaptor-related protein complex 1, mu 2 subunit |
| chr12_+_121416489 | 2.17 |
ENST00000541395.1 ENST00000544413.1 |
HNF1A |
HNF1 homeobox A |
| chr10_+_104404218 | 2.14 |
ENST00000302424.7 |
TRIM8 |
tripartite motif containing 8 |
| chr22_+_25003626 | 2.05 |
ENST00000451366.1 ENST00000406383.2 ENST00000428855.1 |
GGT1 |
gamma-glutamyltransferase 1 |
| chr1_-_60392452 | 1.94 |
ENST00000371204.3 |
CYP2J2 |
cytochrome P450, family 2, subfamily J, polypeptide 2 |
| chr3_+_123813543 | 1.81 |
ENST00000360013.3 |
KALRN |
kalirin, RhoGEF kinase |
| chr17_-_27503770 | 1.65 |
ENST00000533112.1 |
MYO18A |
myosin XVIIIA |
| chr19_-_10687983 | 1.63 |
ENST00000587069.1 |
AP1M2 |
adaptor-related protein complex 1, mu 2 subunit |
| chr2_+_159313452 | 1.63 |
ENST00000389757.3 ENST00000389759.3 |
PKP4 |
plakophilin 4 |
| chr3_-_125775629 | 1.61 |
ENST00000383598.2 |
SLC41A3 |
solute carrier family 41, member 3 |
| chr10_-_116444371 | 1.49 |
ENST00000533213.2 ENST00000369252.4 |
ABLIM1 |
actin binding LIM protein 1 |
| chr19_-_41256207 | 1.47 |
ENST00000598485.2 ENST00000470681.1 ENST00000339153.3 ENST00000598729.1 |
C19orf54 |
chromosome 19 open reading frame 54 |
| chr2_-_219134822 | 1.34 |
ENST00000444053.1 ENST00000248450.4 |
AAMP |
angio-associated, migratory cell protein |
| chr2_-_219134343 | 1.29 |
ENST00000447885.1 ENST00000420660.1 |
AAMP |
angio-associated, migratory cell protein |
| chr2_-_39348137 | 1.28 |
ENST00000426016.1 |
SOS1 |
son of sevenless homolog 1 (Drosophila) |
| chr19_+_11546093 | 1.24 |
ENST00000591462.1 |
PRKCSH |
protein kinase C substrate 80K-H |
| chr17_-_38256973 | 1.21 |
ENST00000246672.3 |
NR1D1 |
nuclear receptor subfamily 1, group D, member 1 |
| chr8_+_22436635 | 1.20 |
ENST00000452226.1 ENST00000397760.4 ENST00000339162.7 ENST00000397761.2 |
PDLIM2 |
PDZ and LIM domain 2 (mystique) |
| chr12_+_121416340 | 1.10 |
ENST00000257555.6 ENST00000400024.2 |
HNF1A |
HNF1 homeobox A |
| chr2_+_73441350 | 1.09 |
ENST00000389501.4 |
SMYD5 |
SMYD family member 5 |
| chr19_+_11546153 | 1.08 |
ENST00000591946.1 ENST00000252455.2 ENST00000412601.1 |
PRKCSH |
protein kinase C substrate 80K-H |
| chr6_+_43739697 | 1.03 |
ENST00000230480.6 |
VEGFA |
vascular endothelial growth factor A |
| chr14_+_23790655 | 1.02 |
ENST00000397276.2 |
PABPN1 |
poly(A) binding protein, nuclear 1 |
| chr12_-_6665200 | 1.00 |
ENST00000336604.4 ENST00000396840.2 ENST00000356896.4 |
IFFO1 |
intermediate filament family orphan 1 |
| chr11_-_65381643 | 0.97 |
ENST00000309100.3 ENST00000529839.1 ENST00000526293.1 |
MAP3K11 |
mitogen-activated protein kinase kinase kinase 11 |
| chr22_-_31063782 | 0.96 |
ENST00000404885.1 ENST00000403268.1 ENST00000407308.1 ENST00000342474.4 ENST00000334679.3 |
DUSP18 |
dual specificity phosphatase 18 |
| chr14_+_39735411 | 0.95 |
ENST00000603904.1 |
RP11-407N17.3 |
cTAGE family member 5 isoform 4 |
| chr6_+_143999072 | 0.91 |
ENST00000440869.2 ENST00000367582.3 ENST00000451827.2 |
PHACTR2 |
phosphatase and actin regulator 2 |
| chr11_-_63536113 | 0.89 |
ENST00000433688.1 ENST00000546282.2 |
C11orf95 RP11-466C23.4 |
chromosome 11 open reading frame 95 RP11-466C23.4 |
| chr17_-_2614927 | 0.89 |
ENST00000435359.1 |
CLUH |
clustered mitochondria (cluA/CLU1) homolog |
| chr3_+_63897605 | 0.85 |
ENST00000487717.1 |
ATXN7 |
ataxin 7 |
| chr19_+_11546440 | 0.85 |
ENST00000589126.1 ENST00000588269.1 ENST00000587509.1 ENST00000592741.1 ENST00000593101.1 ENST00000587327.1 |
PRKCSH |
protein kinase C substrate 80K-H |
| chr17_+_44039704 | 0.83 |
ENST00000420682.2 ENST00000415613.2 ENST00000571987.1 ENST00000574436.1 ENST00000431008.3 |
MAPT |
microtubule-associated protein tau |
| chr17_-_44896047 | 0.77 |
ENST00000225512.5 |
WNT3 |
wingless-type MMTV integration site family, member 3 |
| chr3_+_37284824 | 0.70 |
ENST00000431105.1 |
GOLGA4 |
golgin A4 |
| chr3_+_63898275 | 0.67 |
ENST00000538065.1 |
ATXN7 |
ataxin 7 |
| chr16_-_47007545 | 0.65 |
ENST00000317089.5 |
DNAJA2 |
DnaJ (Hsp40) homolog, subfamily A, member 2 |
| chr1_+_94884023 | 0.65 |
ENST00000315713.5 |
ABCD3 |
ATP-binding cassette, sub-family D (ALD), member 3 |
| chr1_+_180601139 | 0.65 |
ENST00000367590.4 ENST00000367589.3 |
XPR1 |
xenotropic and polytropic retrovirus receptor 1 |
| chr19_-_10687907 | 0.61 |
ENST00000589348.1 |
AP1M2 |
adaptor-related protein complex 1, mu 2 subunit |
| chr7_-_15601595 | 0.61 |
ENST00000342526.3 |
AGMO |
alkylglycerol monooxygenase |
| chrX_+_65382381 | 0.58 |
ENST00000519389.1 |
HEPH |
hephaestin |
| chr2_-_28113217 | 0.55 |
ENST00000444339.2 |
RBKS |
ribokinase |
| chr14_+_100485712 | 0.55 |
ENST00000544450.2 |
EVL |
Enah/Vasp-like |
| chr19_+_39881951 | 0.53 |
ENST00000315588.5 ENST00000594368.1 ENST00000599213.2 ENST00000596297.1 |
MED29 |
mediator complex subunit 29 |
| chr5_-_32444828 | 0.53 |
ENST00000265069.8 |
ZFR |
zinc finger RNA binding protein |
| chr12_-_54121261 | 0.49 |
ENST00000549784.1 ENST00000262059.4 |
CALCOCO1 |
calcium binding and coiled-coil domain 1 |
| chr12_+_56114189 | 0.48 |
ENST00000548082.1 |
RDH5 |
retinol dehydrogenase 5 (11-cis/9-cis) |
| chr12_+_56114151 | 0.46 |
ENST00000547072.1 ENST00000552930.1 ENST00000257895.5 |
RDH5 |
retinol dehydrogenase 5 (11-cis/9-cis) |
| chr1_+_110163202 | 0.45 |
ENST00000531203.1 ENST00000256578.3 |
AMPD2 |
adenosine monophosphate deaminase 2 |
| chr15_-_63448973 | 0.43 |
ENST00000462430.1 |
RPS27L |
ribosomal protein S27-like |
| chr10_+_96698406 | 0.41 |
ENST00000260682.6 |
CYP2C9 |
cytochrome P450, family 2, subfamily C, polypeptide 9 |
| chr12_-_54121212 | 0.40 |
ENST00000548263.1 ENST00000430117.2 ENST00000550804.1 ENST00000549173.1 ENST00000551900.1 ENST00000546619.1 ENST00000548177.1 ENST00000549349.1 |
CALCOCO1 |
calcium binding and coiled-coil domain 1 |
| chr3_+_37284668 | 0.40 |
ENST00000361924.2 ENST00000444882.1 ENST00000356847.4 ENST00000450863.2 ENST00000429018.1 |
GOLGA4 |
golgin A4 |
| chr19_+_4639514 | 0.40 |
ENST00000327473.4 |
TNFAIP8L1 |
tumor necrosis factor, alpha-induced protein 8-like 1 |
| chr7_+_33765593 | 0.38 |
ENST00000311067.3 |
RP11-89N17.1 |
HCG1643653; Uncharacterized protein |
| chr10_+_102106829 | 0.37 |
ENST00000370355.2 |
SCD |
stearoyl-CoA desaturase (delta-9-desaturase) |
| chr1_-_15911510 | 0.34 |
ENST00000375826.3 |
AGMAT |
agmatine ureohydrolase (agmatinase) |
| chr2_-_43019698 | 0.33 |
ENST00000431905.1 ENST00000294973.6 |
HAAO |
3-hydroxyanthranilate 3,4-dioxygenase |
| chr14_+_23790690 | 0.30 |
ENST00000556821.1 |
PABPN1 |
poly(A) binding protein, nuclear 1 |
| chr11_+_119056178 | 0.30 |
ENST00000525131.1 ENST00000531114.1 ENST00000355547.5 ENST00000322712.4 |
PDZD3 |
PDZ domain containing 3 |
| chr9_+_139839686 | 0.26 |
ENST00000371634.2 |
C8G |
complement component 8, gamma polypeptide |
| chr4_+_109541772 | 0.25 |
ENST00000506397.1 ENST00000394668.2 |
RPL34 |
ribosomal protein L34 |
| chr20_+_62694461 | 0.24 |
ENST00000343484.5 ENST00000395053.3 |
TCEA2 |
transcription elongation factor A (SII), 2 |
| chr12_+_109273806 | 0.24 |
ENST00000228476.3 ENST00000547768.1 |
DAO |
D-amino-acid oxidase |
| chr20_-_36661826 | 0.23 |
ENST00000373448.2 ENST00000373447.3 |
TTI1 |
TELO2 interacting protein 1 |
| chr15_+_50716576 | 0.23 |
ENST00000560297.1 ENST00000307179.4 ENST00000396444.3 ENST00000433963.1 ENST00000425032.3 |
USP8 |
ubiquitin specific peptidase 8 |
| chr9_+_139839711 | 0.23 |
ENST00000224181.3 |
C8G |
complement component 8, gamma polypeptide |
| chr19_-_49339080 | 0.20 |
ENST00000595764.1 |
HSD17B14 |
hydroxysteroid (17-beta) dehydrogenase 14 |
| chrX_-_77041685 | 0.19 |
ENST00000373344.5 ENST00000395603.3 |
ATRX |
alpha thalassemia/mental retardation syndrome X-linked |
| chr13_+_52586517 | 0.18 |
ENST00000523764.1 ENST00000521508.1 |
ALG11 |
ALG11, alpha-1,2-mannosyltransferase |
| chr6_-_33385854 | 0.18 |
ENST00000488478.1 |
CUTA |
cutA divalent cation tolerance homolog (E. coli) |
| chr6_-_33385655 | 0.18 |
ENST00000440279.3 ENST00000607266.1 |
CUTA |
cutA divalent cation tolerance homolog (E. coli) |
| chr6_+_43265992 | 0.18 |
ENST00000449231.1 ENST00000372589.3 ENST00000372585.5 |
SLC22A7 |
solute carrier family 22 (organic anion transporter), member 7 |
| chr19_+_1205740 | 0.17 |
ENST00000326873.7 |
STK11 |
serine/threonine kinase 11 |
| chr1_-_167059830 | 0.16 |
ENST00000367868.3 |
GPA33 |
glycoprotein A33 (transmembrane) |
| chr1_+_94883991 | 0.15 |
ENST00000370214.4 |
ABCD3 |
ATP-binding cassette, sub-family D (ALD), member 3 |
| chr6_+_43266063 | 0.15 |
ENST00000372574.3 |
SLC22A7 |
solute carrier family 22 (organic anion transporter), member 7 |
| chr6_-_33385823 | 0.15 |
ENST00000494751.1 ENST00000374496.3 |
CUTA |
cutA divalent cation tolerance homolog (E. coli) |
| chr2_-_62733476 | 0.14 |
ENST00000335390.5 |
TMEM17 |
transmembrane protein 17 |
| chr17_+_48423453 | 0.12 |
ENST00000017003.2 ENST00000509778.1 ENST00000507602.1 |
XYLT2 |
xylosyltransferase II |
| chr12_+_121163538 | 0.12 |
ENST00000242592.4 |
ACADS |
acyl-CoA dehydrogenase, C-2 to C-3 short chain |
| chr6_+_46761118 | 0.10 |
ENST00000230588.4 |
MEP1A |
meprin A, alpha (PABA peptide hydrolase) |
| chr6_+_31926857 | 0.10 |
ENST00000375394.2 ENST00000544581.1 |
SKIV2L |
superkiller viralicidic activity 2-like (S. cerevisiae) |
| chrX_+_118108601 | 0.10 |
ENST00000371628.3 |
LONRF3 |
LON peptidase N-terminal domain and ring finger 3 |
| chr1_-_155271213 | 0.09 |
ENST00000342741.4 |
PKLR |
pyruvate kinase, liver and RBC |
| chr6_-_31864977 | 0.09 |
ENST00000395728.3 ENST00000375528.4 |
EHMT2 |
euchromatic histone-lysine N-methyltransferase 2 |
| chr7_-_37956409 | 0.08 |
ENST00000436072.2 |
SFRP4 |
secreted frizzled-related protein 4 |
| chr1_+_43855560 | 0.07 |
ENST00000562955.1 |
SZT2 |
seizure threshold 2 homolog (mouse) |
| chr1_-_43855444 | 0.07 |
ENST00000372455.4 |
MED8 |
mediator complex subunit 8 |
| chrX_+_118108571 | 0.07 |
ENST00000304778.7 |
LONRF3 |
LON peptidase N-terminal domain and ring finger 3 |
| chr2_-_228244013 | 0.04 |
ENST00000304568.3 |
TM4SF20 |
transmembrane 4 L six family member 20 |
| chr11_+_74870818 | 0.02 |
ENST00000525845.1 ENST00000534186.1 ENST00000428359.2 |
SLCO2B1 |
solute carrier organic anion transporter family, member 2B1 |
| chr3_-_187009646 | 0.02 |
ENST00000296280.6 ENST00000392470.2 ENST00000169293.6 ENST00000439271.1 ENST00000392472.2 ENST00000392475.2 |
MASP1 |
mannan-binding lectin serine peptidase 1 (C4/C2 activating component of Ra-reactive factor) |
| chr15_-_41120896 | 0.01 |
ENST00000299174.5 ENST00000427255.2 |
PPP1R14D |
protein phosphatase 1, regulatory (inhibitor) subunit 14D |
| chr4_+_109541740 | 0.01 |
ENST00000394665.1 |
RPL34 |
ribosomal protein L34 |
| chr1_+_94883931 | 0.00 |
ENST00000394233.2 ENST00000454898.2 ENST00000536817.1 |
ABCD3 |
ATP-binding cassette, sub-family D (ALD), member 3 |
| chr13_+_50656307 | 0.00 |
ENST00000378180.4 |
DLEU1 |
deleted in lymphocytic leukemia 1 (non-protein coding) |
Gene Ontology Analysis
Gene overrepresentation in molecular_function category:
| Log-likelihood per target | Total log-likelihood | Term | Description |
|---|---|---|---|
| 5.0 | 25.2 | GO:0060230 | lipoprotein lipase activator activity(GO:0060230) |
| 2.4 | 9.7 | GO:0035473 | lipase binding(GO:0035473) |
| 2.3 | 18.7 | GO:0004873 | asialoglycoprotein receptor activity(GO:0004873) |
| 2.3 | 6.8 | GO:0004611 | phosphoenolpyruvate carboxykinase activity(GO:0004611) phosphoenolpyruvate carboxykinase (GTP) activity(GO:0004613) |
| 2.2 | 8.8 | GO:0070653 | high-density lipoprotein particle receptor binding(GO:0070653) |
| 1.7 | 6.9 | GO:0035650 | AP-1 adaptor complex binding(GO:0035650) |
| 1.5 | 9.1 | GO:0016647 | oxidoreductase activity, acting on the CH-NH group of donors, oxygen as acceptor(GO:0016647) |
| 1.4 | 5.6 | GO:0005124 | scavenger receptor binding(GO:0005124) |
| 1.3 | 5.2 | GO:0032145 | 4-aminobutyrate transaminase activity(GO:0003867) succinate-semialdehyde dehydrogenase binding(GO:0032145) (S)-3-amino-2-methylpropionate transaminase activity(GO:0047298) |
| 1.3 | 14.2 | GO:0031995 | insulin-like growth factor II binding(GO:0031995) |
| 1.3 | 10.3 | GO:0001849 | complement component C1q binding(GO:0001849) |
| 1.2 | 4.8 | GO:0050309 | glucose-6-phosphatase activity(GO:0004346) sugar-terminal-phosphatase activity(GO:0050309) |
| 1.1 | 3.4 | GO:0004514 | nicotinate-nucleotide diphosphorylase (carboxylating) activity(GO:0004514) |
| 0.6 | 2.9 | GO:0015639 | cadmium ion transmembrane transporter activity(GO:0015086) cobalt ion transmembrane transporter activity(GO:0015087) lead ion transmembrane transporter activity(GO:0015094) ferrous iron uptake transmembrane transporter activity(GO:0015639) |
| 0.6 | 2.3 | GO:0004657 | proline dehydrogenase activity(GO:0004657) |
| 0.5 | 5.7 | GO:0043225 | anion transmembrane-transporting ATPase activity(GO:0043225) |
| 0.4 | 10.5 | GO:0001848 | complement binding(GO:0001848) |
| 0.3 | 3.5 | GO:0016494 | C-X-C chemokine receptor activity(GO:0016494) |
| 0.2 | 1.0 | GO:0004706 | JUN kinase kinase kinase activity(GO:0004706) |
| 0.2 | 2.3 | GO:0015143 | urate transmembrane transporter activity(GO:0015143) salt transmembrane transporter activity(GO:1901702) |
| 0.2 | 5.4 | GO:0000062 | fatty-acyl-CoA binding(GO:0000062) |
| 0.2 | 0.8 | GO:0099609 | microtubule lateral binding(GO:0099609) |
| 0.2 | 2.4 | GO:1904264 | ubiquitin protein ligase activity involved in ERAD pathway(GO:1904264) |
| 0.2 | 1.0 | GO:0043183 | vascular endothelial growth factor receptor 1 binding(GO:0043183) |
| 0.2 | 2.8 | GO:0004089 | carbonate dehydratase activity(GO:0004089) |
| 0.2 | 0.6 | GO:0000822 | inositol hexakisphosphate binding(GO:0000822) |
| 0.1 | 2.1 | GO:0036374 | glutathione hydrolase activity(GO:0036374) |
| 0.1 | 3.4 | GO:0030676 | Rac guanyl-nucleotide exchange factor activity(GO:0030676) |
| 0.1 | 0.4 | GO:0004768 | stearoyl-CoA 9-desaturase activity(GO:0004768) acyl-CoA desaturase activity(GO:0016215) |
| 0.1 | 3.6 | GO:0004181 | metallocarboxypeptidase activity(GO:0004181) |
| 0.1 | 0.8 | GO:0005324 | long-chain fatty acid transporter activity(GO:0005324) |
| 0.1 | 5.8 | GO:0017080 | sodium channel regulator activity(GO:0017080) |
| 0.1 | 6.1 | GO:0005160 | transforming growth factor beta receptor binding(GO:0005160) |
| 0.1 | 0.6 | GO:0016714 | oxidoreductase activity, acting on paired donors, with incorporation or reduction of molecular oxygen, reduced pteridine as one donor, and incorporation of one atom of oxygen(GO:0016714) |
| 0.1 | 1.2 | GO:0001222 | transcription corepressor binding(GO:0001222) |
| 0.1 | 1.4 | GO:0042171 | 1-acylglycerol-3-phosphate O-acyltransferase activity(GO:0003841) lysophosphatidic acid acyltransferase activity(GO:0042171) lysophospholipid acyltransferase activity(GO:0071617) |
| 0.1 | 1.0 | GO:0017017 | MAP kinase tyrosine/serine/threonine phosphatase activity(GO:0017017) |
| 0.1 | 0.2 | GO:0015616 | DNA translocase activity(GO:0015616) |
| 0.1 | 0.2 | GO:0000026 | alpha-1,2-mannosyltransferase activity(GO:0000026) |
| 0.1 | 0.9 | GO:0004745 | retinol dehydrogenase activity(GO:0004745) |
| 0.0 | 2.9 | GO:0005080 | protein kinase C binding(GO:0005080) |
| 0.0 | 0.9 | GO:0070016 | armadillo repeat domain binding(GO:0070016) |
| 0.0 | 0.1 | GO:0030158 | protein xylosyltransferase activity(GO:0030158) |
| 0.0 | 0.2 | GO:0047045 | testosterone 17-beta-dehydrogenase (NADP+) activity(GO:0047045) |
| 0.0 | 0.3 | GO:0030249 | guanylate cyclase regulator activity(GO:0030249) |
| 0.0 | 4.0 | GO:0004867 | serine-type endopeptidase inhibitor activity(GO:0004867) |
| 0.0 | 0.5 | GO:0070330 | aromatase activity(GO:0070330) |
| 0.0 | 0.6 | GO:0005522 | profilin binding(GO:0005522) |
| 0.0 | 0.1 | GO:0034875 | oxidoreductase activity, acting on CH or CH2 groups, quinone or similar compound as acceptor(GO:0033695) caffeine oxidase activity(GO:0034875) |
| 0.0 | 1.7 | GO:0043531 | ADP binding(GO:0043531) |
| 0.0 | 7.3 | GO:0004252 | serine-type endopeptidase activity(GO:0004252) |
| 0.0 | 0.4 | GO:0008656 | translation activator activity(GO:0008494) cysteine-type endopeptidase activator activity involved in apoptotic process(GO:0008656) |
| 0.0 | 3.3 | GO:0051082 | unfolded protein binding(GO:0051082) |
| 0.0 | 0.3 | GO:0016813 | hydrolase activity, acting on carbon-nitrogen (but not peptide) bonds, in linear amidines(GO:0016813) |
| 0.0 | 0.4 | GO:0048018 | receptor agonist activity(GO:0048018) |
| 0.0 | 0.9 | GO:0004864 | protein phosphatase inhibitor activity(GO:0004864) |
| 0.0 | 1.8 | GO:0101005 | thiol-dependent ubiquitinyl hydrolase activity(GO:0036459) ubiquitinyl hydrolase activity(GO:0101005) |
| 0.0 | 1.1 | GO:0070063 | RNA polymerase binding(GO:0070063) |
| 0.0 | 0.1 | GO:0046974 | histone methyltransferase activity (H3-K9 specific)(GO:0046974) |
| 0.0 | 1.3 | GO:0005089 | Rho guanyl-nucleotide exchange factor activity(GO:0005089) |
| 0.0 | 0.6 | GO:0019200 | carbohydrate kinase activity(GO:0019200) |
| 0.0 | 6.9 | GO:0004842 | ubiquitin-protein transferase activity(GO:0004842) |
| 0.0 | 0.2 | GO:0016641 | oxidoreductase activity, acting on the CH-NH2 group of donors, oxygen as acceptor(GO:0016641) |
| 0.0 | 0.3 | GO:0016702 | oxidoreductase activity, acting on single donors with incorporation of molecular oxygen, incorporation of two atoms of oxygen(GO:0016702) |
| 0.0 | 0.3 | GO:0005452 | inorganic anion exchanger activity(GO:0005452) |
Gene overrepresentation in C2:CP:REACTOME category:
| Log-likelihood per target | Total log-likelihood | Term | Description |
|---|---|---|---|
| 2.0 | 43.7 | REACTOME CHYLOMICRON MEDIATED LIPID TRANSPORT | Genes involved in Chylomicron-mediated lipid transport |
| 0.6 | 7.9 | REACTOME GAMMA CARBOXYLATION TRANSPORT AND AMINO TERMINAL CLEAVAGE OF PROTEINS | Genes involved in Gamma-carboxylation, transport, and amino-terminal cleavage of proteins |
| 0.5 | 14.2 | REACTOME REGULATION OF INSULIN LIKE GROWTH FACTOR IGF ACTIVITY BY INSULIN LIKE GROWTH FACTOR BINDING PROTEINS IGFBPS | Genes involved in Regulation of Insulin-like Growth Factor (IGF) Activity by Insulin-like Growth Factor Binding Proteins (IGFBPs) |
| 0.5 | 6.8 | REACTOME ABACAVIR TRANSPORT AND METABOLISM | Genes involved in Abacavir transport and metabolism |
| 0.5 | 9.7 | REACTOME INITIAL TRIGGERING OF COMPLEMENT | Genes involved in Initial triggering of complement |
| 0.3 | 4.4 | REACTOME NEF MEDIATED DOWNREGULATION OF MHC CLASS I COMPLEX CELL SURFACE EXPRESSION | Genes involved in Nef mediated downregulation of MHC class I complex cell surface expression |
| 0.3 | 3.2 | REACTOME CALNEXIN CALRETICULIN CYCLE | Genes involved in Calnexin/calreticulin cycle |
| 0.2 | 5.9 | REACTOME ANTIGEN PRESENTATION FOLDING ASSEMBLY AND PEPTIDE LOADING OF CLASS I MHC | Genes involved in Antigen Presentation: Folding, assembly and peptide loading of class I MHC |
| 0.2 | 2.8 | REACTOME REVERSIBLE HYDRATION OF CARBON DIOXIDE | Genes involved in Reversible Hydration of Carbon Dioxide |
| 0.2 | 6.5 | REACTOME ABC FAMILY PROTEINS MEDIATED TRANSPORT | Genes involved in ABC-family proteins mediated transport |
| 0.1 | 5.2 | REACTOME GABA SYNTHESIS RELEASE REUPTAKE AND DEGRADATION | Genes involved in GABA synthesis, release, reuptake and degradation |
| 0.1 | 2.4 | REACTOME FACILITATIVE NA INDEPENDENT GLUCOSE TRANSPORTERS | Genes involved in Facilitative Na+-independent glucose transporters |
| 0.1 | 4.8 | REACTOME GLUCOSE TRANSPORT | Genes involved in Glucose transport |
| 0.1 | 2.5 | REACTOME SYNTHESIS OF PA | Genes involved in Synthesis of PA |
| 0.1 | 4.7 | REACTOME NRAGE SIGNALS DEATH THROUGH JNK | Genes involved in NRAGE signals death through JNK |
| 0.1 | 2.2 | REACTOME REGULATION OF GENE EXPRESSION IN BETA CELLS | Genes involved in Regulation of gene expression in beta cells |
| 0.1 | 1.3 | REACTOME PROCESSING OF INTRONLESS PRE MRNAS | Genes involved in Processing of Intronless Pre-mRNAs |
| 0.1 | 2.1 | REACTOME GLUTATHIONE CONJUGATION | Genes involved in Glutathione conjugation |
| 0.1 | 1.0 | REACTOME VEGF LIGAND RECEPTOR INTERACTIONS | Genes involved in VEGF ligand-receptor interactions |
| 0.1 | 1.5 | REACTOME DCC MEDIATED ATTRACTIVE SIGNALING | Genes involved in DCC mediated attractive signaling |
| 0.0 | 1.2 | REACTOME CIRCADIAN REPRESSION OF EXPRESSION BY REV ERBA | Genes involved in Circadian Repression of Expression by REV-ERBA |
| 0.0 | 1.7 | REACTOME SIGNALING BY FGFR1 FUSION MUTANTS | Genes involved in Signaling by FGFR1 fusion mutants |
| 0.0 | 3.7 | REACTOME RESPONSE TO ELEVATED PLATELET CYTOSOLIC CA2 | Genes involved in Response to elevated platelet cytosolic Ca2+ |
| 0.0 | 0.8 | REACTOME CASPASE MEDIATED CLEAVAGE OF CYTOSKELETAL PROTEINS | Genes involved in Caspase-mediated cleavage of cytoskeletal proteins |
| 0.0 | 0.3 | REACTOME ORGANIC CATION ANION ZWITTERION TRANSPORT | Genes involved in Organic cation/anion/zwitterion transport |
| 0.0 | 0.5 | REACTOME COMPLEMENT CASCADE | Genes involved in Complement cascade |
| 0.0 | 0.3 | REACTOME METABOLISM OF POLYAMINES | Genes involved in Metabolism of polyamines |
| 0.0 | 0.7 | REACTOME METABOLISM OF VITAMINS AND COFACTORS | Genes involved in Metabolism of vitamins and cofactors |
| 0.0 | 0.6 | REACTOME GENERATION OF SECOND MESSENGER MOLECULES | Genes involved in Generation of second messenger molecules |
Gene overrepresentation in C2:CP category:
| Log-likelihood per target | Total log-likelihood | Term | Description |
|---|---|---|---|
| 0.4 | 28.0 | PID HNF3B PATHWAY | FOXA2 and FOXA3 transcription factor networks |
| 0.2 | 9.7 | PID AMB2 NEUTROPHILS PATHWAY | amb2 Integrin signaling |
| 0.2 | 7.9 | PID INTEGRIN2 PATHWAY | Beta2 integrin cell surface interactions |
| 0.1 | 3.4 | PID ARF6 DOWNSTREAM PATHWAY | Arf6 downstream pathway |
| 0.1 | 3.9 | PID HIF2PATHWAY | HIF-2-alpha transcription factor network |
| 0.1 | 6.2 | PID TAP63 PATHWAY | Validated transcriptional targets of TAp63 isoforms |
| 0.1 | 1.3 | SA TRKA RECEPTOR | The TrkA receptor binds nerve growth factor to activate MAP kinase pathways and promote cell growth. |
| 0.1 | 1.2 | PID CIRCADIAN PATHWAY | Circadian rhythm pathway |
| 0.0 | 0.8 | PID P38 GAMMA DELTA PATHWAY | Signaling mediated by p38-gamma and p38-delta |
| 0.0 | 0.9 | PID CONE PATHWAY | Visual signal transduction: Cones |
| 0.0 | 0.8 | PID WNT SIGNALING PATHWAY | Wnt signaling network |
| 0.0 | 1.0 | PID REELIN PATHWAY | Reelin signaling pathway |
Gene overrepresentation in cellular_component category:
| Log-likelihood per target | Total log-likelihood | Term | Description |
|---|---|---|---|
| 4.4 | 34.9 | GO:0034363 | intermediate-density lipoprotein particle(GO:0034363) |
| 1.3 | 5.2 | GO:0032144 | 4-aminobutyrate transaminase complex(GO:0032144) |
| 0.8 | 8.8 | GO:0034366 | spherical high-density lipoprotein particle(GO:0034366) |
| 0.7 | 5.9 | GO:0097425 | smooth endoplasmic reticulum membrane(GO:0030868) smooth endoplasmic reticulum part(GO:0097425) |
| 0.6 | 2.9 | GO:0070826 | paraferritin complex(GO:0070826) |
| 0.3 | 7.9 | GO:0031233 | intrinsic component of external side of plasma membrane(GO:0031233) |
| 0.3 | 4.0 | GO:0005577 | fibrinogen complex(GO:0005577) |
| 0.3 | 5.8 | GO:0005890 | sodium:potassium-exchanging ATPase complex(GO:0005890) |
| 0.2 | 2.4 | GO:0036513 | Derlin-1 retrotranslocation complex(GO:0036513) |
| 0.2 | 0.2 | GO:0031931 | TORC1 complex(GO:0031931) |
| 0.2 | 5.6 | GO:0031528 | microvillus membrane(GO:0031528) |
| 0.2 | 0.8 | GO:0045298 | tubulin complex(GO:0045298) |
| 0.1 | 7.2 | GO:0031907 | peroxisomal matrix(GO:0005782) microbody lumen(GO:0031907) |
| 0.1 | 24.2 | GO:0072562 | blood microparticle(GO:0072562) |
| 0.1 | 4.4 | GO:0030131 | clathrin adaptor complex(GO:0030131) |
| 0.1 | 1.3 | GO:0042405 | nuclear inclusion body(GO:0042405) |
| 0.1 | 2.6 | GO:0030687 | preribosome, large subunit precursor(GO:0030687) |
| 0.1 | 0.8 | GO:1990909 | Wnt signalosome(GO:1990909) |
| 0.1 | 0.2 | GO:0036398 | TCR signalosome(GO:0036398) |
| 0.1 | 18.3 | GO:0005788 | endoplasmic reticulum lumen(GO:0005788) |
| 0.1 | 1.6 | GO:0051233 | spindle midzone(GO:0051233) |
| 0.0 | 0.2 | GO:0031313 | extrinsic component of endosome membrane(GO:0031313) |
| 0.0 | 0.9 | GO:0031092 | platelet alpha granule membrane(GO:0031092) |
| 0.0 | 4.2 | GO:0005903 | brush border(GO:0005903) |
| 0.0 | 4.8 | GO:0030176 | integral component of endoplasmic reticulum membrane(GO:0030176) |
| 0.0 | 6.7 | GO:0005770 | late endosome(GO:0005770) |
| 0.0 | 0.1 | GO:0055087 | Ski complex(GO:0055087) |
| 0.0 | 1.7 | GO:0016459 | myosin complex(GO:0016459) |
| 0.0 | 4.4 | GO:0014069 | postsynaptic density(GO:0014069) postsynaptic specialization(GO:0099572) |
| 0.0 | 5.9 | GO:0000151 | ubiquitin ligase complex(GO:0000151) |
| 0.0 | 5.1 | GO:0016323 | basolateral plasma membrane(GO:0016323) |
| 0.0 | 2.3 | GO:0016605 | PML body(GO:0016605) |
| 0.0 | 0.4 | GO:0016592 | mediator complex(GO:0016592) |
| 0.0 | 0.4 | GO:0022627 | cytosolic small ribosomal subunit(GO:0022627) |
| 0.0 | 1.5 | GO:0016363 | nuclear matrix(GO:0016363) |
| 0.0 | 0.1 | GO:1990130 | Iml1 complex(GO:1990130) |
| 0.0 | 21.9 | GO:0005887 | integral component of plasma membrane(GO:0005887) |
| 0.0 | 0.1 | GO:0036038 | MKS complex(GO:0036038) |
| 0.0 | 1.0 | GO:0005882 | intermediate filament(GO:0005882) |
Gene overrepresentation in biological_process category:
| Log-likelihood per target | Total log-likelihood | Term | Description |
|---|---|---|---|
| 8.4 | 25.2 | GO:0010902 | positive regulation of very-low-density lipoprotein particle remodeling(GO:0010902) |
| 3.5 | 10.4 | GO:1901253 | negative regulation of intracellular transport of viral material(GO:1901253) |
| 3.0 | 9.1 | GO:0019477 | L-lysine catabolic process to acetyl-CoA(GO:0019474) L-lysine catabolic process(GO:0019477) L-lysine metabolic process(GO:0046440) |
| 2.9 | 8.8 | GO:0060621 | regulation of cholesterol import(GO:0060620) negative regulation of cholesterol import(GO:0060621) regulation of sterol import(GO:2000909) negative regulation of sterol import(GO:2000910) |
| 2.3 | 6.9 | GO:0048203 | vesicle targeting, trans-Golgi to endosome(GO:0048203) |
| 1.9 | 9.5 | GO:0034371 | chylomicron remodeling(GO:0034371) |
| 1.7 | 6.8 | GO:0006114 | glycerol biosynthetic process(GO:0006114) response to methionine(GO:1904640) |
| 1.6 | 20.3 | GO:2000427 | positive regulation of apoptotic cell clearance(GO:2000427) |
| 1.3 | 5.2 | GO:0014053 | negative regulation of gamma-aminobutyric acid secretion(GO:0014053) aspartate secretion(GO:0061528) regulation of aspartate secretion(GO:1904448) positive regulation of aspartate secretion(GO:1904450) |
| 1.0 | 4.0 | GO:0002034 | regulation of blood vessel size by renin-angiotensin(GO:0002034) renal control of peripheral vascular resistance involved in regulation of systemic arterial blood pressure(GO:0003072) |
| 1.0 | 7.9 | GO:0007598 | blood coagulation, extrinsic pathway(GO:0007598) |
| 1.0 | 5.8 | GO:0010732 | protein glutathionylation(GO:0010731) regulation of protein glutathionylation(GO:0010732) negative regulation of protein glutathionylation(GO:0010734) |
| 0.8 | 2.4 | GO:0035565 | regulation of pronephros size(GO:0035565) renal glucose absorption(GO:0035623) |
| 0.7 | 3.4 | GO:0072526 | pyridine-containing compound catabolic process(GO:0072526) |
| 0.7 | 3.4 | GO:0060125 | negative regulation of growth hormone secretion(GO:0060125) |
| 0.7 | 4.8 | GO:0015760 | hexose phosphate transport(GO:0015712) glucose-6-phosphate transport(GO:0015760) |
| 0.6 | 7.9 | GO:0034435 | steroid esterification(GO:0034433) sterol esterification(GO:0034434) cholesterol esterification(GO:0034435) |
| 0.6 | 2.9 | GO:0015692 | lead ion transport(GO:0015692) |
| 0.6 | 3.5 | GO:0051970 | negative regulation of transmission of nerve impulse(GO:0051970) |
| 0.6 | 1.7 | GO:1903028 | positive regulation of opsonization(GO:1903028) |
| 0.4 | 1.3 | GO:1904247 | positive regulation of polynucleotide adenylyltransferase activity(GO:1904247) |
| 0.4 | 14.2 | GO:0036499 | PERK-mediated unfolded protein response(GO:0036499) |
| 0.4 | 1.2 | GO:0060086 | circadian temperature homeostasis(GO:0060086) |
| 0.4 | 2.3 | GO:0010133 | proline catabolic process to glutamate(GO:0010133) |
| 0.3 | 1.0 | GO:1903572 | regulation of protein kinase D signaling(GO:1903570) positive regulation of protein kinase D signaling(GO:1903572) |
| 0.3 | 18.7 | GO:0018279 | protein N-linked glycosylation via asparagine(GO:0018279) |
| 0.3 | 5.9 | GO:0090110 | cargo loading into COPII-coated vesicle(GO:0090110) |
| 0.3 | 2.1 | GO:0019344 | cysteine biosynthetic process(GO:0019344) |
| 0.3 | 0.8 | GO:0044339 | canonical Wnt signaling pathway involved in osteoblast differentiation(GO:0044339) Spemann organizer formation(GO:0060061) |
| 0.3 | 1.3 | GO:1904693 | midbrain morphogenesis(GO:1904693) |
| 0.2 | 5.6 | GO:0015879 | carnitine transport(GO:0015879) |
| 0.2 | 0.2 | GO:0006562 | proline catabolic process(GO:0006562) |
| 0.2 | 5.4 | GO:1901741 | positive regulation of myoblast fusion(GO:1901741) |
| 0.2 | 2.4 | GO:0046415 | urate metabolic process(GO:0046415) |
| 0.2 | 0.8 | GO:0090258 | negative regulation of mitochondrial fission(GO:0090258) |
| 0.2 | 0.8 | GO:0015910 | peroxisomal long-chain fatty acid import(GO:0015910) |
| 0.2 | 0.6 | GO:0006014 | D-ribose metabolic process(GO:0006014) |
| 0.2 | 2.4 | GO:0071712 | ER-associated misfolded protein catabolic process(GO:0071712) |
| 0.2 | 2.5 | GO:0016024 | CDP-diacylglycerol biosynthetic process(GO:0016024) |
| 0.1 | 0.9 | GO:0048312 | intracellular distribution of mitochondria(GO:0048312) |
| 0.1 | 1.5 | GO:0043569 | negative regulation of insulin-like growth factor receptor signaling pathway(GO:0043569) |
| 0.1 | 1.0 | GO:0007256 | activation of JNKK activity(GO:0007256) |
| 0.1 | 2.1 | GO:1902187 | negative regulation of viral release from host cell(GO:1902187) |
| 0.1 | 3.2 | GO:0006491 | N-glycan processing(GO:0006491) |
| 0.1 | 1.9 | GO:0043651 | linoleic acid metabolic process(GO:0043651) |
| 0.1 | 4.4 | GO:0050690 | regulation of defense response to virus by virus(GO:0050690) |
| 0.1 | 0.6 | GO:0046485 | ether lipid metabolic process(GO:0046485) |
| 0.1 | 0.3 | GO:1901162 | primary amino compound biosynthetic process(GO:1901162) |
| 0.1 | 1.0 | GO:0035970 | peptidyl-threonine dephosphorylation(GO:0035970) |
| 0.0 | 2.8 | GO:0015701 | bicarbonate transport(GO:0015701) |
| 0.0 | 0.2 | GO:0045875 | negative regulation of sister chromatid cohesion(GO:0045875) |
| 0.0 | 0.3 | GO:0030643 | cellular phosphate ion homeostasis(GO:0030643) cellular trivalent inorganic anion homeostasis(GO:0072502) |
| 0.0 | 0.6 | GO:1900028 | negative regulation of ruffle assembly(GO:1900028) |
| 0.0 | 1.1 | GO:0000042 | protein targeting to Golgi(GO:0000042) |
| 0.0 | 0.1 | GO:2000118 | regulation of sodium-dependent phosphate transport(GO:2000118) |
| 0.0 | 1.6 | GO:0032467 | positive regulation of cytokinesis(GO:0032467) |
| 0.0 | 0.2 | GO:1904262 | negative regulation of TORC1 signaling(GO:1904262) |
| 0.0 | 2.6 | GO:0042273 | ribosomal large subunit biogenesis(GO:0042273) |
| 0.0 | 7.1 | GO:0007601 | visual perception(GO:0007601) |
| 0.0 | 4.1 | GO:0030449 | regulation of complement activation(GO:0030449) |
| 0.0 | 0.3 | GO:0031282 | regulation of guanylate cyclase activity(GO:0031282) |
| 0.0 | 0.3 | GO:0070050 | neuron cellular homeostasis(GO:0070050) |
| 0.0 | 0.2 | GO:0032784 | regulation of DNA-templated transcription, elongation(GO:0032784) |
| 0.0 | 6.6 | GO:0000209 | protein polyubiquitination(GO:0000209) |
| 0.0 | 0.4 | GO:0000028 | ribosomal small subunit assembly(GO:0000028) |
| 0.0 | 0.7 | GO:0042026 | protein refolding(GO:0042026) |
| 0.0 | 0.2 | GO:0006703 | estrogen biosynthetic process(GO:0006703) |
| 0.0 | 0.4 | GO:0032007 | negative regulation of TOR signaling(GO:0032007) |
| 0.0 | 0.1 | GO:0070989 | oxidative demethylation(GO:0070989) |
| 0.0 | 0.4 | GO:0046949 | fatty-acyl-CoA biosynthetic process(GO:0046949) |
| 0.0 | 0.1 | GO:0034427 | nuclear-transcribed mRNA catabolic process, exonucleolytic, 3'-5'(GO:0034427) |
| 0.0 | 0.2 | GO:0006490 | oligosaccharide-lipid intermediate biosynthetic process(GO:0006490) mannosylation(GO:0097502) |
| 0.0 | 0.1 | GO:0030202 | heparin metabolic process(GO:0030202) heparin biosynthetic process(GO:0030210) |