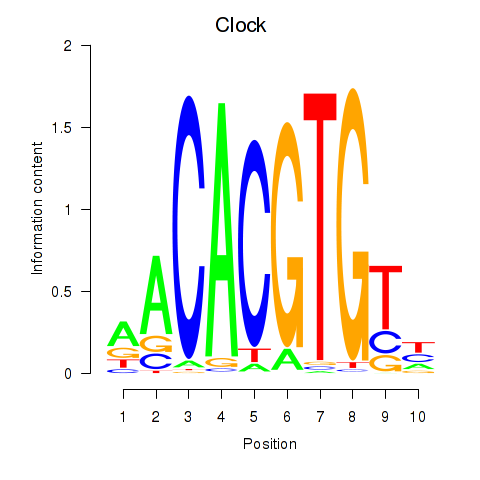
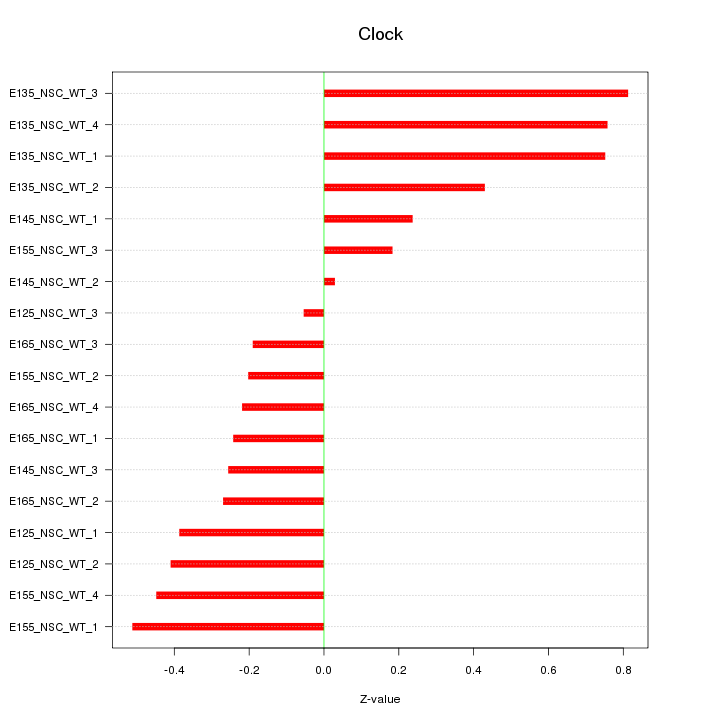
Motif ID: Clock
Z-value: 0.420
Transcription factors associated with Clock:
| Gene Symbol | Entrez ID | Gene Name |
|---|---|---|
| Clock | ENSMUSG00000029238.8 | Clock |
Activity-expression correlation:
| Gene Symbol | Promoter | Pearson corr. coef. | P-value | Plot |
|---|---|---|---|---|
| Clock | mm10_v2_chr5_-_76304474_76304548 | -0.49 | 3.8e-02 | Click! |


Top targets:
Gene overrepresentation in biological_process category:
| Log-likelihood per target | Total log-likelihood | Term | Description |
|---|---|---|---|
| 0.2 | 0.7 | GO:1903334 | positive regulation of protein folding(GO:1903334) |
| 0.2 | 0.9 | GO:0097477 | lateral motor column neuron migration(GO:0097477) |
| 0.2 | 0.6 | GO:0002014 | vasoconstriction of artery involved in ischemic response to lowering of systemic arterial blood pressure(GO:0002014) |
| 0.2 | 1.1 | GO:0000320 | re-entry into mitotic cell cycle(GO:0000320) |
| 0.1 | 0.6 | GO:0006438 | valyl-tRNA aminoacylation(GO:0006438) |
| 0.1 | 0.7 | GO:0010993 | regulation of ubiquitin homeostasis(GO:0010993) free ubiquitin chain polymerization(GO:0010994) |
| 0.1 | 1.3 | GO:0030322 | stabilization of membrane potential(GO:0030322) |
| 0.1 | 0.6 | GO:0006189 | 'de novo' IMP biosynthetic process(GO:0006189) |
| 0.1 | 0.5 | GO:0002337 | B-1a B cell differentiation(GO:0002337) |
| 0.1 | 0.5 | GO:0060535 | trachea cartilage morphogenesis(GO:0060535) |
| 0.1 | 0.5 | GO:0031581 | hemidesmosome assembly(GO:0031581) |
| 0.1 | 0.3 | GO:2000510 | regulation of MDA-5 signaling pathway(GO:0039533) positive regulation of dendritic cell chemotaxis(GO:2000510) |
| 0.1 | 0.5 | GO:0046864 | retinol transport(GO:0034633) isoprenoid transport(GO:0046864) terpenoid transport(GO:0046865) alveolar primary septum development(GO:0061143) |
| 0.1 | 0.3 | GO:0009174 | UMP biosynthetic process(GO:0006222) pyrimidine ribonucleoside monophosphate metabolic process(GO:0009173) pyrimidine ribonucleoside monophosphate biosynthetic process(GO:0009174) UMP metabolic process(GO:0046049) |
| 0.1 | 0.3 | GO:0046654 | tetrahydrofolate biosynthetic process(GO:0046654) |
| 0.1 | 0.5 | GO:0010668 | ectodermal cell differentiation(GO:0010668) |
| 0.1 | 0.5 | GO:0061073 | ciliary body morphogenesis(GO:0061073) |
| 0.1 | 0.5 | GO:0090273 | regulation of somatostatin secretion(GO:0090273) |
| 0.1 | 0.5 | GO:0006543 | glutamine catabolic process(GO:0006543) |
| 0.1 | 0.3 | GO:0070889 | platelet alpha granule organization(GO:0070889) |
| 0.1 | 0.4 | GO:0042373 | vitamin K metabolic process(GO:0042373) |
| 0.1 | 0.2 | GO:0019062 | virion attachment to host cell(GO:0019062) transforming growth factor beta activation(GO:0036363) adhesion of symbiont to host cell(GO:0044650) complement-dependent cytotoxicity(GO:0097278) |
| 0.1 | 0.2 | GO:0006545 | glycine biosynthetic process(GO:0006545) |
| 0.1 | 0.2 | GO:0009446 | putrescine biosynthetic process(GO:0009446) |
| 0.1 | 0.6 | GO:0010745 | negative regulation of macrophage derived foam cell differentiation(GO:0010745) |
| 0.1 | 0.2 | GO:1902256 | endocardial cushion fusion(GO:0003274) apoptotic process involved in outflow tract morphogenesis(GO:0003275) atrial septum primum morphogenesis(GO:0003289) positive regulation of catagen(GO:0051795) regulation of apoptotic process involved in outflow tract morphogenesis(GO:1902256) |
| 0.1 | 0.5 | GO:0040031 | snRNA modification(GO:0040031) |
| 0.1 | 0.5 | GO:0035726 | common myeloid progenitor cell proliferation(GO:0035726) |
| 0.1 | 0.2 | GO:1903416 | response to glycoside(GO:1903416) |
| 0.1 | 0.3 | GO:2000210 | positive regulation of anoikis(GO:2000210) |
| 0.0 | 0.3 | GO:1990504 | dense core granule exocytosis(GO:1990504) |
| 0.0 | 0.5 | GO:0006855 | drug transmembrane transport(GO:0006855) |
| 0.0 | 0.5 | GO:0033690 | positive regulation of osteoblast proliferation(GO:0033690) |
| 0.0 | 0.3 | GO:0006344 | maintenance of chromatin silencing(GO:0006344) |
| 0.0 | 0.3 | GO:2000394 | positive regulation of lamellipodium morphogenesis(GO:2000394) |
| 0.0 | 0.1 | GO:0015712 | hexose phosphate transport(GO:0015712) glucose-6-phosphate transport(GO:0015760) |
| 0.0 | 0.4 | GO:0033572 | transferrin transport(GO:0033572) |
| 0.0 | 0.7 | GO:0001913 | T cell mediated cytotoxicity(GO:0001913) |
| 0.0 | 0.7 | GO:0032933 | response to sterol depletion(GO:0006991) SREBP signaling pathway(GO:0032933) cellular response to sterol depletion(GO:0071501) |
| 0.0 | 0.2 | GO:0072553 | terminal button organization(GO:0072553) |
| 0.0 | 0.1 | GO:0035973 | aggrephagy(GO:0035973) |
| 0.0 | 0.7 | GO:0043153 | entrainment of circadian clock by photoperiod(GO:0043153) |
| 0.0 | 0.2 | GO:0019348 | dolichol metabolic process(GO:0019348) |
| 0.0 | 0.2 | GO:0090209 | negative regulation of triglyceride metabolic process(GO:0090209) |
| 0.0 | 0.9 | GO:0010972 | negative regulation of G2/M transition of mitotic cell cycle(GO:0010972) |
| 0.0 | 0.1 | GO:0051182 | coenzyme transport(GO:0051182) |
| 0.0 | 0.5 | GO:0051123 | RNA polymerase II transcriptional preinitiation complex assembly(GO:0051123) |
| 0.0 | 0.1 | GO:0038032 | termination of G-protein coupled receptor signaling pathway(GO:0038032) |
| 0.0 | 0.4 | GO:0000387 | spliceosomal snRNP assembly(GO:0000387) |
Gene overrepresentation in cellular_component category:
| Log-likelihood per target | Total log-likelihood | Term | Description |
|---|---|---|---|
| 0.2 | 1.0 | GO:0008537 | proteasome activator complex(GO:0008537) |
| 0.2 | 0.7 | GO:0089717 | spanning component of plasma membrane(GO:0044214) spanning component of membrane(GO:0089717) |
| 0.2 | 0.5 | GO:0005899 | insulin receptor complex(GO:0005899) |
| 0.2 | 0.5 | GO:0031088 | platelet dense granule membrane(GO:0031088) |
| 0.1 | 0.5 | GO:0043259 | laminin-1 complex(GO:0005606) laminin-10 complex(GO:0043259) |
| 0.1 | 0.3 | GO:0031074 | nucleocytoplasmic shuttling complex(GO:0031074) |
| 0.1 | 0.3 | GO:0043202 | lysosomal lumen(GO:0043202) |
| 0.1 | 0.5 | GO:0000125 | PCAF complex(GO:0000125) |
| 0.1 | 0.2 | GO:0070552 | BRISC complex(GO:0070552) |
| 0.0 | 0.2 | GO:0034751 | aryl hydrocarbon receptor complex(GO:0034751) |
| 0.0 | 0.4 | GO:1990712 | HFE-transferrin receptor complex(GO:1990712) |
| 0.0 | 0.2 | GO:0005890 | sodium:potassium-exchanging ATPase complex(GO:0005890) |
| 0.0 | 0.4 | GO:0032797 | SMN complex(GO:0032797) |
| 0.0 | 0.4 | GO:0034663 | endoplasmic reticulum chaperone complex(GO:0034663) |
| 0.0 | 0.2 | GO:0061689 | tricellular tight junction(GO:0061689) |
| 0.0 | 0.7 | GO:0005680 | anaphase-promoting complex(GO:0005680) |
| 0.0 | 0.2 | GO:0034388 | Pwp2p-containing subcomplex of 90S preribosome(GO:0034388) |
| 0.0 | 0.1 | GO:0034274 | Atg12-Atg5-Atg16 complex(GO:0034274) |
| 0.0 | 1.1 | GO:0000307 | cyclin-dependent protein kinase holoenzyme complex(GO:0000307) |
Gene overrepresentation in molecular_function category:
| Log-likelihood per target | Total log-likelihood | Term | Description |
|---|---|---|---|
| 0.2 | 1.0 | GO:0043426 | MRF binding(GO:0043426) |
| 0.1 | 0.9 | GO:0070326 | very-low-density lipoprotein particle receptor binding(GO:0070326) |
| 0.1 | 0.4 | GO:0004998 | transferrin receptor activity(GO:0004998) |
| 0.1 | 0.6 | GO:0004832 | valine-tRNA ligase activity(GO:0004832) |
| 0.1 | 1.3 | GO:0022841 | potassium ion leak channel activity(GO:0022841) |
| 0.1 | 1.0 | GO:0061133 | endopeptidase activator activity(GO:0061133) |
| 0.1 | 0.3 | GO:0004487 | methylenetetrahydrofolate dehydrogenase (NAD+) activity(GO:0004487) |
| 0.1 | 0.3 | GO:0031686 | A1 adenosine receptor binding(GO:0031686) |
| 0.1 | 0.3 | GO:0008195 | phosphatidate phosphatase activity(GO:0008195) |
| 0.1 | 0.7 | GO:0046703 | natural killer cell lectin-like receptor binding(GO:0046703) |
| 0.1 | 0.3 | GO:0030984 | kininogen binding(GO:0030984) |
| 0.1 | 0.8 | GO:0015037 | peptide disulfide oxidoreductase activity(GO:0015037) |
| 0.1 | 0.2 | GO:0008732 | threonine aldolase activity(GO:0004793) L-allo-threonine aldolase activity(GO:0008732) |
| 0.1 | 0.5 | GO:0043208 | glycosphingolipid binding(GO:0043208) |
| 0.0 | 0.2 | GO:0034714 | type III transforming growth factor beta receptor binding(GO:0034714) |
| 0.0 | 0.5 | GO:0005068 | transmembrane receptor protein tyrosine kinase adaptor activity(GO:0005068) |
| 0.0 | 0.5 | GO:0015245 | fatty acid transporter activity(GO:0015245) |
| 0.0 | 0.2 | GO:0002135 | CTP binding(GO:0002135) |
| 0.0 | 0.2 | GO:0003976 | UDP-N-acetylglucosamine-lysosomal-enzyme N-acetylglucosaminephosphotransferase activity(GO:0003976) |
| 0.0 | 0.9 | GO:0070064 | proline-rich region binding(GO:0070064) |
| 0.0 | 0.2 | GO:1990239 | steroid hormone binding(GO:1990239) |
| 0.0 | 1.1 | GO:0016831 | carboxy-lyase activity(GO:0016831) |
| 0.0 | 0.1 | GO:0008273 | calcium, potassium:sodium antiporter activity(GO:0008273) |
| 0.0 | 0.5 | GO:0051183 | vitamin transporter activity(GO:0051183) |
| 0.0 | 0.1 | GO:0051185 | coenzyme transporter activity(GO:0051185) |
| 0.0 | 0.5 | GO:0048027 | mRNA 5'-UTR binding(GO:0048027) |
| 0.0 | 0.5 | GO:0017147 | Wnt-protein binding(GO:0017147) |
| 0.0 | 0.7 | GO:0061631 | ubiquitin conjugating enzyme activity(GO:0061631) |
| 0.0 | 0.4 | GO:0000175 | 3'-5'-exoribonuclease activity(GO:0000175) |
| 0.0 | 0.5 | GO:0017025 | TBP-class protein binding(GO:0017025) |
| 0.0 | 0.2 | GO:0048038 | quinone binding(GO:0048038) |
| 0.0 | 0.3 | GO:0003887 | DNA-directed DNA polymerase activity(GO:0003887) |
| 0.0 | 0.2 | GO:0004659 | prenyltransferase activity(GO:0004659) |
| 0.0 | 0.1 | GO:0050308 | sugar-phosphatase activity(GO:0050308) |
| 0.0 | 0.1 | GO:0016421 | CoA carboxylase activity(GO:0016421) |
| 0.0 | 0.5 | GO:0016763 | transferase activity, transferring pentosyl groups(GO:0016763) |
Gene overrepresentation in C2:CP category:
| Log-likelihood per target | Total log-likelihood | Term | Description |
|---|---|---|---|
| 0.1 | 1.1 | SA_REG_CASCADE_OF_CYCLIN_EXPR | Expression of cyclins regulates progression through the cell cycle by activating cyclin-dependent kinases. |
| 0.1 | 0.5 | PID_INTEGRIN4_PATHWAY | Alpha6 beta4 integrin-ligand interactions |
| 0.0 | 1.1 | PID_MYC_PATHWAY | C-MYC pathway |
| 0.0 | 0.7 | SA_CASPASE_CASCADE | Apoptosis is mediated by caspases, cysteine proteases arranged in a proteolytic cascade. |
| 0.0 | 0.5 | PID_CIRCADIAN_PATHWAY | Circadian rhythm pathway |
| 0.0 | 0.2 | SA_MMP_CYTOKINE_CONNECTION | Cytokines can induce activation of matrix metalloproteinases, which degrade extracellular matrix. |
| 0.0 | 2.5 | NABA_ECM_GLYCOPROTEINS | Genes encoding structural ECM glycoproteins |
| 0.0 | 0.5 | PID_S1P_S1P2_PATHWAY | S1P2 pathway |
Gene overrepresentation in C2:CP:REACTOME category:
| Log-likelihood per target | Total log-likelihood | Term | Description |
|---|---|---|---|
| 0.1 | 1.1 | REACTOME_PURINE_RIBONUCLEOSIDE_MONOPHOSPHATE_BIOSYNTHESIS | Genes involved in Purine ribonucleoside monophosphate biosynthesis |
| 0.0 | 1.1 | REACTOME_PRE_NOTCH_TRANSCRIPTION_AND_TRANSLATION | Genes involved in Pre-NOTCH Transcription and Translation |
| 0.0 | 0.7 | REACTOME_CONVERSION_FROM_APC_C_CDC20_TO_APC_C_CDH1_IN_LATE_ANAPHASE | Genes involved in Conversion from APC/C:Cdc20 to APC/C:Cdh1 in late anaphase |
| 0.0 | 0.2 | REACTOME_THE_NLRP3_INFLAMMASOME | Genes involved in The NLRP3 inflammasome |
| 0.0 | 0.3 | REACTOME_INTRINSIC_PATHWAY | Genes involved in Intrinsic Pathway |
| 0.0 | 0.7 | REACTOME_IMMUNOREGULATORY_INTERACTIONS_BETWEEN_A_LYMPHOID_AND_A_NON_LYMPHOID_CELL | Genes involved in Immunoregulatory interactions between a Lymphoid and a non-Lymphoid cell |
| 0.0 | 0.1 | REACTOME_CROSS_PRESENTATION_OF_SOLUBLE_EXOGENOUS_ANTIGENS_ENDOSOMES | Genes involved in Cross-presentation of soluble exogenous antigens (endosomes) |
| 0.0 | 0.5 | REACTOME_POST_CHAPERONIN_TUBULIN_FOLDING_PATHWAY | Genes involved in Post-chaperonin tubulin folding pathway |
| 0.0 | 0.5 | REACTOME_SOS_MEDIATED_SIGNALLING | Genes involved in SOS-mediated signalling |
| 0.0 | 0.3 | REACTOME_SYNTHESIS_OF_PE | Genes involved in Synthesis of PE |
| 0.0 | 0.6 | REACTOME_CYTOSOLIC_TRNA_AMINOACYLATION | Genes involved in Cytosolic tRNA aminoacylation |
| 0.0 | 0.4 | REACTOME_TRANSFERRIN_ENDOCYTOSIS_AND_RECYCLING | Genes involved in Transferrin endocytosis and recycling |
| 0.0 | 0.5 | REACTOME_ABC_FAMILY_PROTEINS_MEDIATED_TRANSPORT | Genes involved in ABC-family proteins mediated transport |
| 0.0 | 0.3 | REACTOME_PYRIMIDINE_METABOLISM | Genes involved in Pyrimidine metabolism |
| 0.0 | 0.3 | REACTOME_GABA_SYNTHESIS_RELEASE_REUPTAKE_AND_DEGRADATION | Genes involved in GABA synthesis, release, reuptake and degradation |
| 0.0 | 0.5 | REACTOME_BMAL1_CLOCK_NPAS2_ACTIVATES_CIRCADIAN_EXPRESSION | Genes involved in BMAL1:CLOCK/NPAS2 Activates Circadian Expression |