Motif ID: Gbx2
Z-value: 0.516

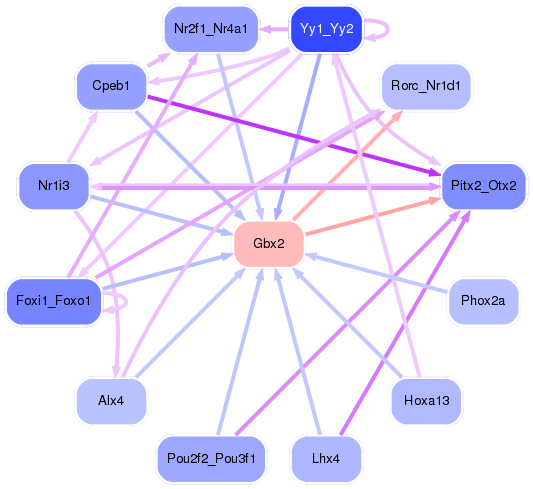
Transcription factors associated with Gbx2:
| Gene Symbol | Entrez ID | Gene Name |
|---|---|---|
| Gbx2 | ENSMUSG00000034486.7 | Gbx2 |
Activity-expression correlation:
| Gene Symbol | Promoter | Pearson corr. coef. | P-value | Plot |
|---|---|---|---|---|
| Gbx2 | mm10_v2_chr1_-_89933290_89933290 | 0.43 | 7.5e-02 | Click! |


Top targets:
Gene overrepresentation in biological_process category:
| Log-likelihood per target | Total log-likelihood | Term | Description |
|---|---|---|---|
| 0.7 | 2.9 | GO:0046552 | eye photoreceptor cell fate commitment(GO:0042706) photoreceptor cell fate commitment(GO:0046552) |
| 0.5 | 1.6 | GO:0016554 | cytidine to uridine editing(GO:0016554) |
| 0.3 | 2.0 | GO:0072615 | interleukin-17 secretion(GO:0072615) |
| 0.2 | 0.6 | GO:0036292 | DNA rewinding(GO:0036292) |
| 0.2 | 1.2 | GO:0000707 | meiotic DNA recombinase assembly(GO:0000707) |
| 0.2 | 0.6 | GO:0001550 | ovarian cumulus expansion(GO:0001550) fused antrum stage(GO:0048165) |
| 0.2 | 0.5 | GO:0006011 | UDP-glucose metabolic process(GO:0006011) glucose 1-phosphate metabolic process(GO:0019255) |
| 0.1 | 0.4 | GO:0006106 | fumarate metabolic process(GO:0006106) |
| 0.1 | 0.5 | GO:0006933 | negative regulation of cell adhesion involved in substrate-bound cell migration(GO:0006933) |
| 0.1 | 0.6 | GO:0071883 | activation of MAPK activity by adrenergic receptor signaling pathway(GO:0071883) |
| 0.1 | 1.0 | GO:0061032 | visceral serous pericardium development(GO:0061032) |
| 0.1 | 0.4 | GO:0070171 | negative regulation of tooth mineralization(GO:0070171) |
| 0.1 | 0.6 | GO:0007406 | negative regulation of neuroblast proliferation(GO:0007406) |
| 0.1 | 1.8 | GO:0032331 | negative regulation of chondrocyte differentiation(GO:0032331) |
| 0.1 | 1.0 | GO:0060481 | lobar bronchus epithelium development(GO:0060481) |
| 0.1 | 0.4 | GO:0030854 | positive regulation of granulocyte differentiation(GO:0030854) |
| 0.1 | 0.3 | GO:0016255 | attachment of GPI anchor to protein(GO:0016255) |
| 0.0 | 0.1 | GO:0010752 | signal complex assembly(GO:0007172) regulation of cGMP-mediated signaling(GO:0010752) |
| 0.0 | 0.4 | GO:1902416 | positive regulation of mRNA binding(GO:1902416) |
| 0.0 | 0.5 | GO:0006271 | DNA strand elongation involved in DNA replication(GO:0006271) |
| 0.0 | 0.7 | GO:0051482 | positive regulation of cytosolic calcium ion concentration involved in phospholipase C-activating G-protein coupled signaling pathway(GO:0051482) |
| 0.0 | 0.4 | GO:0006824 | cobalt ion transport(GO:0006824) |
| 0.0 | 0.3 | GO:0006020 | inositol metabolic process(GO:0006020) |
| 0.0 | 0.3 | GO:1902166 | negative regulation of intrinsic apoptotic signaling pathway in response to DNA damage by p53 class mediator(GO:1902166) |
| 0.0 | 0.2 | GO:0006123 | mitochondrial electron transport, cytochrome c to oxygen(GO:0006123) |
| 0.0 | 0.3 | GO:0000028 | ribosomal small subunit assembly(GO:0000028) |
| 0.0 | 0.4 | GO:0000002 | mitochondrial genome maintenance(GO:0000002) |
Gene overrepresentation in cellular_component category:
| Log-likelihood per target | Total log-likelihood | Term | Description |
|---|---|---|---|
| 0.2 | 1.2 | GO:0033063 | Rad51B-Rad51C-Rad51D-XRCC2 complex(GO:0033063) |
| 0.2 | 0.5 | GO:0043625 | delta DNA polymerase complex(GO:0043625) |
| 0.1 | 0.9 | GO:0070652 | HAUS complex(GO:0070652) |
| 0.1 | 0.3 | GO:0097637 | intrinsic component of autophagosome membrane(GO:0097636) integral component of autophagosome membrane(GO:0097637) |
| 0.1 | 0.5 | GO:0045261 | mitochondrial proton-transporting ATP synthase complex, catalytic core F(1)(GO:0000275) proton-transporting ATP synthase complex, catalytic core F(1)(GO:0045261) |
| 0.1 | 0.3 | GO:0042765 | GPI-anchor transamidase complex(GO:0042765) |
| 0.0 | 2.0 | GO:0000315 | organellar large ribosomal subunit(GO:0000315) mitochondrial large ribosomal subunit(GO:0005762) |
| 0.0 | 0.4 | GO:0072546 | ER membrane protein complex(GO:0072546) |
| 0.0 | 0.4 | GO:0045239 | tricarboxylic acid cycle enzyme complex(GO:0045239) |
| 0.0 | 0.9 | GO:0002102 | podosome(GO:0002102) |
| 0.0 | 0.4 | GO:0045120 | pronucleus(GO:0045120) |
| 0.0 | 0.2 | GO:0005751 | mitochondrial respiratory chain complex IV(GO:0005751) |
| 0.0 | 0.1 | GO:0000308 | cytoplasmic cyclin-dependent protein kinase holoenzyme complex(GO:0000308) |
| 0.0 | 0.6 | GO:0043596 | nuclear replication fork(GO:0043596) |
| 0.0 | 0.3 | GO:0008305 | integrin complex(GO:0008305) protein complex involved in cell adhesion(GO:0098636) |
| 0.0 | 3.0 | GO:0030426 | growth cone(GO:0030426) |
| 0.0 | 0.3 | GO:0000314 | organellar small ribosomal subunit(GO:0000314) mitochondrial small ribosomal subunit(GO:0005763) |
| 0.0 | 0.7 | GO:0070469 | respiratory chain(GO:0070469) |
Gene overrepresentation in molecular_function category:
| Log-likelihood per target | Total log-likelihood | Term | Description |
|---|---|---|---|
| 0.5 | 2.0 | GO:0008142 | oxysterol binding(GO:0008142) |
| 0.4 | 1.6 | GO:0004126 | cytidine deaminase activity(GO:0004126) |
| 0.2 | 1.0 | GO:0008131 | primary amine oxidase activity(GO:0008131) |
| 0.2 | 1.0 | GO:0050436 | microfibril binding(GO:0050436) |
| 0.2 | 1.2 | GO:0000150 | recombinase activity(GO:0000150) |
| 0.1 | 0.4 | GO:0019966 | interleukin-1 binding(GO:0019966) |
| 0.1 | 0.3 | GO:0031403 | lithium ion binding(GO:0031403) |
| 0.1 | 0.7 | GO:0035727 | lysophosphatidic acid binding(GO:0035727) lysophosphatidic acid receptor activity(GO:0070915) |
| 0.1 | 0.3 | GO:1990050 | phosphatidic acid transporter activity(GO:1990050) |
| 0.1 | 0.5 | GO:0043532 | angiostatin binding(GO:0043532) |
| 0.1 | 0.6 | GO:0001162 | RNA polymerase II intronic transcription regulatory region sequence-specific DNA binding(GO:0001162) |
| 0.1 | 0.3 | GO:0098639 | collagen binding involved in cell-matrix adhesion(GO:0098639) |
| 0.1 | 0.6 | GO:0005025 | transforming growth factor beta receptor activity, type I(GO:0005025) |
| 0.1 | 0.6 | GO:0004691 | cAMP-dependent protein kinase activity(GO:0004691) |
| 0.1 | 0.3 | GO:0003923 | GPI-anchor transamidase activity(GO:0003923) |
| 0.1 | 0.6 | GO:0036310 | annealing helicase activity(GO:0036310) |
| 0.0 | 1.8 | GO:0005109 | frizzled binding(GO:0005109) |
| 0.0 | 0.4 | GO:0015087 | cobalt ion transmembrane transporter activity(GO:0015087) |
| 0.0 | 0.4 | GO:1990715 | mRNA CDS binding(GO:1990715) |
| 0.0 | 0.5 | GO:0070569 | pyrimidine ribonucleotide binding(GO:0032557) uridylyltransferase activity(GO:0070569) |
| 0.0 | 0.3 | GO:0045134 | uridine-diphosphatase activity(GO:0045134) |
| 0.0 | 0.3 | GO:0070181 | small ribosomal subunit rRNA binding(GO:0070181) |
| 0.0 | 0.1 | GO:0008192 | RNA guanylyltransferase activity(GO:0008192) |
| 0.0 | 0.7 | GO:0050136 | NADH dehydrogenase (ubiquinone) activity(GO:0008137) NADH dehydrogenase (quinone) activity(GO:0050136) |
| 0.0 | 2.9 | GO:0001158 | enhancer sequence-specific DNA binding(GO:0001158) |
| 0.0 | 0.5 | GO:0003887 | DNA-directed DNA polymerase activity(GO:0003887) |
| 0.0 | 0.1 | GO:0043423 | 3-phosphoinositide-dependent protein kinase binding(GO:0043423) |
| 0.0 | 0.2 | GO:0004129 | cytochrome-c oxidase activity(GO:0004129) heme-copper terminal oxidase activity(GO:0015002) oxidoreductase activity, acting on a heme group of donors, oxygen as acceptor(GO:0016676) |
| 0.0 | 0.1 | GO:0033188 | sphingomyelin synthase activity(GO:0033188) ceramide cholinephosphotransferase activity(GO:0047493) |
Gene overrepresentation in C2:CP category:
| Log-likelihood per target | Total log-likelihood | Term | Description |
|---|---|---|---|
| 0.1 | 1.0 | PID_INTEGRIN2_PATHWAY | Beta2 integrin cell surface interactions |
| 0.0 | 0.7 | PID_LPA4_PATHWAY | LPA4-mediated signaling events |
| 0.0 | 0.3 | PID_INTEGRIN_CS_PATHWAY | Integrin family cell surface interactions |
| 0.0 | 1.8 | WNT_SIGNALING | Genes related to Wnt-mediated signal transduction |
| 0.0 | 0.6 | PID_BMP_PATHWAY | BMP receptor signaling |
| 0.0 | 0.4 | NABA_PROTEOGLYCANS | Genes encoding proteoglycans |
Gene overrepresentation in C2:CP:REACTOME category:
| Log-likelihood per target | Total log-likelihood | Term | Description |
|---|---|---|---|
| 0.1 | 0.7 | REACTOME_P2Y_RECEPTORS | Genes involved in P2Y receptors |
| 0.1 | 0.5 | REACTOME_REMOVAL_OF_THE_FLAP_INTERMEDIATE_FROM_THE_C_STRAND | Genes involved in Removal of the Flap Intermediate from the C-strand |
| 0.1 | 0.5 | REACTOME_GLUCURONIDATION | Genes involved in Glucuronidation |
| 0.0 | 0.7 | REACTOME_APOPTOSIS_INDUCED_DNA_FRAGMENTATION | Genes involved in Apoptosis induced DNA fragmentation |
| 0.0 | 1.0 | REACTOME_IMMUNOREGULATORY_INTERACTIONS_BETWEEN_A_LYMPHOID_AND_A_NON_LYMPHOID_CELL | Genes involved in Immunoregulatory interactions between a Lymphoid and a non-Lymphoid cell |
| 0.0 | 2.0 | REACTOME_NUCLEAR_RECEPTOR_TRANSCRIPTION_PATHWAY | Genes involved in Nuclear Receptor transcription pathway |
| 0.0 | 0.5 | REACTOME_FORMATION_OF_ATP_BY_CHEMIOSMOTIC_COUPLING | Genes involved in Formation of ATP by chemiosmotic coupling |
| 0.0 | 1.8 | REACTOME_CLASS_B_2_SECRETIN_FAMILY_RECEPTORS | Genes involved in Class B/2 (Secretin family receptors) |
| 0.0 | 0.6 | REACTOME_SIGNALING_BY_BMP | Genes involved in Signaling by BMP |