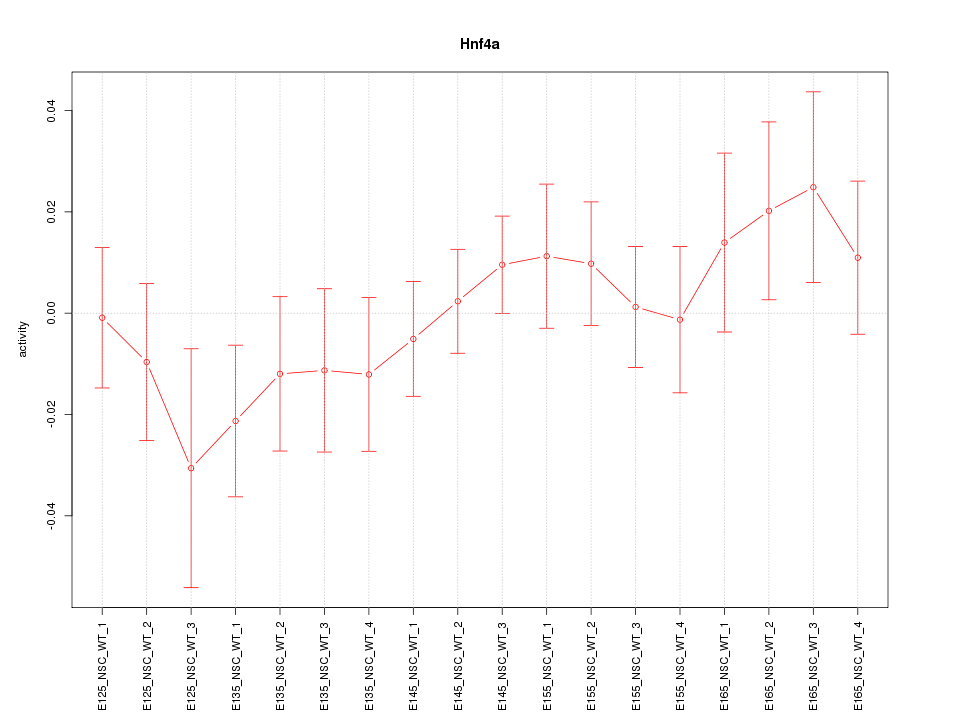
Motif ID: Hnf4a
Z-value: 0.836

Transcription factors associated with Hnf4a:
| Gene Symbol | Entrez ID | Gene Name |
|---|---|---|
| Hnf4a | ENSMUSG00000017950.10 | Hnf4a |


Top targets:
Gene overrepresentation in biological_process category:
| Log-likelihood per target | Total log-likelihood | Term | Description |
|---|---|---|---|
| 1.2 | 4.8 | GO:0097393 | post-embryonic appendage morphogenesis(GO:0035120) post-embryonic limb morphogenesis(GO:0035127) post-embryonic forelimb morphogenesis(GO:0035128) telomeric repeat-containing RNA transcription(GO:0097393) telomeric repeat-containing RNA transcription from RNA pol II promoter(GO:0097394) regulation of telomeric RNA transcription from RNA pol II promoter(GO:1901580) negative regulation of telomeric RNA transcription from RNA pol II promoter(GO:1901581) positive regulation of telomeric RNA transcription from RNA pol II promoter(GO:1901582) |
| 0.5 | 1.6 | GO:0071929 | alpha-tubulin acetylation(GO:0071929) |
| 0.5 | 1.5 | GO:0050915 | sensory perception of sour taste(GO:0050915) |
| 0.5 | 4.0 | GO:0097118 | neuroligin clustering involved in postsynaptic membrane assembly(GO:0097118) |
| 0.5 | 2.8 | GO:0030643 | cellular phosphate ion homeostasis(GO:0030643) phosphate ion transmembrane transport(GO:0035435) cellular trivalent inorganic anion homeostasis(GO:0072502) |
| 0.4 | 3.3 | GO:0061368 | maternal process involved in parturition(GO:0060137) behavioral response to chemical pain(GO:0061366) behavioral response to formalin induced pain(GO:0061368) |
| 0.3 | 1.7 | GO:0010735 | positive regulation of transcription via serum response element binding(GO:0010735) |
| 0.3 | 3.2 | GO:0090258 | negative regulation of mitochondrial fission(GO:0090258) |
| 0.3 | 0.8 | GO:0019074 | viral genome packaging(GO:0019072) viral RNA genome packaging(GO:0019074) |
| 0.3 | 0.8 | GO:0016554 | cytidine to uridine editing(GO:0016554) |
| 0.2 | 1.2 | GO:1901668 | regulation of superoxide dismutase activity(GO:1901668) |
| 0.2 | 1.1 | GO:0006543 | glutamine catabolic process(GO:0006543) |
| 0.2 | 0.6 | GO:0097155 | fasciculation of sensory neuron axon(GO:0097155) |
| 0.2 | 1.2 | GO:0032264 | IMP salvage(GO:0032264) |
| 0.2 | 0.5 | GO:0070973 | COPI-coated vesicle budding(GO:0035964) protein localization to endoplasmic reticulum exit site(GO:0070973) |
| 0.1 | 0.7 | GO:1902683 | regulation of receptor localization to synapse(GO:1902683) |
| 0.1 | 0.5 | GO:0035609 | C-terminal protein deglutamylation(GO:0035609) |
| 0.1 | 0.4 | GO:0006553 | lysine metabolic process(GO:0006553) |
| 0.1 | 0.4 | GO:1901052 | sarcosine metabolic process(GO:1901052) sarcosine catabolic process(GO:1901053) |
| 0.1 | 0.7 | GO:0016557 | peroxisome membrane biogenesis(GO:0016557) |
| 0.1 | 0.8 | GO:0098703 | calcium ion import across plasma membrane(GO:0098703) calcium ion import into cell(GO:1990035) |
| 0.1 | 1.6 | GO:0090331 | negative regulation of platelet aggregation(GO:0090331) |
| 0.1 | 1.4 | GO:0045741 | positive regulation of epidermal growth factor-activated receptor activity(GO:0045741) |
| 0.1 | 0.8 | GO:0034379 | very-low-density lipoprotein particle assembly(GO:0034379) |
| 0.1 | 0.5 | GO:0048133 | germ-line stem cell division(GO:0042078) male germ-line stem cell asymmetric division(GO:0048133) germline stem cell asymmetric division(GO:0098728) |
| 0.1 | 0.7 | GO:0015808 | L-alanine transport(GO:0015808) |
| 0.1 | 0.3 | GO:0050713 | negative regulation of interleukin-1 beta secretion(GO:0050713) |
| 0.1 | 0.5 | GO:0046292 | formaldehyde metabolic process(GO:0046292) |
| 0.1 | 0.5 | GO:0032596 | protein transport into membrane raft(GO:0032596) dsRNA transport(GO:0033227) |
| 0.1 | 0.3 | GO:1900533 | medium-chain fatty-acyl-CoA catabolic process(GO:0036114) long-chain fatty-acyl-CoA catabolic process(GO:0036116) palmitic acid metabolic process(GO:1900533) palmitic acid biosynthetic process(GO:1900535) |
| 0.1 | 1.5 | GO:0007095 | mitotic G2 DNA damage checkpoint(GO:0007095) |
| 0.1 | 0.2 | GO:0015910 | peroxisomal long-chain fatty acid import(GO:0015910) |
| 0.1 | 1.0 | GO:0050965 | detection of temperature stimulus involved in sensory perception(GO:0050961) detection of temperature stimulus involved in sensory perception of pain(GO:0050965) |
| 0.1 | 1.0 | GO:0070932 | histone H3 deacetylation(GO:0070932) |
| 0.1 | 0.2 | GO:0035963 | response to interleukin-13(GO:0035962) cellular response to interleukin-13(GO:0035963) |
| 0.1 | 0.4 | GO:0007296 | vitellogenesis(GO:0007296) |
| 0.1 | 0.2 | GO:0016056 | rhodopsin mediated signaling pathway(GO:0016056) |
| 0.1 | 0.4 | GO:2000483 | negative regulation of interleukin-8 secretion(GO:2000483) |
| 0.1 | 0.5 | GO:0032074 | negative regulation of nuclease activity(GO:0032074) |
| 0.1 | 0.3 | GO:0070164 | negative regulation of adiponectin secretion(GO:0070164) |
| 0.1 | 1.0 | GO:0006054 | N-acetylneuraminate metabolic process(GO:0006054) |
| 0.1 | 1.3 | GO:0010039 | response to iron ion(GO:0010039) |
| 0.1 | 0.4 | GO:0048312 | intracellular distribution of mitochondria(GO:0048312) |
| 0.1 | 2.2 | GO:0010614 | negative regulation of cardiac muscle hypertrophy(GO:0010614) |
| 0.1 | 0.2 | GO:0044339 | canonical Wnt signaling pathway involved in osteoblast differentiation(GO:0044339) |
| 0.1 | 0.2 | GO:0006742 | NADP catabolic process(GO:0006742) pyridine nucleotide catabolic process(GO:0019364) |
| 0.1 | 0.2 | GO:0019441 | tryptophan catabolic process(GO:0006569) tryptophan catabolic process to kynurenine(GO:0019441) quinolinate biosynthetic process(GO:0019805) indole-containing compound catabolic process(GO:0042436) indolalkylamine catabolic process(GO:0046218) kynurenine metabolic process(GO:0070189) |
| 0.1 | 0.7 | GO:0006654 | phosphatidic acid biosynthetic process(GO:0006654) |
| 0.1 | 0.1 | GO:1900126 | negative regulation of hyaluronan biosynthetic process(GO:1900126) |
| 0.0 | 4.1 | GO:0030279 | negative regulation of ossification(GO:0030279) |
| 0.0 | 0.6 | GO:0042761 | very long-chain fatty acid biosynthetic process(GO:0042761) |
| 0.0 | 3.3 | GO:0048286 | lung alveolus development(GO:0048286) |
| 0.0 | 1.1 | GO:0010758 | regulation of macrophage chemotaxis(GO:0010758) |
| 0.0 | 0.3 | GO:0042045 | epithelial fluid transport(GO:0042045) |
| 0.0 | 0.6 | GO:0035970 | peptidyl-threonine dephosphorylation(GO:0035970) |
| 0.0 | 1.5 | GO:0033344 | cholesterol efflux(GO:0033344) |
| 0.0 | 0.1 | GO:1904245 | regulation of polynucleotide adenylyltransferase activity(GO:1904245) |
| 0.0 | 1.7 | GO:0050919 | negative chemotaxis(GO:0050919) |
| 0.0 | 0.3 | GO:0097421 | liver regeneration(GO:0097421) |
| 0.0 | 0.7 | GO:0071392 | cellular response to estradiol stimulus(GO:0071392) |
| 0.0 | 0.3 | GO:0030035 | microspike assembly(GO:0030035) |
| 0.0 | 0.8 | GO:0035025 | positive regulation of Rho protein signal transduction(GO:0035025) |
| 0.0 | 0.1 | GO:0010571 | positive regulation of nuclear cell cycle DNA replication(GO:0010571) |
| 0.0 | 0.3 | GO:0019243 | methylglyoxal catabolic process to D-lactate via S-lactoyl-glutathione(GO:0019243) methylglyoxal catabolic process(GO:0051596) methylglyoxal catabolic process to lactate(GO:0061727) |
| 0.0 | 0.2 | GO:0071557 | histone H3-K27 demethylation(GO:0071557) |
| 0.0 | 0.2 | GO:0006290 | pyrimidine dimer repair(GO:0006290) |
| 0.0 | 1.1 | GO:0043001 | Golgi to plasma membrane protein transport(GO:0043001) positive regulation of axon extension(GO:0045773) |
| 0.0 | 0.1 | GO:1903275 | positive regulation of sodium ion export(GO:1903275) positive regulation of sodium ion export from cell(GO:1903278) regulation of inorganic anion transmembrane transport(GO:1903795) |
| 0.0 | 0.9 | GO:0008333 | endosome to lysosome transport(GO:0008333) |
| 0.0 | 3.1 | GO:1990830 | response to leukemia inhibitory factor(GO:1990823) cellular response to leukemia inhibitory factor(GO:1990830) |
| 0.0 | 0.1 | GO:0016584 | nucleosome positioning(GO:0016584) |
| 0.0 | 2.1 | GO:0030518 | intracellular steroid hormone receptor signaling pathway(GO:0030518) |
| 0.0 | 0.3 | GO:0030433 | ER-associated ubiquitin-dependent protein catabolic process(GO:0030433) |
| 0.0 | 0.5 | GO:0006730 | one-carbon metabolic process(GO:0006730) |
| 0.0 | 0.1 | GO:0006842 | tricarboxylic acid transport(GO:0006842) citrate transport(GO:0015746) |
| 0.0 | 2.6 | GO:0002244 | hematopoietic progenitor cell differentiation(GO:0002244) |
| 0.0 | 1.0 | GO:0043113 | receptor clustering(GO:0043113) |
| 0.0 | 0.8 | GO:0021799 | cerebral cortex radially oriented cell migration(GO:0021799) |
| 0.0 | 0.0 | GO:0046104 | thymidine metabolic process(GO:0046104) deoxyribonucleoside catabolic process(GO:0046121) |
| 0.0 | 0.1 | GO:0070294 | renal sodium ion transport(GO:0003096) renal sodium ion absorption(GO:0070294) |
| 0.0 | 0.4 | GO:0031146 | SCF-dependent proteasomal ubiquitin-dependent protein catabolic process(GO:0031146) |
| 0.0 | 0.3 | GO:2000300 | regulation of synaptic vesicle exocytosis(GO:2000300) |
Gene overrepresentation in cellular_component category:
| Log-likelihood per target | Total log-likelihood | Term | Description |
|---|---|---|---|
| 1.2 | 4.8 | GO:1990421 | subtelomeric heterochromatin(GO:1990421) nuclear subtelomeric heterochromatin(GO:1990707) |
| 0.4 | 4.0 | GO:0036056 | filtration diaphragm(GO:0036056) slit diaphragm(GO:0036057) |
| 0.3 | 2.7 | GO:0045298 | tubulin complex(GO:0045298) |
| 0.2 | 1.2 | GO:1990130 | Iml1 complex(GO:1990130) |
| 0.2 | 1.6 | GO:0097427 | microtubule bundle(GO:0097427) |
| 0.1 | 0.8 | GO:0042406 | extrinsic component of endoplasmic reticulum membrane(GO:0042406) |
| 0.1 | 0.9 | GO:0070695 | FHF complex(GO:0070695) |
| 0.1 | 0.3 | GO:0045251 | mitochondrial electron transfer flavoprotein complex(GO:0017133) electron transfer flavoprotein complex(GO:0045251) |
| 0.1 | 0.3 | GO:0048237 | rough endoplasmic reticulum lumen(GO:0048237) |
| 0.1 | 0.5 | GO:0005742 | mitochondrial outer membrane translocase complex(GO:0005742) |
| 0.1 | 0.3 | GO:0031314 | extrinsic component of mitochondrial inner membrane(GO:0031314) |
| 0.0 | 4.3 | GO:0005913 | cell-cell adherens junction(GO:0005913) |
| 0.0 | 0.4 | GO:0016460 | myosin II complex(GO:0016460) |
| 0.0 | 3.0 | GO:0031225 | anchored component of membrane(GO:0031225) |
| 0.0 | 0.7 | GO:0005779 | integral component of peroxisomal membrane(GO:0005779) |
| 0.0 | 0.1 | GO:0031523 | Myb complex(GO:0031523) |
| 0.0 | 0.2 | GO:0031931 | TORC1 complex(GO:0031931) |
| 0.0 | 1.7 | GO:0016605 | PML body(GO:0016605) |
| 0.0 | 1.1 | GO:0005882 | intermediate filament(GO:0005882) |
| 0.0 | 0.2 | GO:0042622 | photoreceptor outer segment membrane(GO:0042622) |
| 0.0 | 0.1 | GO:0016593 | Cdc73/Paf1 complex(GO:0016593) |
| 0.0 | 0.6 | GO:0044295 | axonal growth cone(GO:0044295) |
| 0.0 | 2.5 | GO:0043197 | dendritic spine(GO:0043197) |
| 0.0 | 0.4 | GO:0080008 | Cul4-RING E3 ubiquitin ligase complex(GO:0080008) |
| 0.0 | 2.8 | GO:0014069 | postsynaptic density(GO:0014069) |
| 0.0 | 0.3 | GO:0048786 | presynaptic active zone(GO:0048786) |
Gene overrepresentation in molecular_function category:
| Log-likelihood per target | Total log-likelihood | Term | Description |
|---|---|---|---|
| 1.4 | 4.1 | GO:0016167 | glial cell-derived neurotrophic factor receptor activity(GO:0016167) |
| 0.9 | 2.8 | GO:0000822 | inositol hexakisphosphate binding(GO:0000822) |
| 0.7 | 4.8 | GO:0015616 | DNA translocase activity(GO:0015616) |
| 0.4 | 1.8 | GO:0034041 | sterol-transporting ATPase activity(GO:0034041) |
| 0.4 | 2.4 | GO:0070699 | type II activin receptor binding(GO:0070699) |
| 0.4 | 2.7 | GO:0099609 | microtubule lateral binding(GO:0099609) |
| 0.3 | 1.5 | GO:0003835 | beta-galactoside alpha-2,6-sialyltransferase activity(GO:0003835) |
| 0.3 | 1.6 | GO:0004468 | lysine N-acetyltransferase activity, acting on acetyl phosphate as donor(GO:0004468) |
| 0.3 | 1.3 | GO:0000293 | ferric-chelate reductase activity(GO:0000293) |
| 0.2 | 0.7 | GO:0004994 | somatostatin receptor activity(GO:0004994) |
| 0.2 | 0.7 | GO:0015173 | hydrogen:amino acid symporter activity(GO:0005280) aromatic amino acid transmembrane transporter activity(GO:0015173) |
| 0.2 | 1.1 | GO:0004359 | glutaminase activity(GO:0004359) |
| 0.2 | 0.8 | GO:0004126 | cytidine deaminase activity(GO:0004126) |
| 0.2 | 1.1 | GO:0016936 | galactoside binding(GO:0016936) |
| 0.2 | 1.2 | GO:0003876 | AMP deaminase activity(GO:0003876) adenosine-phosphate deaminase activity(GO:0047623) |
| 0.1 | 0.8 | GO:0009374 | biotin binding(GO:0009374) |
| 0.1 | 0.5 | GO:0004030 | aldehyde dehydrogenase [NAD(P)+] activity(GO:0004030) |
| 0.1 | 1.6 | GO:0097109 | neuroligin family protein binding(GO:0097109) |
| 0.1 | 0.4 | GO:0046997 | sarcosine dehydrogenase activity(GO:0008480) oxidoreductase activity, acting on the CH-NH group of donors, flavin as acceptor(GO:0046997) |
| 0.1 | 4.1 | GO:0042805 | actinin binding(GO:0042805) |
| 0.1 | 2.5 | GO:0070016 | armadillo repeat domain binding(GO:0070016) |
| 0.1 | 0.6 | GO:0005005 | transmembrane-ephrin receptor activity(GO:0005005) PH domain binding(GO:0042731) |
| 0.1 | 3.3 | GO:0030676 | Rac guanyl-nucleotide exchange factor activity(GO:0030676) |
| 0.1 | 0.4 | GO:0016647 | oxidoreductase activity, acting on the CH-NH group of donors, oxygen as acceptor(GO:0016647) |
| 0.1 | 0.3 | GO:0004174 | electron-transferring-flavoprotein dehydrogenase activity(GO:0004174) oxidoreductase activity, acting on the CH-NH group of donors, quinone or similar compound as acceptor(GO:0016649) |
| 0.1 | 1.9 | GO:0071949 | FAD binding(GO:0071949) |
| 0.1 | 1.0 | GO:0008191 | metalloendopeptidase inhibitor activity(GO:0008191) |
| 0.1 | 0.5 | GO:0055131 | C3HC4-type RING finger domain binding(GO:0055131) |
| 0.1 | 1.5 | GO:0004709 | MAP kinase kinase kinase activity(GO:0004709) |
| 0.1 | 1.5 | GO:0005248 | voltage-gated sodium channel activity(GO:0005248) |
| 0.0 | 3.2 | GO:0017022 | myosin binding(GO:0017022) |
| 0.0 | 0.5 | GO:0004089 | carbonate dehydratase activity(GO:0004089) |
| 0.0 | 1.2 | GO:0051959 | dynein light intermediate chain binding(GO:0051959) |
| 0.0 | 0.8 | GO:0005545 | 1-phosphatidylinositol binding(GO:0005545) |
| 0.0 | 1.4 | GO:0005154 | epidermal growth factor receptor binding(GO:0005154) |
| 0.0 | 0.2 | GO:0005324 | long-chain fatty acid transporter activity(GO:0005324) |
| 0.0 | 0.4 | GO:0004143 | diacylglycerol kinase activity(GO:0004143) |
| 0.0 | 0.3 | GO:0016802 | adenosylhomocysteinase activity(GO:0004013) trialkylsulfonium hydrolase activity(GO:0016802) |
| 0.0 | 0.1 | GO:0052658 | inositol-1,4,5-trisphosphate 5-phosphatase activity(GO:0052658) |
| 0.0 | 0.5 | GO:0019104 | DNA N-glycosylase activity(GO:0019104) |
| 0.0 | 0.3 | GO:0004416 | hydroxyacylglutathione hydrolase activity(GO:0004416) |
| 0.0 | 0.2 | GO:0071558 | histone demethylase activity (H3-K27 specific)(GO:0071558) |
| 0.0 | 0.5 | GO:0004181 | metallocarboxypeptidase activity(GO:0004181) |
| 0.0 | 0.2 | GO:0052650 | NADP-retinol dehydrogenase activity(GO:0052650) |
| 0.0 | 0.3 | GO:0036042 | long-chain fatty acyl-CoA binding(GO:0036042) |
| 0.0 | 1.0 | GO:0004683 | calmodulin-dependent protein kinase activity(GO:0004683) |
| 0.0 | 0.5 | GO:0008483 | transaminase activity(GO:0008483) |
| 0.0 | 0.2 | GO:0001849 | complement component C1q binding(GO:0001849) |
| 0.0 | 1.0 | GO:0017112 | Rab guanyl-nucleotide exchange factor activity(GO:0017112) |
| 0.0 | 1.7 | GO:0005089 | Rho guanyl-nucleotide exchange factor activity(GO:0005089) |
| 0.0 | 0.3 | GO:0030247 | pattern binding(GO:0001871) polysaccharide binding(GO:0030247) |
| 0.0 | 0.5 | GO:0005086 | ARF guanyl-nucleotide exchange factor activity(GO:0005086) phosphatidylinositol-3,5-bisphosphate binding(GO:0080025) |
| 0.0 | 0.1 | GO:0032051 | clathrin light chain binding(GO:0032051) |
| 0.0 | 0.8 | GO:0015485 | cholesterol binding(GO:0015485) |
| 0.0 | 0.1 | GO:0015142 | citrate transmembrane transporter activity(GO:0015137) tricarboxylic acid transmembrane transporter activity(GO:0015142) |
| 0.0 | 0.2 | GO:0048018 | receptor agonist activity(GO:0048018) |
| 0.0 | 0.3 | GO:0003841 | 1-acylglycerol-3-phosphate O-acyltransferase activity(GO:0003841) |
| 0.0 | 0.2 | GO:0098641 | cadherin binding involved in cell-cell adhesion(GO:0098641) |
| 0.0 | 1.1 | GO:0004222 | metalloendopeptidase activity(GO:0004222) |
| 0.0 | 0.1 | GO:0004745 | retinol dehydrogenase activity(GO:0004745) |
| 0.0 | 0.1 | GO:0019531 | secondary active sulfate transmembrane transporter activity(GO:0008271) oxalate transmembrane transporter activity(GO:0019531) |
| 0.0 | 0.3 | GO:0032183 | SUMO binding(GO:0032183) |
| 0.0 | 1.1 | GO:0051020 | GTPase binding(GO:0051020) |
Gene overrepresentation in C2:CP category:
| Log-likelihood per target | Total log-likelihood | Term | Description |
|---|---|---|---|
| 0.1 | 2.7 | PID_P38_GAMMA_DELTA_PATHWAY | Signaling mediated by p38-gamma and p38-delta |
| 0.1 | 3.6 | PID_ARF6_DOWNSTREAM_PATHWAY | Arf6 downstream pathway |
| 0.1 | 1.4 | PID_ERBB_NETWORK_PATHWAY | ErbB receptor signaling network |
| 0.0 | 0.7 | PID_INTEGRIN2_PATHWAY | Beta2 integrin cell surface interactions |
| 0.0 | 1.5 | PID_P38_MKK3_6PATHWAY | p38 MAPK signaling pathway |
| 0.0 | 1.7 | PID_CDC42_REG_PATHWAY | Regulation of CDC42 activity |
| 0.0 | 2.3 | PID_ERA_GENOMIC_PATHWAY | Validated nuclear estrogen receptor alpha network |
| 0.0 | 0.2 | PID_TCR_RAS_PATHWAY | Ras signaling in the CD4+ TCR pathway |
| 0.0 | 0.5 | PID_IL12_STAT4_PATHWAY | IL12 signaling mediated by STAT4 |
| 0.0 | 0.3 | PID_INTEGRIN5_PATHWAY | Beta5 beta6 beta7 and beta8 integrin cell surface interactions |
| 0.0 | 1.0 | PID_P38_ALPHA_BETA_DOWNSTREAM_PATHWAY | Signaling mediated by p38-alpha and p38-beta |
| 0.0 | 1.2 | PID_CD8_TCR_PATHWAY | TCR signaling in naïve CD8+ T cells |
| 0.0 | 0.5 | PID_ARF_3PATHWAY | Arf1 pathway |
| 0.0 | 1.8 | NABA_ECM_AFFILIATED | Genes encoding proteins affiliated structurally or functionally to extracellular matrix proteins |
| 0.0 | 0.3 | PID_MYC_PATHWAY | C-MYC pathway |
| 0.0 | 0.4 | PID_NFAT_TFPATHWAY | Calcineurin-regulated NFAT-dependent transcription in lymphocytes |
Gene overrepresentation in C2:CP:REACTOME category:
| Log-likelihood per target | Total log-likelihood | Term | Description |
|---|---|---|---|
| 0.1 | 2.6 | REACTOME_ABCA_TRANSPORTERS_IN_LIPID_HOMEOSTASIS | Genes involved in ABCA transporters in lipid homeostasis |
| 0.1 | 2.7 | REACTOME_CASPASE_MEDIATED_CLEAVAGE_OF_CYTOSKELETAL_PROTEINS | Genes involved in Caspase-mediated cleavage of cytoskeletal proteins |
| 0.1 | 0.7 | REACTOME_COMMON_PATHWAY | Genes involved in Common Pathway |
| 0.1 | 2.4 | REACTOME_NEPHRIN_INTERACTIONS | Genes involved in Nephrin interactions |
| 0.1 | 1.2 | REACTOME_PURINE_SALVAGE | Genes involved in Purine salvage |
| 0.1 | 1.0 | REACTOME_GABA_A_RECEPTOR_ACTIVATION | Genes involved in GABA A receptor activation |
| 0.1 | 2.9 | REACTOME_NCAM1_INTERACTIONS | Genes involved in NCAM1 interactions |
| 0.1 | 1.1 | REACTOME_GLUTAMATE_NEUROTRANSMITTER_RELEASE_CYCLE | Genes involved in Glutamate Neurotransmitter Release Cycle |
| 0.1 | 4.0 | REACTOME_NRAGE_SIGNALS_DEATH_THROUGH_JNK | Genes involved in NRAGE signals death through JNK |
| 0.0 | 0.6 | REACTOME_SYNTHESIS_OF_PE | Genes involved in Synthesis of PE |
| 0.0 | 0.5 | REACTOME_COPI_MEDIATED_TRANSPORT | Genes involved in COPI Mediated Transport |
| 0.0 | 0.5 | REACTOME_GABA_SYNTHESIS_RELEASE_REUPTAKE_AND_DEGRADATION | Genes involved in GABA synthesis, release, reuptake and degradation |
| 0.0 | 0.4 | REACTOME_METABOLISM_OF_STEROID_HORMONES_AND_VITAMINS_A_AND_D | Genes involved in Metabolism of steroid hormones and vitamins A and D |
| 0.0 | 0.6 | REACTOME_SYNTHESIS_OF_VERY_LONG_CHAIN_FATTY_ACYL_COAS | Genes involved in Synthesis of very long-chain fatty acyl-CoAs |
| 0.0 | 0.7 | REACTOME_AMINO_ACID_TRANSPORT_ACROSS_THE_PLASMA_MEMBRANE | Genes involved in Amino acid transport across the plasma membrane |
| 0.0 | 0.2 | REACTOME_ACTIVATION_OF_RAC | Genes involved in Activation of Rac |
| 0.0 | 0.2 | REACTOME_TRYPTOPHAN_CATABOLISM | Genes involved in Tryptophan catabolism |
| 0.0 | 0.2 | REACTOME_SYNTHESIS_OF_PIPS_AT_THE_EARLY_ENDOSOME_MEMBRANE | Genes involved in Synthesis of PIPs at the early endosome membrane |
| 0.0 | 0.4 | REACTOME_EFFECTS_OF_PIP2_HYDROLYSIS | Genes involved in Effects of PIP2 hydrolysis |
| 0.0 | 0.2 | REACTOME_ERKS_ARE_INACTIVATED | Genes involved in ERKs are inactivated |
| 0.0 | 0.1 | REACTOME_FATTY_ACYL_COA_BIOSYNTHESIS | Genes involved in Fatty Acyl-CoA Biosynthesis |
| 0.0 | 0.4 | REACTOME_ASSOCIATION_OF_TRIC_CCT_WITH_TARGET_PROTEINS_DURING_BIOSYNTHESIS | Genes involved in Association of TriC/CCT with target proteins during biosynthesis |