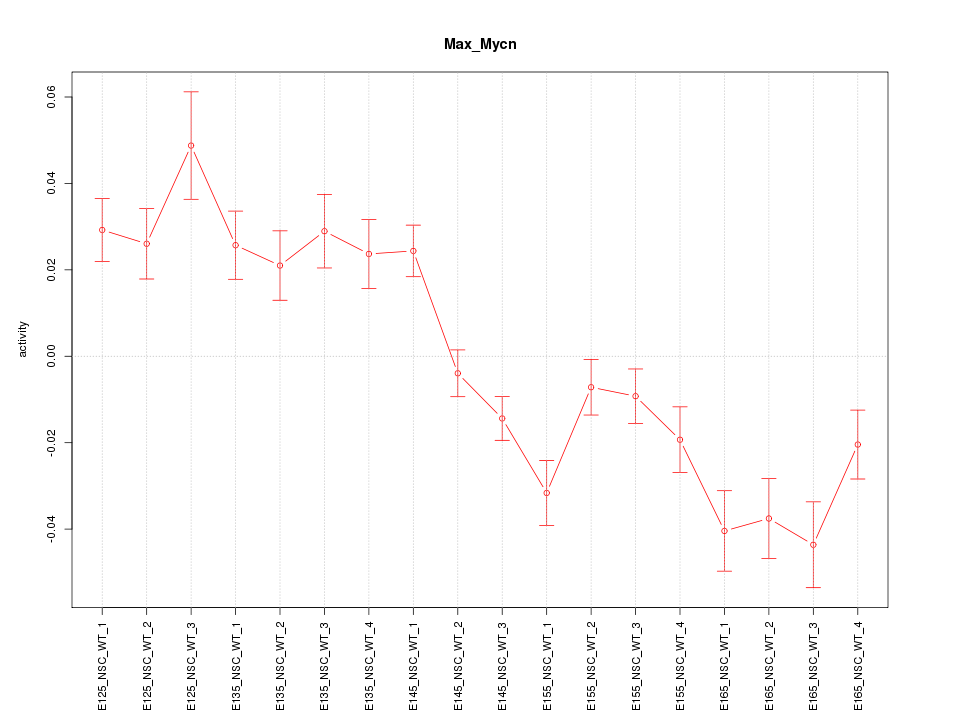
Motif ID: Max_Mycn
Z-value: 3.277


Transcription factors associated with Max_Mycn:
| Gene Symbol | Entrez ID | Gene Name |
|---|---|---|
| Max | ENSMUSG00000059436.6 | Max |
| Mycn | ENSMUSG00000037169.8 | Mycn |
Activity-expression correlation:
| Gene Symbol | Promoter | Pearson corr. coef. | P-value | Plot |
|---|---|---|---|---|
| Max | mm10_v2_chr12_-_76962178_76962248 | -0.76 | 2.2e-04 | Click! |
| Mycn | mm10_v2_chr12_-_12941827_12941914 | -0.49 | 4.1e-02 | Click! |


Top targets:
Gene overrepresentation in biological_process category:
| Log-likelihood per target | Total log-likelihood | Term | Description |
|---|---|---|---|
| 5.6 | 22.3 | GO:0010288 | response to lead ion(GO:0010288) |
| 3.6 | 10.9 | GO:0086047 | membrane depolarization during Purkinje myocyte cell action potential(GO:0086047) |
| 3.2 | 12.7 | GO:0046073 | dTMP biosynthetic process(GO:0006231) dTMP metabolic process(GO:0046073) |
| 3.2 | 9.5 | GO:0061153 | trachea submucosa development(GO:0061152) trachea gland development(GO:0061153) regulation of estrogen receptor binding(GO:0071898) negative regulation of estrogen receptor binding(GO:0071899) |
| 3.1 | 9.3 | GO:1990523 | bone regeneration(GO:1990523) |
| 3.1 | 12.4 | GO:0070858 | negative regulation of bile acid biosynthetic process(GO:0070858) negative regulation of bile acid metabolic process(GO:1904252) |
| 3.1 | 18.5 | GO:0006452 | translational frameshifting(GO:0006452) positive regulation of translational termination(GO:0045905) |
| 2.9 | 11.7 | GO:2000820 | negative regulation of transcription from RNA polymerase II promoter involved in smooth muscle cell differentiation(GO:2000820) |
| 2.5 | 2.5 | GO:0009153 | purine deoxyribonucleotide biosynthetic process(GO:0009153) |
| 2.3 | 6.9 | GO:0072180 | mesonephric duct development(GO:0072177) mesonephric duct morphogenesis(GO:0072180) |
| 2.3 | 11.4 | GO:0006189 | 'de novo' IMP biosynthetic process(GO:0006189) |
| 2.2 | 6.5 | GO:0009446 | putrescine biosynthetic process(GO:0009446) |
| 2.2 | 6.5 | GO:0097296 | activation of cysteine-type endopeptidase activity involved in apoptotic signaling pathway(GO:0097296) |
| 2.1 | 8.5 | GO:1902724 | positive regulation of skeletal muscle satellite cell proliferation(GO:1902724) positive regulation of growth factor dependent skeletal muscle satellite cell proliferation(GO:1902728) |
| 2.1 | 4.2 | GO:0006244 | pyrimidine nucleotide catabolic process(GO:0006244) pyrimidine deoxyribonucleotide catabolic process(GO:0009223) |
| 2.0 | 4.0 | GO:0010643 | cell communication by chemical coupling(GO:0010643) |
| 1.9 | 7.7 | GO:0002337 | B-1a B cell differentiation(GO:0002337) |
| 1.9 | 5.8 | GO:0060167 | regulation of adenosine receptor signaling pathway(GO:0060167) regulation of G-protein coupled receptor internalization(GO:1904020) |
| 1.9 | 9.5 | GO:2000255 | negative regulation of male germ cell proliferation(GO:2000255) |
| 1.8 | 5.5 | GO:0035934 | corticosterone secretion(GO:0035934) regulation of corticosterone secretion(GO:2000852) |
| 1.8 | 8.9 | GO:0070934 | CRD-mediated mRNA stabilization(GO:0070934) |
| 1.8 | 5.3 | GO:0006285 | base-excision repair, AP site formation(GO:0006285) |
| 1.8 | 5.3 | GO:0045041 | protein import into mitochondrial intermembrane space(GO:0045041) |
| 1.7 | 5.2 | GO:0006059 | hexitol metabolic process(GO:0006059) |
| 1.7 | 3.4 | GO:0048389 | intermediate mesoderm development(GO:0048389) pattern specification involved in mesonephros development(GO:0061227) anterior/posterior pattern specification involved in kidney development(GO:0072098) |
| 1.7 | 8.5 | GO:0009162 | deoxyribonucleoside monophosphate metabolic process(GO:0009162) |
| 1.7 | 6.7 | GO:2000313 | fibroblast growth factor receptor signaling pathway involved in neural plate anterior/posterior pattern formation(GO:0060825) regulation of fibroblast growth factor receptor signaling pathway involved in neural plate anterior/posterior pattern formation(GO:2000313) |
| 1.7 | 5.0 | GO:0086053 | AV node cell to bundle of His cell communication by electrical coupling(GO:0086053) |
| 1.6 | 4.9 | GO:0018298 | protein-chromophore linkage(GO:0018298) |
| 1.6 | 4.9 | GO:1904706 | negative regulation of vascular smooth muscle cell proliferation(GO:1904706) |
| 1.6 | 6.5 | GO:0007354 | zygotic determination of anterior/posterior axis, embryo(GO:0007354) |
| 1.6 | 6.4 | GO:0060838 | lymphatic endothelial cell fate commitment(GO:0060838) |
| 1.5 | 6.2 | GO:0071930 | negative regulation of transcription involved in G1/S transition of mitotic cell cycle(GO:0071930) |
| 1.5 | 4.6 | GO:0045819 | plasmacytoid dendritic cell activation(GO:0002270) positive regulation of glycogen catabolic process(GO:0045819) |
| 1.5 | 4.4 | GO:0046032 | ADP catabolic process(GO:0046032) |
| 1.4 | 4.3 | GO:0072717 | cellular response to actinomycin D(GO:0072717) |
| 1.4 | 4.3 | GO:0036166 | phenotypic switching(GO:0036166) |
| 1.4 | 1.4 | GO:0009136 | nucleoside diphosphate biosynthetic process(GO:0009133) purine nucleoside diphosphate biosynthetic process(GO:0009136) purine ribonucleoside diphosphate biosynthetic process(GO:0009180) ribonucleoside diphosphate biosynthetic process(GO:0009188) |
| 1.4 | 7.0 | GO:0019244 | lactate biosynthetic process from pyruvate(GO:0019244) |
| 1.4 | 6.9 | GO:0043985 | histone H4-R3 methylation(GO:0043985) |
| 1.3 | 5.4 | GO:0006438 | valyl-tRNA aminoacylation(GO:0006438) |
| 1.3 | 14.8 | GO:0006228 | UTP biosynthetic process(GO:0006228) |
| 1.3 | 5.4 | GO:1905065 | positive regulation of vascular smooth muscle cell differentiation(GO:1905065) |
| 1.3 | 5.2 | GO:0032053 | ciliary basal body organization(GO:0032053) |
| 1.3 | 3.9 | GO:0072049 | comma-shaped body morphogenesis(GO:0072049) |
| 1.3 | 11.7 | GO:0070874 | negative regulation of glycogen biosynthetic process(GO:0045719) negative regulation of glycogen metabolic process(GO:0070874) |
| 1.3 | 3.8 | GO:1900108 | negative regulation of nodal signaling pathway(GO:1900108) |
| 1.2 | 3.7 | GO:0006546 | glycine catabolic process(GO:0006546) glycine decarboxylation via glycine cleavage system(GO:0019464) |
| 1.2 | 3.7 | GO:0007161 | calcium-independent cell-matrix adhesion(GO:0007161) |
| 1.2 | 6.0 | GO:0006564 | L-serine biosynthetic process(GO:0006564) |
| 1.2 | 4.7 | GO:0045903 | positive regulation of translational fidelity(GO:0045903) |
| 1.1 | 2.3 | GO:0003100 | regulation of systemic arterial blood pressure by endothelin(GO:0003100) |
| 1.1 | 9.0 | GO:0000056 | ribosomal small subunit export from nucleus(GO:0000056) |
| 1.1 | 5.6 | GO:0007386 | compartment pattern specification(GO:0007386) |
| 1.1 | 7.8 | GO:0007440 | foregut morphogenesis(GO:0007440) embryonic foregut morphogenesis(GO:0048617) |
| 1.1 | 3.3 | GO:0061198 | fungiform papilla formation(GO:0061198) |
| 1.1 | 15.4 | GO:0002192 | IRES-dependent translational initiation(GO:0002192) |
| 1.1 | 8.7 | GO:0035726 | common myeloid progenitor cell proliferation(GO:0035726) |
| 1.1 | 5.4 | GO:0045039 | protein import into mitochondrial inner membrane(GO:0045039) |
| 1.1 | 5.3 | GO:0000237 | leptotene(GO:0000237) |
| 1.1 | 3.2 | GO:0070476 | rRNA (guanine-N7)-methylation(GO:0070476) |
| 1.0 | 10.5 | GO:0018195 | peptidyl-arginine modification(GO:0018195) |
| 1.0 | 4.1 | GO:0000957 | mitochondrial RNA catabolic process(GO:0000957) regulation of mitochondrial RNA catabolic process(GO:0000960) |
| 1.0 | 3.1 | GO:0097278 | transforming growth factor beta activation(GO:0036363) complement-dependent cytotoxicity(GO:0097278) |
| 1.0 | 5.1 | GO:1903553 | positive regulation of extracellular exosome assembly(GO:1903553) |
| 1.0 | 11.9 | GO:0000244 | spliceosomal tri-snRNP complex assembly(GO:0000244) |
| 1.0 | 4.0 | GO:0042360 | vitamin E metabolic process(GO:0042360) |
| 1.0 | 6.9 | GO:0000447 | endonucleolytic cleavage in ITS1 to separate SSU-rRNA from 5.8S rRNA and LSU-rRNA from tricistronic rRNA transcript (SSU-rRNA, 5.8S rRNA, LSU-rRNA)(GO:0000447) |
| 1.0 | 4.9 | GO:0045716 | positive regulation of low-density lipoprotein particle receptor biosynthetic process(GO:0045716) |
| 1.0 | 2.9 | GO:0042908 | xenobiotic transport(GO:0042908) |
| 1.0 | 5.7 | GO:0043504 | mitochondrial DNA repair(GO:0043504) |
| 0.9 | 5.7 | GO:0034080 | CENP-A containing nucleosome assembly(GO:0034080) CENP-A containing chromatin organization(GO:0061641) |
| 0.9 | 6.6 | GO:0046549 | retinal cone cell development(GO:0046549) |
| 0.9 | 2.7 | GO:0000320 | re-entry into mitotic cell cycle(GO:0000320) |
| 0.9 | 4.6 | GO:0006543 | glutamine catabolic process(GO:0006543) |
| 0.9 | 5.5 | GO:0031536 | positive regulation of exit from mitosis(GO:0031536) |
| 0.9 | 3.7 | GO:0060265 | positive regulation of respiratory burst involved in inflammatory response(GO:0060265) |
| 0.9 | 2.7 | GO:0032241 | positive regulation of nucleobase-containing compound transport(GO:0032241) |
| 0.9 | 2.7 | GO:0014738 | regulation of muscle hyperplasia(GO:0014738) muscle hyperplasia(GO:0014900) |
| 0.9 | 2.7 | GO:1903054 | protein targeting to vacuole involved in autophagy(GO:0071211) lysosomal membrane organization(GO:0097212) negative regulation of extracellular matrix organization(GO:1903054) positive regulation of protein folding(GO:1903334) |
| 0.9 | 3.6 | GO:0002949 | tRNA threonylcarbamoyladenosine modification(GO:0002949) |
| 0.9 | 4.4 | GO:0032899 | regulation of neurotrophin production(GO:0032899) positive regulation of neurotrophin production(GO:0032901) |
| 0.9 | 0.9 | GO:0003376 | sphingosine-1-phosphate signaling pathway(GO:0003376) sphingolipid mediated signaling pathway(GO:0090520) |
| 0.9 | 2.7 | GO:0008626 | granzyme-mediated apoptotic signaling pathway(GO:0008626) |
| 0.9 | 7.0 | GO:0040031 | snRNA modification(GO:0040031) |
| 0.9 | 3.5 | GO:0003360 | brainstem development(GO:0003360) |
| 0.9 | 5.2 | GO:0007253 | cytoplasmic sequestering of NF-kappaB(GO:0007253) |
| 0.9 | 3.5 | GO:0030576 | Cajal body organization(GO:0030576) |
| 0.9 | 8.6 | GO:0035873 | lactate transport(GO:0015727) lactate transmembrane transport(GO:0035873) plasma membrane lactate transport(GO:0035879) |
| 0.9 | 0.9 | GO:0048254 | snoRNA localization(GO:0048254) |
| 0.9 | 4.3 | GO:0018002 | N-terminal peptidyl-serine acetylation(GO:0017198) N-terminal peptidyl-glutamic acid acetylation(GO:0018002) peptidyl-serine acetylation(GO:0030920) |
| 0.9 | 1.7 | GO:0000454 | snoRNA guided rRNA pseudouridine synthesis(GO:0000454) |
| 0.9 | 6.0 | GO:0035331 | negative regulation of hippo signaling(GO:0035331) |
| 0.9 | 2.6 | GO:0098968 | neurotransmitter receptor transport postsynaptic membrane to endosome(GO:0098968) |
| 0.8 | 5.1 | GO:0060242 | contact inhibition(GO:0060242) |
| 0.8 | 0.8 | GO:0006409 | tRNA export from nucleus(GO:0006409) tRNA transport(GO:0051031) tRNA-containing ribonucleoprotein complex export from nucleus(GO:0071431) |
| 0.8 | 5.9 | GO:2000124 | regulation of endocannabinoid signaling pathway(GO:2000124) |
| 0.8 | 1.7 | GO:0075525 | viral translational termination-reinitiation(GO:0075525) |
| 0.8 | 2.5 | GO:0000720 | pyrimidine dimer repair by nucleotide-excision repair(GO:0000720) |
| 0.8 | 4.2 | GO:0044340 | canonical Wnt signaling pathway involved in regulation of cell proliferation(GO:0044340) |
| 0.8 | 3.3 | GO:1990379 | lipid transport across blood brain barrier(GO:1990379) |
| 0.8 | 4.1 | GO:1904936 | cerebral cortex GABAergic interneuron migration(GO:0021853) interneuron migration(GO:1904936) |
| 0.8 | 2.5 | GO:0035973 | aggrephagy(GO:0035973) |
| 0.8 | 9.0 | GO:0032310 | prostaglandin secretion(GO:0032310) |
| 0.8 | 1.6 | GO:2000157 | regulation of protein K48-linked deubiquitination(GO:1903093) negative regulation of protein K48-linked deubiquitination(GO:1903094) negative regulation of ubiquitin-specific protease activity(GO:2000157) |
| 0.8 | 2.4 | GO:0060023 | soft palate development(GO:0060023) |
| 0.8 | 1.6 | GO:1904170 | regulation of bleb assembly(GO:1904170) |
| 0.8 | 2.4 | GO:0002014 | vasoconstriction of artery involved in ischemic response to lowering of systemic arterial blood pressure(GO:0002014) |
| 0.8 | 1.6 | GO:0010424 | DNA methylation on cytosine within a CG sequence(GO:0010424) |
| 0.8 | 5.6 | GO:0019262 | N-acetylneuraminate catabolic process(GO:0019262) |
| 0.8 | 3.2 | GO:0060535 | trachea cartilage morphogenesis(GO:0060535) |
| 0.8 | 2.4 | GO:0015712 | hexose phosphate transport(GO:0015712) glucose-6-phosphate transport(GO:0015760) |
| 0.8 | 3.9 | GO:0000467 | exonucleolytic trimming involved in rRNA processing(GO:0000459) exonucleolytic trimming to generate mature 3'-end of 5.8S rRNA from tricistronic rRNA transcript (SSU-rRNA, 5.8S rRNA, LSU-rRNA)(GO:0000467) nuclear polyadenylation-dependent tRNA catabolic process(GO:0071038) |
| 0.8 | 2.3 | GO:0032847 | regulation of cellular pH reduction(GO:0032847) |
| 0.8 | 4.6 | GO:0043951 | negative regulation of cAMP-mediated signaling(GO:0043951) |
| 0.7 | 1.5 | GO:0090118 | receptor-mediated endocytosis of low-density lipoprotein particle involved in cholesterol transport(GO:0090118) |
| 0.7 | 1.5 | GO:0018364 | peptidyl-glutamine methylation(GO:0018364) |
| 0.7 | 2.9 | GO:0000255 | allantoin metabolic process(GO:0000255) |
| 0.7 | 1.5 | GO:2000373 | regulation of DNA topoisomerase (ATP-hydrolyzing) activity(GO:2000371) positive regulation of DNA topoisomerase (ATP-hydrolyzing) activity(GO:2000373) |
| 0.7 | 5.9 | GO:0000466 | maturation of 5.8S rRNA from tricistronic rRNA transcript (SSU-rRNA, 5.8S rRNA, LSU-rRNA)(GO:0000466) |
| 0.7 | 7.3 | GO:0006977 | DNA damage response, signal transduction by p53 class mediator resulting in cell cycle arrest(GO:0006977) |
| 0.7 | 11.6 | GO:2000353 | positive regulation of endothelial cell apoptotic process(GO:2000353) |
| 0.7 | 1.4 | GO:0097411 | hypoxia-inducible factor-1alpha signaling pathway(GO:0097411) |
| 0.7 | 5.0 | GO:0006105 | succinate metabolic process(GO:0006105) |
| 0.7 | 11.2 | GO:0038092 | nodal signaling pathway(GO:0038092) |
| 0.7 | 1.4 | GO:0045343 | MHC class I biosynthetic process(GO:0045341) regulation of MHC class I biosynthetic process(GO:0045343) positive regulation of MHC class I biosynthetic process(GO:0045345) |
| 0.7 | 0.7 | GO:0071451 | cellular response to oxygen radical(GO:0071450) cellular response to superoxide(GO:0071451) |
| 0.7 | 0.7 | GO:0016078 | tRNA catabolic process(GO:0016078) |
| 0.7 | 2.7 | GO:1990481 | mRNA pseudouridine synthesis(GO:1990481) |
| 0.7 | 3.3 | GO:0032439 | endosome localization(GO:0032439) |
| 0.6 | 1.3 | GO:0090073 | positive regulation of protein homodimerization activity(GO:0090073) |
| 0.6 | 1.9 | GO:0006419 | alanyl-tRNA aminoacylation(GO:0006419) |
| 0.6 | 9.5 | GO:0010216 | maintenance of DNA methylation(GO:0010216) |
| 0.6 | 1.3 | GO:1903416 | response to glycoside(GO:1903416) |
| 0.6 | 2.5 | GO:0051316 | attachment of spindle microtubules to kinetochore involved in meiotic chromosome segregation(GO:0051316) |
| 0.6 | 6.7 | GO:2000675 | negative regulation of type B pancreatic cell apoptotic process(GO:2000675) |
| 0.6 | 0.6 | GO:0060528 | secretory columnal luminar epithelial cell differentiation involved in prostate glandular acinus development(GO:0060528) |
| 0.6 | 0.6 | GO:0043096 | purine nucleobase salvage(GO:0043096) |
| 0.6 | 1.2 | GO:1902037 | negative regulation of hematopoietic stem cell differentiation(GO:1902037) |
| 0.6 | 3.5 | GO:0044351 | macropinocytosis(GO:0044351) |
| 0.6 | 2.9 | GO:0002318 | myeloid progenitor cell differentiation(GO:0002318) |
| 0.6 | 7.5 | GO:1904874 | positive regulation of telomerase RNA localization to Cajal body(GO:1904874) |
| 0.6 | 1.2 | GO:0021562 | vestibulocochlear nerve development(GO:0021562) |
| 0.6 | 1.1 | GO:0051639 | actin filament network formation(GO:0051639) |
| 0.6 | 1.7 | GO:0042823 | pyridoxal phosphate biosynthetic process(GO:0042823) |
| 0.6 | 1.1 | GO:0045869 | negative regulation of single stranded viral RNA replication via double stranded DNA intermediate(GO:0045869) positive regulation of methylation-dependent chromatin silencing(GO:0090309) |
| 0.6 | 2.2 | GO:0046604 | positive regulation of mitotic centrosome separation(GO:0046604) |
| 0.5 | 1.6 | GO:0070889 | platelet alpha granule organization(GO:0070889) |
| 0.5 | 2.2 | GO:2000256 | endomitotic cell cycle(GO:0007113) thrombopoietin-mediated signaling pathway(GO:0038163) positive regulation of male germ cell proliferation(GO:2000256) |
| 0.5 | 1.6 | GO:0019043 | establishment of viral latency(GO:0019043) |
| 0.5 | 2.2 | GO:0009209 | pyrimidine ribonucleoside triphosphate biosynthetic process(GO:0009209) |
| 0.5 | 1.6 | GO:0030200 | heparan sulfate proteoglycan catabolic process(GO:0030200) |
| 0.5 | 1.6 | GO:0009174 | UMP biosynthetic process(GO:0006222) pyrimidine nucleoside monophosphate metabolic process(GO:0009129) pyrimidine nucleoside monophosphate biosynthetic process(GO:0009130) pyrimidine ribonucleoside monophosphate metabolic process(GO:0009173) pyrimidine ribonucleoside monophosphate biosynthetic process(GO:0009174) UMP metabolic process(GO:0046049) |
| 0.5 | 3.2 | GO:0016127 | cholesterol catabolic process(GO:0006707) sterol catabolic process(GO:0016127) |
| 0.5 | 5.9 | GO:0001522 | pseudouridine synthesis(GO:0001522) |
| 0.5 | 1.6 | GO:0002940 | tRNA N2-guanine methylation(GO:0002940) |
| 0.5 | 1.1 | GO:0032877 | positive regulation of DNA endoreduplication(GO:0032877) |
| 0.5 | 2.1 | GO:0070125 | mitochondrial translational elongation(GO:0070125) |
| 0.5 | 3.7 | GO:0097501 | stress response to metal ion(GO:0097501) |
| 0.5 | 3.7 | GO:0044806 | G-quadruplex DNA unwinding(GO:0044806) |
| 0.5 | 1.6 | GO:0034389 | lipid particle organization(GO:0034389) |
| 0.5 | 1.6 | GO:0002326 | B cell lineage commitment(GO:0002326) |
| 0.5 | 1.0 | GO:0010957 | negative regulation of vitamin D biosynthetic process(GO:0010957) negative regulation of vitamin metabolic process(GO:0046137) |
| 0.5 | 2.6 | GO:0010668 | ectodermal cell differentiation(GO:0010668) |
| 0.5 | 2.6 | GO:0051661 | maintenance of centrosome location(GO:0051661) |
| 0.5 | 2.6 | GO:0015671 | oxygen transport(GO:0015671) |
| 0.5 | 3.1 | GO:0098734 | protein depalmitoylation(GO:0002084) macromolecule depalmitoylation(GO:0098734) |
| 0.5 | 4.1 | GO:0030322 | stabilization of membrane potential(GO:0030322) |
| 0.5 | 3.6 | GO:0070458 | detoxification of nitrogen compound(GO:0051410) cellular detoxification of nitrogen compound(GO:0070458) |
| 0.5 | 3.1 | GO:0071394 | cellular response to testosterone stimulus(GO:0071394) |
| 0.5 | 4.1 | GO:0061484 | hematopoietic stem cell homeostasis(GO:0061484) |
| 0.5 | 0.5 | GO:0035721 | intraciliary retrograde transport(GO:0035721) |
| 0.5 | 6.1 | GO:0045603 | positive regulation of endothelial cell differentiation(GO:0045603) |
| 0.5 | 1.5 | GO:0071707 | immunoglobulin heavy chain V-D-J recombination(GO:0071707) |
| 0.5 | 2.0 | GO:0043490 | malate-aspartate shuttle(GO:0043490) |
| 0.5 | 22.6 | GO:0006414 | translational elongation(GO:0006414) |
| 0.5 | 4.0 | GO:0018158 | protein oxidation(GO:0018158) |
| 0.5 | 7.9 | GO:0030150 | protein import into mitochondrial matrix(GO:0030150) |
| 0.5 | 2.4 | GO:0090273 | regulation of somatostatin secretion(GO:0090273) |
| 0.5 | 1.4 | GO:0046098 | regulation of primitive erythrocyte differentiation(GO:0010725) guanine metabolic process(GO:0046098) |
| 0.5 | 1.9 | GO:0019087 | transformation of host cell by virus(GO:0019087) |
| 0.5 | 1.4 | GO:1902071 | positive regulation of cellular response to hypoxia(GO:1900039) regulation of hypoxia-inducible factor-1alpha signaling pathway(GO:1902071) |
| 0.5 | 3.8 | GO:0071285 | cellular response to lithium ion(GO:0071285) |
| 0.5 | 4.2 | GO:0002315 | marginal zone B cell differentiation(GO:0002315) |
| 0.5 | 2.3 | GO:0036089 | cleavage furrow formation(GO:0036089) |
| 0.5 | 2.7 | GO:0046502 | uroporphyrinogen III metabolic process(GO:0046502) |
| 0.4 | 4.5 | GO:0080111 | DNA demethylation(GO:0080111) |
| 0.4 | 6.7 | GO:0045723 | positive regulation of fatty acid biosynthetic process(GO:0045723) |
| 0.4 | 0.9 | GO:0070682 | proteasome regulatory particle assembly(GO:0070682) |
| 0.4 | 0.4 | GO:2000049 | positive regulation of cell-cell adhesion mediated by cadherin(GO:2000049) |
| 0.4 | 1.3 | GO:2000510 | regulation of MDA-5 signaling pathway(GO:0039533) positive regulation of dendritic cell chemotaxis(GO:2000510) |
| 0.4 | 1.3 | GO:1902219 | negative regulation of intrinsic apoptotic signaling pathway in response to osmotic stress(GO:1902219) |
| 0.4 | 4.8 | GO:0036158 | outer dynein arm assembly(GO:0036158) |
| 0.4 | 3.9 | GO:0001842 | neural fold formation(GO:0001842) |
| 0.4 | 7.8 | GO:0006907 | pinocytosis(GO:0006907) |
| 0.4 | 1.3 | GO:0051151 | negative regulation of smooth muscle cell differentiation(GO:0051151) |
| 0.4 | 0.4 | GO:0018343 | protein farnesylation(GO:0018343) |
| 0.4 | 2.1 | GO:0042637 | catagen(GO:0042637) |
| 0.4 | 1.7 | GO:0072272 | proximal/distal pattern formation involved in metanephric nephron development(GO:0072272) |
| 0.4 | 1.3 | GO:0043568 | positive regulation of insulin-like growth factor receptor signaling pathway(GO:0043568) |
| 0.4 | 2.1 | GO:2000680 | regulation of rubidium ion transport(GO:2000680) |
| 0.4 | 0.8 | GO:0070973 | protein localization to endoplasmic reticulum exit site(GO:0070973) |
| 0.4 | 1.7 | GO:1903760 | regulation of voltage-gated potassium channel activity involved in ventricular cardiac muscle cell action potential repolarization(GO:1903760) regulation of potassium ion export across plasma membrane(GO:1903764) regulation of membrane repolarization during ventricular cardiac muscle cell action potential(GO:1905024) |
| 0.4 | 2.1 | GO:0006177 | GMP biosynthetic process(GO:0006177) |
| 0.4 | 0.8 | GO:0030656 | regulation of vitamin metabolic process(GO:0030656) |
| 0.4 | 1.7 | GO:1904694 | negative regulation of vascular smooth muscle contraction(GO:1904694) |
| 0.4 | 1.6 | GO:2000987 | positive regulation of fear response(GO:1903367) positive regulation of behavioral fear response(GO:2000987) |
| 0.4 | 2.0 | GO:0015705 | iodide transport(GO:0015705) |
| 0.4 | 0.4 | GO:0001771 | immunological synapse formation(GO:0001771) |
| 0.4 | 0.8 | GO:0072553 | terminal button organization(GO:0072553) |
| 0.4 | 0.4 | GO:1902263 | apoptotic process involved in embryonic digit morphogenesis(GO:1902263) |
| 0.4 | 0.8 | GO:0009113 | purine nucleobase biosynthetic process(GO:0009113) |
| 0.4 | 2.4 | GO:0090166 | Golgi disassembly(GO:0090166) |
| 0.4 | 1.2 | GO:0045004 | DNA replication proofreading(GO:0045004) |
| 0.4 | 2.8 | GO:0032782 | bile acid secretion(GO:0032782) |
| 0.4 | 1.2 | GO:0072204 | cell-cell signaling involved in kidney development(GO:0060995) Wnt signaling pathway involved in kidney development(GO:0061289) canonical Wnt signaling pathway involved in metanephric kidney development(GO:0061290) cell-cell signaling involved in metanephros development(GO:0072204) |
| 0.4 | 1.2 | GO:0070459 | prolactin secretion(GO:0070459) |
| 0.4 | 6.3 | GO:0030213 | hyaluronan biosynthetic process(GO:0030213) |
| 0.4 | 3.9 | GO:1901030 | positive regulation of mitochondrial outer membrane permeabilization involved in apoptotic signaling pathway(GO:1901030) |
| 0.4 | 7.0 | GO:0051988 | regulation of attachment of spindle microtubules to kinetochore(GO:0051988) |
| 0.4 | 1.5 | GO:1901838 | positive regulation of transcription of nuclear large rRNA transcript from RNA polymerase I promoter(GO:1901838) |
| 0.4 | 0.8 | GO:0090365 | regulation of mRNA modification(GO:0090365) |
| 0.4 | 3.5 | GO:0090209 | negative regulation of triglyceride metabolic process(GO:0090209) |
| 0.4 | 1.5 | GO:1901857 | positive regulation of cellular respiration(GO:1901857) |
| 0.4 | 2.3 | GO:0060019 | radial glial cell differentiation(GO:0060019) |
| 0.4 | 1.1 | GO:0021972 | corticospinal neuron axon guidance(GO:0021966) corticospinal neuron axon guidance through spinal cord(GO:0021972) positive regulation of negative chemotaxis(GO:0050924) induction of negative chemotaxis(GO:0050929) negative regulation of mononuclear cell migration(GO:0071676) negative regulation of retinal ganglion cell axon guidance(GO:0090260) |
| 0.4 | 1.1 | GO:0071492 | cellular response to UV-A(GO:0071492) |
| 0.4 | 3.8 | GO:2000507 | positive regulation of energy homeostasis(GO:2000507) |
| 0.4 | 1.5 | GO:1990791 | dorsal root ganglion development(GO:1990791) |
| 0.4 | 4.1 | GO:0034498 | early endosome to Golgi transport(GO:0034498) |
| 0.4 | 1.5 | GO:0015786 | UDP-glucose transport(GO:0015786) |
| 0.4 | 7.8 | GO:2000060 | positive regulation of protein ubiquitination involved in ubiquitin-dependent protein catabolic process(GO:2000060) |
| 0.4 | 1.9 | GO:0045743 | positive regulation of fibroblast growth factor receptor signaling pathway(GO:0045743) |
| 0.4 | 4.8 | GO:0006000 | fructose metabolic process(GO:0006000) |
| 0.4 | 0.4 | GO:2000277 | positive regulation of oxidative phosphorylation uncoupler activity(GO:2000277) |
| 0.4 | 1.8 | GO:0046826 | negative regulation of protein export from nucleus(GO:0046826) |
| 0.4 | 1.1 | GO:0090261 | positive regulation of inclusion body assembly(GO:0090261) |
| 0.4 | 0.7 | GO:0033484 | nitric oxide homeostasis(GO:0033484) |
| 0.4 | 1.5 | GO:0019355 | nicotinamide nucleotide biosynthetic process from aspartate(GO:0019355) 'de novo' NAD biosynthetic process(GO:0034627) 'de novo' NAD biosynthetic process from aspartate(GO:0034628) |
| 0.4 | 6.5 | GO:0042104 | positive regulation of activated T cell proliferation(GO:0042104) |
| 0.4 | 2.2 | GO:0045218 | zonula adherens maintenance(GO:0045218) |
| 0.4 | 0.7 | GO:0018214 | peptidyl-glutamic acid carboxylation(GO:0017187) protein carboxylation(GO:0018214) |
| 0.4 | 1.1 | GO:0061073 | ciliary body morphogenesis(GO:0061073) |
| 0.4 | 1.8 | GO:0072683 | T cell extravasation(GO:0072683) |
| 0.4 | 9.4 | GO:0046677 | response to antibiotic(GO:0046677) |
| 0.4 | 0.7 | GO:0031660 | regulation of cyclin-dependent protein serine/threonine kinase activity involved in G2/M transition of mitotic cell cycle(GO:0031660) positive regulation of cyclin-dependent protein serine/threonine kinase activity involved in G2/M transition of mitotic cell cycle(GO:0031662) |
| 0.4 | 2.5 | GO:0000491 | small nucleolar ribonucleoprotein complex assembly(GO:0000491) |
| 0.4 | 7.5 | GO:0043966 | histone H3 acetylation(GO:0043966) |
| 0.4 | 1.8 | GO:0003419 | growth plate cartilage chondrocyte proliferation(GO:0003419) |
| 0.3 | 2.4 | GO:0006685 | sphingomyelin catabolic process(GO:0006685) |
| 0.3 | 3.1 | GO:2000381 | negative regulation of mesoderm development(GO:2000381) |
| 0.3 | 2.8 | GO:0036506 | maintenance of unfolded protein(GO:0036506) tail-anchored membrane protein insertion into ER membrane(GO:0071816) maintenance of unfolded protein involved in ERAD pathway(GO:1904378) |
| 0.3 | 5.2 | GO:0000188 | inactivation of MAPK activity(GO:0000188) |
| 0.3 | 1.4 | GO:2000195 | negative regulation of female gonad development(GO:2000195) |
| 0.3 | 2.0 | GO:1902035 | positive regulation of hematopoietic stem cell proliferation(GO:1902035) |
| 0.3 | 0.7 | GO:0036066 | protein O-linked fucosylation(GO:0036066) |
| 0.3 | 3.0 | GO:0006020 | inositol metabolic process(GO:0006020) |
| 0.3 | 5.9 | GO:0045780 | positive regulation of bone resorption(GO:0045780) positive regulation of bone remodeling(GO:0046852) |
| 0.3 | 2.3 | GO:0007144 | female meiosis I(GO:0007144) |
| 0.3 | 1.0 | GO:0044208 | 'de novo' AMP biosynthetic process(GO:0044208) |
| 0.3 | 0.7 | GO:1904479 | negative regulation of intestinal absorption(GO:1904479) |
| 0.3 | 0.6 | GO:0032493 | response to bacterial lipoprotein(GO:0032493) |
| 0.3 | 0.6 | GO:0006167 | AMP biosynthetic process(GO:0006167) |
| 0.3 | 3.5 | GO:0000185 | activation of MAPKKK activity(GO:0000185) |
| 0.3 | 1.3 | GO:0097211 | response to gonadotropin-releasing hormone(GO:0097210) cellular response to gonadotropin-releasing hormone(GO:0097211) |
| 0.3 | 1.0 | GO:2001160 | negative regulation of urine volume(GO:0035811) regulation of histone H3-K79 methylation(GO:2001160) |
| 0.3 | 6.3 | GO:0018126 | protein hydroxylation(GO:0018126) |
| 0.3 | 1.2 | GO:0048631 | regulation of skeletal muscle tissue growth(GO:0048631) |
| 0.3 | 5.0 | GO:1990748 | cellular detoxification(GO:1990748) |
| 0.3 | 0.9 | GO:0035562 | negative regulation of chromatin binding(GO:0035562) |
| 0.3 | 1.9 | GO:0000727 | double-strand break repair via break-induced replication(GO:0000727) |
| 0.3 | 2.2 | GO:0033313 | meiotic cell cycle checkpoint(GO:0033313) |
| 0.3 | 4.9 | GO:1901741 | positive regulation of myoblast fusion(GO:1901741) |
| 0.3 | 3.4 | GO:0034219 | carbohydrate transmembrane transport(GO:0034219) |
| 0.3 | 0.6 | GO:0031047 | gene silencing by RNA(GO:0031047) |
| 0.3 | 1.2 | GO:0036072 | intramembranous ossification(GO:0001957) direct ossification(GO:0036072) |
| 0.3 | 1.2 | GO:0018202 | peptidyl-diphthamide metabolic process(GO:0017182) peptidyl-diphthamide biosynthetic process from peptidyl-histidine(GO:0017183) peptidyl-histidine modification(GO:0018202) |
| 0.3 | 1.7 | GO:0030263 | apoptotic chromosome condensation(GO:0030263) |
| 0.3 | 0.9 | GO:0006121 | mitochondrial electron transport, succinate to ubiquinone(GO:0006121) |
| 0.3 | 0.9 | GO:0034184 | positive regulation of maintenance of sister chromatid cohesion(GO:0034093) positive regulation of maintenance of mitotic sister chromatid cohesion(GO:0034184) |
| 0.3 | 2.0 | GO:0070423 | nucleotide-binding oligomerization domain containing signaling pathway(GO:0070423) nucleotide-binding oligomerization domain containing 2 signaling pathway(GO:0070431) |
| 0.3 | 8.4 | GO:0048255 | mRNA stabilization(GO:0048255) |
| 0.3 | 3.2 | GO:0030497 | fatty acid elongation(GO:0030497) |
| 0.3 | 6.3 | GO:0000387 | spliceosomal snRNP assembly(GO:0000387) |
| 0.3 | 0.9 | GO:0098928 | presynaptic signal transduction(GO:0098928) presynapse to nucleus signaling pathway(GO:0099526) |
| 0.3 | 3.1 | GO:0090177 | establishment of planar polarity involved in neural tube closure(GO:0090177) |
| 0.3 | 0.9 | GO:0046133 | pyrimidine ribonucleoside catabolic process(GO:0046133) |
| 0.3 | 2.0 | GO:0060837 | blood vessel endothelial cell differentiation(GO:0060837) |
| 0.3 | 2.0 | GO:0048484 | enteric nervous system development(GO:0048484) |
| 0.3 | 0.8 | GO:0046166 | glyceraldehyde-3-phosphate biosynthetic process(GO:0046166) |
| 0.3 | 0.8 | GO:0032211 | negative regulation of telomere maintenance via telomerase(GO:0032211) |
| 0.3 | 1.4 | GO:0034196 | acylglycerol transport(GO:0034196) triglyceride transport(GO:0034197) |
| 0.3 | 0.8 | GO:0000715 | nucleotide-excision repair, DNA damage recognition(GO:0000715) |
| 0.3 | 0.8 | GO:0006348 | chromatin silencing at telomere(GO:0006348) |
| 0.3 | 0.8 | GO:0002922 | positive regulation of humoral immune response(GO:0002922) |
| 0.3 | 0.8 | GO:2000501 | natural killer cell chemotaxis(GO:0035747) regulation of natural killer cell chemotaxis(GO:2000501) |
| 0.3 | 0.8 | GO:0042732 | D-xylose metabolic process(GO:0042732) |
| 0.3 | 5.2 | GO:0016486 | peptide hormone processing(GO:0016486) |
| 0.3 | 6.5 | GO:0000462 | maturation of SSU-rRNA from tricistronic rRNA transcript (SSU-rRNA, 5.8S rRNA, LSU-rRNA)(GO:0000462) |
| 0.3 | 0.3 | GO:1902109 | negative regulation of mitochondrial membrane permeability involved in apoptotic process(GO:1902109) |
| 0.3 | 1.6 | GO:0043415 | positive regulation of skeletal muscle tissue regeneration(GO:0043415) |
| 0.3 | 4.0 | GO:1903963 | arachidonic acid secretion(GO:0050482) arachidonate transport(GO:1903963) |
| 0.3 | 1.9 | GO:0033683 | nucleotide-excision repair, DNA incision(GO:0033683) |
| 0.3 | 1.3 | GO:1903232 | melanosome assembly(GO:1903232) |
| 0.3 | 3.2 | GO:0051085 | chaperone mediated protein folding requiring cofactor(GO:0051085) |
| 0.3 | 1.9 | GO:0002566 | somatic diversification of immune receptors via somatic mutation(GO:0002566) |
| 0.3 | 1.0 | GO:2000774 | positive regulation of cellular senescence(GO:2000774) |
| 0.3 | 1.3 | GO:0014816 | skeletal muscle satellite cell differentiation(GO:0014816) |
| 0.3 | 1.6 | GO:0044241 | lipid digestion(GO:0044241) |
| 0.3 | 0.8 | GO:0060489 | orthogonal dichotomous subdivision of terminal units involved in lung branching morphogenesis(GO:0060488) planar dichotomous subdivision of terminal units involved in lung branching morphogenesis(GO:0060489) lateral sprouting involved in lung morphogenesis(GO:0060490) |
| 0.3 | 1.6 | GO:0001731 | formation of translation preinitiation complex(GO:0001731) |
| 0.3 | 8.0 | GO:0034723 | DNA replication-dependent nucleosome assembly(GO:0006335) DNA replication-dependent nucleosome organization(GO:0034723) |
| 0.3 | 1.8 | GO:0010587 | miRNA catabolic process(GO:0010587) |
| 0.3 | 0.8 | GO:0034310 | primary alcohol catabolic process(GO:0034310) |
| 0.3 | 1.8 | GO:0006621 | protein retention in ER lumen(GO:0006621) |
| 0.3 | 1.0 | GO:0060056 | mammary gland involution(GO:0060056) |
| 0.3 | 0.8 | GO:0051096 | regulation of helicase activity(GO:0051095) positive regulation of helicase activity(GO:0051096) |
| 0.3 | 2.0 | GO:0051770 | positive regulation of nitric-oxide synthase biosynthetic process(GO:0051770) |
| 0.3 | 2.0 | GO:0042538 | hyperosmotic salinity response(GO:0042538) |
| 0.3 | 1.0 | GO:2000623 | regulation of nuclear-transcribed mRNA catabolic process, nonsense-mediated decay(GO:2000622) negative regulation of nuclear-transcribed mRNA catabolic process, nonsense-mediated decay(GO:2000623) |
| 0.3 | 3.8 | GO:0051451 | myoblast migration(GO:0051451) |
| 0.3 | 1.5 | GO:0009880 | embryonic pattern specification(GO:0009880) |
| 0.2 | 2.7 | GO:0060539 | diaphragm development(GO:0060539) |
| 0.2 | 1.2 | GO:0019348 | dolichol metabolic process(GO:0019348) |
| 0.2 | 0.5 | GO:0001757 | somite specification(GO:0001757) |
| 0.2 | 1.5 | GO:0032049 | cardiolipin biosynthetic process(GO:0032049) |
| 0.2 | 1.5 | GO:0045198 | establishment of epithelial cell apical/basal polarity(GO:0045198) |
| 0.2 | 0.7 | GO:1990859 | cellular response to endothelin(GO:1990859) |
| 0.2 | 0.7 | GO:1903244 | positive regulation of cardiac muscle adaptation(GO:0010615) positive regulation of cardiac muscle hypertrophy in response to stress(GO:1903244) |
| 0.2 | 3.9 | GO:0000028 | ribosomal small subunit assembly(GO:0000028) |
| 0.2 | 1.5 | GO:0006265 | DNA topological change(GO:0006265) |
| 0.2 | 5.1 | GO:0033235 | positive regulation of protein sumoylation(GO:0033235) |
| 0.2 | 1.2 | GO:0080184 | response to stilbenoid(GO:0035634) response to phenylpropanoid(GO:0080184) |
| 0.2 | 2.7 | GO:0031639 | plasminogen activation(GO:0031639) |
| 0.2 | 5.1 | GO:0035067 | negative regulation of histone acetylation(GO:0035067) |
| 0.2 | 4.8 | GO:0016226 | iron-sulfur cluster assembly(GO:0016226) metallo-sulfur cluster assembly(GO:0031163) |
| 0.2 | 0.7 | GO:2000676 | positive regulation of type B pancreatic cell apoptotic process(GO:2000676) |
| 0.2 | 1.9 | GO:0031424 | keratinization(GO:0031424) |
| 0.2 | 1.7 | GO:0046015 | regulation of transcription by glucose(GO:0046015) |
| 0.2 | 1.4 | GO:0061158 | 3'-UTR-mediated mRNA destabilization(GO:0061158) |
| 0.2 | 1.7 | GO:0070236 | regulation of activation-induced cell death of T cells(GO:0070235) negative regulation of activation-induced cell death of T cells(GO:0070236) |
| 0.2 | 1.4 | GO:0002052 | positive regulation of neuroblast proliferation(GO:0002052) |
| 0.2 | 1.9 | GO:0048642 | negative regulation of skeletal muscle tissue development(GO:0048642) |
| 0.2 | 0.9 | GO:1902626 | assembly of large subunit precursor of preribosome(GO:1902626) |
| 0.2 | 0.5 | GO:0046671 | negative regulation of retinal cell programmed cell death(GO:0046671) |
| 0.2 | 0.9 | GO:0044828 | negative regulation by host of viral genome replication(GO:0044828) |
| 0.2 | 2.1 | GO:0033601 | positive regulation of mammary gland epithelial cell proliferation(GO:0033601) |
| 0.2 | 0.9 | GO:1990022 | RNA polymerase II complex import to nucleus(GO:0044376) RNA polymerase III complex localization to nucleus(GO:1990022) |
| 0.2 | 2.1 | GO:0070286 | axonemal dynein complex assembly(GO:0070286) |
| 0.2 | 2.3 | GO:0021796 | cerebral cortex regionalization(GO:0021796) |
| 0.2 | 0.5 | GO:0032070 | regulation of deoxyribonuclease activity(GO:0032070) |
| 0.2 | 1.6 | GO:0010032 | meiotic chromosome condensation(GO:0010032) |
| 0.2 | 1.1 | GO:0038018 | Wnt receptor catabolic process(GO:0038018) |
| 0.2 | 2.5 | GO:0042347 | negative regulation of NF-kappaB import into nucleus(GO:0042347) |
| 0.2 | 2.0 | GO:0060294 | cilium movement involved in cell motility(GO:0060294) |
| 0.2 | 1.6 | GO:0035735 | intraciliary transport involved in cilium morphogenesis(GO:0035735) |
| 0.2 | 1.1 | GO:1904426 | positive regulation of GTP binding(GO:1904426) |
| 0.2 | 2.9 | GO:0006120 | mitochondrial electron transport, NADH to ubiquinone(GO:0006120) |
| 0.2 | 0.9 | GO:2001245 | regulation of phosphatidylcholine biosynthetic process(GO:2001245) |
| 0.2 | 0.7 | GO:0060468 | prevention of polyspermy(GO:0060468) |
| 0.2 | 0.9 | GO:0021938 | smoothened signaling pathway involved in regulation of cerebellar granule cell precursor cell proliferation(GO:0021938) notochord regression(GO:0060032) |
| 0.2 | 0.9 | GO:0036265 | RNA (guanine-N7)-methylation(GO:0036265) |
| 0.2 | 0.6 | GO:0070317 | negative regulation of G0 to G1 transition(GO:0070317) |
| 0.2 | 1.7 | GO:1900262 | regulation of DNA-directed DNA polymerase activity(GO:1900262) positive regulation of DNA-directed DNA polymerase activity(GO:1900264) |
| 0.2 | 1.5 | GO:1902231 | positive regulation of intrinsic apoptotic signaling pathway in response to DNA damage(GO:1902231) |
| 0.2 | 0.6 | GO:1904395 | Wnt signaling pathway involved in dorsal/ventral axis specification(GO:0044332) positive regulation of skeletal muscle acetylcholine-gated channel clustering(GO:1904395) |
| 0.2 | 3.3 | GO:0044458 | motile cilium assembly(GO:0044458) |
| 0.2 | 0.4 | GO:0050892 | intestinal absorption(GO:0050892) |
| 0.2 | 1.2 | GO:2001267 | regulation of cysteine-type endopeptidase activity involved in apoptotic signaling pathway(GO:2001267) |
| 0.2 | 0.4 | GO:1903026 | negative regulation of RNA polymerase II regulatory region sequence-specific DNA binding(GO:1903026) |
| 0.2 | 1.2 | GO:0003338 | metanephros morphogenesis(GO:0003338) |
| 0.2 | 1.8 | GO:0006978 | DNA damage response, signal transduction by p53 class mediator resulting in transcription of p21 class mediator(GO:0006978) |
| 0.2 | 1.4 | GO:0090656 | t-circle formation(GO:0090656) |
| 0.2 | 1.8 | GO:0042989 | sequestering of actin monomers(GO:0042989) |
| 0.2 | 0.8 | GO:0002934 | desmosome organization(GO:0002934) |
| 0.2 | 0.6 | GO:1902608 | regulation of large conductance calcium-activated potassium channel activity(GO:1902606) positive regulation of large conductance calcium-activated potassium channel activity(GO:1902608) regulation of testosterone biosynthetic process(GO:2000224) |
| 0.2 | 0.8 | GO:0042590 | antigen processing and presentation of exogenous peptide antigen via MHC class I(GO:0042590) |
| 0.2 | 4.4 | GO:0060441 | epithelial tube branching involved in lung morphogenesis(GO:0060441) |
| 0.2 | 2.2 | GO:0045793 | positive regulation of cell size(GO:0045793) |
| 0.2 | 0.6 | GO:0043489 | RNA stabilization(GO:0043489) |
| 0.2 | 4.2 | GO:0001709 | cell fate determination(GO:0001709) |
| 0.2 | 1.2 | GO:0045792 | negative regulation of cell size(GO:0045792) |
| 0.2 | 0.6 | GO:0090151 | establishment of protein localization to mitochondrial membrane(GO:0090151) |
| 0.2 | 0.8 | GO:0072205 | metanephric collecting duct development(GO:0072205) |
| 0.2 | 0.6 | GO:0060010 | Sertoli cell fate commitment(GO:0060010) |
| 0.2 | 1.4 | GO:0035948 | positive regulation of gluconeogenesis by positive regulation of transcription from RNA polymerase II promoter(GO:0035948) regulation of cellular ketone metabolic process by positive regulation of transcription from RNA polymerase II promoter(GO:0072366) |
| 0.2 | 6.0 | GO:0045880 | positive regulation of smoothened signaling pathway(GO:0045880) |
| 0.2 | 0.6 | GO:0071947 | protein deubiquitination involved in ubiquitin-dependent protein catabolic process(GO:0071947) |
| 0.2 | 1.3 | GO:0019673 | GDP-mannose metabolic process(GO:0019673) |
| 0.2 | 1.1 | GO:0000212 | meiotic spindle organization(GO:0000212) |
| 0.2 | 0.2 | GO:0033159 | negative regulation of protein import into nucleus, translocation(GO:0033159) |
| 0.2 | 1.5 | GO:0006465 | signal peptide processing(GO:0006465) |
| 0.2 | 0.6 | GO:0030043 | actin filament fragmentation(GO:0030043) |
| 0.2 | 0.9 | GO:0051461 | corticotropin secretion(GO:0051458) regulation of corticotropin secretion(GO:0051459) positive regulation of corticotropin secretion(GO:0051461) |
| 0.2 | 0.6 | GO:0098974 | postsynaptic actin cytoskeleton organization(GO:0098974) |
| 0.2 | 2.5 | GO:0071392 | cellular response to estradiol stimulus(GO:0071392) |
| 0.2 | 2.6 | GO:0042407 | cristae formation(GO:0042407) |
| 0.2 | 2.8 | GO:0003334 | keratinocyte development(GO:0003334) |
| 0.2 | 3.7 | GO:0051123 | RNA polymerase II transcriptional preinitiation complex assembly(GO:0051123) |
| 0.2 | 4.4 | GO:0045071 | negative regulation of viral genome replication(GO:0045071) |
| 0.2 | 1.8 | GO:1902018 | negative regulation of cilium assembly(GO:1902018) |
| 0.2 | 0.7 | GO:0019509 | L-methionine biosynthetic process from methylthioadenosine(GO:0019509) |
| 0.2 | 0.9 | GO:0034123 | positive regulation of toll-like receptor signaling pathway(GO:0034123) |
| 0.2 | 1.5 | GO:0002082 | regulation of oxidative phosphorylation(GO:0002082) |
| 0.2 | 1.4 | GO:0034724 | DNA replication-independent nucleosome organization(GO:0034724) |
| 0.2 | 1.1 | GO:0034587 | piRNA metabolic process(GO:0034587) |
| 0.2 | 0.5 | GO:0030327 | prenylated protein catabolic process(GO:0030327) |
| 0.2 | 0.4 | GO:1902256 | apoptotic process involved in outflow tract morphogenesis(GO:0003275) mesangial cell differentiation(GO:0072007) glomerular mesangial cell differentiation(GO:0072008) mesangial cell development(GO:0072143) glomerular mesangial cell development(GO:0072144) regulation of apoptotic process involved in outflow tract morphogenesis(GO:1902256) |
| 0.2 | 0.4 | GO:0060696 | regulation of phospholipid catabolic process(GO:0060696) |
| 0.2 | 0.2 | GO:1900377 | negative regulation of melanin biosynthetic process(GO:0048022) negative regulation of secondary metabolite biosynthetic process(GO:1900377) |
| 0.2 | 5.1 | GO:0070979 | protein K11-linked ubiquitination(GO:0070979) |
| 0.2 | 0.5 | GO:0010499 | proteasomal ubiquitin-independent protein catabolic process(GO:0010499) |
| 0.2 | 3.1 | GO:0008535 | respiratory chain complex IV assembly(GO:0008535) |
| 0.2 | 0.5 | GO:0032020 | ISG15-protein conjugation(GO:0032020) |
| 0.2 | 0.3 | GO:1901301 | regulation of cargo loading into COPII-coated vesicle(GO:1901301) |
| 0.2 | 1.6 | GO:0001682 | tRNA 5'-leader removal(GO:0001682) |
| 0.2 | 1.2 | GO:0036499 | PERK-mediated unfolded protein response(GO:0036499) |
| 0.2 | 6.6 | GO:0030901 | midbrain development(GO:0030901) |
| 0.2 | 0.8 | GO:0033140 | negative regulation of peptidyl-serine phosphorylation of STAT protein(GO:0033140) |
| 0.2 | 0.7 | GO:0033563 | dorsal/ventral axon guidance(GO:0033563) |
| 0.2 | 1.3 | GO:0070574 | cadmium ion transport(GO:0015691) cadmium ion transmembrane transport(GO:0070574) |
| 0.2 | 2.7 | GO:0000338 | protein deneddylation(GO:0000338) |
| 0.2 | 0.7 | GO:0000379 | tRNA-type intron splice site recognition and cleavage(GO:0000379) |
| 0.2 | 1.1 | GO:0007076 | mitotic chromosome condensation(GO:0007076) |
| 0.2 | 3.4 | GO:0001913 | T cell mediated cytotoxicity(GO:0001913) |
| 0.2 | 0.8 | GO:0060789 | hair follicle placode formation(GO:0060789) |
| 0.2 | 0.5 | GO:0070345 | negative regulation of fat cell proliferation(GO:0070345) |
| 0.2 | 1.1 | GO:2001171 | positive regulation of ATP biosynthetic process(GO:2001171) |
| 0.2 | 2.7 | GO:0045948 | positive regulation of translational initiation(GO:0045948) |
| 0.2 | 0.9 | GO:0009249 | protein lipoylation(GO:0009249) |
| 0.2 | 5.8 | GO:0051693 | actin filament capping(GO:0051693) |
| 0.2 | 1.4 | GO:0070986 | left/right axis specification(GO:0070986) |
| 0.2 | 0.9 | GO:0070475 | rRNA base methylation(GO:0070475) |
| 0.2 | 9.9 | GO:0006413 | translational initiation(GO:0006413) |
| 0.2 | 0.8 | GO:0044854 | plasma membrane raft assembly(GO:0044854) plasma membrane raft organization(GO:0044857) caveola assembly(GO:0070836) |
| 0.2 | 5.6 | GO:0031016 | pancreas development(GO:0031016) |
| 0.1 | 1.5 | GO:0051127 | positive regulation of actin nucleation(GO:0051127) |
| 0.1 | 8.2 | GO:0009142 | nucleoside triphosphate biosynthetic process(GO:0009142) |
| 0.1 | 1.0 | GO:1990253 | cellular response to leucine starvation(GO:1990253) |
| 0.1 | 0.4 | GO:0071688 | striated muscle myosin thick filament assembly(GO:0071688) |
| 0.1 | 1.6 | GO:0043248 | proteasome assembly(GO:0043248) |
| 0.1 | 4.1 | GO:0043392 | negative regulation of DNA binding(GO:0043392) |
| 0.1 | 0.3 | GO:0002339 | B cell selection(GO:0002339) |
| 0.1 | 1.3 | GO:0001773 | myeloid dendritic cell activation(GO:0001773) myeloid dendritic cell differentiation(GO:0043011) |
| 0.1 | 15.2 | GO:0051028 | mRNA transport(GO:0051028) |
| 0.1 | 0.9 | GO:0070886 | positive regulation of calcineurin-NFAT signaling cascade(GO:0070886) |
| 0.1 | 1.6 | GO:0071425 | hematopoietic stem cell proliferation(GO:0071425) |
| 0.1 | 4.7 | GO:0032728 | positive regulation of interferon-beta production(GO:0032728) |
| 0.1 | 5.4 | GO:0002181 | cytoplasmic translation(GO:0002181) |
| 0.1 | 1.2 | GO:0043486 | histone exchange(GO:0043486) |
| 0.1 | 1.3 | GO:0002043 | blood vessel endothelial cell proliferation involved in sprouting angiogenesis(GO:0002043) |
| 0.1 | 0.6 | GO:0006014 | D-ribose metabolic process(GO:0006014) |
| 0.1 | 15.3 | GO:0006626 | protein targeting to mitochondrion(GO:0006626) |
| 0.1 | 0.3 | GO:0007181 | transforming growth factor beta receptor complex assembly(GO:0007181) |
| 0.1 | 0.9 | GO:0016255 | attachment of GPI anchor to protein(GO:0016255) |
| 0.1 | 2.4 | GO:0035058 | nonmotile primary cilium assembly(GO:0035058) regulation of nonmotile primary cilium assembly(GO:1902855) positive regulation of nonmotile primary cilium assembly(GO:1902857) |
| 0.1 | 0.4 | GO:0048318 | axial mesoderm development(GO:0048318) |
| 0.1 | 2.7 | GO:0051482 | positive regulation of cytosolic calcium ion concentration involved in phospholipase C-activating G-protein coupled signaling pathway(GO:0051482) |
| 0.1 | 0.7 | GO:0060347 | heart trabecula formation(GO:0060347) |
| 0.1 | 0.4 | GO:0043686 | co-translational protein modification(GO:0043686) |
| 0.1 | 1.0 | GO:0090043 | regulation of tubulin deacetylation(GO:0090043) |
| 0.1 | 5.0 | GO:0006506 | GPI anchor biosynthetic process(GO:0006506) |
| 0.1 | 0.1 | GO:0010040 | response to iron(II) ion(GO:0010040) |
| 0.1 | 0.9 | GO:0032780 | negative regulation of ATPase activity(GO:0032780) |
| 0.1 | 0.9 | GO:0031547 | brain-derived neurotrophic factor receptor signaling pathway(GO:0031547) |
| 0.1 | 0.5 | GO:0032382 | positive regulation of intracellular lipid transport(GO:0032379) positive regulation of intracellular sterol transport(GO:0032382) positive regulation of intracellular cholesterol transport(GO:0032385) regulation of cholesterol import(GO:0060620) lipid hydroperoxide transport(GO:1901373) positive regulation of cholesterol import(GO:1904109) regulation of sterol import(GO:2000909) positive regulation of sterol import(GO:2000911) |
| 0.1 | 2.4 | GO:0071353 | cellular response to interleukin-4(GO:0071353) |
| 0.1 | 0.8 | GO:0019883 | antigen processing and presentation of endogenous peptide antigen(GO:0002483) antigen processing and presentation of endogenous antigen(GO:0019883) antigen processing and presentation of endogenous peptide antigen via MHC class I(GO:0019885) |
| 0.1 | 1.1 | GO:0038203 | TORC2 signaling(GO:0038203) |
| 0.1 | 0.8 | GO:0021891 | olfactory bulb interneuron development(GO:0021891) |
| 0.1 | 2.8 | GO:0032922 | circadian regulation of gene expression(GO:0032922) |
| 0.1 | 1.7 | GO:0031643 | positive regulation of myelination(GO:0031643) |
| 0.1 | 2.6 | GO:0006471 | protein ADP-ribosylation(GO:0006471) |
| 0.1 | 0.3 | GO:0031998 | regulation of fatty acid beta-oxidation(GO:0031998) |
| 0.1 | 1.3 | GO:0035020 | regulation of Rac protein signal transduction(GO:0035020) |
| 0.1 | 0.4 | GO:0001828 | inner cell mass cell differentiation(GO:0001826) inner cell mass cell fate commitment(GO:0001827) inner cell mass cellular morphogenesis(GO:0001828) |
| 0.1 | 0.5 | GO:0046719 | regulation by virus of viral protein levels in host cell(GO:0046719) positive regulation by virus of viral protein levels in host cell(GO:0046726) |
| 0.1 | 0.5 | GO:0000290 | deadenylation-dependent decapping of nuclear-transcribed mRNA(GO:0000290) |
| 0.1 | 2.4 | GO:2000191 | regulation of fatty acid transport(GO:2000191) |
| 0.1 | 5.4 | GO:0071230 | cellular response to amino acid stimulus(GO:0071230) |
| 0.1 | 0.5 | GO:0015888 | thiamine transport(GO:0015888) |
| 0.1 | 0.7 | GO:0042769 | DNA damage response, detection of DNA damage(GO:0042769) |
| 0.1 | 1.6 | GO:0045056 | transcytosis(GO:0045056) |
| 0.1 | 0.6 | GO:0071157 | negative regulation of cell cycle arrest(GO:0071157) |
| 0.1 | 0.2 | GO:0000965 | mitochondrial RNA 3'-end processing(GO:0000965) |
| 0.1 | 2.1 | GO:0009303 | rRNA transcription(GO:0009303) |
| 0.1 | 0.5 | GO:0006384 | transcription initiation from RNA polymerase III promoter(GO:0006384) |
| 0.1 | 0.1 | GO:2001184 | regulation of interleukin-12 secretion(GO:2001182) positive regulation of interleukin-12 secretion(GO:2001184) |
| 0.1 | 0.6 | GO:1901222 | NIK/NF-kappaB signaling(GO:0038061) regulation of NIK/NF-kappaB signaling(GO:1901222) |
| 0.1 | 0.7 | GO:0006398 | mRNA 3'-end processing by stem-loop binding and cleavage(GO:0006398) |
| 0.1 | 2.6 | GO:0034504 | protein localization to nucleus(GO:0034504) |
| 0.1 | 0.8 | GO:1904217 | regulation of CDP-diacylglycerol-serine O-phosphatidyltransferase activity(GO:1904217) positive regulation of CDP-diacylglycerol-serine O-phosphatidyltransferase activity(GO:1904219) regulation of serine C-palmitoyltransferase activity(GO:1904220) positive regulation of serine C-palmitoyltransferase activity(GO:1904222) |
| 0.1 | 0.8 | GO:1905146 | lysosomal protein catabolic process(GO:1905146) |
| 0.1 | 0.4 | GO:0045575 | basophil activation involved in immune response(GO:0002276) basophil activation(GO:0045575) |
| 0.1 | 0.9 | GO:0031274 | positive regulation of pseudopodium assembly(GO:0031274) |
| 0.1 | 0.7 | GO:1900025 | negative regulation of substrate adhesion-dependent cell spreading(GO:1900025) |
| 0.1 | 0.6 | GO:0021521 | ventral spinal cord interneuron specification(GO:0021521) cell fate specification involved in pattern specification(GO:0060573) |
| 0.1 | 0.3 | GO:0006532 | aspartate biosynthetic process(GO:0006532) |
| 0.1 | 0.4 | GO:1904715 | negative regulation of chaperone-mediated autophagy(GO:1904715) |
| 0.1 | 0.3 | GO:0070601 | centromeric sister chromatid cohesion(GO:0070601) |
| 0.1 | 7.4 | GO:0009451 | RNA modification(GO:0009451) |
| 0.1 | 0.4 | GO:0006706 | steroid catabolic process(GO:0006706) |
| 0.1 | 0.4 | GO:0071712 | ER-associated misfolded protein catabolic process(GO:0071712) |
| 0.1 | 1.3 | GO:0031468 | nuclear envelope reassembly(GO:0031468) |
| 0.1 | 1.4 | GO:0000183 | chromatin silencing at rDNA(GO:0000183) |
| 0.1 | 0.4 | GO:0008298 | intracellular mRNA localization(GO:0008298) |
| 0.1 | 0.8 | GO:0031086 | nuclear-transcribed mRNA catabolic process, deadenylation-independent decay(GO:0031086) deadenylation-independent decapping of nuclear-transcribed mRNA(GO:0031087) |
| 0.1 | 1.2 | GO:0006490 | oligosaccharide-lipid intermediate biosynthetic process(GO:0006490) |
| 0.1 | 1.2 | GO:0010501 | RNA secondary structure unwinding(GO:0010501) |
| 0.1 | 0.4 | GO:0072189 | ureter development(GO:0072189) |
| 0.1 | 0.4 | GO:0010700 | negative regulation of norepinephrine secretion(GO:0010700) |
| 0.1 | 1.1 | GO:0007202 | activation of phospholipase C activity(GO:0007202) |
| 0.1 | 0.8 | GO:0071801 | regulation of podosome assembly(GO:0071801) |
| 0.1 | 0.2 | GO:0042414 | epinephrine metabolic process(GO:0042414) |
| 0.1 | 0.9 | GO:0019800 | peptide cross-linking via chondroitin 4-sulfate glycosaminoglycan(GO:0019800) |
| 0.1 | 1.8 | GO:0000289 | nuclear-transcribed mRNA poly(A) tail shortening(GO:0000289) |
| 0.1 | 1.0 | GO:0008637 | apoptotic mitochondrial changes(GO:0008637) |
| 0.1 | 3.4 | GO:0006270 | DNA replication initiation(GO:0006270) |
| 0.1 | 0.7 | GO:0045292 | mRNA cis splicing, via spliceosome(GO:0045292) |
| 0.1 | 0.9 | GO:0006527 | arginine catabolic process(GO:0006527) |
| 0.1 | 0.7 | GO:0045019 | negative regulation of nitric oxide biosynthetic process(GO:0045019) negative regulation of nitric oxide metabolic process(GO:1904406) |
| 0.1 | 0.4 | GO:0010634 | positive regulation of epithelial cell migration(GO:0010634) |
| 0.1 | 0.6 | GO:0009235 | cobalamin metabolic process(GO:0009235) |
| 0.1 | 1.0 | GO:0055012 | ventricular cardiac muscle cell differentiation(GO:0055012) |
| 0.1 | 3.8 | GO:0061077 | chaperone-mediated protein folding(GO:0061077) |
| 0.1 | 1.5 | GO:0046827 | positive regulation of protein export from nucleus(GO:0046827) |
| 0.1 | 0.5 | GO:0043137 | DNA replication, removal of RNA primer(GO:0043137) |
| 0.1 | 0.3 | GO:0006556 | S-adenosylmethionine biosynthetic process(GO:0006556) |
| 0.1 | 0.4 | GO:0006415 | translational termination(GO:0006415) |
| 0.1 | 0.8 | GO:0006107 | oxaloacetate metabolic process(GO:0006107) |
| 0.1 | 0.7 | GO:0060124 | positive regulation of growth hormone secretion(GO:0060124) |
| 0.1 | 0.8 | GO:0014003 | oligodendrocyte development(GO:0014003) |
| 0.1 | 0.7 | GO:0032463 | negative regulation of protein homooligomerization(GO:0032463) |
| 0.1 | 0.6 | GO:0006957 | complement activation, alternative pathway(GO:0006957) |
| 0.1 | 0.4 | GO:0051205 | protein insertion into membrane(GO:0051205) |
| 0.1 | 1.2 | GO:0043252 | sodium-independent organic anion transport(GO:0043252) |
| 0.1 | 0.7 | GO:0006213 | pyrimidine nucleoside metabolic process(GO:0006213) |
| 0.1 | 0.2 | GO:0035964 | COPI-coated vesicle budding(GO:0035964) |
| 0.1 | 0.5 | GO:0052428 | modulation of molecular function in other organism(GO:0044359) negative regulation of molecular function in other organism(GO:0044362) negative regulation of molecular function in other organism involved in symbiotic interaction(GO:0052204) modulation of molecular function in other organism involved in symbiotic interaction(GO:0052205) negative regulation by host of symbiont molecular function(GO:0052405) modification by host of symbiont molecular function(GO:0052428) |
| 0.1 | 0.6 | GO:0006995 | cellular response to nitrogen starvation(GO:0006995) cellular response to nitrogen levels(GO:0043562) |
| 0.1 | 0.6 | GO:0006729 | tetrahydrobiopterin biosynthetic process(GO:0006729) tetrahydrobiopterin metabolic process(GO:0046146) |
| 0.1 | 1.7 | GO:0070207 | protein homotrimerization(GO:0070207) |
| 0.1 | 0.4 | GO:0010992 | ubiquitin homeostasis(GO:0010992) |
| 0.1 | 0.4 | GO:1902902 | negative regulation of autophagosome assembly(GO:1902902) |
| 0.1 | 1.9 | GO:0032755 | positive regulation of interleukin-6 production(GO:0032755) |
| 0.1 | 1.0 | GO:0018230 | peptidyl-L-cysteine S-palmitoylation(GO:0018230) peptidyl-S-diacylglycerol-L-cysteine biosynthetic process from peptidyl-cysteine(GO:0018231) |
| 0.1 | 0.3 | GO:1905247 | positive regulation of aspartic-type endopeptidase activity involved in amyloid precursor protein catabolic process(GO:1902961) positive regulation of aspartic-type peptidase activity(GO:1905247) |
| 0.1 | 0.2 | GO:1901491 | negative regulation of lymphangiogenesis(GO:1901491) |
| 0.1 | 0.3 | GO:0071340 | skeletal muscle acetylcholine-gated channel clustering(GO:0071340) |
| 0.1 | 0.3 | GO:0046415 | urate metabolic process(GO:0046415) |
| 0.1 | 0.9 | GO:0001937 | negative regulation of endothelial cell proliferation(GO:0001937) |
| 0.1 | 7.0 | GO:0006457 | protein folding(GO:0006457) |
| 0.1 | 1.7 | GO:0035518 | histone H2A monoubiquitination(GO:0035518) |
| 0.1 | 0.9 | GO:0006851 | mitochondrial calcium ion transport(GO:0006851) |
| 0.1 | 1.0 | GO:0090200 | positive regulation of release of cytochrome c from mitochondria(GO:0090200) |
| 0.1 | 1.3 | GO:0048741 | skeletal muscle fiber development(GO:0048741) |
| 0.1 | 1.1 | GO:0000079 | regulation of cyclin-dependent protein serine/threonine kinase activity(GO:0000079) |
| 0.1 | 0.8 | GO:0045672 | positive regulation of osteoclast differentiation(GO:0045672) |
| 0.1 | 1.6 | GO:2000651 | positive regulation of sodium ion transmembrane transporter activity(GO:2000651) |
| 0.1 | 0.5 | GO:0098535 | de novo centriole assembly(GO:0098535) |
| 0.1 | 0.4 | GO:0014886 | transition between slow and fast fiber(GO:0014886) |
| 0.1 | 0.8 | GO:0035561 | regulation of chromatin binding(GO:0035561) |
| 0.1 | 0.5 | GO:0070127 | tRNA aminoacylation for mitochondrial protein translation(GO:0070127) |
| 0.1 | 1.0 | GO:0015909 | long-chain fatty acid transport(GO:0015909) |
| 0.1 | 0.5 | GO:0032753 | positive regulation of interleukin-4 production(GO:0032753) |
| 0.1 | 0.4 | GO:0034551 | respiratory chain complex III assembly(GO:0017062) mitochondrial respiratory chain complex III assembly(GO:0034551) mitochondrial respiratory chain complex III biogenesis(GO:0097033) |
| 0.1 | 0.4 | GO:0060192 | negative regulation of lipase activity(GO:0060192) |
| 0.1 | 0.2 | GO:0015908 | fatty acid transport(GO:0015908) |
| 0.1 | 0.2 | GO:0008612 | peptidyl-lysine modification to peptidyl-hypusine(GO:0008612) |
| 0.1 | 2.7 | GO:1901343 | negative regulation of vasculature development(GO:1901343) |
| 0.1 | 2.0 | GO:0097031 | NADH dehydrogenase complex assembly(GO:0010257) mitochondrial respiratory chain complex I assembly(GO:0032981) mitochondrial respiratory chain complex I biogenesis(GO:0097031) |
| 0.1 | 1.2 | GO:0035411 | catenin import into nucleus(GO:0035411) |
| 0.1 | 3.9 | GO:2000045 | regulation of G1/S transition of mitotic cell cycle(GO:2000045) |
| 0.1 | 0.5 | GO:1901409 | positive regulation of phosphorylation of RNA polymerase II C-terminal domain(GO:1901409) |
| 0.1 | 0.4 | GO:0042532 | negative regulation of tyrosine phosphorylation of STAT protein(GO:0042532) |
| 0.1 | 0.4 | GO:0061013 | regulation of mRNA catabolic process(GO:0061013) positive regulation of mRNA catabolic process(GO:0061014) |
| 0.1 | 2.9 | GO:0048144 | fibroblast proliferation(GO:0048144) |
| 0.1 | 0.6 | GO:0060159 | regulation of dopamine receptor signaling pathway(GO:0060159) |
| 0.1 | 1.3 | GO:0031648 | protein destabilization(GO:0031648) |
| 0.1 | 4.6 | GO:0002062 | chondrocyte differentiation(GO:0002062) |
| 0.1 | 0.8 | GO:0042102 | positive regulation of T cell proliferation(GO:0042102) |
| 0.1 | 3.3 | GO:0051865 | protein autoubiquitination(GO:0051865) |
| 0.1 | 0.9 | GO:0007224 | smoothened signaling pathway(GO:0007224) |
| 0.1 | 0.5 | GO:0008611 | ether lipid biosynthetic process(GO:0008611) glycerol ether biosynthetic process(GO:0046504) ether biosynthetic process(GO:1901503) |
| 0.1 | 0.1 | GO:0034475 | U4 snRNA 3'-end processing(GO:0034475) |
| 0.1 | 2.6 | GO:0001942 | hair follicle development(GO:0001942) skin epidermis development(GO:0098773) |
| 0.1 | 0.3 | GO:2000210 | positive regulation of anoikis(GO:2000210) |
| 0.1 | 0.4 | GO:0017144 | drug metabolic process(GO:0017144) |
| 0.1 | 0.1 | GO:0051182 | coenzyme transport(GO:0051182) |
| 0.1 | 0.9 | GO:0042149 | cellular response to glucose starvation(GO:0042149) |
| 0.1 | 0.9 | GO:1903077 | negative regulation of protein localization to plasma membrane(GO:1903077) negative regulation of protein localization to cell periphery(GO:1904376) |
| 0.1 | 0.5 | GO:0050765 | negative regulation of phagocytosis(GO:0050765) |
| 0.1 | 0.5 | GO:0006123 | mitochondrial electron transport, cytochrome c to oxygen(GO:0006123) |
| 0.1 | 0.2 | GO:0045541 | negative regulation of cholesterol biosynthetic process(GO:0045541) negative regulation of cholesterol metabolic process(GO:0090206) |
| 0.1 | 0.8 | GO:0045453 | bone resorption(GO:0045453) |
| 0.1 | 0.9 | GO:0007035 | vacuolar acidification(GO:0007035) |
| 0.1 | 1.2 | GO:1901998 | toxin transport(GO:1901998) |
| 0.1 | 0.3 | GO:1904668 | positive regulation of ubiquitin protein ligase activity(GO:1904668) |
| 0.1 | 0.3 | GO:0045923 | positive regulation of fatty acid metabolic process(GO:0045923) |
| 0.1 | 0.3 | GO:0051491 | positive regulation of filopodium assembly(GO:0051491) |
| 0.1 | 0.6 | GO:0001954 | positive regulation of cell-matrix adhesion(GO:0001954) |
| 0.1 | 1.4 | GO:0046856 | phosphatidylinositol dephosphorylation(GO:0046856) |
| 0.1 | 0.4 | GO:0019388 | galactose catabolic process(GO:0019388) |
| 0.1 | 0.9 | GO:0098534 | centriole replication(GO:0007099) centriole assembly(GO:0098534) |
| 0.1 | 0.4 | GO:0032510 | endosome to lysosome transport via multivesicular body sorting pathway(GO:0032510) |
| 0.1 | 0.2 | GO:0045351 | type I interferon biosynthetic process(GO:0045351) |
| 0.1 | 0.9 | GO:0043968 | histone H2A acetylation(GO:0043968) |
| 0.1 | 0.1 | GO:0060510 | Type II pneumocyte differentiation(GO:0060510) |
| 0.1 | 0.4 | GO:0070193 | synaptonemal complex organization(GO:0070193) |
| 0.1 | 0.2 | GO:1902224 | cellular ketone body metabolic process(GO:0046950) ketone body metabolic process(GO:1902224) |
| 0.1 | 0.6 | GO:0040019 | positive regulation of embryonic development(GO:0040019) |
| 0.1 | 0.3 | GO:0036112 | medium-chain fatty-acyl-CoA metabolic process(GO:0036112) |
| 0.1 | 2.3 | GO:0007043 | cell-cell junction assembly(GO:0007043) |
| 0.1 | 0.4 | GO:0006582 | melanin metabolic process(GO:0006582) |
| 0.1 | 1.4 | GO:0006493 | protein O-linked glycosylation(GO:0006493) |
| 0.0 | 0.6 | GO:0050850 | positive regulation of calcium-mediated signaling(GO:0050850) |
| 0.0 | 2.6 | GO:0042273 | ribosomal large subunit biogenesis(GO:0042273) |
| 0.0 | 0.9 | GO:0002011 | morphogenesis of an epithelial sheet(GO:0002011) |
| 0.0 | 1.3 | GO:0042771 | intrinsic apoptotic signaling pathway in response to DNA damage by p53 class mediator(GO:0042771) |
| 0.0 | 1.4 | GO:2000779 | regulation of double-strand break repair(GO:2000779) |
| 0.0 | 2.6 | GO:0008584 | male gonad development(GO:0008584) development of primary male sexual characteristics(GO:0046546) |
| 0.0 | 0.5 | GO:0031573 | intra-S DNA damage checkpoint(GO:0031573) |
| 0.0 | 0.1 | GO:0048680 | positive regulation of axon regeneration(GO:0048680) positive regulation of neuron projection regeneration(GO:0070572) |
| 0.0 | 1.6 | GO:0006739 | NADP metabolic process(GO:0006739) |
| 0.0 | 0.5 | GO:0045747 | positive regulation of Notch signaling pathway(GO:0045747) |
| 0.0 | 1.2 | GO:0005978 | glycogen biosynthetic process(GO:0005978) glucan biosynthetic process(GO:0009250) |
| 0.0 | 0.1 | GO:0030948 | negative regulation of vascular endothelial growth factor receptor signaling pathway(GO:0030948) |
| 0.0 | 0.9 | GO:0090305 | nucleic acid phosphodiester bond hydrolysis(GO:0090305) |
| 0.0 | 0.6 | GO:0014002 | astrocyte development(GO:0014002) |
| 0.0 | 0.1 | GO:0046900 | tetrahydrofolylpolyglutamate metabolic process(GO:0046900) |
| 0.0 | 0.4 | GO:0043457 | regulation of cellular respiration(GO:0043457) |
| 0.0 | 0.2 | GO:0000076 | DNA replication checkpoint(GO:0000076) |
| 0.0 | 0.3 | GO:0045647 | negative regulation of erythrocyte differentiation(GO:0045647) |
| 0.0 | 0.9 | GO:0001936 | regulation of endothelial cell proliferation(GO:0001936) |
| 0.0 | 0.2 | GO:0050926 | regulation of positive chemotaxis(GO:0050926) positive regulation of positive chemotaxis(GO:0050927) |
| 0.0 | 0.3 | GO:0001921 | positive regulation of receptor recycling(GO:0001921) |
| 0.0 | 0.9 | GO:0035458 | cellular response to interferon-beta(GO:0035458) |
| 0.0 | 0.4 | GO:0061179 | negative regulation of insulin secretion involved in cellular response to glucose stimulus(GO:0061179) |
| 0.0 | 0.1 | GO:0090063 | positive regulation of microtubule nucleation(GO:0090063) |
| 0.0 | 0.8 | GO:0035307 | positive regulation of protein dephosphorylation(GO:0035307) |
| 0.0 | 0.4 | GO:0035335 | peptidyl-tyrosine dephosphorylation(GO:0035335) |
| 0.0 | 0.3 | GO:0042136 | neurotransmitter biosynthetic process(GO:0042136) |
| 0.0 | 1.5 | GO:0006364 | rRNA processing(GO:0006364) |
| 0.0 | 0.3 | GO:0032288 | myelin assembly(GO:0032288) |
| 0.0 | 0.5 | GO:0051567 | histone H3-K9 methylation(GO:0051567) |
| 0.0 | 0.9 | GO:0097194 | execution phase of apoptosis(GO:0097194) |
| 0.0 | 0.1 | GO:0010808 | positive regulation of synaptic vesicle priming(GO:0010808) |
| 0.0 | 0.4 | GO:0070534 | protein K63-linked ubiquitination(GO:0070534) |
| 0.0 | 0.2 | GO:0043923 | positive regulation by host of viral transcription(GO:0043923) |
| 0.0 | 0.4 | GO:0035855 | megakaryocyte development(GO:0035855) |
| 0.0 | 1.2 | GO:0043123 | positive regulation of I-kappaB kinase/NF-kappaB signaling(GO:0043123) |
| 0.0 | 0.6 | GO:0030279 | negative regulation of ossification(GO:0030279) |
| 0.0 | 0.1 | GO:0045579 | positive regulation of B cell differentiation(GO:0045579) |
| 0.0 | 0.6 | GO:0043488 | regulation of mRNA stability(GO:0043488) |
| 0.0 | 0.3 | GO:0014046 | dopamine secretion(GO:0014046) regulation of dopamine secretion(GO:0014059) |
| 0.0 | 0.1 | GO:0034035 | sulfate assimilation(GO:0000103) purine ribonucleoside bisphosphate metabolic process(GO:0034035) 3'-phosphoadenosine 5'-phosphosulfate metabolic process(GO:0050427) |
| 0.0 | 1.2 | GO:0007098 | centrosome cycle(GO:0007098) |
| 0.0 | 0.6 | GO:0032781 | positive regulation of ATPase activity(GO:0032781) |
| 0.0 | 0.2 | GO:0070940 | dephosphorylation of RNA polymerase II C-terminal domain(GO:0070940) |
| 0.0 | 0.5 | GO:0042475 | odontogenesis of dentin-containing tooth(GO:0042475) |
| 0.0 | 0.1 | GO:0007258 | JUN phosphorylation(GO:0007258) |
| 0.0 | 0.1 | GO:0090169 | regulation of spindle assembly(GO:0090169) |
| 0.0 | 0.5 | GO:2000177 | regulation of neural precursor cell proliferation(GO:2000177) |
| 0.0 | 0.2 | GO:2001238 | positive regulation of extrinsic apoptotic signaling pathway(GO:2001238) |
| 0.0 | 0.1 | GO:0006646 | phosphatidylethanolamine biosynthetic process(GO:0006646) |
| 0.0 | 0.5 | GO:0070527 | platelet aggregation(GO:0070527) |
| 0.0 | 0.1 | GO:0098838 | reduced folate transmembrane transport(GO:0098838) |
| 0.0 | 0.1 | GO:0030199 | collagen fibril organization(GO:0030199) |
| 0.0 | 0.1 | GO:0033146 | regulation of intracellular estrogen receptor signaling pathway(GO:0033146) |
| 0.0 | 0.3 | GO:0030514 | negative regulation of BMP signaling pathway(GO:0030514) |
| 0.0 | 0.1 | GO:0033353 | S-adenosylmethionine cycle(GO:0033353) |
| 0.0 | 0.1 | GO:0090148 | membrane fission(GO:0090148) |
| 0.0 | 0.6 | GO:0006352 | DNA-templated transcription, initiation(GO:0006352) |
| 0.0 | 0.2 | GO:0042991 | transcription factor import into nucleus(GO:0042991) |
| 0.0 | 0.1 | GO:0003170 | heart valve development(GO:0003170) |
| 0.0 | 0.1 | GO:0090394 | negative regulation of excitatory postsynaptic potential(GO:0090394) |
| 0.0 | 0.4 | GO:0007229 | integrin-mediated signaling pathway(GO:0007229) |
| 0.0 | 0.1 | GO:0070544 | histone H3-K36 demethylation(GO:0070544) |
Gene overrepresentation in cellular_component category:
| Log-likelihood per target | Total log-likelihood | Term | Description |
|---|---|---|---|
| 5.6 | 22.3 | GO:0097129 | cyclin D2-CDK4 complex(GO:0097129) |
| 2.7 | 16.0 | GO:0005853 | eukaryotic translation elongation factor 1 complex(GO:0005853) |
| 1.8 | 9.2 | GO:0035189 | Rb-E2F complex(GO:0035189) |
| 1.8 | 5.3 | GO:0031088 | platelet dense granule membrane(GO:0031088) |
| 1.7 | 19.0 | GO:0005642 | annulate lamellae(GO:0005642) |
| 1.7 | 5.1 | GO:0071149 | TEAD-2-YAP complex(GO:0071149) |
| 1.7 | 5.0 | GO:0031074 | nucleocytoplasmic shuttling complex(GO:0031074) |
| 1.5 | 10.7 | GO:0097422 | tubular endosome(GO:0097422) |
| 1.5 | 4.6 | GO:0031510 | SUMO activating enzyme complex(GO:0031510) |
| 1.5 | 8.9 | GO:0070937 | CRD-mediated mRNA stability complex(GO:0070937) |
| 1.5 | 10.3 | GO:1990726 | Lsm1-7-Pat1 complex(GO:1990726) |
| 1.4 | 4.1 | GO:0070557 | PCNA-p21 complex(GO:0070557) |
| 1.3 | 5.1 | GO:0008537 | proteasome activator complex(GO:0008537) |
| 1.2 | 4.9 | GO:0090661 | box H/ACA telomerase RNP complex(GO:0090661) |
| 1.2 | 7.4 | GO:0000125 | PCAF complex(GO:0000125) |
| 1.2 | 3.5 | GO:0097059 | CNTFR-CLCF1 complex(GO:0097059) |
| 1.2 | 4.7 | GO:0001651 | dense fibrillar component(GO:0001651) |
| 1.1 | 12.4 | GO:1990907 | beta-catenin-TCF complex(GO:1990907) |
| 1.1 | 5.4 | GO:0042719 | mitochondrial intermembrane space protein transporter complex(GO:0042719) |
| 1.0 | 14.5 | GO:0035686 | sperm fibrous sheath(GO:0035686) |
| 1.0 | 4.8 | GO:0032133 | chromosome passenger complex(GO:0032133) |
| 0.9 | 8.2 | GO:0005742 | mitochondrial outer membrane translocase complex(GO:0005742) |
| 0.9 | 2.7 | GO:0043202 | lysosomal lumen(GO:0043202) |
| 0.9 | 5.3 | GO:0000444 | MIS12/MIND type complex(GO:0000444) |
| 0.9 | 3.4 | GO:0089717 | spanning component of plasma membrane(GO:0044214) spanning component of membrane(GO:0089717) |
| 0.8 | 2.5 | GO:0034274 | Atg12-Atg5-Atg16 complex(GO:0034274) |
| 0.8 | 3.3 | GO:0090537 | CERF complex(GO:0090537) |
| 0.8 | 4.9 | GO:0031428 | box C/D snoRNP complex(GO:0031428) |
| 0.8 | 4.9 | GO:0034448 | EGO complex(GO:0034448) |
| 0.8 | 3.2 | GO:0005775 | vacuolar lumen(GO:0005775) |
| 0.8 | 2.4 | GO:0005899 | insulin receptor complex(GO:0005899) |
| 0.8 | 3.9 | GO:0030314 | junctional membrane complex(GO:0030314) |
| 0.8 | 17.8 | GO:0031527 | filopodium membrane(GO:0031527) |
| 0.7 | 4.5 | GO:0033010 | paranodal junction(GO:0033010) |
| 0.7 | 1.5 | GO:0000799 | nuclear condensin complex(GO:0000799) |
| 0.7 | 2.0 | GO:0000801 | central element(GO:0000801) |
| 0.7 | 9.9 | GO:0001518 | voltage-gated sodium channel complex(GO:0001518) |
| 0.7 | 2.0 | GO:0097135 | cyclin E2-CDK2 complex(GO:0097135) |
| 0.7 | 3.3 | GO:0001674 | female germ cell nucleus(GO:0001674) |
| 0.6 | 5.0 | GO:0031415 | NatA complex(GO:0031415) |
| 0.6 | 1.9 | GO:0033186 | CAF-1 complex(GO:0033186) |
| 0.6 | 2.5 | GO:0070552 | BRISC complex(GO:0070552) |
| 0.6 | 6.3 | GO:0034709 | methylosome(GO:0034709) |
| 0.6 | 1.9 | GO:0000811 | GINS complex(GO:0000811) |
| 0.6 | 3.7 | GO:0046696 | lipopolysaccharide receptor complex(GO:0046696) |
| 0.6 | 8.6 | GO:0005922 | connexon complex(GO:0005922) |
| 0.6 | 3.1 | GO:0000408 | EKC/KEOPS complex(GO:0000408) |
| 0.6 | 1.8 | GO:0044614 | nuclear pore cytoplasmic filaments(GO:0044614) |
| 0.6 | 12.7 | GO:0016580 | Sin3 complex(GO:0016580) |
| 0.6 | 3.0 | GO:0071144 | SMAD2-SMAD3 protein complex(GO:0071144) |
| 0.6 | 31.5 | GO:0022627 | cytosolic small ribosomal subunit(GO:0022627) |
| 0.6 | 4.7 | GO:0097413 | Lewy body(GO:0097413) |
| 0.6 | 2.4 | GO:0030670 | phagocytic vesicle membrane(GO:0030670) |
| 0.6 | 7.4 | GO:0000177 | cytoplasmic exosome (RNase complex)(GO:0000177) |
| 0.6 | 4.4 | GO:0016281 | eukaryotic translation initiation factor 4F complex(GO:0016281) |
| 0.5 | 2.7 | GO:0033276 | transcription factor TFTC complex(GO:0033276) |
| 0.5 | 3.3 | GO:0060293 | P granule(GO:0043186) pole plasm(GO:0045495) germ plasm(GO:0060293) |
| 0.5 | 2.7 | GO:0034751 | aryl hydrocarbon receptor complex(GO:0034751) |
| 0.5 | 5.4 | GO:0070545 | PeBoW complex(GO:0070545) |
| 0.5 | 2.7 | GO:0033391 | chromatoid body(GO:0033391) |
| 0.5 | 8.5 | GO:0005852 | eukaryotic translation initiation factor 3 complex(GO:0005852) |
| 0.5 | 2.1 | GO:0043564 | Ku70:Ku80 complex(GO:0043564) |
| 0.5 | 3.1 | GO:0034388 | Pwp2p-containing subcomplex of 90S preribosome(GO:0034388) |
| 0.5 | 1.0 | GO:0005663 | DNA replication factor C complex(GO:0005663) |
| 0.5 | 7.3 | GO:0008250 | oligosaccharyltransferase complex(GO:0008250) |
| 0.5 | 5.7 | GO:0005832 | chaperonin-containing T-complex(GO:0005832) |
| 0.5 | 0.9 | GO:0001739 | sex chromatin(GO:0001739) |
| 0.5 | 3.2 | GO:0033503 | HULC complex(GO:0033503) |
| 0.4 | 1.3 | GO:1990730 | VCP-NSFL1C complex(GO:1990730) |
| 0.4 | 3.1 | GO:0001740 | Barr body(GO:0001740) |
| 0.4 | 4.3 | GO:0034719 | SMN-Sm protein complex(GO:0034719) |
| 0.4 | 7.3 | GO:0065010 | extracellular membrane-bounded organelle(GO:0065010) |
| 0.4 | 8.0 | GO:0046540 | U4/U6 x U5 tri-snRNP complex(GO:0046540) |
| 0.4 | 1.2 | GO:0045009 | melanosome membrane(GO:0033162) chitosome(GO:0045009) |
| 0.4 | 6.5 | GO:0030914 | STAGA complex(GO:0030914) |
| 0.4 | 1.2 | GO:0043625 | delta DNA polymerase complex(GO:0043625) |
| 0.4 | 12.1 | GO:0046658 | anchored component of plasma membrane(GO:0046658) |
| 0.4 | 2.8 | GO:0071818 | BAT3 complex(GO:0071818) ER membrane insertion complex(GO:0072379) |
| 0.4 | 1.2 | GO:0005584 | collagen type I trimer(GO:0005584) |
| 0.4 | 1.2 | GO:0034457 | Mpp10 complex(GO:0034457) |
| 0.4 | 4.2 | GO:0035748 | myelin sheath abaxonal region(GO:0035748) |
| 0.4 | 0.8 | GO:0044299 | C-fiber(GO:0044299) |
| 0.4 | 2.3 | GO:1990393 | 3M complex(GO:1990393) |
| 0.4 | 8.1 | GO:0005666 | DNA-directed RNA polymerase III complex(GO:0005666) |
| 0.4 | 6.6 | GO:0035102 | PRC1 complex(GO:0035102) |
| 0.4 | 1.4 | GO:0043293 | apoptosome(GO:0043293) |
| 0.3 | 3.1 | GO:0031390 | Ctf18 RFC-like complex(GO:0031390) |
| 0.3 | 1.7 | GO:0005726 | perichromatin fibrils(GO:0005726) |
| 0.3 | 3.4 | GO:0046930 | pore complex(GO:0046930) |
| 0.3 | 2.0 | GO:0045179 | apical cortex(GO:0045179) |
| 0.3 | 1.0 | GO:0097255 | R2TP complex(GO:0097255) |
| 0.3 | 0.3 | GO:1902737 | dendritic filopodium(GO:1902737) |
| 0.3 | 14.5 | GO:0000791 | euchromatin(GO:0000791) |
| 0.3 | 26.1 | GO:0022626 | cytosolic ribosome(GO:0022626) |
| 0.3 | 1.6 | GO:0005826 | actomyosin contractile ring(GO:0005826) |
| 0.3 | 0.6 | GO:0097346 | INO80-type complex(GO:0097346) |
| 0.3 | 1.3 | GO:0032280 | symmetric synapse(GO:0032280) |
| 0.3 | 0.9 | GO:0030690 | Noc1p-Noc2p complex(GO:0030690) |
| 0.3 | 1.8 | GO:0071986 | Ragulator complex(GO:0071986) |
| 0.3 | 13.6 | GO:0030173 | integral component of Golgi membrane(GO:0030173) |
| 0.3 | 1.2 | GO:0033553 | rDNA heterochromatin(GO:0033553) |
| 0.3 | 1.4 | GO:0001533 | cornified envelope(GO:0001533) |
| 0.3 | 2.6 | GO:0061617 | MICOS complex(GO:0061617) |
| 0.3 | 2.6 | GO:0000015 | phosphopyruvate hydratase complex(GO:0000015) |
| 0.3 | 1.4 | GO:0097226 | sperm mitochondrial sheath(GO:0097226) |
| 0.3 | 3.6 | GO:0005862 | muscle thin filament tropomyosin(GO:0005862) |
| 0.3 | 4.2 | GO:0000506 | glycosylphosphatidylinositol-N-acetylglucosaminyltransferase (GPI-GnT) complex(GO:0000506) |
| 0.3 | 2.5 | GO:0001939 | female pronucleus(GO:0001939) |
| 0.3 | 1.7 | GO:0032299 | ribonuclease H2 complex(GO:0032299) |
| 0.3 | 0.8 | GO:0005967 | mitochondrial pyruvate dehydrogenase complex(GO:0005967) |
| 0.3 | 4.3 | GO:0032156 | septin cytoskeleton(GO:0032156) |
| 0.3 | 1.3 | GO:0043527 | tRNA methyltransferase complex(GO:0043527) |
| 0.3 | 1.5 | GO:0000172 | ribonuclease MRP complex(GO:0000172) |
| 0.3 | 2.1 | GO:0005744 | mitochondrial inner membrane presequence translocase complex(GO:0005744) |
| 0.3 | 3.1 | GO:0034098 | VCP-NPL4-UFD1 AAA ATPase complex(GO:0034098) |
| 0.3 | 4.4 | GO:0005605 | basal lamina(GO:0005605) |
| 0.3 | 4.6 | GO:0031616 | spindle pole centrosome(GO:0031616) |
| 0.2 | 1.5 | GO:0097443 | sorting endosome(GO:0097443) |
| 0.2 | 1.5 | GO:0030896 | checkpoint clamp complex(GO:0030896) |
| 0.2 | 1.0 | GO:0097447 | dendritic tree(GO:0097447) |
| 0.2 | 2.2 | GO:0044666 | MLL3/4 complex(GO:0044666) |
| 0.2 | 17.0 | GO:0005581 | collagen trimer(GO:0005581) |
| 0.2 | 3.1 | GO:0031597 | cytosolic proteasome complex(GO:0031597) |
| 0.2 | 1.0 | GO:0031228 | intrinsic component of Golgi membrane(GO:0031228) |
| 0.2 | 0.9 | GO:0017071 | intracellular cyclic nucleotide activated cation channel complex(GO:0017071) |
| 0.2 | 1.6 | GO:0000796 | condensin complex(GO:0000796) |
| 0.2 | 1.6 | GO:0036195 | muscle cell projection(GO:0036194) muscle cell projection membrane(GO:0036195) |
| 0.2 | 1.1 | GO:0070776 | H3 histone acetyltransferase complex(GO:0070775) MOZ/MORF histone acetyltransferase complex(GO:0070776) |
| 0.2 | 2.5 | GO:0042575 | DNA polymerase complex(GO:0042575) |
| 0.2 | 11.2 | GO:0031901 | early endosome membrane(GO:0031901) |
| 0.2 | 0.9 | GO:0008540 | proteasome regulatory particle, base subcomplex(GO:0008540) |
| 0.2 | 1.3 | GO:0001673 | male germ cell nucleus(GO:0001673) |
| 0.2 | 4.0 | GO:1990124 | messenger ribonucleoprotein complex(GO:1990124) |
| 0.2 | 0.9 | GO:0033116 | endoplasmic reticulum-Golgi intermediate compartment membrane(GO:0033116) |
| 0.2 | 0.9 | GO:0045283 | mitochondrial respiratory chain complex II, succinate dehydrogenase complex (ubiquinone)(GO:0005749) succinate dehydrogenase complex (ubiquinone)(GO:0045257) respiratory chain complex II(GO:0045273) succinate dehydrogenase complex(GO:0045281) fumarate reductase complex(GO:0045283) |
| 0.2 | 2.0 | GO:0016442 | RISC complex(GO:0016442) RNAi effector complex(GO:0031332) |
| 0.2 | 1.9 | GO:0043219 | lateral loop(GO:0043219) |
| 0.2 | 2.1 | GO:0019773 | proteasome core complex, alpha-subunit complex(GO:0019773) |
| 0.2 | 8.0 | GO:0005790 | smooth endoplasmic reticulum(GO:0005790) |
| 0.2 | 3.0 | GO:0017101 | aminoacyl-tRNA synthetase multienzyme complex(GO:0017101) |
| 0.2 | 0.8 | GO:0071942 | XPC complex(GO:0071942) |
| 0.2 | 12.9 | GO:0005758 | mitochondrial intermembrane space(GO:0005758) |
| 0.2 | 0.8 | GO:0030289 | protein phosphatase 4 complex(GO:0030289) |
| 0.2 | 2.0 | GO:1990712 | HFE-transferrin receptor complex(GO:1990712) |
| 0.2 | 11.6 | GO:0015934 | large ribosomal subunit(GO:0015934) |
| 0.2 | 5.0 | GO:0005680 | anaphase-promoting complex(GO:0005680) |
| 0.2 | 2.2 | GO:0005915 | zonula adherens(GO:0005915) |
| 0.2 | 0.8 | GO:0044233 | ER-mitochondrion membrane contact site(GO:0044233) |
| 0.2 | 2.7 | GO:0097431 | mitotic spindle pole(GO:0097431) |
| 0.2 | 3.9 | GO:0035253 | ciliary rootlet(GO:0035253) |
| 0.2 | 1.7 | GO:0061574 | ASAP complex(GO:0061574) |
| 0.2 | 3.1 | GO:0043196 | varicosity(GO:0043196) |
| 0.2 | 8.6 | GO:0000307 | cyclin-dependent protein kinase holoenzyme complex(GO:0000307) |
| 0.2 | 1.1 | GO:0030062 | mitochondrial tricarboxylic acid cycle enzyme complex(GO:0030062) |
| 0.2 | 0.6 | GO:0005965 | protein farnesyltransferase complex(GO:0005965) |
| 0.2 | 1.5 | GO:0005787 | signal peptidase complex(GO:0005787) |
| 0.2 | 1.5 | GO:0005851 | eukaryotic translation initiation factor 2B complex(GO:0005851) |
| 0.2 | 2.1 | GO:0031528 | microvillus membrane(GO:0031528) |
| 0.2 | 9.1 | GO:0005844 | polysome(GO:0005844) |
| 0.2 | 0.9 | GO:0030061 | mitochondrial crista(GO:0030061) |
| 0.2 | 2.5 | GO:0000276 | mitochondrial proton-transporting ATP synthase complex, coupling factor F(o)(GO:0000276) |
| 0.2 | 1.1 | GO:0097342 | ripoptosome(GO:0097342) |
| 0.2 | 1.3 | GO:0005890 | sodium:potassium-exchanging ATPase complex(GO:0005890) |
| 0.2 | 0.9 | GO:0072487 | MSL complex(GO:0072487) |
| 0.2 | 0.7 | GO:0070761 | pre-snoRNP complex(GO:0070761) |
| 0.2 | 4.4 | GO:0000930 | gamma-tubulin complex(GO:0000930) |
| 0.2 | 1.4 | GO:0031315 | extrinsic component of mitochondrial outer membrane(GO:0031315) |
| 0.2 | 0.5 | GO:0030991 | intraciliary transport particle A(GO:0030991) |
| 0.2 | 0.3 | GO:0033180 | proton-transporting two-sector ATPase complex, catalytic domain(GO:0033178) proton-transporting V-type ATPase, V1 domain(GO:0033180) |
| 0.2 | 5.8 | GO:0000313 | organellar ribosome(GO:0000313) mitochondrial ribosome(GO:0005761) |
| 0.2 | 0.8 | GO:0000502 | proteasome complex(GO:0000502) |
| 0.2 | 1.6 | GO:0031080 | nuclear pore outer ring(GO:0031080) |
| 0.2 | 0.6 | GO:0002189 | ribose phosphate diphosphokinase complex(GO:0002189) |
| 0.2 | 0.8 | GO:0042406 | extrinsic component of endoplasmic reticulum membrane(GO:0042406) |
| 0.2 | 1.0 | GO:0001520 | outer dense fiber(GO:0001520) |
| 0.2 | 1.1 | GO:0045120 | pronucleus(GO:0045120) |
| 0.2 | 0.5 | GO:0035101 | FACT complex(GO:0035101) |
| 0.2 | 13.0 | GO:0000932 | cytoplasmic mRNA processing body(GO:0000932) |
| 0.1 | 0.7 | GO:0036396 | MIS complex(GO:0036396) mRNA editing complex(GO:0045293) |
| 0.1 | 0.3 | GO:0031314 | extrinsic component of mitochondrial inner membrane(GO:0031314) |
| 0.1 | 0.9 | GO:0070847 | core mediator complex(GO:0070847) |
| 0.1 | 0.6 | GO:0031467 | Cul7-RING ubiquitin ligase complex(GO:0031467) |
| 0.1 | 0.9 | GO:0042765 | GPI-anchor transamidase complex(GO:0042765) |
| 0.1 | 1.3 | GO:0016272 | prefoldin complex(GO:0016272) |
| 0.1 | 0.7 | GO:0035032 | phosphatidylinositol 3-kinase complex, class III(GO:0035032) |
| 0.1 | 3.4 | GO:0036126 | sperm flagellum(GO:0036126) |
| 0.1 | 0.4 | GO:1990590 | ATF1-ATF4 transcription factor complex(GO:1990590) |
| 0.1 | 1.4 | GO:0031970 | nuclear envelope lumen(GO:0005641) organelle envelope lumen(GO:0031970) |
| 0.1 | 0.5 | GO:0016222 | procollagen-proline 4-dioxygenase complex(GO:0016222) |
| 0.1 | 2.0 | GO:0005685 | U1 snRNP(GO:0005685) |
| 0.1 | 0.9 | GO:0030915 | Smc5-Smc6 complex(GO:0030915) |
| 0.1 | 0.5 | GO:1990357 | terminal web(GO:1990357) |
| 0.1 | 0.9 | GO:0031465 | Cul4B-RING E3 ubiquitin ligase complex(GO:0031465) |
| 0.1 | 13.0 | GO:0090575 | RNA polymerase II transcription factor complex(GO:0090575) |
| 0.1 | 0.4 | GO:0030667 | secretory granule membrane(GO:0030667) |
| 0.1 | 1.7 | GO:0005871 | kinesin complex(GO:0005871) |
| 0.1 | 1.5 | GO:0042555 | MCM complex(GO:0042555) |
| 0.1 | 7.4 | GO:0005643 | nuclear pore(GO:0005643) |
| 0.1 | 0.8 | GO:0045261 | mitochondrial proton-transporting ATP synthase complex, catalytic core F(1)(GO:0000275) proton-transporting ATP synthase complex, catalytic core F(1)(GO:0045261) |
| 0.1 | 4.7 | GO:0042645 | nucleoid(GO:0009295) mitochondrial nucleoid(GO:0042645) |
| 0.1 | 2.3 | GO:0038201 | TOR complex(GO:0038201) |
| 0.1 | 1.6 | GO:0030126 | COPI vesicle coat(GO:0030126) |
| 0.1 | 4.4 | GO:0071013 | catalytic step 2 spliceosome(GO:0071013) |
| 0.1 | 0.7 | GO:0000214 | tRNA-intron endonuclease complex(GO:0000214) |
| 0.1 | 0.8 | GO:0005682 | U5 snRNP(GO:0005682) |
| 0.1 | 0.2 | GO:0001652 | granular component(GO:0001652) |
| 0.1 | 1.7 | GO:1904115 | axon cytoplasm(GO:1904115) |
| 0.1 | 0.8 | GO:0000783 | telomere cap complex(GO:0000782) nuclear telomere cap complex(GO:0000783) |
| 0.1 | 0.7 | GO:0005638 | lamin filament(GO:0005638) |
| 0.1 | 0.7 | GO:0016600 | flotillin complex(GO:0016600) |
| 0.1 | 0.4 | GO:0000120 | RNA polymerase I transcription factor complex(GO:0000120) |
| 0.1 | 1.6 | GO:0030672 | synaptic vesicle membrane(GO:0030672) exocytic vesicle membrane(GO:0099501) |
| 0.1 | 1.1 | GO:0031011 | Ino80 complex(GO:0031011) |
| 0.1 | 0.3 | GO:0048269 | methionine adenosyltransferase complex(GO:0048269) |
| 0.1 | 3.1 | GO:0016592 | mediator complex(GO:0016592) |
| 0.1 | 3.8 | GO:0016235 | aggresome(GO:0016235) |
| 0.1 | 7.9 | GO:0017053 | transcriptional repressor complex(GO:0017053) |
| 0.1 | 0.3 | GO:0044302 | dentate gyrus mossy fiber(GO:0044302) |
| 0.1 | 5.1 | GO:0072686 | mitotic spindle(GO:0072686) |
| 0.1 | 0.4 | GO:0005859 | muscle myosin complex(GO:0005859) myosin II complex(GO:0016460) |
| 0.1 | 8.6 | GO:0001725 | stress fiber(GO:0001725) contractile actin filament bundle(GO:0097517) |
| 0.1 | 0.5 | GO:0030870 | Mre11 complex(GO:0030870) |
| 0.1 | 0.6 | GO:0043189 | NuA4 histone acetyltransferase complex(GO:0035267) H4/H2A histone acetyltransferase complex(GO:0043189) H4 histone acetyltransferase complex(GO:1902562) |
| 0.1 | 8.2 | GO:0005759 | mitochondrial matrix(GO:0005759) |
| 0.1 | 4.4 | GO:0016605 | PML body(GO:0016605) |
| 0.1 | 11.5 | GO:0044452 | nucleolar part(GO:0044452) |
| 0.1 | 0.8 | GO:0005665 | DNA-directed RNA polymerase II, core complex(GO:0005665) |
| 0.1 | 0.7 | GO:0005793 | endoplasmic reticulum-Golgi intermediate compartment(GO:0005793) |
| 0.1 | 1.2 | GO:0036038 | MKS complex(GO:0036038) |
| 0.1 | 2.0 | GO:0034451 | centriolar satellite(GO:0034451) |
| 0.1 | 2.2 | GO:0005868 | cytoplasmic dynein complex(GO:0005868) |
| 0.1 | 1.2 | GO:0016471 | vacuolar proton-transporting V-type ATPase complex(GO:0016471) |
| 0.1 | 3.5 | GO:0005801 | cis-Golgi network(GO:0005801) |
| 0.1 | 0.3 | GO:0019815 | B cell receptor complex(GO:0019815) |
| 0.1 | 1.7 | GO:0015030 | Cajal body(GO:0015030) |
| 0.1 | 0.9 | GO:0097542 | ciliary tip(GO:0097542) |
| 0.1 | 1.9 | GO:0044798 | nuclear transcription factor complex(GO:0044798) |
| 0.1 | 105.0 | GO:0005739 | mitochondrion(GO:0005739) |
| 0.1 | 0.5 | GO:0071014 | post-mRNA release spliceosomal complex(GO:0071014) |
| 0.1 | 0.6 | GO:0030478 | actin cap(GO:0030478) |
| 0.1 | 0.4 | GO:0005833 | hemoglobin complex(GO:0005833) |
| 0.1 | 4.0 | GO:0000786 | nucleosome(GO:0000786) |
| 0.1 | 0.4 | GO:0032045 | guanyl-nucleotide exchange factor complex(GO:0032045) |
| 0.1 | 2.7 | GO:0005902 | microvillus(GO:0005902) |
| 0.1 | 0.6 | GO:0005921 | gap junction(GO:0005921) |
| 0.1 | 1.9 | GO:0008180 | COP9 signalosome(GO:0008180) |
| 0.1 | 0.5 | GO:0032580 | Golgi cisterna membrane(GO:0032580) |
| 0.1 | 3.1 | GO:0072562 | blood microparticle(GO:0072562) |
| 0.1 | 1.3 | GO:0005791 | rough endoplasmic reticulum(GO:0005791) |
| 0.1 | 0.3 | GO:0005916 | fascia adherens(GO:0005916) |
| 0.1 | 1.2 | GO:0035145 | exon-exon junction complex(GO:0035145) |
| 0.1 | 0.6 | GO:0031464 | Cul4A-RING E3 ubiquitin ligase complex(GO:0031464) |
| 0.1 | 0.1 | GO:0034679 | integrin alpha9-beta1 complex(GO:0034679) |
| 0.1 | 0.1 | GO:0032311 | angiogenin-PRI complex(GO:0032311) |
| 0.1 | 0.5 | GO:0008290 | F-actin capping protein complex(GO:0008290) |
| 0.1 | 1.3 | GO:0005876 | spindle microtubule(GO:0005876) |
| 0.1 | 0.9 | GO:0005847 | mRNA cleavage and polyadenylation specificity factor complex(GO:0005847) |
| 0.0 | 2.6 | GO:0016363 | nuclear matrix(GO:0016363) |
| 0.0 | 0.9 | GO:0030496 | midbody(GO:0030496) |
| 0.0 | 0.3 | GO:0033588 | Elongator holoenzyme complex(GO:0033588) |
| 0.0 | 0.9 | GO:0005881 | cytoplasmic microtubule(GO:0005881) |
| 0.0 | 4.0 | GO:0031225 | anchored component of membrane(GO:0031225) |
| 0.0 | 0.5 | GO:0030122 | AP-2 adaptor complex(GO:0030122) |
| 0.0 | 0.7 | GO:0042470 | melanosome(GO:0042470) pigment granule(GO:0048770) |
| 0.0 | 0.4 | GO:0034464 | BBSome(GO:0034464) |
| 0.0 | 1.2 | GO:0031902 | late endosome membrane(GO:0031902) |
| 0.0 | 0.5 | GO:0097225 | sperm midpiece(GO:0097225) |
| 0.0 | 2.8 | GO:0005681 | spliceosomal complex(GO:0005681) |
| 0.0 | 0.7 | GO:0016327 | apicolateral plasma membrane(GO:0016327) |
| 0.0 | 0.2 | GO:0032777 | Piccolo NuA4 histone acetyltransferase complex(GO:0032777) |
| 0.0 | 6.6 | GO:0005667 | transcription factor complex(GO:0005667) |
| 0.0 | 2.1 | GO:0005604 | basement membrane(GO:0005604) |
| 0.0 | 1.6 | GO:0000118 | histone deacetylase complex(GO:0000118) |
| 0.0 | 0.3 | GO:0097525 | spliceosomal snRNP complex(GO:0097525) |
| 0.0 | 0.4 | GO:0097539 | ciliary transition fiber(GO:0097539) |
| 0.0 | 0.0 | GO:0030981 | cortical microtubule cytoskeleton(GO:0030981) |
| 0.0 | 1.8 | GO:0005901 | caveola(GO:0005901) |
| 0.0 | 0.4 | GO:0000407 | pre-autophagosomal structure(GO:0000407) |
| 0.0 | 0.6 | GO:0001750 | photoreceptor outer segment(GO:0001750) |
| 0.0 | 0.4 | GO:0030008 | TRAPP complex(GO:0030008) |
| 0.0 | 0.3 | GO:0002102 | podosome(GO:0002102) |
| 0.0 | 0.2 | GO:0030990 | intraciliary transport particle(GO:0030990) |
| 0.0 | 0.1 | GO:0045095 | keratin filament(GO:0045095) |
| 0.0 | 0.5 | GO:0005814 | centriole(GO:0005814) |
| 0.0 | 0.2 | GO:0000974 | Prp19 complex(GO:0000974) |
| 0.0 | 0.1 | GO:0034663 | endoplasmic reticulum chaperone complex(GO:0034663) |
| 0.0 | 0.1 | GO:0033093 | Weibel-Palade body(GO:0033093) |
| 0.0 | 0.3 | GO:0031209 | SCAR complex(GO:0031209) |
| 0.0 | 0.2 | GO:0042587 | glycogen granule(GO:0042587) |
| 0.0 | 0.7 | GO:0005778 | peroxisomal membrane(GO:0005778) microbody membrane(GO:0031903) |
| 0.0 | 0.3 | GO:0034399 | nuclear periphery(GO:0034399) |
| 0.0 | 1.6 | GO:0000151 | ubiquitin ligase complex(GO:0000151) |
| 0.0 | 0.5 | GO:0097440 | apical dendrite(GO:0097440) |
| 0.0 | 3.0 | GO:0005925 | focal adhesion(GO:0005925) |
| 0.0 | 5.8 | GO:0005789 | endoplasmic reticulum membrane(GO:0005789) |
| 0.0 | 0.6 | GO:0031514 | motile cilium(GO:0031514) |
| 0.0 | 0.1 | GO:0005664 | origin recognition complex(GO:0000808) nuclear origin of replication recognition complex(GO:0005664) |
| 0.0 | 0.1 | GO:0044305 | early phagosome(GO:0032009) calyx of Held(GO:0044305) |
| 0.0 | 0.7 | GO:0010494 | cytoplasmic stress granule(GO:0010494) |
| 0.0 | 40.9 | GO:0005576 | extracellular region(GO:0005576) |
| 0.0 | 0.4 | GO:0032993 | protein-DNA complex(GO:0032993) |
| 0.0 | 0.3 | GO:0016459 | myosin complex(GO:0016459) |
Gene overrepresentation in molecular_function category:
| Log-likelihood per target | Total log-likelihood | Term | Description |
|---|---|---|---|
| 3.9 | 11.7 | GO:0035939 | microsatellite binding(GO:0035939) |
| 3.5 | 10.5 | GO:0033829 | O-fucosylpeptide 3-beta-N-acetylglucosaminyltransferase activity(GO:0033829) |
| 2.8 | 8.3 | GO:0008732 | threonine aldolase activity(GO:0004793) L-allo-threonine aldolase activity(GO:0008732) |
| 2.2 | 8.6 | GO:0086075 | gap junction channel activity involved in cardiac conduction electrical coupling(GO:0086075) gap junction channel activity involved in cell communication by electrical coupling(GO:1903763) |
| 2.0 | 8.0 | GO:0008309 | double-stranded DNA exodeoxyribonuclease activity(GO:0008309) |
| 1.8 | 7.3 | GO:0004035 | alkaline phosphatase activity(GO:0004035) |
| 1.8 | 8.8 | GO:0031493 | nucleosomal histone binding(GO:0031493) |
| 1.7 | 7.0 | GO:0004459 | L-lactate dehydrogenase activity(GO:0004459) |
| 1.7 | 5.2 | GO:0046899 | nucleoside triphosphate adenylate kinase activity(GO:0046899) |
| 1.7 | 40.3 | GO:0003746 | translation elongation factor activity(GO:0003746) |
| 1.7 | 5.0 | GO:0004774 | succinate-CoA ligase activity(GO:0004774) |
| 1.6 | 4.9 | GO:0009881 | photoreceptor activity(GO:0009881) |
| 1.6 | 4.9 | GO:0030519 | snoRNP binding(GO:0030519) |
| 1.6 | 4.8 | GO:0003953 | NAD+ nucleosidase activity(GO:0003953) |
| 1.5 | 9.2 | GO:0030284 | estrogen receptor activity(GO:0030284) |
| 1.5 | 4.6 | GO:0000402 | open form four-way junction DNA binding(GO:0000401) crossed form four-way junction DNA binding(GO:0000402) |
| 1.4 | 9.9 | GO:0086006 | voltage-gated sodium channel activity involved in cardiac muscle cell action potential(GO:0086006) |
| 1.4 | 5.6 | GO:0031687 | A2A adenosine receptor binding(GO:0031687) |
| 1.3 | 5.4 | GO:0004832 | valine-tRNA ligase activity(GO:0004832) |
| 1.3 | 5.3 | GO:0004844 | uracil DNA N-glycosylase activity(GO:0004844) deaminated base DNA N-glycosylase activity(GO:0097506) |
| 1.3 | 7.9 | GO:1990932 | 5.8S rRNA binding(GO:1990932) |
| 1.3 | 9.0 | GO:0034452 | dynactin binding(GO:0034452) |
| 1.2 | 8.6 | GO:0015129 | lactate transmembrane transporter activity(GO:0015129) |
| 1.2 | 4.9 | GO:0004392 | heme oxygenase (decyclizing) activity(GO:0004392) |
| 1.2 | 3.6 | GO:0061711 | N(6)-L-threonylcarbamoyladenine synthase(GO:0061711) |
| 1.1 | 4.5 | GO:0034618 | arginine binding(GO:0034618) |
| 1.1 | 4.4 | GO:0035851 | Krueppel-associated box domain binding(GO:0035851) |
| 1.0 | 6.2 | GO:1990189 | peptide-serine-N-acetyltransferase activity(GO:1990189) |
| 1.0 | 4.1 | GO:0001537 | N-acetylgalactosamine 4-O-sulfotransferase activity(GO:0001537) |
| 1.0 | 3.0 | GO:0019776 | Atg8 ligase activity(GO:0019776) |
| 1.0 | 1.0 | GO:0003681 | bent DNA binding(GO:0003681) |
| 1.0 | 5.8 | GO:0070180 | large ribosomal subunit rRNA binding(GO:0070180) |
| 0.9 | 6.6 | GO:0034513 | box H/ACA snoRNA binding(GO:0034513) |
| 0.9 | 8.5 | GO:0031730 | CCR5 chemokine receptor binding(GO:0031730) |
| 0.9 | 2.8 | GO:0034597 | phosphatidylinositol-4,5-bisphosphate 4-phosphatase activity(GO:0034597) |
| 0.9 | 16.2 | GO:0004550 | nucleoside diphosphate kinase activity(GO:0004550) |
| 0.9 | 11.6 | GO:0031386 | protein tag(GO:0031386) |
| 0.9 | 5.3 | GO:0001069 | regulatory region RNA binding(GO:0001069) |
| 0.9 | 6.8 | GO:0031995 | insulin-like growth factor II binding(GO:0031995) |
| 0.9 | 4.3 | GO:0004565 | beta-galactosidase activity(GO:0004565) |
| 0.8 | 2.5 | GO:0019912 | cyclin-dependent protein kinase activating kinase activity(GO:0019912) |
| 0.8 | 10.0 | GO:0008190 | eukaryotic initiation factor 4E binding(GO:0008190) |
| 0.8 | 2.5 | GO:0033680 | ATP-dependent DNA/RNA helicase activity(GO:0033680) |
| 0.8 | 0.8 | GO:0001851 | complement component C3b binding(GO:0001851) |
| 0.8 | 2.5 | GO:0031686 | A1 adenosine receptor binding(GO:0031686) |
| 0.8 | 6.6 | GO:0061676 | importin-alpha family protein binding(GO:0061676) |
| 0.8 | 2.4 | GO:0003963 | RNA-3'-phosphate cyclase activity(GO:0003963) |
| 0.8 | 4.0 | GO:0008297 | single-stranded DNA exodeoxyribonuclease activity(GO:0008297) |
| 0.8 | 8.6 | GO:0015245 | fatty acid transporter activity(GO:0015245) |
| 0.8 | 1.6 | GO:0070644 | vitamin D response element binding(GO:0070644) |
| 0.8 | 14.7 | GO:0051920 | peroxiredoxin activity(GO:0051920) |
| 0.8 | 3.1 | GO:0016833 | oxo-acid-lyase activity(GO:0016833) |
| 0.8 | 3.1 | GO:0030984 | kininogen binding(GO:0030984) |
| 0.8 | 1.5 | GO:0070279 | vitamin B6 binding(GO:0070279) |
| 0.7 | 3.0 | GO:0016812 | hydrolase activity, acting on carbon-nitrogen (but not peptide) bonds, in cyclic amides(GO:0016812) |
| 0.7 | 1.5 | GO:0008853 | exodeoxyribonuclease III activity(GO:0008853) |
| 0.7 | 4.4 | GO:0043426 | MRF binding(GO:0043426) |
| 0.7 | 2.9 | GO:0033300 | dehydroascorbic acid transporter activity(GO:0033300) D-glucose transmembrane transporter activity(GO:0055056) |
| 0.7 | 32.1 | GO:0004693 | cyclin-dependent protein serine/threonine kinase activity(GO:0004693) |
| 0.7 | 4.2 | GO:0004332 | fructose-bisphosphate aldolase activity(GO:0004332) |
| 0.7 | 2.1 | GO:0008534 | oxidized purine nucleobase lesion DNA N-glycosylase activity(GO:0008534) |
| 0.7 | 2.1 | GO:0004335 | galactokinase activity(GO:0004335) |
| 0.7 | 4.1 | GO:0005087 | Ran guanyl-nucleotide exchange factor activity(GO:0005087) |
| 0.7 | 1.4 | GO:0034046 | poly(G) binding(GO:0034046) |
| 0.7 | 2.7 | GO:0016774 | phosphotransferase activity, carboxyl group as acceptor(GO:0016774) |
| 0.7 | 5.4 | GO:0016846 | carbon-sulfur lyase activity(GO:0016846) |
| 0.7 | 2.0 | GO:0004998 | transferrin receptor activity(GO:0004998) |
| 0.7 | 3.3 | GO:0030621 | U4 snRNA binding(GO:0030621) |
| 0.6 | 3.2 | GO:0035614 | snRNA stem-loop binding(GO:0035614) |
| 0.6 | 1.9 | GO:0004813 | alanine-tRNA ligase activity(GO:0004813) |
| 0.6 | 1.9 | GO:0042284 | sphingolipid delta-4 desaturase activity(GO:0042284) |
| 0.6 | 3.2 | GO:0001010 | transcription factor activity, sequence-specific DNA binding transcription factor recruiting(GO:0001010) |
| 0.6 | 3.1 | GO:0019238 | cyclohydrolase activity(GO:0019238) |
| 0.6 | 2.5 | GO:0044020 | protein-arginine omega-N monomethyltransferase activity(GO:0035241) protein-arginine omega-N symmetric methyltransferase activity(GO:0035243) histone methyltransferase activity (H4-R3 specific)(GO:0044020) |
| 0.6 | 2.5 | GO:0004046 | aminoacylase activity(GO:0004046) |
| 0.6 | 1.8 | GO:0016015 | morphogen activity(GO:0016015) |
| 0.6 | 7.3 | GO:0016799 | hydrolase activity, hydrolyzing N-glycosyl compounds(GO:0016799) |
| 0.6 | 4.2 | GO:0047429 | nucleoside-triphosphate diphosphatase activity(GO:0047429) |
| 0.6 | 3.0 | GO:0030618 | transforming growth factor beta receptor, pathway-specific cytoplasmic mediator activity(GO:0030618) |
| 0.6 | 3.6 | GO:0043139 | 5'-3' DNA helicase activity(GO:0043139) |
| 0.6 | 2.4 | GO:0030292 | protein tyrosine kinase inhibitor activity(GO:0030292) |
| 0.6 | 10.7 | GO:0043121 | neurotrophin binding(GO:0043121) |
| 0.6 | 3.5 | GO:0004897 | ciliary neurotrophic factor receptor activity(GO:0004897) |
| 0.6 | 1.7 | GO:0070140 | isopeptidase activity(GO:0070122) ubiquitin-like protein-specific isopeptidase activity(GO:0070138) SUMO-specific isopeptidase activity(GO:0070140) |
| 0.6 | 8.6 | GO:0009982 | pseudouridine synthase activity(GO:0009982) |
| 0.6 | 7.4 | GO:0004576 | oligosaccharyl transferase activity(GO:0004576) dolichyl-diphosphooligosaccharide-protein glycotransferase activity(GO:0004579) |
| 0.6 | 5.1 | GO:0061133 | endopeptidase activator activity(GO:0061133) |
| 0.6 | 0.6 | GO:0072542 | protein phosphatase activator activity(GO:0072542) |
| 0.6 | 8.9 | GO:1990226 | histone methyltransferase binding(GO:1990226) |
| 0.6 | 2.2 | GO:0051032 | nucleic acid transmembrane transporter activity(GO:0051032) RNA transmembrane transporter activity(GO:0051033) |
| 0.5 | 4.4 | GO:0047631 | ADP-ribose diphosphatase activity(GO:0047631) |
| 0.5 | 2.2 | GO:0003883 | CTP synthase activity(GO:0003883) |
| 0.5 | 4.3 | GO:0046974 | histone methyltransferase activity (H3-K9 specific)(GO:0046974) |
| 0.5 | 3.7 | GO:0043559 | insulin binding(GO:0043559) |
| 0.5 | 3.2 | GO:1990829 | C-rich single-stranded DNA binding(GO:1990829) |
| 0.5 | 1.6 | GO:0019166 | trans-2-enoyl-CoA reductase (NADPH) activity(GO:0019166) |
| 0.5 | 2.1 | GO:0003938 | IMP dehydrogenase activity(GO:0003938) |
| 0.5 | 3.7 | GO:1990825 | sequence-specific mRNA binding(GO:1990825) |
| 0.5 | 2.6 | GO:0005134 | interleukin-2 receptor binding(GO:0005134) |
| 0.5 | 4.2 | GO:0044388 | small protein activating enzyme binding(GO:0044388) |
| 0.5 | 6.2 | GO:0019956 | chemokine binding(GO:0019956) |
| 0.5 | 1.0 | GO:0005049 | nuclear export signal receptor activity(GO:0005049) |
| 0.5 | 2.6 | GO:0005344 | oxygen transporter activity(GO:0005344) |
| 0.5 | 1.5 | GO:1990050 | phosphatidic acid transporter activity(GO:1990050) |
| 0.5 | 2.0 | GO:0015111 | iodide transmembrane transporter activity(GO:0015111) |
| 0.5 | 4.5 | GO:0000774 | adenyl-nucleotide exchange factor activity(GO:0000774) |
| 0.5 | 9.5 | GO:0008266 | poly(U) RNA binding(GO:0008266) |
| 0.5 | 1.5 | GO:0097100 | supercoiled DNA binding(GO:0097100) |
| 0.5 | 2.9 | GO:0008479 | queuine tRNA-ribosyltransferase activity(GO:0008479) |
| 0.5 | 1.4 | GO:0008192 | RNA guanylyltransferase activity(GO:0008192) |
| 0.5 | 18.2 | GO:0045182 | translation regulator activity(GO:0045182) |
| 0.5 | 1.4 | GO:0004616 | phosphogluconate dehydrogenase (decarboxylating) activity(GO:0004616) |
| 0.5 | 5.9 | GO:0047372 | acylglycerol lipase activity(GO:0047372) |
| 0.5 | 2.7 | GO:0001094 | TFIID-class transcription factor binding(GO:0001094) |
| 0.5 | 9.9 | GO:0042813 | Wnt-activated receptor activity(GO:0042813) |
| 0.4 | 1.8 | GO:0046923 | ER retention sequence binding(GO:0046923) |
| 0.4 | 9.8 | GO:0017160 | Ral GTPase binding(GO:0017160) |
| 0.4 | 1.7 | GO:0004427 | inorganic diphosphatase activity(GO:0004427) |
| 0.4 | 1.7 | GO:0016971 | flavin-linked sulfhydryl oxidase activity(GO:0016971) |
| 0.4 | 3.4 | GO:0039706 | co-receptor binding(GO:0039706) |
| 0.4 | 3.4 | GO:0046703 | natural killer cell lectin-like receptor binding(GO:0046703) |
| 0.4 | 1.7 | GO:0015254 | glycerol channel activity(GO:0015254) |
| 0.4 | 19.2 | GO:0016831 | carboxy-lyase activity(GO:0016831) |
| 0.4 | 1.7 | GO:0015183 | L-aspartate transmembrane transporter activity(GO:0015183) |
| 0.4 | 2.9 | GO:0070915 | lysophosphatidic acid receptor activity(GO:0070915) |
| 0.4 | 1.2 | GO:0035651 | AP-1 adaptor complex binding(GO:0035650) AP-3 adaptor complex binding(GO:0035651) |
| 0.4 | 1.6 | GO:0000983 | transcription factor activity, RNA polymerase II core promoter sequence-specific(GO:0000983) |
| 0.4 | 6.5 | GO:0001013 | RNA polymerase I regulatory region DNA binding(GO:0001013) |
| 0.4 | 1.6 | GO:0036435 | K48-linked polyubiquitin binding(GO:0036435) |
| 0.4 | 1.2 | GO:0008296 | 3'-5'-exodeoxyribonuclease activity(GO:0008296) |
| 0.4 | 12.8 | GO:0017025 | TBP-class protein binding(GO:0017025) |
| 0.4 | 1.2 | GO:0000033 | alpha-1,3-mannosyltransferase activity(GO:0000033) |
| 0.4 | 3.6 | GO:0045294 | alpha-catenin binding(GO:0045294) |
| 0.4 | 2.3 | GO:0008467 | [heparan sulfate]-glucosamine 3-sulfotransferase 1 activity(GO:0008467) |
| 0.4 | 1.6 | GO:0004032 | alditol:NADP+ 1-oxidoreductase activity(GO:0004032) |
| 0.4 | 1.9 | GO:0052833 | inositol monophosphate 1-phosphatase activity(GO:0008934) inositol monophosphate 3-phosphatase activity(GO:0052832) inositol monophosphate 4-phosphatase activity(GO:0052833) inositol monophosphate phosphatase activity(GO:0052834) |
| 0.4 | 17.6 | GO:0061631 | ubiquitin conjugating enzyme activity(GO:0061631) |
| 0.4 | 3.4 | GO:0051434 | BH3 domain binding(GO:0051434) |
| 0.4 | 4.5 | GO:0070097 | delta-catenin binding(GO:0070097) |
| 0.4 | 3.4 | GO:0016427 | tRNA (cytosine) methyltransferase activity(GO:0016427) |
| 0.4 | 3.7 | GO:0001055 | RNA polymerase II activity(GO:0001055) |
| 0.4 | 1.1 | GO:0046964 | 3'-phosphoadenosine 5'-phosphosulfate transmembrane transporter activity(GO:0046964) |
| 0.4 | 4.0 | GO:0022841 | potassium ion leak channel activity(GO:0022841) |
| 0.4 | 1.5 | GO:0004515 | nicotinamide-nucleotide adenylyltransferase activity(GO:0000309) nicotinate-nucleotide adenylyltransferase activity(GO:0004515) |
| 0.4 | 2.1 | GO:0001758 | retinal dehydrogenase activity(GO:0001758) |
| 0.4 | 6.7 | GO:0005104 | fibroblast growth factor receptor binding(GO:0005104) |
| 0.3 | 15.7 | GO:0005158 | insulin receptor binding(GO:0005158) |
| 0.3 | 1.0 | GO:0004704 | NF-kappaB-inducing kinase activity(GO:0004704) |
| 0.3 | 1.0 | GO:0070878 | primary miRNA binding(GO:0070878) |
| 0.3 | 11.4 | GO:0005109 | frizzled binding(GO:0005109) |
| 0.3 | 1.0 | GO:0009383 | rRNA (cytosine-C5-)-methyltransferase activity(GO:0009383) |
| 0.3 | 3.0 | GO:0048027 | mRNA 5'-UTR binding(GO:0048027) |
| 0.3 | 3.7 | GO:0043522 | leucine zipper domain binding(GO:0043522) |
| 0.3 | 1.7 | GO:0030620 | U2 snRNA binding(GO:0030620) |
| 0.3 | 5.2 | GO:0098641 | cadherin binding involved in cell-cell adhesion(GO:0098641) |
| 0.3 | 3.9 | GO:0008191 | metalloendopeptidase inhibitor activity(GO:0008191) |
| 0.3 | 2.9 | GO:0005212 | structural constituent of eye lens(GO:0005212) |
| 0.3 | 1.6 | GO:0004809 | tRNA (guanine-N2-)-methyltransferase activity(GO:0004809) |
| 0.3 | 51.9 | GO:0003735 | structural constituent of ribosome(GO:0003735) |
| 0.3 | 5.7 | GO:0001222 | transcription corepressor binding(GO:0001222) |
| 0.3 | 0.9 | GO:0050510 | N-acetylgalactosaminyl-proteoglycan 3-beta-glucuronosyltransferase activity(GO:0050510) |
| 0.3 | 7.8 | GO:0043395 | heparan sulfate proteoglycan binding(GO:0043395) |
| 0.3 | 3.1 | GO:0008474 | palmitoyl-(protein) hydrolase activity(GO:0008474) palmitoyl hydrolase activity(GO:0098599) |
| 0.3 | 4.0 | GO:0016863 | intramolecular oxidoreductase activity, transposing C=C bonds(GO:0016863) |
| 0.3 | 2.7 | GO:0005007 | fibroblast growth factor-activated receptor activity(GO:0005007) |
| 0.3 | 2.1 | GO:0004523 | RNA-DNA hybrid ribonuclease activity(GO:0004523) |
| 0.3 | 0.9 | GO:0035242 | histone-arginine N-methyltransferase activity(GO:0008469) protein-arginine omega-N asymmetric methyltransferase activity(GO:0035242) |
| 0.3 | 2.1 | GO:0043023 | ribosomal large subunit binding(GO:0043023) |
| 0.3 | 1.5 | GO:0030229 | very-low-density lipoprotein particle receptor activity(GO:0030229) |
| 0.3 | 2.4 | GO:0004865 | protein serine/threonine phosphatase inhibitor activity(GO:0004865) |
| 0.3 | 1.5 | GO:0044547 | DNA topoisomerase binding(GO:0044547) |
| 0.3 | 0.9 | GO:0008177 | succinate dehydrogenase (ubiquinone) activity(GO:0008177) |
| 0.3 | 0.9 | GO:0008176 | tRNA (guanine-N7-)-methyltransferase activity(GO:0008176) |
| 0.3 | 2.6 | GO:0004634 | phosphopyruvate hydratase activity(GO:0004634) |
| 0.3 | 8.5 | GO:0044183 | protein binding involved in protein folding(GO:0044183) |
| 0.3 | 0.6 | GO:0016615 | malate dehydrogenase activity(GO:0016615) |
| 0.3 | 0.8 | GO:0008515 | sucrose:proton symporter activity(GO:0008506) sucrose transmembrane transporter activity(GO:0008515) disaccharide transmembrane transporter activity(GO:0015154) oligosaccharide transmembrane transporter activity(GO:0015157) |
| 0.3 | 3.1 | GO:0017176 | phosphatidylinositol N-acetylglucosaminyltransferase activity(GO:0017176) |
| 0.3 | 2.0 | GO:0001075 | transcription factor activity, RNA polymerase II core promoter sequence-specific binding involved in preinitiation complex assembly(GO:0001075) |
| 0.3 | 0.8 | GO:0004637 | phosphoribosylamine-glycine ligase activity(GO:0004637) |
| 0.3 | 16.9 | GO:0003743 | translation initiation factor activity(GO:0003743) |
| 0.3 | 7.5 | GO:0008432 | JUN kinase binding(GO:0008432) |
| 0.3 | 3.8 | GO:0017017 | MAP kinase tyrosine/serine/threonine phosphatase activity(GO:0017017) |
| 0.3 | 2.4 | GO:0001972 | retinoic acid binding(GO:0001972) |
| 0.3 | 2.9 | GO:0003689 | DNA clamp loader activity(GO:0003689) protein-DNA loading ATPase activity(GO:0033170) |
| 0.3 | 0.5 | GO:0070568 | guanylyltransferase activity(GO:0070568) |
| 0.3 | 7.1 | GO:0051537 | 2 iron, 2 sulfur cluster binding(GO:0051537) |
| 0.3 | 1.8 | GO:1990247 | N6-methyladenosine-containing RNA binding(GO:1990247) |
| 0.3 | 4.9 | GO:0008483 | transaminase activity(GO:0008483) |
| 0.3 | 0.8 | GO:0004022 | alcohol dehydrogenase (NAD) activity(GO:0004022) |
| 0.3 | 3.1 | GO:0001618 | virus receptor activity(GO:0001618) |
| 0.3 | 2.0 | GO:0003886 | DNA (cytosine-5-)-methyltransferase activity(GO:0003886) |
| 0.2 | 0.7 | GO:0004994 | somatostatin receptor activity(GO:0004994) |
| 0.2 | 1.7 | GO:0016018 | cyclosporin A binding(GO:0016018) |
| 0.2 | 1.0 | GO:0016842 | amidine-lyase activity(GO:0016842) |
| 0.2 | 1.0 | GO:0045131 | pre-mRNA branch point binding(GO:0045131) |
| 0.2 | 9.3 | GO:0031492 | nucleosomal DNA binding(GO:0031492) |
| 0.2 | 2.4 | GO:0019206 | nucleoside kinase activity(GO:0019206) |
| 0.2 | 0.7 | GO:0051022 | Rho GDP-dissociation inhibitor binding(GO:0051022) |
| 0.2 | 1.4 | GO:0046912 | transferase activity, transferring acyl groups, acyl groups converted into alkyl on transfer(GO:0046912) |
| 0.2 | 1.6 | GO:0001515 | opioid peptide activity(GO:0001515) |
| 0.2 | 2.6 | GO:0009922 | fatty acid elongase activity(GO:0009922) 3-oxo-arachidoyl-CoA synthase activity(GO:0102336) 3-oxo-cerotoyl-CoA synthase activity(GO:0102337) 3-oxo-lignoceronyl-CoA synthase activity(GO:0102338) |
| 0.2 | 1.6 | GO:0016618 | hydroxypyruvate reductase activity(GO:0016618) glyoxylate reductase (NADP) activity(GO:0030267) |
| 0.2 | 0.7 | GO:0000171 | ribonuclease MRP activity(GO:0000171) |
| 0.2 | 1.8 | GO:0004767 | sphingomyelin phosphodiesterase activity(GO:0004767) |
| 0.2 | 0.9 | GO:0086038 | calcium:sodium antiporter activity involved in regulation of cardiac muscle cell membrane potential(GO:0086038) |
| 0.2 | 2.0 | GO:0035251 | UDP-glucosyltransferase activity(GO:0035251) |
| 0.2 | 7.8 | GO:0008307 | structural constituent of muscle(GO:0008307) |
| 0.2 | 0.9 | GO:0004126 | cytidine deaminase activity(GO:0004126) pyrroline-5-carboxylate reductase activity(GO:0004735) |
| 0.2 | 2.1 | GO:0051575 | 5'-deoxyribose-5-phosphate lyase activity(GO:0051575) |
| 0.2 | 0.8 | GO:0030976 | thiamine pyrophosphate binding(GO:0030976) |
| 0.2 | 0.8 | GO:0005166 | neurotrophin p75 receptor binding(GO:0005166) |
| 0.2 | 1.2 | GO:0004645 | phosphorylase activity(GO:0004645) |
| 0.2 | 2.3 | GO:0015037 | peptide disulfide oxidoreductase activity(GO:0015037) |
| 0.2 | 0.6 | GO:0001875 | lipopolysaccharide receptor activity(GO:0001875) |
| 0.2 | 2.5 | GO:0051019 | mitogen-activated protein kinase binding(GO:0051019) |
| 0.2 | 0.8 | GO:0004740 | pyruvate dehydrogenase (acetyl-transferring) kinase activity(GO:0004740) |
| 0.2 | 0.6 | GO:0004699 | calcium-independent protein kinase C activity(GO:0004699) |
| 0.2 | 7.3 | GO:0004864 | protein phosphatase inhibitor activity(GO:0004864) |
| 0.2 | 2.4 | GO:0031996 | thioesterase binding(GO:0031996) |
| 0.2 | 1.2 | GO:0051428 | peptide hormone receptor binding(GO:0051428) |
| 0.2 | 0.8 | GO:0003844 | 1,4-alpha-glucan branching enzyme activity(GO:0003844) |
| 0.2 | 3.9 | GO:0070064 | proline-rich region binding(GO:0070064) |
| 0.2 | 0.6 | GO:0002060 | purine nucleobase binding(GO:0002060) |
| 0.2 | 3.3 | GO:0046933 | proton-transporting ATP synthase activity, rotational mechanism(GO:0046933) |
| 0.2 | 3.5 | GO:0004653 | polypeptide N-acetylgalactosaminyltransferase activity(GO:0004653) |
| 0.2 | 1.8 | GO:0004128 | cytochrome-b5 reductase activity, acting on NAD(P)H(GO:0004128) |
| 0.2 | 2.3 | GO:0005160 | transforming growth factor beta receptor binding(GO:0005160) |
| 0.2 | 1.5 | GO:0017162 | aryl hydrocarbon receptor binding(GO:0017162) |
| 0.2 | 1.5 | GO:0038036 | sphingosine-1-phosphate receptor activity(GO:0038036) |
| 0.2 | 0.8 | GO:0031727 | CCR2 chemokine receptor binding(GO:0031727) |
| 0.2 | 2.3 | GO:0017166 | vinculin binding(GO:0017166) |
| 0.2 | 0.2 | GO:0036004 | GAF domain binding(GO:0036004) |
| 0.2 | 0.6 | GO:0004660 | protein farnesyltransferase activity(GO:0004660) |
| 0.2 | 0.6 | GO:0005118 | sevenless binding(GO:0005118) |
| 0.2 | 1.3 | GO:1990239 | steroid hormone binding(GO:1990239) |
| 0.2 | 0.9 | GO:0005052 | peroxisome matrix targeting signal-1 binding(GO:0005052) |
| 0.2 | 2.4 | GO:0005149 | interleukin-1 receptor binding(GO:0005149) |
| 0.2 | 1.9 | GO:0005522 | profilin binding(GO:0005522) |
| 0.2 | 6.3 | GO:0003899 | DNA-directed RNA polymerase activity(GO:0003899) |
| 0.2 | 0.7 | GO:0033192 | calmodulin-dependent protein phosphatase activity(GO:0033192) |
| 0.2 | 4.0 | GO:0004129 | cytochrome-c oxidase activity(GO:0004129) heme-copper terminal oxidase activity(GO:0015002) oxidoreductase activity, acting on a heme group of donors(GO:0016675) oxidoreductase activity, acting on a heme group of donors, oxygen as acceptor(GO:0016676) |
| 0.2 | 3.3 | GO:0008510 | sodium:bicarbonate symporter activity(GO:0008510) |
| 0.2 | 1.1 | GO:0001206 | transcriptional repressor activity, RNA polymerase II distal enhancer sequence-specific binding(GO:0001206) |
| 0.2 | 0.7 | GO:0035174 | histone serine kinase activity(GO:0035174) |
| 0.2 | 1.4 | GO:0098632 | protein binding involved in cell-cell adhesion(GO:0098632) |
| 0.2 | 0.4 | GO:0005487 | nucleocytoplasmic transporter activity(GO:0005487) |
| 0.2 | 0.9 | GO:0019789 | SUMO transferase activity(GO:0019789) |
| 0.2 | 2.4 | GO:0017134 | fibroblast growth factor binding(GO:0017134) |
| 0.2 | 4.8 | GO:0017091 | AU-rich element binding(GO:0017091) |
| 0.2 | 9.8 | GO:0070491 | repressing transcription factor binding(GO:0070491) |
| 0.2 | 0.8 | GO:0000339 | RNA cap binding(GO:0000339) |
| 0.2 | 9.3 | GO:0003725 | double-stranded RNA binding(GO:0003725) |
| 0.2 | 6.8 | GO:0008536 | Ran GTPase binding(GO:0008536) |
| 0.2 | 3.3 | GO:0071855 | neuropeptide receptor binding(GO:0071855) |
| 0.2 | 1.7 | GO:0015266 | protein channel activity(GO:0015266) |
| 0.2 | 0.7 | GO:0070700 | BMP receptor binding(GO:0070700) |
| 0.2 | 0.3 | GO:0016979 | lipoate-protein ligase activity(GO:0016979) |
| 0.2 | 0.5 | GO:0015403 | thiamine uptake transmembrane transporter activity(GO:0015403) |
| 0.2 | 1.7 | GO:0048185 | activin binding(GO:0048185) |
| 0.2 | 1.0 | GO:0004886 | 9-cis retinoic acid receptor activity(GO:0004886) thyroid hormone receptor coactivator activity(GO:0030375) |
| 0.2 | 0.7 | GO:0008476 | protein-tyrosine sulfotransferase activity(GO:0008476) |
| 0.2 | 5.0 | GO:0001965 | G-protein alpha-subunit binding(GO:0001965) |
| 0.2 | 0.6 | GO:0004176 | ATP-dependent peptidase activity(GO:0004176) |
| 0.2 | 0.2 | GO:0010181 | FMN binding(GO:0010181) |
| 0.2 | 0.6 | GO:0004749 | ribose phosphate diphosphokinase activity(GO:0004749) |
| 0.2 | 0.9 | GO:0001162 | RNA polymerase II intronic transcription regulatory region sequence-specific DNA binding(GO:0001162) |
| 0.2 | 3.9 | GO:0000175 | 3'-5'-exoribonuclease activity(GO:0000175) |
| 0.2 | 1.2 | GO:0008429 | phosphatidylethanolamine binding(GO:0008429) |
| 0.2 | 0.6 | GO:0016422 | mRNA (2'-O-methyladenosine-N6-)-methyltransferase activity(GO:0016422) |
| 0.2 | 0.6 | GO:0004692 | cGMP-dependent protein kinase activity(GO:0004692) |
| 0.1 | 0.4 | GO:0008430 | selenium binding(GO:0008430) |
| 0.1 | 1.0 | GO:0048038 | quinone binding(GO:0048038) |
| 0.1 | 0.9 | GO:0003923 | GPI-anchor transamidase activity(GO:0003923) |
| 0.1 | 0.6 | GO:0005093 | Rab GDP-dissociation inhibitor activity(GO:0005093) |
| 0.1 | 2.9 | GO:0017046 | peptide hormone binding(GO:0017046) |
| 0.1 | 0.7 | GO:0004594 | pantothenate kinase activity(GO:0004594) |
| 0.1 | 3.3 | GO:0004385 | guanylate kinase activity(GO:0004385) |
| 0.1 | 0.6 | GO:0070573 | metallodipeptidase activity(GO:0070573) |
| 0.1 | 8.4 | GO:0051082 | unfolded protein binding(GO:0051082) |
| 0.1 | 0.5 | GO:0050632 | propanoyl-CoA C-acyltransferase activity(GO:0033814) propionyl-CoA C2-trimethyltridecanoyltransferase activity(GO:0050632) phosphatidylethanolamine transporter activity(GO:1904121) |
| 0.1 | 0.8 | GO:0005138 | interleukin-6 receptor binding(GO:0005138) |
| 0.1 | 0.5 | GO:0016670 | oxidoreductase activity, acting on a sulfur group of donors, oxygen as acceptor(GO:0016670) |
| 0.1 | 0.3 | GO:0005128 | erythropoietin receptor binding(GO:0005128) |
| 0.1 | 0.3 | GO:0051864 | histone demethylase activity (H3-K36 specific)(GO:0051864) |
| 0.1 | 0.7 | GO:0008097 | 5S rRNA binding(GO:0008097) |
| 0.1 | 0.7 | GO:0045028 | G-protein coupled nucleotide receptor activity(GO:0001608) G-protein coupled purinergic nucleotide receptor activity(GO:0045028) |
| 0.1 | 1.3 | GO:0045236 | CXCR chemokine receptor binding(GO:0045236) |
| 0.1 | 1.8 | GO:0005537 | mannose binding(GO:0005537) |
| 0.1 | 0.3 | GO:0004028 | 3-chloroallyl aldehyde dehydrogenase activity(GO:0004028) |
| 0.1 | 1.3 | GO:0043539 | protein serine/threonine kinase activator activity(GO:0043539) |
| 0.1 | 0.4 | GO:0019002 | GMP binding(GO:0019002) |
| 0.1 | 2.6 | GO:0004602 | glutathione peroxidase activity(GO:0004602) |
| 0.1 | 3.9 | GO:0051536 | iron-sulfur cluster binding(GO:0051536) metal cluster binding(GO:0051540) |
| 0.1 | 0.4 | GO:0042954 | lipoprotein transporter activity(GO:0042954) |
| 0.1 | 0.6 | GO:0004342 | glucosamine-6-phosphate deaminase activity(GO:0004342) |
| 0.1 | 0.4 | GO:0051425 | PTB domain binding(GO:0051425) |
| 0.1 | 0.7 | GO:0008526 | phosphatidylinositol transporter activity(GO:0008526) |
| 0.1 | 3.0 | GO:0016655 | oxidoreductase activity, acting on NAD(P)H, quinone or similar compound as acceptor(GO:0016655) |
| 0.1 | 1.2 | GO:0015347 | sodium-independent organic anion transmembrane transporter activity(GO:0015347) |
| 0.1 | 0.4 | GO:0004450 | isocitrate dehydrogenase (NADP+) activity(GO:0004450) |
| 0.1 | 1.3 | GO:0016805 | dipeptidase activity(GO:0016805) |
| 0.1 | 2.2 | GO:0042800 | histone methyltransferase activity (H3-K4 specific)(GO:0042800) |
| 0.1 | 1.7 | GO:0004527 | exonuclease activity(GO:0004527) |
| 0.1 | 0.6 | GO:0004708 | MAP kinase kinase activity(GO:0004708) |
| 0.1 | 5.5 | GO:0019955 | cytokine binding(GO:0019955) |
| 0.1 | 3.7 | GO:0016504 | peptidase activator activity(GO:0016504) |
| 0.1 | 2.3 | GO:1990841 | promoter-specific chromatin binding(GO:1990841) |
| 0.1 | 0.7 | GO:0000213 | tRNA-intron endonuclease activity(GO:0000213) endoribonuclease activity, producing 3'-phosphomonoesters(GO:0016892) |
| 0.1 | 0.4 | GO:0004169 | dolichyl-phosphate-mannose-protein mannosyltransferase activity(GO:0004169) |
| 0.1 | 1.6 | GO:0043138 | 3'-5' DNA helicase activity(GO:0043138) |
| 0.1 | 7.6 | GO:0008565 | protein transporter activity(GO:0008565) |
| 0.1 | 2.6 | GO:0097602 | cullin family protein binding(GO:0097602) |
| 0.1 | 0.6 | GO:0004983 | neuropeptide Y receptor activity(GO:0004983) |
| 0.1 | 0.8 | GO:0004526 | ribonuclease P activity(GO:0004526) |
| 0.1 | 0.4 | GO:0042910 | xenobiotic transporter activity(GO:0042910) |
| 0.1 | 1.8 | GO:0017049 | GTP-Rho binding(GO:0017049) |
| 0.1 | 2.3 | GO:0001671 | ATPase activator activity(GO:0001671) |
| 0.1 | 1.4 | GO:0004879 | RNA polymerase II transcription factor activity, ligand-activated sequence-specific DNA binding(GO:0004879) transcription factor activity, direct ligand regulated sequence-specific DNA binding(GO:0098531) |
| 0.1 | 3.7 | GO:0005507 | copper ion binding(GO:0005507) |
| 0.1 | 1.8 | GO:0005044 | scavenger receptor activity(GO:0005044) |
| 0.1 | 0.4 | GO:0008273 | calcium, potassium:sodium antiporter activity(GO:0008273) |
| 0.1 | 2.0 | GO:0016651 | oxidoreductase activity, acting on NAD(P)H(GO:0016651) |
| 0.1 | 1.4 | GO:0045504 | dynein heavy chain binding(GO:0045504) |
| 0.1 | 0.3 | GO:0035198 | miRNA binding(GO:0035198) |
| 0.1 | 13.4 | GO:0001078 | transcriptional repressor activity, RNA polymerase II core promoter proximal region sequence-specific binding(GO:0001078) |
| 0.1 | 0.7 | GO:0003993 | acid phosphatase activity(GO:0003993) |
| 0.1 | 0.3 | GO:0016508 | long-chain-enoyl-CoA hydratase activity(GO:0016508) |
| 0.1 | 0.8 | GO:0031078 | histone deacetylase activity (H3-K14 specific)(GO:0031078) NAD-dependent histone deacetylase activity (H3-K14 specific)(GO:0032041) |
| 0.1 | 0.5 | GO:0016861 | intramolecular oxidoreductase activity, interconverting aldoses and ketoses(GO:0016861) |
| 0.1 | 1.1 | GO:0048407 | platelet-derived growth factor binding(GO:0048407) |
| 0.1 | 0.3 | GO:0016286 | small conductance calcium-activated potassium channel activity(GO:0016286) |
| 0.1 | 2.6 | GO:0003730 | mRNA 3'-UTR binding(GO:0003730) |
| 0.1 | 1.0 | GO:0019855 | calcium channel inhibitor activity(GO:0019855) |
| 0.1 | 0.4 | GO:0016813 | hydrolase activity, acting on carbon-nitrogen (but not peptide) bonds, in linear amidines(GO:0016813) |
| 0.1 | 2.0 | GO:0016538 | cyclin-dependent protein serine/threonine kinase regulator activity(GO:0016538) |
| 0.1 | 2.8 | GO:0048487 | beta-tubulin binding(GO:0048487) |
| 0.1 | 3.4 | GO:0004402 | histone acetyltransferase activity(GO:0004402) |
| 0.1 | 1.4 | GO:0043425 | bHLH transcription factor binding(GO:0043425) |
| 0.1 | 0.4 | GO:0004596 | peptide alpha-N-acetyltransferase activity(GO:0004596) |
| 0.1 | 3.8 | GO:0033613 | activating transcription factor binding(GO:0033613) |
| 0.1 | 0.7 | GO:0008409 | 5'-3' exonuclease activity(GO:0008409) |
| 0.1 | 3.9 | GO:0005125 | cytokine activity(GO:0005125) |
| 0.1 | 1.0 | GO:0035254 | glutamate receptor binding(GO:0035254) |
| 0.1 | 0.8 | GO:0015036 | disulfide oxidoreductase activity(GO:0015036) |
| 0.1 | 0.8 | GO:0022889 | L-serine transmembrane transporter activity(GO:0015194) serine transmembrane transporter activity(GO:0022889) |
| 0.1 | 1.2 | GO:0004623 | phospholipase A2 activity(GO:0004623) |
| 0.1 | 1.2 | GO:0030544 | Hsp70 protein binding(GO:0030544) |
| 0.1 | 2.5 | GO:0019888 | protein phosphatase regulator activity(GO:0019888) |
| 0.1 | 3.5 | GO:0004004 | RNA helicase activity(GO:0003724) ATP-dependent RNA helicase activity(GO:0004004) |
| 0.1 | 5.2 | GO:0044822 | mRNA binding(GO:0003729) poly(A) RNA binding(GO:0044822) |
| 0.1 | 0.6 | GO:0070679 | inositol 1,4,5 trisphosphate binding(GO:0070679) |
| 0.1 | 1.0 | GO:0004435 | phosphatidylinositol phospholipase C activity(GO:0004435) |
| 0.1 | 1.6 | GO:0036002 | pre-mRNA binding(GO:0036002) |
| 0.1 | 1.0 | GO:0016709 | oxidoreductase activity, acting on paired donors, with incorporation or reduction of molecular oxygen, NAD(P)H as one donor, and incorporation of one atom of oxygen(GO:0016709) |
| 0.1 | 0.7 | GO:0003887 | DNA-directed DNA polymerase activity(GO:0003887) |
| 0.1 | 1.1 | GO:0004707 | MAP kinase activity(GO:0004707) |
| 0.1 | 0.1 | GO:1990254 | keratin filament binding(GO:1990254) |
| 0.1 | 3.0 | GO:0048365 | Rac GTPase binding(GO:0048365) |
| 0.1 | 0.2 | GO:0004321 | fatty-acyl-CoA synthase activity(GO:0004321) |
| 0.1 | 2.0 | GO:0004177 | aminopeptidase activity(GO:0004177) |
| 0.1 | 0.5 | GO:0016500 | protein-hormone receptor activity(GO:0016500) |
| 0.1 | 0.3 | GO:0005021 | vascular endothelial growth factor-activated receptor activity(GO:0005021) |
| 0.1 | 0.3 | GO:0031419 | cobalamin binding(GO:0031419) |
| 0.1 | 1.5 | GO:0003684 | damaged DNA binding(GO:0003684) |
| 0.1 | 0.8 | GO:0042162 | telomeric DNA binding(GO:0042162) |
| 0.1 | 0.8 | GO:0004198 | calcium-dependent cysteine-type endopeptidase activity(GO:0004198) |
| 0.1 | 0.3 | GO:0019770 | IgG receptor activity(GO:0019770) |
| 0.1 | 0.3 | GO:0005540 | hyaluronic acid binding(GO:0005540) |
| 0.1 | 0.2 | GO:0001637 | G-protein coupled chemoattractant receptor activity(GO:0001637) chemokine receptor activity(GO:0004950) |
| 0.0 | 0.5 | GO:0019208 | phosphatase regulator activity(GO:0019208) |
| 0.0 | 1.8 | GO:0004715 | non-membrane spanning protein tyrosine kinase activity(GO:0004715) |
| 0.0 | 1.7 | GO:0043021 | ribonucleoprotein complex binding(GO:0043021) |
| 0.0 | 2.1 | GO:0005547 | phosphatidylinositol-3,4,5-trisphosphate binding(GO:0005547) |
| 0.0 | 0.9 | GO:0004364 | glutathione transferase activity(GO:0004364) |
| 0.0 | 3.4 | GO:0051015 | actin filament binding(GO:0051015) |
| 0.0 | 0.3 | GO:0016004 | phospholipase activator activity(GO:0016004) lipase activator activity(GO:0060229) |
| 0.0 | 0.8 | GO:0004190 | aspartic-type endopeptidase activity(GO:0004190) aspartic-type peptidase activity(GO:0070001) |
| 0.0 | 0.1 | GO:0050816 | phosphothreonine binding(GO:0050816) |
| 0.0 | 1.1 | GO:0005385 | zinc ion transmembrane transporter activity(GO:0005385) |
| 0.0 | 0.3 | GO:0000182 | rDNA binding(GO:0000182) |
| 0.0 | 10.4 | GO:0001077 | transcriptional activator activity, RNA polymerase II core promoter proximal region sequence-specific binding(GO:0001077) |
| 0.0 | 0.6 | GO:0008484 | sulfuric ester hydrolase activity(GO:0008484) |
| 0.0 | 1.2 | GO:0002039 | p53 binding(GO:0002039) |
| 0.0 | 0.4 | GO:0004185 | serine-type carboxypeptidase activity(GO:0004185) |
| 0.0 | 2.0 | GO:0035064 | methylated histone binding(GO:0035064) |
| 0.0 | 0.1 | GO:0001565 | phorbol ester receptor activity(GO:0001565) non-kinase phorbol ester receptor activity(GO:0001566) |
| 0.0 | 0.2 | GO:0004839 | ubiquitin activating enzyme activity(GO:0004839) |
| 0.0 | 0.9 | GO:0030291 | protein serine/threonine kinase inhibitor activity(GO:0030291) |
| 0.0 | 0.7 | GO:0008175 | tRNA methyltransferase activity(GO:0008175) |
| 0.0 | 0.3 | GO:0008143 | poly(A) binding(GO:0008143) poly-purine tract binding(GO:0070717) |
| 0.0 | 0.5 | GO:0070566 | adenylyltransferase activity(GO:0070566) |
| 0.0 | 0.7 | GO:0008080 | N-acetyltransferase activity(GO:0008080) |
| 0.0 | 0.5 | GO:0005504 | fatty acid binding(GO:0005504) |
| 0.0 | 0.5 | GO:0036312 | phosphatidylinositol 3-kinase regulatory subunit binding(GO:0036312) |
| 0.0 | 0.7 | GO:0005070 | SH3/SH2 adaptor activity(GO:0005070) |
| 0.0 | 0.8 | GO:0016763 | transferase activity, transferring pentosyl groups(GO:0016763) |
| 0.0 | 2.5 | GO:0043130 | ubiquitin binding(GO:0043130) |
| 0.0 | 0.2 | GO:0034450 | ubiquitin-ubiquitin ligase activity(GO:0034450) |
| 0.0 | 0.2 | GO:0097027 | ubiquitin-protein transferase activator activity(GO:0097027) |
| 0.0 | 0.2 | GO:0003828 | alpha-N-acetylneuraminate alpha-2,8-sialyltransferase activity(GO:0003828) |
| 0.0 | 0.4 | GO:0035035 | histone acetyltransferase binding(GO:0035035) |
| 0.0 | 0.2 | GO:0005229 | intracellular calcium activated chloride channel activity(GO:0005229) |
| 0.0 | 0.1 | GO:0004017 | adenylate kinase activity(GO:0004017) |
| 0.0 | 1.5 | GO:0002020 | protease binding(GO:0002020) |
| 0.0 | 0.3 | GO:0033130 | acetylcholine receptor binding(GO:0033130) |
| 0.0 | 0.4 | GO:0035259 | glucocorticoid receptor binding(GO:0035259) |
| 0.0 | 0.2 | GO:0031748 | D1 dopamine receptor binding(GO:0031748) |
| 0.0 | 0.4 | GO:0008200 | ion channel inhibitor activity(GO:0008200) |
| 0.0 | 2.7 | GO:0003714 | transcription corepressor activity(GO:0003714) |
| 0.0 | 0.3 | GO:0034987 | immunoglobulin receptor binding(GO:0034987) |
| 0.0 | 0.3 | GO:0050750 | low-density lipoprotein particle receptor binding(GO:0050750) |
| 0.0 | 0.8 | GO:0043015 | gamma-tubulin binding(GO:0043015) |
| 0.0 | 0.5 | GO:0045505 | dynein intermediate chain binding(GO:0045505) |
| 0.0 | 0.1 | GO:0016802 | adenosylhomocysteinase activity(GO:0004013) trialkylsulfonium hydrolase activity(GO:0016802) |
| 0.0 | 21.2 | GO:0003723 | RNA binding(GO:0003723) |
| 0.0 | 0.1 | GO:0004103 | choline kinase activity(GO:0004103) |
| 0.0 | 0.2 | GO:0045134 | uridine-diphosphatase activity(GO:0045134) |
| 0.0 | 0.3 | GO:0030295 | protein kinase activator activity(GO:0030295) |
| 0.0 | 0.1 | GO:0072349 | modified amino acid transmembrane transporter activity(GO:0072349) |
| 0.0 | 0.3 | GO:0016779 | nucleotidyltransferase activity(GO:0016779) |
| 0.0 | 0.1 | GO:0008428 | ribonuclease inhibitor activity(GO:0008428) |
| 0.0 | 0.1 | GO:0008518 | reduced folate carrier activity(GO:0008518) |
| 0.0 | 0.1 | GO:0003688 | DNA replication origin binding(GO:0003688) |
| 0.0 | 0.7 | GO:0001047 | core promoter binding(GO:0001047) |
| 0.0 | 0.3 | GO:0001085 | RNA polymerase II transcription factor binding(GO:0001085) |
| 0.0 | 0.1 | GO:0004521 | endoribonuclease activity(GO:0004521) |
| 0.0 | 0.1 | GO:0003705 | transcription factor activity, RNA polymerase II distal enhancer sequence-specific binding(GO:0003705) |
| 0.0 | 0.0 | GO:0003854 | 3-beta-hydroxy-delta5-steroid dehydrogenase activity(GO:0003854) |
| 0.0 | 0.1 | GO:0008327 | methyl-CpG binding(GO:0008327) |
Gene overrepresentation in C2:CP category:
| Log-likelihood per target | Total log-likelihood | Term | Description |
|---|---|---|---|
| 2.5 | 34.8 | SA_REG_CASCADE_OF_CYCLIN_EXPR | Expression of cyclins regulates progression through the cell cycle by activating cyclin-dependent kinases. |
| 0.8 | 6.4 | SA_G1_AND_S_PHASES | Cdk2, 4, and 6 bind cyclin D in G1, while cdk2/cyclin E promotes the G1/S transition. |
| 0.7 | 78.8 | PID_MYC_ACTIV_PATHWAY | Validated targets of C-MYC transcriptional activation |
| 0.5 | 15.3 | PID_WNT_SIGNALING_PATHWAY | Wnt signaling network |
| 0.5 | 8.5 | ST_STAT3_PATHWAY | STAT3 Pathway |
| 0.5 | 15.0 | PID_FRA_PATHWAY | Validated transcriptional targets of AP1 family members Fra1 and Fra2 |
| 0.5 | 3.4 | PID_SMAD2_3PATHWAY | Regulation of cytoplasmic and nuclear SMAD2/3 signaling |
| 0.4 | 3.6 | PID_HIF1A_PATHWAY | Hypoxic and oxygen homeostasis regulation of HIF-1-alpha |
| 0.4 | 15.7 | NABA_BASEMENT_MEMBRANES | Genes encoding structural components of basement membranes |
| 0.4 | 6.6 | PID_RANBP2_PATHWAY | Sumoylation by RanBP2 regulates transcriptional repression |
| 0.4 | 0.7 | PID_PI3K_PLC_TRK_PATHWAY | Trk receptor signaling mediated by PI3K and PLC-gamma |
| 0.4 | 19.2 | PID_HES_HEY_PATHWAY | Notch-mediated HES/HEY network |
| 0.3 | 11.3 | PID_INTEGRIN3_PATHWAY | Beta3 integrin cell surface interactions |
| 0.3 | 2.9 | PID_INTEGRIN2_PATHWAY | Beta2 integrin cell surface interactions |
| 0.3 | 10.1 | PID_HIF2PATHWAY | HIF-2-alpha transcription factor network |
| 0.3 | 3.7 | PID_TCR_RAS_PATHWAY | Ras signaling in the CD4+ TCR pathway |
| 0.3 | 3.9 | PID_BETA_CATENIN_DEG_PATHWAY | Degradation of beta catenin |
| 0.3 | 14.8 | PID_IGF1_PATHWAY | IGF1 pathway |
| 0.3 | 7.3 | PID_IL2_STAT5_PATHWAY | IL2 signaling events mediated by STAT5 |
| 0.3 | 24.7 | PID_BETA_CATENIN_NUC_PATHWAY | Regulation of nuclear beta catenin signaling and target gene transcription |
| 0.3 | 2.7 | PID_TCR_CALCIUM_PATHWAY | Calcium signaling in the CD4+ TCR pathway |
| 0.2 | 1.0 | PID_FAS_PATHWAY | FAS (CD95) signaling pathway |
| 0.2 | 1.0 | PID_ALK1_PATHWAY | ALK1 signaling events |
| 0.2 | 10.0 | PID_ILK_PATHWAY | Integrin-linked kinase signaling |
| 0.2 | 11.0 | PID_BMP_PATHWAY | BMP receptor signaling |
| 0.2 | 14.2 | PID_SMAD2_3NUCLEAR_PATHWAY | Regulation of nuclear SMAD2/3 signaling |
| 0.2 | 1.6 | PID_PDGFRA_PATHWAY | PDGFR-alpha signaling pathway |
| 0.2 | 8.3 | PID_AURORA_B_PATHWAY | Aurora B signaling |
| 0.2 | 6.5 | PID_HNF3B_PATHWAY | FOXA2 and FOXA3 transcription factor networks |
| 0.2 | 4.7 | ST_ERK1_ERK2_MAPK_PATHWAY | ERK1/ERK2 MAPK Pathway |
| 0.2 | 3.9 | PID_P38_MK2_PATHWAY | p38 signaling mediated by MAPKAP kinases |
| 0.2 | 0.7 | PID_ALK2_PATHWAY | ALK2 signaling events |
| 0.2 | 0.7 | PID_SYNDECAN_1_PATHWAY | Syndecan-1-mediated signaling events |
| 0.2 | 6.1 | SIG_INSULIN_RECEPTOR_PATHWAY_IN_CARDIAC_MYOCYTES | Genes related to the insulin receptor pathway |
| 0.2 | 8.1 | PID_INSULIN_PATHWAY | Insulin Pathway |
| 0.2 | 6.5 | PID_TGFBR_PATHWAY | TGF-beta receptor signaling |
| 0.2 | 5.2 | PID_E2F_PATHWAY | E2F transcription factor network |
| 0.1 | 0.7 | SA_G2_AND_M_PHASES | Cdc25 activates the cdc2/cyclin B complex to induce the G2/M transition. |
| 0.1 | 2.0 | ST_WNT_BETA_CATENIN_PATHWAY | Wnt/beta-catenin Pathway |
| 0.1 | 1.7 | PID_AP1_PATHWAY | AP-1 transcription factor network |
| 0.1 | 2.9 | PID_AURORA_A_PATHWAY | Aurora A signaling |
| 0.1 | 1.6 | PID_AJDISS_2PATHWAY | Posttranslational regulation of adherens junction stability and dissassembly |
| 0.1 | 1.0 | PID_TRAIL_PATHWAY | TRAIL signaling pathway |
| 0.1 | 5.9 | WNT_SIGNALING | Genes related to Wnt-mediated signal transduction |
| 0.1 | 2.0 | ST_P38_MAPK_PATHWAY | p38 MAPK Pathway |
| 0.1 | 7.0 | PID_AR_PATHWAY | Coregulation of Androgen receptor activity |
| 0.1 | 1.7 | PID_EPHRINB_REV_PATHWAY | Ephrin B reverse signaling |
| 0.1 | 1.7 | PID_IL23_PATHWAY | IL23-mediated signaling events |
| 0.1 | 5.9 | PID_ERA_GENOMIC_PATHWAY | Validated nuclear estrogen receptor alpha network |
| 0.1 | 1.1 | PID_GLYPICAN_1PATHWAY | Glypican 1 network |
| 0.1 | 1.0 | PID_LYSOPHOSPHOLIPID_PATHWAY | LPA receptor mediated events |
| 0.1 | 1.9 | PID_FOXM1_PATHWAY | FOXM1 transcription factor network |
| 0.1 | 2.8 | PID_IL12_2PATHWAY | IL12-mediated signaling events |
| 0.1 | 1.9 | PID_HEDGEHOG_2PATHWAY | Signaling events mediated by the Hedgehog family |
| 0.1 | 3.3 | SIG_REGULATION_OF_THE_ACTIN_CYTOSKELETON_BY_RHO_GTPASES | Genes related to regulation of the actin cytoskeleton |
| 0.1 | 1.3 | PID_PTP1B_PATHWAY | Signaling events mediated by PTP1B |
| 0.1 | 1.7 | PID_P38_ALPHA_BETA_PATHWAY | Regulation of p38-alpha and p38-beta |
| 0.1 | 1.2 | PID_ECADHERIN_STABILIZATION_PATHWAY | Stabilization and expansion of the E-cadherin adherens junction |
| 0.1 | 1.5 | PID_PI3KCI_PATHWAY | Class I PI3K signaling events |
| 0.1 | 2.2 | PID_TELOMERASE_PATHWAY | Regulation of Telomerase |
| 0.1 | 2.3 | PID_PLK1_PATHWAY | PLK1 signaling events |
| 0.1 | 2.5 | PID_HDAC_CLASSI_PATHWAY | Signaling events mediated by HDAC Class I |
| 0.0 | 1.2 | PID_REG_GR_PATHWAY | Glucocorticoid receptor regulatory network |
| 0.0 | 0.4 | SA_PROGRAMMED_CELL_DEATH | Programmed cell death, or apoptosis, eliminates damaged or unneeded cells. |
| 0.0 | 0.4 | PID_UPA_UPAR_PATHWAY | Urokinase-type plasminogen activator (uPA) and uPAR-mediated signaling |
| 0.0 | 1.8 | PID_CASPASE_PATHWAY | Caspase cascade in apoptosis |
| 0.0 | 0.7 | PID_BCR_5PATHWAY | BCR signaling pathway |
| 0.0 | 0.2 | ST_TYPE_I_INTERFERON_PATHWAY | Type I Interferon (alpha/beta IFN) Pathway |
| 0.0 | 0.3 | PID_VEGF_VEGFR_PATHWAY | VEGF and VEGFR signaling network |
| 0.0 | 1.1 | PID_INTEGRIN1_PATHWAY | Beta1 integrin cell surface interactions |
| 0.0 | 1.1 | NABA_PROTEOGLYCANS | Genes encoding proteoglycans |
| 0.0 | 0.6 | ST_INTEGRIN_SIGNALING_PATHWAY | Integrin Signaling Pathway |
| 0.0 | 3.9 | NABA_ECM_GLYCOPROTEINS | Genes encoding structural ECM glycoproteins |
| 0.0 | 0.7 | PID_RHOA_PATHWAY | RhoA signaling pathway |
| 0.0 | 0.6 | PID_BARD1_PATHWAY | BARD1 signaling events |
| 0.0 | 0.4 | PID_HNF3A_PATHWAY | FOXA1 transcription factor network |
| 0.0 | 1.2 | PID_AR_TF_PATHWAY | Regulation of Androgen receptor activity |
| 0.0 | 0.3 | PID_HDAC_CLASSIII_PATHWAY | Signaling events mediated by HDAC Class III |
| 0.0 | 0.4 | PID_ALPHA_SYNUCLEIN_PATHWAY | Alpha-synuclein signaling |
| 0.0 | 0.5 | PID_DELTA_NP63_PATHWAY | Validated transcriptional targets of deltaNp63 isoforms |
| 0.0 | 0.4 | ST_GAQ_PATHWAY | G alpha q Pathway |
| 0.0 | 0.8 | PID_MYC_REPRESS_PATHWAY | Validated targets of C-MYC transcriptional repression |
| 0.0 | 0.1 | PID_IL2_PI3K_PATHWAY | IL2 signaling events mediated by PI3K |
| 0.0 | 0.1 | PID_TOLL_ENDOGENOUS_PATHWAY | Endogenous TLR signaling |
| 0.0 | 0.1 | PID_PS1_PATHWAY | Presenilin action in Notch and Wnt signaling |
| 0.0 | 0.0 | PID_NFAT_3PATHWAY | Role of Calcineurin-dependent NFAT signaling in lymphocytes |
| 0.0 | 0.3 | PID_P53_REGULATION_PATHWAY | p53 pathway |
Gene overrepresentation in C2:CP:REACTOME category:
| Log-likelihood per target | Total log-likelihood | Term | Description |
|---|---|---|---|
| 1.4 | 19.0 | REACTOME_PURINE_RIBONUCLEOSIDE_MONOPHOSPHATE_BIOSYNTHESIS | Genes involved in Purine ribonucleoside monophosphate biosynthesis |
| 1.0 | 14.5 | REACTOME_CHYLOMICRON_MEDIATED_LIPID_TRANSPORT | Genes involved in Chylomicron-mediated lipid transport |
| 1.0 | 45.6 | REACTOME_G1_PHASE | Genes involved in G1 Phase |
| 1.0 | 8.6 | REACTOME_BILE_SALT_AND_ORGANIC_ANION_SLC_TRANSPORTERS | Genes involved in Bile salt and organic anion SLC transporters |
| 0.8 | 18.6 | REACTOME_PTM_GAMMA_CARBOXYLATION_HYPUSINE_FORMATION_AND_ARYLSULFATASE_ACTIVATION | Genes involved in PTM: gamma carboxylation, hypusine formation and arylsulfatase activation |
| 0.8 | 50.6 | REACTOME_ACTIVATION_OF_THE_MRNA_UPON_BINDING_OF_THE_CAP_BINDING_COMPLEX_AND_EIFS_AND_SUBSEQUENT_BINDING_TO_43S | Genes involved in Activation of the mRNA upon binding of the cap-binding complex and eIFs, and subsequent binding to 43S |
| 0.8 | 16.0 | REACTOME_SIGNAL_ATTENUATION | Genes involved in Signal attenuation |
| 0.7 | 15.5 | REACTOME_SIGNALING_BY_NODAL | Genes involved in Signaling by NODAL |
| 0.7 | 8.6 | REACTOME_GAP_JUNCTION_ASSEMBLY | Genes involved in Gap junction assembly |
| 0.7 | 8.5 | REACTOME_IL_6_SIGNALING | Genes involved in Interleukin-6 signaling |
| 0.6 | 16.8 | REACTOME_SMAD2_SMAD3_SMAD4_HETEROTRIMER_REGULATES_TRANSCRIPTION | Genes involved in SMAD2/SMAD3:SMAD4 heterotrimer regulates transcription |
| 0.6 | 9.9 | REACTOME_PRE_NOTCH_PROCESSING_IN_GOLGI | Genes involved in Pre-NOTCH Processing in Golgi |
| 0.6 | 10.3 | REACTOME_MRNA_DECAY_BY_5_TO_3_EXORIBONUCLEASE | Genes involved in mRNA Decay by 5' to 3' Exoribonuclease |
| 0.6 | 12.5 | REACTOME_PYRIMIDINE_METABOLISM | Genes involved in Pyrimidine metabolism |
| 0.5 | 5.8 | REACTOME_BASE_FREE_SUGAR_PHOSPHATE_REMOVAL_VIA_THE_SINGLE_NUCLEOTIDE_REPLACEMENT_PATHWAY | Genes involved in Base-free sugar-phosphate removal via the single-nucleotide replacement pathway |
| 0.5 | 5.3 | REACTOME_ACYL_CHAIN_REMODELLING_OF_PG | Genes involved in Acyl chain remodelling of PG |
| 0.5 | 26.5 | REACTOME_MITOCHONDRIAL_PROTEIN_IMPORT | Genes involved in Mitochondrial Protein Import |
| 0.5 | 10.4 | REACTOME_FORMATION_OF_TUBULIN_FOLDING_INTERMEDIATES_BY_CCT_TRIC | Genes involved in Formation of tubulin folding intermediates by CCT/TriC |
| 0.4 | 3.1 | REACTOME_THE_NLRP3_INFLAMMASOME | Genes involved in The NLRP3 inflammasome |
| 0.4 | 8.6 | REACTOME_HS_GAG_DEGRADATION | Genes involved in HS-GAG degradation |
| 0.4 | 5.2 | REACTOME_GLUCOSE_TRANSPORT | Genes involved in Glucose transport |
| 0.4 | 10.1 | REACTOME_SYNTHESIS_AND_INTERCONVERSION_OF_NUCLEOTIDE_DI_AND_TRIPHOSPHATES | Genes involved in Synthesis and interconversion of nucleotide di- and triphosphates |
| 0.4 | 25.6 | REACTOME_PEPTIDE_CHAIN_ELONGATION | Genes involved in Peptide chain elongation |
| 0.4 | 3.4 | REACTOME_ELONGATION_ARREST_AND_RECOVERY | Genes involved in Elongation arrest and recovery |
| 0.4 | 10.5 | REACTOME_CYTOSOLIC_TRNA_AMINOACYLATION | Genes involved in Cytosolic tRNA aminoacylation |
| 0.4 | 3.7 | REACTOME_MRNA_DECAY_BY_3_TO_5_EXORIBONUCLEASE | Genes involved in mRNA Decay by 3' to 5' Exoribonuclease |
| 0.4 | 2.6 | REACTOME_ENDOGENOUS_STEROLS | Genes involved in Endogenous sterols |
| 0.4 | 2.9 | REACTOME_PROLACTIN_RECEPTOR_SIGNALING | Genes involved in Prolactin receptor signaling |
| 0.4 | 3.3 | REACTOME_P2Y_RECEPTORS | Genes involved in P2Y receptors |
| 0.4 | 8.4 | REACTOME_MICRORNA_MIRNA_BIOGENESIS | Genes involved in MicroRNA (miRNA) Biogenesis |
| 0.4 | 3.3 | REACTOME_INFLUENZA_VIRAL_RNA_TRANSCRIPTION_AND_REPLICATION | Genes involved in Influenza Viral RNA Transcription and Replication |
| 0.4 | 3.3 | REACTOME_PURINE_CATABOLISM | Genes involved in Purine catabolism |
| 0.3 | 2.8 | REACTOME_PASSIVE_TRANSPORT_BY_AQUAPORINS | Genes involved in Passive Transport by Aquaporins |
| 0.3 | 5.2 | REACTOME_METABOLISM_OF_NON_CODING_RNA | Genes involved in Metabolism of non-coding RNA |
| 0.3 | 5.5 | REACTOME_METABOLISM_OF_POLYAMINES | Genes involved in Metabolism of polyamines |
| 0.3 | 3.3 | REACTOME_REMOVAL_OF_THE_FLAP_INTERMEDIATE_FROM_THE_C_STRAND | Genes involved in Removal of the Flap Intermediate from the C-strand |
| 0.3 | 5.2 | REACTOME_REGULATION_OF_INSULIN_LIKE_GROWTH_FACTOR_IGF_ACTIVITY_BY_INSULIN_LIKE_GROWTH_FACTOR_BINDING_PROTEINS_IGFBPS | Genes involved in Regulation of Insulin-like Growth Factor (IGF) Activity by Insulin-like Growth Factor Binding Proteins (IGFBPs) |
| 0.3 | 0.3 | REACTOME_CYCLIN_E_ASSOCIATED_EVENTS_DURING_G1_S_TRANSITION_ | Genes involved in Cyclin E associated events during G1/S transition |
| 0.3 | 6.1 | REACTOME_CITRIC_ACID_CYCLE_TCA_CYCLE | Genes involved in Citric acid cycle (TCA cycle) |
| 0.3 | 10.2 | REACTOME_MRNA_SPLICING_MINOR_PATHWAY | Genes involved in mRNA Splicing - Minor Pathway |
| 0.3 | 3.2 | REACTOME_SYNTHESIS_SECRETION_AND_DEACYLATION_OF_GHRELIN | Genes involved in Synthesis, Secretion, and Deacylation of Ghrelin |
| 0.3 | 8.9 | REACTOME_SIGNALING_BY_HIPPO | Genes involved in Signaling by Hippo |
| 0.3 | 5.0 | REACTOME_APOPTOSIS_INDUCED_DNA_FRAGMENTATION | Genes involved in Apoptosis induced DNA fragmentation |
| 0.3 | 6.9 | REACTOME_METABOLISM_OF_PORPHYRINS | Genes involved in Metabolism of porphyrins |
| 0.3 | 19.7 | REACTOME_NOTCH1_INTRACELLULAR_DOMAIN_REGULATES_TRANSCRIPTION | Genes involved in NOTCH1 Intracellular Domain Regulates Transcription |
| 0.3 | 3.9 | REACTOME_OXYGEN_DEPENDENT_PROLINE_HYDROXYLATION_OF_HYPOXIA_INDUCIBLE_FACTOR_ALPHA | Genes involved in Oxygen-dependent Proline Hydroxylation of Hypoxia-inducible Factor Alpha |
| 0.3 | 8.0 | REACTOME_RNA_POL_II_TRANSCRIPTION_PRE_INITIATION_AND_PROMOTER_OPENING | Genes involved in RNA Polymerase II Transcription Pre-Initiation And Promoter Opening |
| 0.3 | 9.5 | REACTOME_GLUCONEOGENESIS | Genes involved in Gluconeogenesis |
| 0.3 | 5.1 | REACTOME_P38MAPK_EVENTS | Genes involved in p38MAPK events |
| 0.3 | 14.2 | REACTOME_TRANSLATION | Genes involved in Translation |
| 0.3 | 0.6 | REACTOME_CROSS_PRESENTATION_OF_SOLUBLE_EXOGENOUS_ANTIGENS_ENDOSOMES | Genes involved in Cross-presentation of soluble exogenous antigens (endosomes) |
| 0.3 | 2.2 | REACTOME_APOBEC3G_MEDIATED_RESISTANCE_TO_HIV1_INFECTION | Genes involved in APOBEC3G mediated resistance to HIV-1 infection |
| 0.3 | 6.3 | REACTOME_HORMONE_SENSITIVE_LIPASE_HSL_MEDIATED_TRIACYLGLYCEROL_HYDROLYSIS | Genes involved in Hormone-sensitive lipase (HSL)-mediated triacylglycerol hydrolysis |
| 0.3 | 3.3 | REACTOME_G0_AND_EARLY_G1 | Genes involved in G0 and Early G1 |
| 0.3 | 4.5 | REACTOME_CONVERSION_FROM_APC_C_CDC20_TO_APC_C_CDH1_IN_LATE_ANAPHASE | Genes involved in Conversion from APC/C:Cdc20 to APC/C:Cdh1 in late anaphase |
| 0.2 | 3.7 | REACTOME_ZINC_TRANSPORTERS | Genes involved in Zinc transporters |
| 0.2 | 4.6 | REACTOME_EXTENSION_OF_TELOMERES | Genes involved in Extension of Telomeres |
| 0.2 | 1.8 | REACTOME_CYCLIN_A_B1_ASSOCIATED_EVENTS_DURING_G2_M_TRANSITION | Genes involved in Cyclin A/B1 associated events during G2/M transition |
| 0.2 | 20.8 | REACTOME_MRNA_SPLICING | Genes involved in mRNA Splicing |
| 0.2 | 1.8 | REACTOME_TRANSPORT_OF_ORGANIC_ANIONS | Genes involved in Transport of organic anions |
| 0.2 | 4.9 | REACTOME_SIGNALING_BY_BMP | Genes involved in Signaling by BMP |
| 0.2 | 1.7 | REACTOME_HYALURONAN_UPTAKE_AND_DEGRADATION | Genes involved in Hyaluronan uptake and degradation |
| 0.2 | 3.9 | REACTOME_PYRUVATE_METABOLISM | Genes involved in Pyruvate metabolism |
| 0.2 | 1.5 | REACTOME_CDC6_ASSOCIATION_WITH_THE_ORC_ORIGIN_COMPLEX | Genes involved in CDC6 association with the ORC:origin complex |
| 0.2 | 10.5 | REACTOME_LATE_PHASE_OF_HIV_LIFE_CYCLE | Genes involved in Late Phase of HIV Life Cycle |
| 0.2 | 3.4 | REACTOME_RNA_POL_I_TRANSCRIPTION_INITIATION | Genes involved in RNA Polymerase I Transcription Initiation |
| 0.2 | 15.9 | REACTOME_MITOTIC_PROMETAPHASE | Genes involved in Mitotic Prometaphase |
| 0.2 | 9.0 | REACTOME_ACTIVATION_OF_CHAPERONE_GENES_BY_XBP1S | Genes involved in Activation of Chaperone Genes by XBP1(S) |
| 0.2 | 0.7 | REACTOME_G_BETA_GAMMA_SIGNALLING_THROUGH_PI3KGAMMA | Genes involved in G beta:gamma signalling through PI3Kgamma |
| 0.2 | 3.7 | REACTOME_IMMUNOREGULATORY_INTERACTIONS_BETWEEN_A_LYMPHOID_AND_A_NON_LYMPHOID_CELL | Genes involved in Immunoregulatory interactions between a Lymphoid and a non-Lymphoid cell |
| 0.2 | 1.5 | REACTOME_GLOBAL_GENOMIC_NER_GG_NER | Genes involved in Global Genomic NER (GG-NER) |
| 0.2 | 5.2 | REACTOME_TIGHT_JUNCTION_INTERACTIONS | Genes involved in Tight junction interactions |
| 0.2 | 3.4 | REACTOME_AMINO_ACID_SYNTHESIS_AND_INTERCONVERSION_TRANSAMINATION | Genes involved in Amino acid synthesis and interconversion (transamination) |
| 0.2 | 4.4 | REACTOME_SYNTHESIS_OF_VERY_LONG_CHAIN_FATTY_ACYL_COAS | Genes involved in Synthesis of very long-chain fatty acyl-CoAs |
| 0.2 | 8.0 | REACTOME_DIABETES_PATHWAYS | Genes involved in Diabetes pathways |
| 0.2 | 1.6 | REACTOME_COPI_MEDIATED_TRANSPORT | Genes involved in COPI Mediated Transport |
| 0.2 | 2.2 | REACTOME_RNA_POL_I_PROMOTER_OPENING | Genes involved in RNA Polymerase I Promoter Opening |
| 0.2 | 0.8 | REACTOME_SIGNALING_BY_WNT | Genes involved in Signaling by Wnt |
| 0.2 | 2.0 | REACTOME_RNA_POL_III_CHAIN_ELONGATION | Genes involved in RNA Polymerase III Chain Elongation |
| 0.2 | 1.8 | REACTOME_PREFOLDIN_MEDIATED_TRANSFER_OF_SUBSTRATE_TO_CCT_TRIC | Genes involved in Prefoldin mediated transfer of substrate to CCT/TriC |
| 0.2 | 4.4 | REACTOME_BIOSYNTHESIS_OF_THE_N_GLYCAN_PRECURSOR_DOLICHOL_LIPID_LINKED_OLIGOSACCHARIDE_LLO_AND_TRANSFER_TO_A_NASCENT_PROTEIN | Genes involved in Biosynthesis of the N-glycan precursor (dolichol lipid-linked oligosaccharide, LLO) and transfer to a nascent protein |
| 0.1 | 6.1 | REACTOME_DEPOSITION_OF_NEW_CENPA_CONTAINING_NUCLEOSOMES_AT_THE_CENTROMERE | Genes involved in Deposition of New CENPA-containing Nucleosomes at the Centromere |
| 0.1 | 1.3 | REACTOME_INTRINSIC_PATHWAY | Genes involved in Intrinsic Pathway |
| 0.1 | 1.3 | REACTOME_INTEGRATION_OF_PROVIRUS | Genes involved in Integration of provirus |
| 0.1 | 1.2 | REACTOME_PLATELET_ADHESION_TO_EXPOSED_COLLAGEN | Genes involved in Platelet Adhesion to exposed collagen |
| 0.1 | 1.0 | REACTOME_INFLAMMASOMES | Genes involved in Inflammasomes |
| 0.1 | 3.6 | REACTOME_STRIATED_MUSCLE_CONTRACTION | Genes involved in Striated Muscle Contraction |
| 0.1 | 0.6 | REACTOME_REGULATION_OF_COMPLEMENT_CASCADE | Genes involved in Regulation of Complement cascade |
| 0.1 | 8.7 | REACTOME_GOLGI_ASSOCIATED_VESICLE_BIOGENESIS | Genes involved in Golgi Associated Vesicle Biogenesis |
| 0.1 | 3.4 | REACTOME_SYNTHESIS_OF_GLYCOSYLPHOSPHATIDYLINOSITOL_GPI | Genes involved in Synthesis of glycosylphosphatidylinositol (GPI) |
| 0.1 | 0.7 | REACTOME_ABACAVIR_TRANSPORT_AND_METABOLISM | Genes involved in Abacavir transport and metabolism |
| 0.1 | 10.6 | REACTOME_CLASS_B_2_SECRETIN_FAMILY_RECEPTORS | Genes involved in Class B/2 (Secretin family receptors) |
| 0.1 | 7.2 | REACTOME_COLLAGEN_FORMATION | Genes involved in Collagen formation |
| 0.1 | 4.5 | REACTOME_AMINO_ACID_TRANSPORT_ACROSS_THE_PLASMA_MEMBRANE | Genes involved in Amino acid transport across the plasma membrane |
| 0.1 | 3.7 | REACTOME_ASSOCIATION_OF_TRIC_CCT_WITH_TARGET_PROTEINS_DURING_BIOSYNTHESIS | Genes involved in Association of TriC/CCT with target proteins during biosynthesis |
| 0.1 | 1.9 | REACTOME_DNA_STRAND_ELONGATION | Genes involved in DNA strand elongation |
| 0.1 | 0.7 | REACTOME_TRANSCRIPTIONAL_ACTIVITY_OF_SMAD2_SMAD3_SMAD4_HETEROTRIMER | Genes involved in Transcriptional activity of SMAD2/SMAD3:SMAD4 heterotrimer |
| 0.1 | 0.9 | REACTOME_POST_TRANSLATIONAL_MODIFICATION_SYNTHESIS_OF_GPI_ANCHORED_PROTEINS | Genes involved in Post-translational modification: synthesis of GPI-anchored proteins |
| 0.1 | 1.1 | REACTOME_PRE_NOTCH_EXPRESSION_AND_PROCESSING | Genes involved in Pre-NOTCH Expression and Processing |
| 0.1 | 7.2 | REACTOME_RESPIRATORY_ELECTRON_TRANSPORT | Genes involved in Respiratory electron transport |
| 0.1 | 3.3 | REACTOME_REGULATION_OF_BETA_CELL_DEVELOPMENT | Genes involved in Regulation of beta-cell development |
| 0.1 | 6.4 | REACTOME_METABOLISM_OF_VITAMINS_AND_COFACTORS | Genes involved in Metabolism of vitamins and cofactors |
| 0.1 | 3.2 | REACTOME_ANTIVIRAL_MECHANISM_BY_IFN_STIMULATED_GENES | Genes involved in Antiviral mechanism by IFN-stimulated genes |
| 0.1 | 1.9 | REACTOME_SULFUR_AMINO_ACID_METABOLISM | Genes involved in Sulfur amino acid metabolism |
| 0.1 | 0.6 | REACTOME_ELEVATION_OF_CYTOSOLIC_CA2_LEVELS | Genes involved in Elevation of cytosolic Ca2+ levels |
| 0.1 | 21.5 | REACTOME_ANTIGEN_PROCESSING_UBIQUITINATION_PROTEASOME_DEGRADATION | Genes involved in Antigen processing: Ubiquitination & Proteasome degradation |
| 0.1 | 1.2 | REACTOME_AKT_PHOSPHORYLATES_TARGETS_IN_THE_CYTOSOL | Genes involved in AKT phosphorylates targets in the cytosol |
| 0.1 | 0.2 | REACTOME_INTEGRATION_OF_ENERGY_METABOLISM | Genes involved in Integration of energy metabolism |
| 0.1 | 1.7 | REACTOME_IONOTROPIC_ACTIVITY_OF_KAINATE_RECEPTORS | Genes involved in Ionotropic activity of Kainate Receptors |
| 0.1 | 0.6 | REACTOME_GRB2_SOS_PROVIDES_LINKAGE_TO_MAPK_SIGNALING_FOR_INTERGRINS_ | Genes involved in GRB2:SOS provides linkage to MAPK signaling for Intergrins |
| 0.1 | 3.5 | REACTOME_SIGNALING_BY_ROBO_RECEPTOR | Genes involved in Signaling by Robo receptor |
| 0.1 | 1.0 | REACTOME_REGULATION_OF_APOPTOSIS | Genes involved in Regulation of Apoptosis |
| 0.1 | 1.5 | REACTOME_RIP_MEDIATED_NFKB_ACTIVATION_VIA_DAI | Genes involved in RIP-mediated NFkB activation via DAI |
| 0.1 | 2.0 | REACTOME_CHOLESTEROL_BIOSYNTHESIS | Genes involved in Cholesterol biosynthesis |
| 0.1 | 0.9 | REACTOME_SYNTHESIS_OF_BILE_ACIDS_AND_BILE_SALTS_VIA_7ALPHA_HYDROXYCHOLESTEROL | Genes involved in Synthesis of bile acids and bile salts via 7alpha-hydroxycholesterol |
| 0.1 | 2.2 | REACTOME_SIGNALING_BY_NOTCH | Genes involved in Signaling by NOTCH |
| 0.1 | 0.7 | REACTOME_ACTIVATION_OF_ATR_IN_RESPONSE_TO_REPLICATION_STRESS | Genes involved in Activation of ATR in response to replication stress |
| 0.1 | 0.8 | REACTOME_ENOS_ACTIVATION_AND_REGULATION | Genes involved in eNOS activation and regulation |
| 0.1 | 0.1 | REACTOME_TRAF6_MEDIATED_IRF7_ACTIVATION_IN_TLR7_8_OR_9_SIGNALING | Genes involved in TRAF6 mediated IRF7 activation in TLR7/8 or 9 signaling |
| 0.1 | 1.4 | REACTOME_KINESINS | Genes involved in Kinesins |
| 0.1 | 0.4 | REACTOME_PROCESSING_OF_CAPPED_INTRON_CONTAINING_PRE_MRNA | Genes involved in Processing of Capped Intron-Containing Pre-mRNA |
| 0.1 | 0.4 | REACTOME_PYRUVATE_METABOLISM_AND_CITRIC_ACID_TCA_CYCLE | Genes involved in Pyruvate metabolism and Citric Acid (TCA) cycle |
| 0.1 | 0.4 | REACTOME_ACTIVATED_TAK1_MEDIATES_P38_MAPK_ACTIVATION | Genes involved in activated TAK1 mediates p38 MAPK activation |
| 0.0 | 2.0 | REACTOME_SPHINGOLIPID_DE_NOVO_BIOSYNTHESIS | Genes involved in Sphingolipid de novo biosynthesis |
| 0.0 | 0.6 | REACTOME_PIP3_ACTIVATES_AKT_SIGNALING | Genes involved in PIP3 activates AKT signaling |
| 0.0 | 0.8 | REACTOME_SIGNALING_BY_FGFR1_FUSION_MUTANTS | Genes involved in Signaling by FGFR1 fusion mutants |
| 0.0 | 2.0 | REACTOME_CELL_SURFACE_INTERACTIONS_AT_THE_VASCULAR_WALL | Genes involved in Cell surface interactions at the vascular wall |
| 0.0 | 0.9 | REACTOME_CHEMOKINE_RECEPTORS_BIND_CHEMOKINES | Genes involved in Chemokine receptors bind chemokines |
| 0.0 | 2.3 | REACTOME_TRANSCRIPTIONAL_REGULATION_OF_WHITE_ADIPOCYTE_DIFFERENTIATION | Genes involved in Transcriptional Regulation of White Adipocyte Differentiation |
| 0.0 | 1.1 | REACTOME_ABC_FAMILY_PROTEINS_MEDIATED_TRANSPORT | Genes involved in ABC-family proteins mediated transport |
| 0.0 | 0.8 | REACTOME_CGMP_EFFECTS | Genes involved in cGMP effects |
| 0.0 | 0.6 | REACTOME_NEGATIVE_REGULATORS_OF_RIG_I_MDA5_SIGNALING | Genes involved in Negative regulators of RIG-I/MDA5 signaling |
| 0.0 | 0.4 | REACTOME_STEROID_HORMONES | Genes involved in Steroid hormones |
| 0.0 | 0.4 | REACTOME_DCC_MEDIATED_ATTRACTIVE_SIGNALING | Genes involved in DCC mediated attractive signaling |
| 0.0 | 0.3 | REACTOME_VEGF_LIGAND_RECEPTOR_INTERACTIONS | Genes involved in VEGF ligand-receptor interactions |
| 0.0 | 0.6 | REACTOME_INTRINSIC_PATHWAY_FOR_APOPTOSIS | Genes involved in Intrinsic Pathway for Apoptosis |
| 0.0 | 0.2 | REACTOME_ACYL_CHAIN_REMODELLING_OF_PC | Genes involved in Acyl chain remodelling of PC |
| 0.0 | 0.4 | REACTOME_KERATAN_SULFATE_BIOSYNTHESIS | Genes involved in Keratan sulfate biosynthesis |
| 0.0 | 0.2 | REACTOME_CALNEXIN_CALRETICULIN_CYCLE | Genes involved in Calnexin/calreticulin cycle |
| 0.0 | 0.4 | REACTOME_GLYCOSPHINGOLIPID_METABOLISM | Genes involved in Glycosphingolipid metabolism |
| 0.0 | 0.3 | REACTOME_TGF_BETA_RECEPTOR_SIGNALING_ACTIVATES_SMADS | Genes involved in TGF-beta receptor signaling activates SMADs |
| 0.0 | 0.1 | REACTOME_GLUTAMATE_NEUROTRANSMITTER_RELEASE_CYCLE | Genes involved in Glutamate Neurotransmitter Release Cycle |
| 0.0 | 0.3 | REACTOME_GLYCOGEN_BREAKDOWN_GLYCOGENOLYSIS | Genes involved in Glycogen breakdown (glycogenolysis) |
| 0.0 | 0.2 | REACTOME_PPARA_ACTIVATES_GENE_EXPRESSION | Genes involved in PPARA Activates Gene Expression |
| 0.0 | 0.1 | REACTOME_TRAFFICKING_AND_PROCESSING_OF_ENDOSOMAL_TLR | Genes involved in Trafficking and processing of endosomal TLR |
| 0.0 | 0.1 | REACTOME_EXTRACELLULAR_MATRIX_ORGANIZATION | Genes involved in Extracellular matrix organization |
| 0.0 | 0.5 | REACTOME_O_LINKED_GLYCOSYLATION_OF_MUCINS | Genes involved in O-linked glycosylation of mucins |
| 0.0 | 0.2 | REACTOME_TRAFFICKING_OF_GLUR2_CONTAINING_AMPA_RECEPTORS | Genes involved in Trafficking of GluR2-containing AMPA receptors |
| 0.0 | 0.6 | REACTOME_LOSS_OF_NLP_FROM_MITOTIC_CENTROSOMES | Genes involved in Loss of Nlp from mitotic centrosomes |
| 0.0 | 0.1 | REACTOME_NEF_MEDIATES_DOWN_MODULATION_OF_CELL_SURFACE_RECEPTORS_BY_RECRUITING_THEM_TO_CLATHRIN_ADAPTERS | Genes involved in Nef-mediates down modulation of cell surface receptors by recruiting them to clathrin adapters |
|
|
|
|