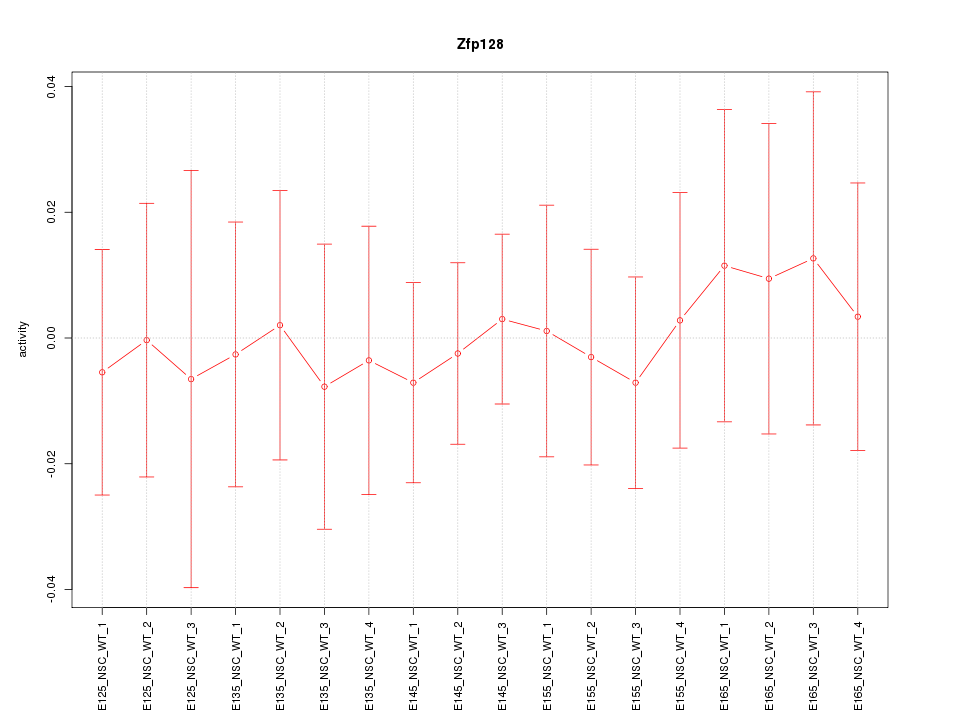
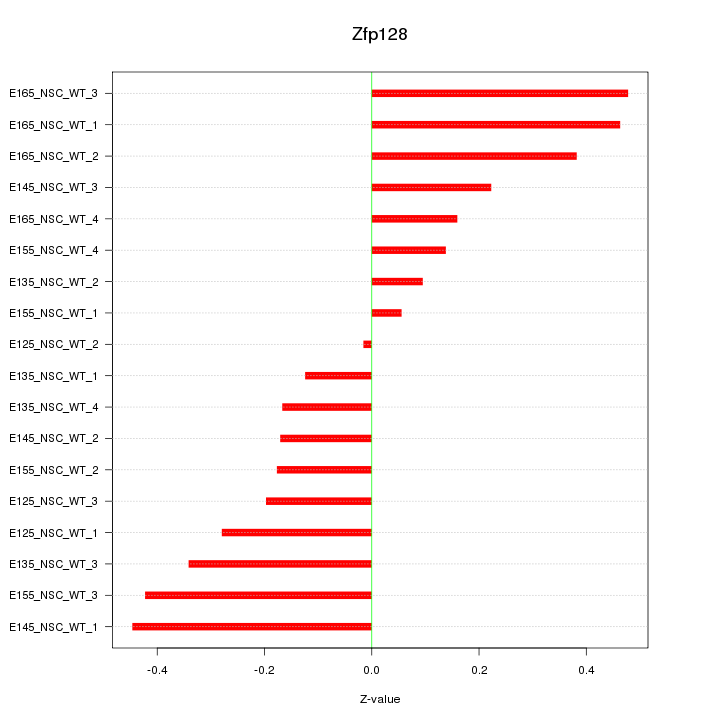
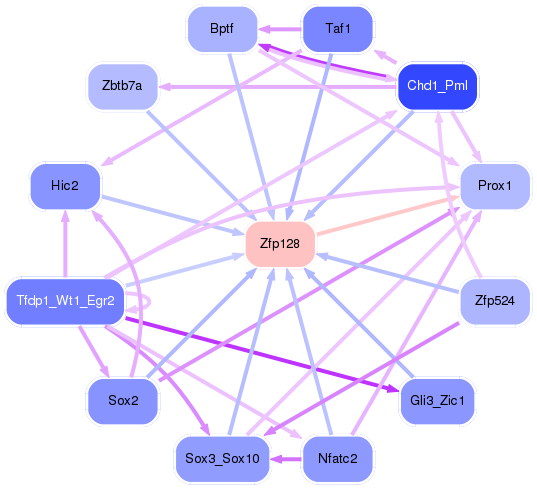
Motif ID: Zfp128
Z-value: 0.280

Transcription factors associated with Zfp128:
| Gene Symbol | Entrez ID | Gene Name |
|---|---|---|
| Zfp128 | ENSMUSG00000060397.6 | Zfp128 |
Activity-expression correlation:
| Gene Symbol | Promoter | Pearson corr. coef. | P-value | Plot |
|---|---|---|---|---|
| Zfp128 | mm10_v2_chr7_+_12881165_12881204 | 0.60 | 9.2e-03 | Click! |

Top targets:
Gene overrepresentation in biological_process category:
| Log-likelihood per target | Total log-likelihood | Term | Description |
|---|---|---|---|
| 0.3 | 0.8 | GO:0043379 | memory T cell differentiation(GO:0043379) |
| 0.1 | 0.5 | GO:0060437 | negative regulation of neurotrophin TRK receptor signaling pathway(GO:0051387) lung growth(GO:0060437) |
| 0.1 | 0.3 | GO:0060478 | acrosomal vesicle exocytosis(GO:0060478) |
| 0.1 | 0.5 | GO:0005513 | detection of calcium ion(GO:0005513) |
| 0.0 | 0.1 | GO:1900126 | negative regulation of hyaluronan biosynthetic process(GO:1900126) |
| 0.0 | 0.2 | GO:1903546 | negative regulation of appetite by leptin-mediated signaling pathway(GO:0038108) protein localization to photoreceptor outer segment(GO:1903546) |
| 0.0 | 0.2 | GO:0048597 | post-embryonic camera-type eye morphogenesis(GO:0048597) |
| 0.0 | 0.1 | GO:0006659 | phosphatidylserine biosynthetic process(GO:0006659) |
| 0.0 | 0.4 | GO:0048672 | positive regulation of collateral sprouting(GO:0048672) |
| 0.0 | 0.1 | GO:0090425 | hepatocyte cell migration(GO:0002194) branching involved in pancreas morphogenesis(GO:0061114) acinar cell differentiation(GO:0090425) positive regulation of forebrain neuron differentiation(GO:2000979) |
| 0.0 | 0.2 | GO:0033314 | mitotic DNA replication checkpoint(GO:0033314) |
| 0.0 | 0.5 | GO:0060259 | regulation of feeding behavior(GO:0060259) |
| 0.0 | 0.2 | GO:0002098 | tRNA wobble uridine modification(GO:0002098) |
| 0.0 | 0.0 | GO:1904245 | regulation of polynucleotide adenylyltransferase activity(GO:1904245) |
Gene overrepresentation in cellular_component category:
| Log-likelihood per target | Total log-likelihood | Term | Description |
|---|---|---|---|
| 0.0 | 0.6 | GO:0031462 | Cul2-RING ubiquitin ligase complex(GO:0031462) |
| 0.0 | 0.5 | GO:0031045 | dense core granule(GO:0031045) |
| 0.0 | 0.4 | GO:0002080 | acrosomal membrane(GO:0002080) |
| 0.0 | 0.2 | GO:0034464 | BBSome(GO:0034464) |
Gene overrepresentation in molecular_function category:
| Log-likelihood per target | Total log-likelihood | Term | Description |
|---|---|---|---|
| 0.1 | 0.5 | GO:0030348 | syntaxin-3 binding(GO:0030348) |
| 0.1 | 0.4 | GO:0019841 | retinol binding(GO:0019841) |
| 0.1 | 0.4 | GO:0070915 | lysophosphatidic acid receptor activity(GO:0070915) |
| 0.0 | 0.8 | GO:0001848 | complement binding(GO:0001848) |
| 0.0 | 0.2 | GO:0010997 | anaphase-promoting complex binding(GO:0010997) |
| 0.0 | 0.2 | GO:0042030 | ATPase inhibitor activity(GO:0042030) |
| 0.0 | 0.2 | GO:0005021 | vascular endothelial growth factor-activated receptor activity(GO:0005021) |
| 0.0 | 0.2 | GO:0016300 | tRNA (uracil) methyltransferase activity(GO:0016300) |
| 0.0 | 0.2 | GO:0034452 | dynactin binding(GO:0034452) |
| 0.0 | 0.5 | GO:0043539 | protein serine/threonine kinase activator activity(GO:0043539) |
Gene overrepresentation in C2:CP category:
| Log-likelihood per target | Total log-likelihood | Term | Description |
|---|---|---|---|
| 0.0 | 0.2 | PID_VEGF_VEGFR_PATHWAY | VEGF and VEGFR signaling network |
Gene overrepresentation in C2:CP:REACTOME category:
| Log-likelihood per target | Total log-likelihood | Term | Description |
|---|---|---|---|
| 0.2 | 0.8 | REACTOME_REGULATION_OF_COMPLEMENT_CASCADE | Genes involved in Regulation of Complement cascade |
| 0.1 | 0.5 | REACTOME_ACETYLCHOLINE_NEUROTRANSMITTER_RELEASE_CYCLE | Genes involved in Acetylcholine Neurotransmitter Release Cycle |
| 0.0 | 0.5 | REACTOME_SPRY_REGULATION_OF_FGF_SIGNALING | Genes involved in Spry regulation of FGF signaling |
| 0.0 | 0.2 | REACTOME_VEGF_LIGAND_RECEPTOR_INTERACTIONS | Genes involved in VEGF ligand-receptor interactions |