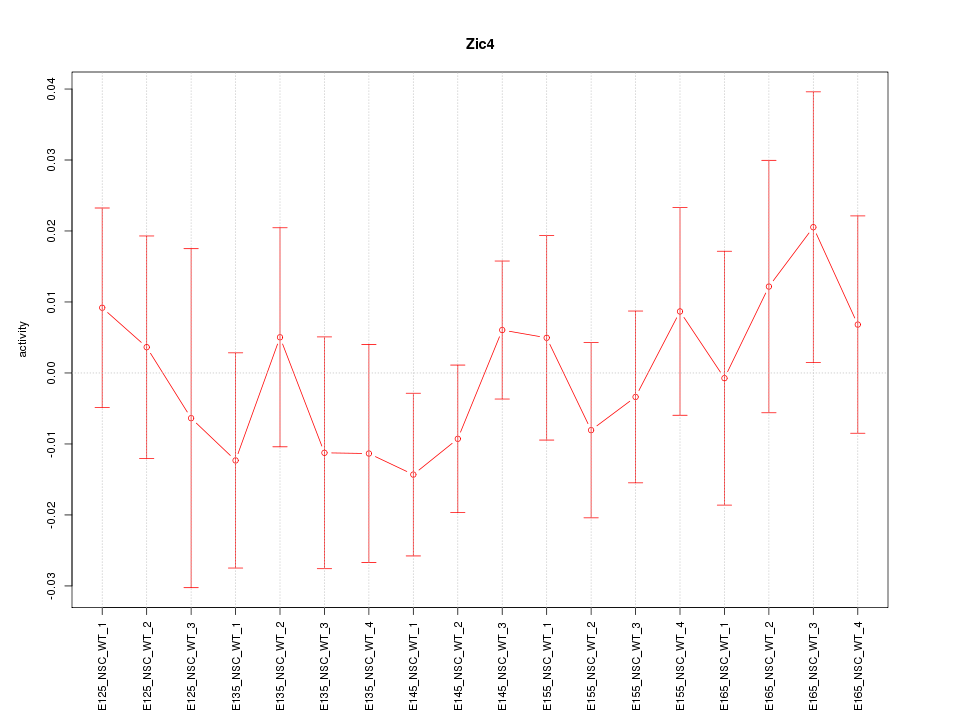
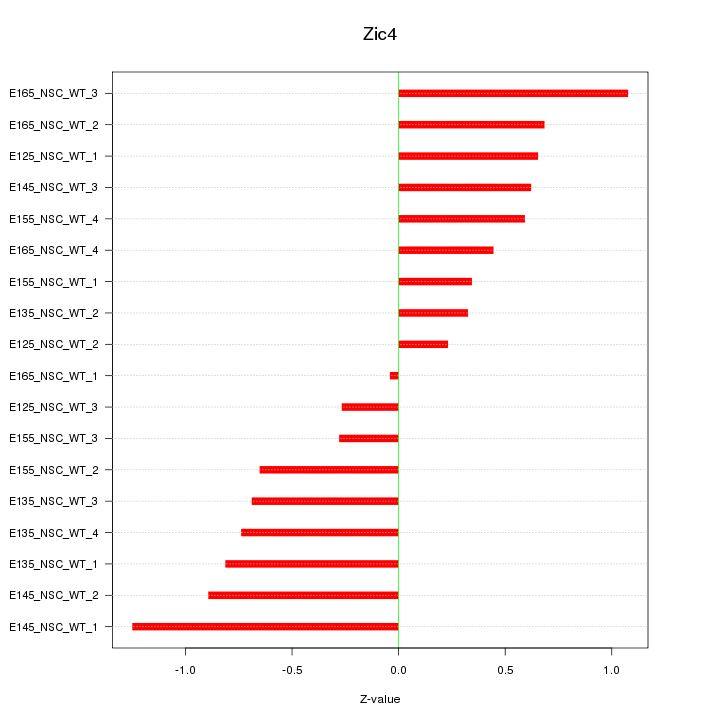
Motif ID: Zic4
Z-value: 0.662

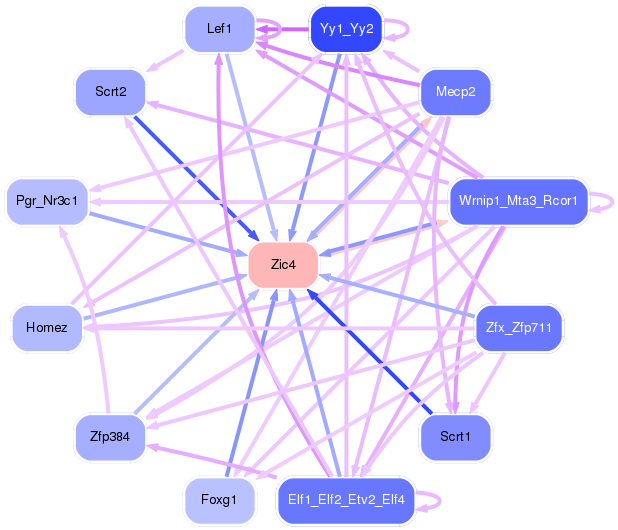
Transcription factors associated with Zic4:
| Gene Symbol | Entrez ID | Gene Name |
|---|---|---|
| Zic4 | ENSMUSG00000036972.8 | Zic4 |
Activity-expression correlation:
| Gene Symbol | Promoter | Pearson corr. coef. | P-value | Plot |
|---|---|---|---|---|
| Zic4 | mm10_v2_chr9_+_91368970_91369073 | -0.40 | 1.0e-01 | Click! |

Top targets:
Gene overrepresentation in biological_process category:
| Log-likelihood per target | Total log-likelihood | Term | Description |
|---|---|---|---|
| 0.5 | 2.1 | GO:0090238 | positive regulation of arachidonic acid secretion(GO:0090238) |
| 0.5 | 3.3 | GO:0035093 | spermatogenesis, exchange of chromosomal proteins(GO:0035093) |
| 0.4 | 1.4 | GO:0014012 | peripheral nervous system axon regeneration(GO:0014012) |
| 0.3 | 1.0 | GO:0030827 | negative regulation of cGMP metabolic process(GO:0030824) negative regulation of cGMP biosynthetic process(GO:0030827) negative regulation of guanylate cyclase activity(GO:0031283) |
| 0.3 | 1.0 | GO:0017055 | negative regulation of RNA polymerase II transcriptional preinitiation complex assembly(GO:0017055) |
| 0.3 | 1.5 | GO:2001025 | positive regulation of response to drug(GO:2001025) |
| 0.3 | 0.8 | GO:0021577 | hindbrain structural organization(GO:0021577) cerebellum structural organization(GO:0021589) |
| 0.2 | 2.2 | GO:0015721 | bile acid and bile salt transport(GO:0015721) |
| 0.1 | 0.7 | GO:1990034 | calcium ion export from cell(GO:1990034) |
| 0.1 | 0.4 | GO:0060854 | patterning of lymph vessels(GO:0060854) |
| 0.1 | 0.8 | GO:0032811 | negative regulation of gamma-aminobutyric acid secretion(GO:0014053) negative regulation of epinephrine secretion(GO:0032811) |
| 0.1 | 0.3 | GO:1900226 | negative regulation of NLRP3 inflammasome complex assembly(GO:1900226) |
| 0.1 | 0.3 | GO:0018199 | peptidyl-glutamine modification(GO:0018199) |
| 0.1 | 0.3 | GO:1901608 | dense core granule localization(GO:0032253) cellular response to isoquinoline alkaloid(GO:0071317) regulation of vesicle transport along microtubule(GO:1901608) dense core granule transport(GO:1901950) regulation of dense core granule transport(GO:1904809) positive regulation of dense core granule transport(GO:1904811) |
| 0.1 | 1.0 | GO:0060347 | heart trabecula formation(GO:0060347) |
| 0.1 | 0.5 | GO:1903347 | negative regulation of bicellular tight junction assembly(GO:1903347) |
| 0.1 | 0.5 | GO:0097491 | trigeminal nerve morphogenesis(GO:0021636) trigeminal nerve structural organization(GO:0021637) trunk segmentation(GO:0035290) trunk neural crest cell migration(GO:0036484) ventral trunk neural crest cell migration(GO:0036486) sympathetic neuron projection extension(GO:0097490) sympathetic neuron projection guidance(GO:0097491) semaphorin-plexin signaling pathway involved in axon guidance(GO:1902287) |
| 0.1 | 0.4 | GO:0002457 | T cell antigen processing and presentation(GO:0002457) |
| 0.1 | 0.5 | GO:0051388 | positive regulation of neurotrophin TRK receptor signaling pathway(GO:0051388) |
| 0.1 | 0.4 | GO:0097473 | cellular response to light intensity(GO:0071484) cellular response to high light intensity(GO:0071486) retinal rod cell apoptotic process(GO:0097473) |
| 0.1 | 0.3 | GO:0055071 | cellular manganese ion homeostasis(GO:0030026) Golgi calcium ion homeostasis(GO:0032468) manganese ion homeostasis(GO:0055071) |
| 0.1 | 0.2 | GO:0008582 | regulation of synaptic growth at neuromuscular junction(GO:0008582) regulation of sodium:potassium-exchanging ATPase activity(GO:1903406) |
| 0.1 | 0.2 | GO:0010700 | negative regulation of norepinephrine secretion(GO:0010700) |
| 0.1 | 0.5 | GO:0090074 | negative regulation of protein homodimerization activity(GO:0090074) |
| 0.1 | 0.1 | GO:0042939 | glutathione transport(GO:0034635) tripeptide transport(GO:0042939) |
| 0.1 | 0.2 | GO:1902938 | regulation of intracellular calcium activated chloride channel activity(GO:1902938) |
| 0.1 | 0.4 | GO:0051045 | negative regulation of membrane protein ectodomain proteolysis(GO:0051045) |
| 0.1 | 1.2 | GO:0045598 | regulation of fat cell differentiation(GO:0045598) |
| 0.1 | 0.2 | GO:0097274 | urea homeostasis(GO:0097274) |
| 0.1 | 0.2 | GO:0036091 | positive regulation of transcription from RNA polymerase II promoter in response to oxidative stress(GO:0036091) |
| 0.1 | 0.4 | GO:0007296 | vitellogenesis(GO:0007296) |
| 0.1 | 0.2 | GO:0009957 | epidermal cell fate specification(GO:0009957) |
| 0.1 | 0.2 | GO:1901642 | purine nucleoside transmembrane transport(GO:0015860) nucleoside transmembrane transport(GO:1901642) |
| 0.0 | 0.2 | GO:1901678 | iron coordination entity transport(GO:1901678) |
| 0.0 | 0.1 | GO:0006550 | isoleucine catabolic process(GO:0006550) |
| 0.0 | 0.2 | GO:0021914 | negative regulation of smoothened signaling pathway involved in ventral spinal cord patterning(GO:0021914) |
| 0.0 | 1.1 | GO:0032757 | positive regulation of interleukin-8 production(GO:0032757) |
| 0.0 | 0.8 | GO:0042711 | maternal behavior(GO:0042711) |
| 0.0 | 0.2 | GO:0016584 | nucleosome positioning(GO:0016584) |
| 0.0 | 0.1 | GO:0009838 | abscission(GO:0009838) positive regulation of viral budding via host ESCRT complex(GO:1903774) |
| 0.0 | 0.2 | GO:0035826 | rubidium ion transport(GO:0035826) cellular hypotonic response(GO:0071476) |
| 0.0 | 0.3 | GO:0031424 | keratinization(GO:0031424) |
| 0.0 | 0.2 | GO:0090336 | positive regulation of brown fat cell differentiation(GO:0090336) |
| 0.0 | 1.7 | GO:0048713 | regulation of oligodendrocyte differentiation(GO:0048713) |
| 0.0 | 0.2 | GO:0097646 | calcitonin family receptor signaling pathway(GO:0097646) amylin receptor signaling pathway(GO:0097647) |
| 0.0 | 0.6 | GO:1903861 | positive regulation of dendrite extension(GO:1903861) |
| 0.0 | 0.1 | GO:0007197 | adenylate cyclase-inhibiting G-protein coupled acetylcholine receptor signaling pathway(GO:0007197) phospholipase C-activating G-protein coupled acetylcholine receptor signaling pathway(GO:0007207) |
| 0.0 | 0.2 | GO:1904923 | regulation of mitophagy in response to mitochondrial depolarization(GO:1904923) |
| 0.0 | 0.7 | GO:0032467 | positive regulation of cytokinesis(GO:0032467) |
| 0.0 | 0.1 | GO:0072344 | rescue of stalled ribosome(GO:0072344) |
| 0.0 | 0.5 | GO:0046856 | phosphatidylinositol dephosphorylation(GO:0046856) |
| 0.0 | 0.5 | GO:0014898 | muscle hypertrophy in response to stress(GO:0003299) cardiac muscle hypertrophy in response to stress(GO:0014898) |
| 0.0 | 0.1 | GO:0015862 | uridine transport(GO:0015862) |
| 0.0 | 0.2 | GO:0071578 | zinc II ion transmembrane import(GO:0071578) |
| 0.0 | 0.1 | GO:0045085 | negative regulation of interleukin-2 biosynthetic process(GO:0045085) |
| 0.0 | 0.2 | GO:0048563 | post-embryonic organ morphogenesis(GO:0048563) |
| 0.0 | 0.0 | GO:0021759 | globus pallidus development(GO:0021759) |
| 0.0 | 0.1 | GO:0016127 | cholesterol catabolic process(GO:0006707) sterol catabolic process(GO:0016127) |
| 0.0 | 0.5 | GO:1900452 | regulation of long term synaptic depression(GO:1900452) |
| 0.0 | 0.5 | GO:0071480 | cellular response to gamma radiation(GO:0071480) |
| 0.0 | 0.1 | GO:2000766 | negative regulation of translational elongation(GO:0045900) negative regulation of cytoplasmic translation(GO:2000766) |
| 0.0 | 0.3 | GO:0007214 | gamma-aminobutyric acid signaling pathway(GO:0007214) |
| 0.0 | 0.7 | GO:0015914 | phospholipid transport(GO:0015914) |
| 0.0 | 0.2 | GO:0000083 | regulation of transcription involved in G1/S transition of mitotic cell cycle(GO:0000083) |
| 0.0 | 0.1 | GO:0090286 | cytoskeletal anchoring at nuclear membrane(GO:0090286) |
| 0.0 | 0.1 | GO:0043252 | sodium-independent organic anion transport(GO:0043252) |
| 0.0 | 0.0 | GO:1900738 | positive regulation of phospholipase C-activating G-protein coupled receptor signaling pathway(GO:1900738) |
| 0.0 | 0.2 | GO:0008272 | sulfate transport(GO:0008272) |
| 0.0 | 0.4 | GO:0006509 | membrane protein ectodomain proteolysis(GO:0006509) |
| 0.0 | 1.2 | GO:0008584 | male gonad development(GO:0008584) development of primary male sexual characteristics(GO:0046546) |
Gene overrepresentation in cellular_component category:
| Log-likelihood per target | Total log-likelihood | Term | Description |
|---|---|---|---|
| 0.5 | 2.1 | GO:0032280 | symmetric synapse(GO:0032280) |
| 0.2 | 0.7 | GO:0005594 | collagen type IX trimer(GO:0005594) |
| 0.2 | 0.8 | GO:0038039 | G-protein coupled receptor heterodimeric complex(GO:0038039) |
| 0.1 | 2.6 | GO:0016581 | NuRD complex(GO:0016581) CHD-type complex(GO:0090545) |
| 0.1 | 1.0 | GO:0044327 | dendritic spine head(GO:0044327) |
| 0.1 | 1.5 | GO:1990635 | proximal dendrite(GO:1990635) |
| 0.1 | 1.4 | GO:0005614 | interstitial matrix(GO:0005614) |
| 0.1 | 0.3 | GO:0033010 | paranodal junction(GO:0033010) |
| 0.0 | 0.4 | GO:0031315 | extrinsic component of mitochondrial outer membrane(GO:0031315) |
| 0.0 | 0.2 | GO:0031084 | BLOC-2 complex(GO:0031084) |
| 0.0 | 0.2 | GO:1903440 | calcitonin family receptor complex(GO:1903439) amylin receptor complex(GO:1903440) |
| 0.0 | 1.0 | GO:0031430 | M band(GO:0031430) |
| 0.0 | 0.2 | GO:0002139 | stereocilia coupling link(GO:0002139) |
| 0.0 | 0.4 | GO:0032593 | insulin-responsive compartment(GO:0032593) |
| 0.0 | 0.5 | GO:0000159 | protein phosphatase type 2A complex(GO:0000159) |
| 0.0 | 0.8 | GO:0046658 | anchored component of plasma membrane(GO:0046658) |
| 0.0 | 0.5 | GO:0031616 | spindle pole centrosome(GO:0031616) |
| 0.0 | 1.7 | GO:0031225 | anchored component of membrane(GO:0031225) |
| 0.0 | 0.2 | GO:0043083 | synaptic cleft(GO:0043083) |
| 0.0 | 0.2 | GO:0005952 | cAMP-dependent protein kinase complex(GO:0005952) |
| 0.0 | 0.2 | GO:0005662 | DNA replication factor A complex(GO:0005662) |
| 0.0 | 0.2 | GO:0005641 | nuclear envelope lumen(GO:0005641) |
| 0.0 | 0.2 | GO:0031010 | ISWI-type complex(GO:0031010) |
| 0.0 | 0.2 | GO:0031258 | lamellipodium membrane(GO:0031258) |
| 0.0 | 0.3 | GO:0000930 | gamma-tubulin complex(GO:0000930) |
| 0.0 | 0.2 | GO:0005665 | DNA-directed RNA polymerase II, core complex(GO:0005665) |
| 0.0 | 0.2 | GO:0035631 | CD40 receptor complex(GO:0035631) |
| 0.0 | 0.1 | GO:0090543 | ESCRT III complex(GO:0000815) Flemming body(GO:0090543) |
Gene overrepresentation in molecular_function category:
| Log-likelihood per target | Total log-likelihood | Term | Description |
|---|---|---|---|
| 0.8 | 3.3 | GO:0061628 | H3K27me3 modified histone binding(GO:0061628) |
| 0.5 | 2.2 | GO:0015349 | thyroid hormone transmembrane transporter activity(GO:0015349) |
| 0.3 | 1.0 | GO:0002153 | steroid receptor RNA activator RNA binding(GO:0002153) |
| 0.3 | 0.9 | GO:0008113 | peptide-methionine (S)-S-oxide reductase activity(GO:0008113) |
| 0.3 | 1.7 | GO:0045545 | syndecan binding(GO:0045545) |
| 0.1 | 0.8 | GO:0004965 | G-protein coupled GABA receptor activity(GO:0004965) |
| 0.1 | 0.4 | GO:0001225 | RNA polymerase II transcription coactivator binding(GO:0001225) |
| 0.1 | 2.1 | GO:0008188 | neuropeptide receptor activity(GO:0008188) |
| 0.1 | 1.1 | GO:0030296 | protein tyrosine kinase activator activity(GO:0030296) |
| 0.1 | 0.9 | GO:0008526 | phosphatidylinositol transporter activity(GO:0008526) |
| 0.1 | 0.3 | GO:0034739 | histone deacetylase activity (H4-K16 specific)(GO:0034739) tubulin deacetylase activity(GO:0042903) |
| 0.1 | 0.2 | GO:0005119 | smoothened binding(GO:0005119) hedgehog receptor activity(GO:0008158) |
| 0.1 | 0.5 | GO:0052629 | phosphatidylinositol-3,5-bisphosphate 3-phosphatase activity(GO:0052629) |
| 0.1 | 0.3 | GO:0015410 | manganese-transporting ATPase activity(GO:0015410) |
| 0.1 | 0.2 | GO:0031686 | A1 adenosine receptor binding(GO:0031686) |
| 0.1 | 0.8 | GO:0005388 | calcium-transporting ATPase activity(GO:0005388) |
| 0.1 | 0.2 | GO:0032422 | purine-rich negative regulatory element binding(GO:0032422) |
| 0.1 | 0.4 | GO:0032453 | histone demethylase activity (H3-K4 specific)(GO:0032453) |
| 0.1 | 0.3 | GO:0010385 | double-stranded methylated DNA binding(GO:0010385) |
| 0.0 | 0.2 | GO:1903135 | cupric ion binding(GO:1903135) |
| 0.0 | 0.5 | GO:0048273 | mitogen-activated protein kinase p38 binding(GO:0048273) |
| 0.0 | 2.1 | GO:0008138 | protein tyrosine/serine/threonine phosphatase activity(GO:0008138) |
| 0.0 | 0.1 | GO:0035673 | oligopeptide transmembrane transporter activity(GO:0035673) sphingolipid transporter activity(GO:0046624) |
| 0.0 | 0.5 | GO:0038191 | neuropilin binding(GO:0038191) |
| 0.0 | 1.5 | GO:0051019 | mitogen-activated protein kinase binding(GO:0051019) |
| 0.0 | 0.2 | GO:0097643 | amylin receptor activity(GO:0097643) |
| 0.0 | 0.2 | GO:0042030 | ATPase inhibitor activity(GO:0042030) |
| 0.0 | 0.1 | GO:0051765 | inositol tetrakisphosphate kinase activity(GO:0051765) |
| 0.0 | 0.4 | GO:0008191 | metalloendopeptidase inhibitor activity(GO:0008191) |
| 0.0 | 0.1 | GO:0016907 | G-protein coupled acetylcholine receptor activity(GO:0016907) |
| 0.0 | 0.3 | GO:0016755 | transferase activity, transferring amino-acyl groups(GO:0016755) |
| 0.0 | 0.1 | GO:0052654 | branched-chain-amino-acid transaminase activity(GO:0004084) L-leucine transaminase activity(GO:0052654) L-valine transaminase activity(GO:0052655) L-isoleucine transaminase activity(GO:0052656) |
| 0.0 | 0.4 | GO:0015211 | purine nucleoside transmembrane transporter activity(GO:0015211) |
| 0.0 | 0.2 | GO:0015379 | potassium:chloride symporter activity(GO:0015379) potassium ion symporter activity(GO:0022820) |
| 0.0 | 0.3 | GO:0004890 | GABA-A receptor activity(GO:0004890) |
| 0.0 | 0.7 | GO:0042169 | SH2 domain binding(GO:0042169) |
| 0.0 | 0.1 | GO:0015347 | sodium-independent organic anion transmembrane transporter activity(GO:0015347) |
| 0.0 | 0.2 | GO:0005251 | delayed rectifier potassium channel activity(GO:0005251) |
| 0.0 | 0.1 | GO:0005337 | nucleoside transmembrane transporter activity(GO:0005337) |
| 0.0 | 0.1 | GO:0003854 | 3-beta-hydroxy-delta5-steroid dehydrogenase activity(GO:0003854) |
Gene overrepresentation in C2:CP category:
| Log-likelihood per target | Total log-likelihood | Term | Description |
|---|---|---|---|
| 0.1 | 1.4 | PID_INTEGRIN_A9B1_PATHWAY | Alpha9 beta1 integrin signaling events |
| 0.0 | 1.3 | PID_HDAC_CLASSIII_PATHWAY | Signaling events mediated by HDAC Class III |
| 0.0 | 0.5 | PID_THROMBIN_PAR4_PATHWAY | PAR4-mediated thrombin signaling events |
| 0.0 | 1.0 | NABA_BASEMENT_MEMBRANES | Genes encoding structural components of basement membranes |
| 0.0 | 1.0 | PID_RXR_VDR_PATHWAY | RXR and RAR heterodimerization with other nuclear receptor |
| 0.0 | 0.4 | PID_SYNDECAN_3_PATHWAY | Syndecan-3-mediated signaling events |
| 0.0 | 0.9 | PID_ARF6_PATHWAY | Arf6 signaling events |
| 0.0 | 0.7 | PID_FRA_PATHWAY | Validated transcriptional targets of AP1 family members Fra1 and Fra2 |
| 0.0 | 0.8 | PID_LIS1_PATHWAY | Lissencephaly gene (LIS1) in neuronal migration and development |
| 0.0 | 0.5 | NABA_COLLAGENS | Genes encoding collagen proteins |
| 0.0 | 0.6 | PID_INSULIN_GLUCOSE_PATHWAY | Insulin-mediated glucose transport |
Gene overrepresentation in C2:CP:REACTOME category:
| Log-likelihood per target | Total log-likelihood | Term | Description |
|---|---|---|---|
| 0.3 | 2.2 | REACTOME_TRANSPORT_OF_ORGANIC_ANIONS | Genes involved in Transport of organic anions |
| 0.1 | 0.8 | REACTOME_CLASS_C_3_METABOTROPIC_GLUTAMATE_PHEROMONE_RECEPTORS | Genes involved in Class C/3 (Metabotropic glutamate/pheromone receptors) |
| 0.1 | 0.5 | REACTOME_IRAK2_MEDIATED_ACTIVATION_OF_TAK1_COMPLEX_UPON_TLR7_8_OR_9_STIMULATION | Genes involved in IRAK2 mediated activation of TAK1 complex upon TLR7/8 or 9 stimulation |
| 0.1 | 0.7 | REACTOME_PLATELET_CALCIUM_HOMEOSTASIS | Genes involved in Platelet calcium homeostasis |
| 0.0 | 0.5 | REACTOME_PLATELET_SENSITIZATION_BY_LDL | Genes involved in Platelet sensitization by LDL |
| 0.0 | 0.4 | REACTOME_NEGATIVE_REGULATION_OF_THE_PI3K_AKT_NETWORK | Genes involved in Negative regulation of the PI3K/AKT network |
| 0.0 | 0.6 | REACTOME_HS_GAG_DEGRADATION | Genes involved in HS-GAG degradation |
| 0.0 | 2.0 | REACTOME_PEPTIDE_LIGAND_BINDING_RECEPTORS | Genes involved in Peptide ligand-binding receptors |
| 0.0 | 0.2 | REACTOME_P2Y_RECEPTORS | Genes involved in P2Y receptors |
| 0.0 | 0.9 | REACTOME_VOLTAGE_GATED_POTASSIUM_CHANNELS | Genes involved in Voltage gated Potassium channels |
| 0.0 | 0.3 | REACTOME_GABA_A_RECEPTOR_ACTIVATION | Genes involved in GABA A receptor activation |
| 0.0 | 0.9 | REACTOME_NCAM1_INTERACTIONS | Genes involved in NCAM1 interactions |
| 0.0 | 1.2 | REACTOME_INTEGRIN_CELL_SURFACE_INTERACTIONS | Genes involved in Integrin cell surface interactions |
| 0.0 | 1.0 | REACTOME_NUCLEAR_RECEPTOR_TRANSCRIPTION_PATHWAY | Genes involved in Nuclear Receptor transcription pathway |
| 0.0 | 0.5 | REACTOME_SYNTHESIS_OF_PIPS_AT_THE_PLASMA_MEMBRANE | Genes involved in Synthesis of PIPs at the plasma membrane |
| 0.0 | 0.4 | REACTOME_SEMA4D_INDUCED_CELL_MIGRATION_AND_GROWTH_CONE_COLLAPSE | Genes involved in Sema4D induced cell migration and growth-cone collapse |