Project
GNF SymAtlas + NCI-60 cancer cell lines, comparison of cancers vs non-cancers, human (Su, 2004; Ross, 2000)
Navigation
Downloads
Results for AAGUGCU
Z-value: 0.53
Motif logo

miRNA associated with seed AAGUGCU
| Name | miRBASE accession |
|---|---|
|
hsa-miR-302a-3p
|
MIMAT0000684 |
|
hsa-miR-302b-3p
|
MIMAT0000715 |
|
hsa-miR-302c-3p.1
|
MIMAT0000717 |
|
hsa-miR-302d-3p
|
MIMAT0000718 |
|
hsa-miR-302e
|
MIMAT0005931 |
|
hsa-miR-372-3p
|
MIMAT0000724 |
|
hsa-miR-373-3p
|
MIMAT0000726 |
|
hsa-miR-520a-3p
|
MIMAT0002834 |
|
hsa-miR-520b
|
MIMAT0002843 |
|
hsa-miR-520c-3p
|
MIMAT0002846 |
|
hsa-miR-520d-3p
|
MIMAT0002856 |
|
hsa-miR-520e
|
MIMAT0002825 |
Activity profile of AAGUGCU motif
Sorted Z-values of AAGUGCU motif
| Promoter | Log-likelihood | Transcript | Gene | Gene Info |
|---|---|---|---|---|
| chr14_-_60097297 | 8.43 |
ENST00000395090.1
|
RTN1
|
reticulon 1 |
| chr12_-_45269430 | 7.84 |
ENST00000395487.2
|
NELL2
|
NEL-like 2 (chicken) |
| chr1_-_20812690 | 7.33 |
ENST00000375078.3
|
CAMK2N1
|
calcium/calmodulin-dependent protein kinase II inhibitor 1 |
| chr12_-_16761007 | 5.16 |
ENST00000354662.1
ENST00000441439.2 |
LMO3
|
LIM domain only 3 (rhombotin-like 2) |
| chrX_+_16737718 | 5.08 |
ENST00000380155.3
|
SYAP1
|
synapse associated protein 1 |
| chr8_+_42752053 | 4.73 |
ENST00000307602.4
|
HOOK3
|
hook microtubule-tethering protein 3 |
| chrX_+_110339439 | 4.49 |
ENST00000372010.1
ENST00000519681.1 ENST00000372007.5 |
PAK3
|
p21 protein (Cdc42/Rac)-activated kinase 3 |
| chr1_+_226411319 | 4.46 |
ENST00000542034.1
ENST00000366810.5 |
MIXL1
|
Mix paired-like homeobox |
| chr3_-_13009168 | 4.44 |
ENST00000273221.4
|
IQSEC1
|
IQ motif and Sec7 domain 1 |
| chr3_+_43328004 | 4.41 |
ENST00000454177.1
ENST00000429705.2 ENST00000296088.7 ENST00000437827.1 |
SNRK
|
SNF related kinase |
| chr6_+_41040678 | 4.40 |
ENST00000341376.6
ENST00000353205.5 |
NFYA
|
nuclear transcription factor Y, alpha |
| chr11_+_118401706 | 4.26 |
ENST00000411589.2
ENST00000442938.2 ENST00000359862.4 |
TMEM25
|
transmembrane protein 25 |
| chr1_+_145438469 | 4.21 |
ENST00000369317.4
|
TXNIP
|
thioredoxin interacting protein |
| chr14_-_45431091 | 4.21 |
ENST00000579157.1
ENST00000396128.4 ENST00000556500.1 |
KLHL28
|
kelch-like family member 28 |
| chr8_-_18871159 | 3.94 |
ENST00000327040.8
ENST00000440756.2 |
PSD3
|
pleckstrin and Sec7 domain containing 3 |
| chr11_-_132813566 | 3.92 |
ENST00000331898.7
|
OPCML
|
opioid binding protein/cell adhesion molecule-like |
| chr15_+_31619013 | 3.91 |
ENST00000307145.3
|
KLF13
|
Kruppel-like factor 13 |
| chr1_+_84543734 | 3.81 |
ENST00000370689.2
|
PRKACB
|
protein kinase, cAMP-dependent, catalytic, beta |
| chr7_-_44924939 | 3.81 |
ENST00000395699.2
|
PURB
|
purine-rich element binding protein B |
| chr15_+_68871308 | 3.79 |
ENST00000261861.5
|
CORO2B
|
coronin, actin binding protein, 2B |
| chr5_+_71403061 | 3.72 |
ENST00000512974.1
ENST00000296755.7 |
MAP1B
|
microtubule-associated protein 1B |
| chr15_-_83316254 | 3.72 |
ENST00000567678.1
ENST00000450751.2 |
CPEB1
|
cytoplasmic polyadenylation element binding protein 1 |
| chr17_-_40897043 | 3.69 |
ENST00000428826.2
ENST00000592492.1 ENST00000585893.1 ENST00000593214.1 ENST00000590078.1 ENST00000586382.1 ENST00000415827.2 ENST00000592743.1 ENST00000586089.1 ENST00000435174.1 |
EZH1
|
enhancer of zeste homolog 1 (Drosophila) |
| chr20_-_4804244 | 3.68 |
ENST00000379400.3
|
RASSF2
|
Ras association (RalGDS/AF-6) domain family member 2 |
| chr16_+_19125252 | 3.61 |
ENST00000566735.1
ENST00000381440.3 |
ITPRIPL2
|
inositol 1,4,5-trisphosphate receptor interacting protein-like 2 |
| chr2_-_96811170 | 3.52 |
ENST00000288943.4
|
DUSP2
|
dual specificity phosphatase 2 |
| chr3_-_50605077 | 3.45 |
ENST00000426034.1
ENST00000441239.1 |
C3orf18
|
chromosome 3 open reading frame 18 |
| chr22_+_40390930 | 3.42 |
ENST00000333407.6
|
FAM83F
|
family with sequence similarity 83, member F |
| chr10_+_180987 | 3.40 |
ENST00000381591.1
|
ZMYND11
|
zinc finger, MYND-type containing 11 |
| chr6_+_126112001 | 3.40 |
ENST00000392477.2
|
NCOA7
|
nuclear receptor coactivator 7 |
| chr9_-_130742792 | 3.36 |
ENST00000373095.1
|
FAM102A
|
family with sequence similarity 102, member A |
| chr11_-_118661828 | 3.35 |
ENST00000264018.4
|
DDX6
|
DEAD (Asp-Glu-Ala-Asp) box helicase 6 |
| chr4_+_156588350 | 3.35 |
ENST00000296518.7
|
GUCY1A3
|
guanylate cyclase 1, soluble, alpha 3 |
| chr14_-_99737565 | 3.23 |
ENST00000357195.3
|
BCL11B
|
B-cell CLL/lymphoma 11B (zinc finger protein) |
| chr6_-_167040731 | 3.20 |
ENST00000265678.4
|
RPS6KA2
|
ribosomal protein S6 kinase, 90kDa, polypeptide 2 |
| chr9_-_86571628 | 3.15 |
ENST00000376344.3
|
C9orf64
|
chromosome 9 open reading frame 64 |
| chr22_+_29469012 | 3.14 |
ENST00000400335.4
ENST00000400338.2 |
KREMEN1
|
kringle containing transmembrane protein 1 |
| chr18_+_42260861 | 3.13 |
ENST00000282030.5
|
SETBP1
|
SET binding protein 1 |
| chr9_-_111929560 | 3.11 |
ENST00000561981.2
|
FRRS1L
|
ferric-chelate reductase 1-like |
| chr16_-_2185899 | 3.10 |
ENST00000262304.4
ENST00000423118.1 |
PKD1
|
polycystic kidney disease 1 (autosomal dominant) |
| chr17_+_7184986 | 3.09 |
ENST00000317370.8
ENST00000571308.1 |
SLC2A4
|
solute carrier family 2 (facilitated glucose transporter), member 4 |
| chr11_+_73019282 | 3.06 |
ENST00000263674.3
|
ARHGEF17
|
Rho guanine nucleotide exchange factor (GEF) 17 |
| chr6_-_154677900 | 2.99 |
ENST00000265198.4
ENST00000520261.1 |
IPCEF1
|
interaction protein for cytohesin exchange factors 1 |
| chr21_-_32931290 | 2.97 |
ENST00000286827.3
|
TIAM1
|
T-cell lymphoma invasion and metastasis 1 |
| chr9_-_23821273 | 2.97 |
ENST00000380110.4
|
ELAVL2
|
ELAV like neuron-specific RNA binding protein 2 |
| chr1_-_230561475 | 2.94 |
ENST00000391860.1
|
PGBD5
|
piggyBac transposable element derived 5 |
| chr5_+_112043186 | 2.91 |
ENST00000509732.1
ENST00000457016.1 ENST00000507379.1 |
APC
|
adenomatous polyposis coli |
| chr10_-_81205373 | 2.90 |
ENST00000372336.3
|
ZCCHC24
|
zinc finger, CCHC domain containing 24 |
| chr2_-_235405679 | 2.84 |
ENST00000390645.2
|
ARL4C
|
ADP-ribosylation factor-like 4C |
| chr5_+_172483347 | 2.77 |
ENST00000522692.1
ENST00000296953.2 ENST00000540014.1 ENST00000520420.1 |
CREBRF
|
CREB3 regulatory factor |
| chr7_+_77325738 | 2.76 |
ENST00000334955.8
|
RSBN1L
|
round spermatid basic protein 1-like |
| chr2_-_2334888 | 2.62 |
ENST00000428368.2
ENST00000399161.2 |
MYT1L
|
myelin transcription factor 1-like |
| chr10_+_92980517 | 2.60 |
ENST00000336126.5
|
PCGF5
|
polycomb group ring finger 5 |
| chr8_-_82024290 | 2.60 |
ENST00000220597.4
|
PAG1
|
phosphoprotein associated with glycosphingolipid microdomains 1 |
| chr2_-_240322643 | 2.60 |
ENST00000345617.3
|
HDAC4
|
histone deacetylase 4 |
| chrX_+_23352133 | 2.54 |
ENST00000379361.4
|
PTCHD1
|
patched domain containing 1 |
| chr17_+_42264395 | 2.53 |
ENST00000587989.1
ENST00000590235.1 |
TMUB2
|
transmembrane and ubiquitin-like domain containing 2 |
| chr8_-_134584152 | 2.52 |
ENST00000521180.1
ENST00000517668.1 ENST00000319914.5 |
ST3GAL1
|
ST3 beta-galactoside alpha-2,3-sialyltransferase 1 |
| chr1_+_210001309 | 2.45 |
ENST00000491415.2
|
DIEXF
|
digestive organ expansion factor homolog (zebrafish) |
| chr1_-_207224307 | 2.42 |
ENST00000315927.4
|
YOD1
|
YOD1 deubiquitinase |
| chr11_-_73309228 | 2.40 |
ENST00000356467.4
ENST00000064778.4 |
FAM168A
|
family with sequence similarity 168, member A |
| chrX_+_37208521 | 2.38 |
ENST00000378628.4
|
PRRG1
|
proline rich Gla (G-carboxyglutamic acid) 1 |
| chr20_-_47894569 | 2.34 |
ENST00000371744.1
ENST00000371752.1 ENST00000396105.1 |
ZNFX1
|
zinc finger, NFX1-type containing 1 |
| chr6_-_32095968 | 2.30 |
ENST00000375203.3
ENST00000375201.4 |
ATF6B
|
activating transcription factor 6 beta |
| chr1_+_183605200 | 2.30 |
ENST00000304685.4
|
RGL1
|
ral guanine nucleotide dissociation stimulator-like 1 |
| chr4_-_76439596 | 2.28 |
ENST00000451788.1
ENST00000512706.1 |
RCHY1
|
ring finger and CHY zinc finger domain containing 1, E3 ubiquitin protein ligase |
| chr1_-_226924980 | 2.27 |
ENST00000272117.3
|
ITPKB
|
inositol-trisphosphate 3-kinase B |
| chr16_-_53537105 | 2.24 |
ENST00000568596.1
ENST00000570004.1 ENST00000564497.1 ENST00000300245.4 ENST00000394657.7 |
AKTIP
|
AKT interacting protein |
| chr9_-_138799070 | 2.21 |
ENST00000389532.4
ENST00000409386.3 |
CAMSAP1
|
calmodulin regulated spectrin-associated protein 1 |
| chr4_-_109089573 | 2.14 |
ENST00000265165.1
|
LEF1
|
lymphoid enhancer-binding factor 1 |
| chr12_+_72666407 | 2.12 |
ENST00000261180.4
|
TRHDE
|
thyrotropin-releasing hormone degrading enzyme |
| chr11_+_61520075 | 2.11 |
ENST00000278836.5
|
MYRF
|
myelin regulatory factor |
| chr7_+_100136811 | 2.11 |
ENST00000300176.4
ENST00000262935.4 |
AGFG2
|
ArfGAP with FG repeats 2 |
| chr3_-_18466787 | 2.08 |
ENST00000338745.6
ENST00000450898.1 |
SATB1
|
SATB homeobox 1 |
| chr9_+_82186872 | 2.07 |
ENST00000376544.3
ENST00000376520.4 |
TLE4
|
transducin-like enhancer of split 4 (E(sp1) homolog, Drosophila) |
| chr11_-_62494821 | 2.06 |
ENST00000301785.5
|
HNRNPUL2
|
heterogeneous nuclear ribonucleoprotein U-like 2 |
| chrX_+_133507327 | 2.05 |
ENST00000332070.3
ENST00000394292.1 ENST00000370799.1 ENST00000416404.2 |
PHF6
|
PHD finger protein 6 |
| chr7_+_99613195 | 2.03 |
ENST00000324306.6
|
ZKSCAN1
|
zinc finger with KRAB and SCAN domains 1 |
| chr1_+_162039558 | 2.01 |
ENST00000530878.1
ENST00000361897.5 |
NOS1AP
|
nitric oxide synthase 1 (neuronal) adaptor protein |
| chr3_-_123603137 | 1.97 |
ENST00000360304.3
ENST00000359169.1 ENST00000346322.5 ENST00000360772.3 |
MYLK
|
myosin light chain kinase |
| chr1_-_175712829 | 1.96 |
ENST00000367674.2
|
TNR
|
tenascin R |
| chr12_+_32655048 | 1.92 |
ENST00000427716.2
ENST00000266482.3 |
FGD4
|
FYVE, RhoGEF and PH domain containing 4 |
| chr3_+_14989076 | 1.92 |
ENST00000413118.1
ENST00000425241.1 |
NR2C2
|
nuclear receptor subfamily 2, group C, member 2 |
| chr3_+_20081515 | 1.88 |
ENST00000263754.4
|
KAT2B
|
K(lysine) acetyltransferase 2B |
| chr3_-_114790179 | 1.87 |
ENST00000462705.1
|
ZBTB20
|
zinc finger and BTB domain containing 20 |
| chr10_+_73975742 | 1.87 |
ENST00000299381.4
|
ANAPC16
|
anaphase promoting complex subunit 16 |
| chr12_+_5019061 | 1.86 |
ENST00000382545.3
|
KCNA1
|
potassium voltage-gated channel, shaker-related subfamily, member 1 (episodic ataxia with myokymia) |
| chr10_-_91295304 | 1.84 |
ENST00000341233.4
ENST00000371790.4 |
SLC16A12
|
solute carrier family 16, member 12 |
| chr12_-_56583332 | 1.83 |
ENST00000347471.4
ENST00000267064.4 ENST00000394023.3 |
SMARCC2
|
SWI/SNF related, matrix associated, actin dependent regulator of chromatin, subfamily c, member 2 |
| chr3_-_56835967 | 1.82 |
ENST00000495373.1
ENST00000296315.3 |
ARHGEF3
|
Rho guanine nucleotide exchange factor (GEF) 3 |
| chr5_-_174871136 | 1.80 |
ENST00000393752.2
|
DRD1
|
dopamine receptor D1 |
| chr1_+_10271674 | 1.77 |
ENST00000377086.1
|
KIF1B
|
kinesin family member 1B |
| chr14_-_91526922 | 1.76 |
ENST00000418736.2
ENST00000261991.3 |
RPS6KA5
|
ribosomal protein S6 kinase, 90kDa, polypeptide 5 |
| chr12_+_111471828 | 1.76 |
ENST00000261726.6
|
CUX2
|
cut-like homeobox 2 |
| chr2_-_157189180 | 1.74 |
ENST00000539077.1
ENST00000424077.1 ENST00000426264.1 ENST00000339562.4 ENST00000421709.1 |
NR4A2
|
nuclear receptor subfamily 4, group A, member 2 |
| chr7_-_5821314 | 1.74 |
ENST00000425013.2
ENST00000389902.3 |
RNF216
|
ring finger protein 216 |
| chr2_-_69870835 | 1.74 |
ENST00000409085.4
ENST00000406297.3 |
AAK1
|
AP2 associated kinase 1 |
| chr18_+_32558208 | 1.72 |
ENST00000436190.2
|
MAPRE2
|
microtubule-associated protein, RP/EB family, member 2 |
| chr17_+_53342311 | 1.72 |
ENST00000226067.5
|
HLF
|
hepatic leukemia factor |
| chr20_-_48099182 | 1.71 |
ENST00000371741.4
|
KCNB1
|
potassium voltage-gated channel, Shab-related subfamily, member 1 |
| chr2_+_27070964 | 1.69 |
ENST00000288699.6
|
DPYSL5
|
dihydropyrimidinase-like 5 |
| chr8_-_27630102 | 1.69 |
ENST00000356537.4
ENST00000522915.1 ENST00000539095.1 |
CCDC25
|
coiled-coil domain containing 25 |
| chr12_+_27396901 | 1.68 |
ENST00000541191.1
ENST00000389032.3 |
STK38L
|
serine/threonine kinase 38 like |
| chr4_-_53525406 | 1.67 |
ENST00000451218.2
ENST00000441222.3 |
USP46
|
ubiquitin specific peptidase 46 |
| chr1_-_23857698 | 1.67 |
ENST00000361729.2
|
E2F2
|
E2F transcription factor 2 |
| chr19_-_4066890 | 1.66 |
ENST00000322357.4
|
ZBTB7A
|
zinc finger and BTB domain containing 7A |
| chr1_-_226076843 | 1.62 |
ENST00000272134.5
|
LEFTY1
|
left-right determination factor 1 |
| chr10_-_52645416 | 1.59 |
ENST00000374001.2
ENST00000373997.3 ENST00000373995.3 ENST00000282641.2 ENST00000395495.1 ENST00000414883.1 |
A1CF
|
APOBEC1 complementation factor |
| chr5_+_49961727 | 1.59 |
ENST00000505697.2
ENST00000503750.2 ENST00000514342.2 |
PARP8
|
poly (ADP-ribose) polymerase family, member 8 |
| chr2_+_16080659 | 1.58 |
ENST00000281043.3
|
MYCN
|
v-myc avian myelocytomatosis viral oncogene neuroblastoma derived homolog |
| chr17_-_56595196 | 1.57 |
ENST00000579921.1
ENST00000579925.1 ENST00000323456.5 |
MTMR4
|
myotubularin related protein 4 |
| chr7_+_119913688 | 1.57 |
ENST00000331113.4
|
KCND2
|
potassium voltage-gated channel, Shal-related subfamily, member 2 |
| chrX_+_76709648 | 1.53 |
ENST00000439435.1
|
FGF16
|
fibroblast growth factor 16 |
| chr20_-_35724388 | 1.51 |
ENST00000344359.3
ENST00000373664.3 |
RBL1
|
retinoblastoma-like 1 (p107) |
| chr6_+_157802165 | 1.51 |
ENST00000414563.2
ENST00000359775.5 |
ZDHHC14
|
zinc finger, DHHC-type containing 14 |
| chr10_-_120514720 | 1.49 |
ENST00000369151.3
ENST00000340214.4 |
CACUL1
|
CDK2-associated, cullin domain 1 |
| chr15_+_92937058 | 1.49 |
ENST00000268164.3
|
ST8SIA2
|
ST8 alpha-N-acetyl-neuraminide alpha-2,8-sialyltransferase 2 |
| chr20_+_36149602 | 1.49 |
ENST00000062104.2
ENST00000346199.2 |
NNAT
|
neuronatin |
| chr11_+_118307179 | 1.49 |
ENST00000534358.1
ENST00000531904.2 ENST00000389506.5 ENST00000354520.4 |
KMT2A
|
lysine (K)-specific methyltransferase 2A |
| chr4_+_86396265 | 1.48 |
ENST00000395184.1
|
ARHGAP24
|
Rho GTPase activating protein 24 |
| chr17_+_47865917 | 1.48 |
ENST00000259021.4
ENST00000454930.2 ENST00000509773.1 ENST00000510819.1 ENST00000424009.2 |
KAT7
|
K(lysine) acetyltransferase 7 |
| chr6_+_108487245 | 1.45 |
ENST00000368986.4
|
NR2E1
|
nuclear receptor subfamily 2, group E, member 1 |
| chr6_+_87865262 | 1.44 |
ENST00000369577.3
ENST00000518845.1 ENST00000339907.4 ENST00000496806.2 |
ZNF292
|
zinc finger protein 292 |
| chr4_+_6271558 | 1.43 |
ENST00000503569.1
ENST00000226760.1 |
WFS1
|
Wolfram syndrome 1 (wolframin) |
| chr10_+_126490354 | 1.43 |
ENST00000298492.5
|
FAM175B
|
family with sequence similarity 175, member B |
| chr5_+_149109825 | 1.42 |
ENST00000360453.4
ENST00000394320.3 ENST00000309241.5 |
PPARGC1B
|
peroxisome proliferator-activated receptor gamma, coactivator 1 beta |
| chr14_-_92506371 | 1.39 |
ENST00000267622.4
|
TRIP11
|
thyroid hormone receptor interactor 11 |
| chr9_-_125675576 | 1.39 |
ENST00000373659.3
|
ZBTB6
|
zinc finger and BTB domain containing 6 |
| chr14_-_75593708 | 1.39 |
ENST00000557673.1
ENST00000238616.5 |
NEK9
|
NIMA-related kinase 9 |
| chr2_-_103353277 | 1.38 |
ENST00000258436.5
|
MFSD9
|
major facilitator superfamily domain containing 9 |
| chr3_-_149688896 | 1.38 |
ENST00000239940.7
|
PFN2
|
profilin 2 |
| chr22_+_33197683 | 1.37 |
ENST00000266085.6
|
TIMP3
|
TIMP metallopeptidase inhibitor 3 |
| chr2_+_70142189 | 1.36 |
ENST00000264444.2
|
MXD1
|
MAX dimerization protein 1 |
| chr15_-_78526942 | 1.36 |
ENST00000258873.4
|
ACSBG1
|
acyl-CoA synthetase bubblegum family member 1 |
| chr7_+_65338230 | 1.35 |
ENST00000360768.3
|
VKORC1L1
|
vitamin K epoxide reductase complex, subunit 1-like 1 |
| chr3_-_15106747 | 1.34 |
ENST00000449354.2
ENST00000444840.2 ENST00000253686.2 |
MRPS25
|
mitochondrial ribosomal protein S25 |
| chr7_+_20370746 | 1.31 |
ENST00000222573.4
|
ITGB8
|
integrin, beta 8 |
| chr11_+_33278811 | 1.31 |
ENST00000303296.4
ENST00000379016.3 |
HIPK3
|
homeodomain interacting protein kinase 3 |
| chr2_+_29338236 | 1.31 |
ENST00000320081.5
|
CLIP4
|
CAP-GLY domain containing linker protein family, member 4 |
| chr17_-_48207157 | 1.29 |
ENST00000330175.4
ENST00000503131.1 |
SAMD14
|
sterile alpha motif domain containing 14 |
| chr6_+_45389893 | 1.29 |
ENST00000371432.3
|
RUNX2
|
runt-related transcription factor 2 |
| chr2_-_182545603 | 1.28 |
ENST00000295108.3
|
NEUROD1
|
neuronal differentiation 1 |
| chr13_+_22245522 | 1.28 |
ENST00000382353.5
|
FGF9
|
fibroblast growth factor 9 |
| chr14_+_35515598 | 1.27 |
ENST00000280987.4
|
FAM177A1
|
family with sequence similarity 177, member A1 |
| chr2_-_218808771 | 1.27 |
ENST00000449814.1
ENST00000171887.4 |
TNS1
|
tensin 1 |
| chr5_-_114515734 | 1.25 |
ENST00000514154.1
ENST00000282369.3 |
TRIM36
|
tripartite motif containing 36 |
| chr17_-_5138099 | 1.24 |
ENST00000571800.1
ENST00000574081.1 ENST00000399600.4 ENST00000574297.1 |
SCIMP
|
SLP adaptor and CSK interacting membrane protein |
| chr20_+_9494987 | 1.24 |
ENST00000427562.2
ENST00000246070.2 |
LAMP5
|
lysosomal-associated membrane protein family, member 5 |
| chr13_-_29292956 | 1.23 |
ENST00000266943.6
|
SLC46A3
|
solute carrier family 46, member 3 |
| chr8_+_28747884 | 1.21 |
ENST00000287701.10
ENST00000444075.1 ENST00000403668.2 ENST00000519662.1 ENST00000558662.1 ENST00000523613.1 ENST00000560599.1 ENST00000397358.3 |
HMBOX1
|
homeobox containing 1 |
| chr8_-_67525473 | 1.20 |
ENST00000522677.3
|
MYBL1
|
v-myb avian myeloblastosis viral oncogene homolog-like 1 |
| chr1_-_226111929 | 1.18 |
ENST00000343818.6
ENST00000432920.2 |
PYCR2
RP4-559A3.7
|
pyrroline-5-carboxylate reductase family, member 2 Uncharacterized protein |
| chr2_-_73340146 | 1.17 |
ENST00000258098.6
|
RAB11FIP5
|
RAB11 family interacting protein 5 (class I) |
| chr1_+_244214577 | 1.16 |
ENST00000358704.4
|
ZBTB18
|
zinc finger and BTB domain containing 18 |
| chr2_+_198669365 | 1.16 |
ENST00000428675.1
|
PLCL1
|
phospholipase C-like 1 |
| chr10_+_102295616 | 1.16 |
ENST00000299163.6
|
HIF1AN
|
hypoxia inducible factor 1, alpha subunit inhibitor |
| chr12_+_69864129 | 1.15 |
ENST00000547219.1
ENST00000299293.2 ENST00000549921.1 ENST00000550316.1 ENST00000548154.1 ENST00000547414.1 ENST00000550389.1 ENST00000550937.1 ENST00000549092.1 ENST00000550169.1 |
FRS2
|
fibroblast growth factor receptor substrate 2 |
| chr12_-_58135903 | 1.14 |
ENST00000257897.3
|
AGAP2
|
ArfGAP with GTPase domain, ankyrin repeat and PH domain 2 |
| chr3_+_179065474 | 1.14 |
ENST00000471841.1
ENST00000280653.7 |
MFN1
|
mitofusin 1 |
| chr1_-_25291475 | 1.14 |
ENST00000338888.3
ENST00000399916.1 |
RUNX3
|
runt-related transcription factor 3 |
| chr2_-_213403565 | 1.12 |
ENST00000342788.4
ENST00000436443.1 |
ERBB4
|
v-erb-b2 avian erythroblastic leukemia viral oncogene homolog 4 |
| chr21_+_47063590 | 1.12 |
ENST00000400314.1
|
PCBP3
|
poly(rC) binding protein 3 |
| chr12_-_51611477 | 1.10 |
ENST00000389243.4
|
POU6F1
|
POU class 6 homeobox 1 |
| chr12_-_21927736 | 1.08 |
ENST00000240662.2
|
KCNJ8
|
potassium inwardly-rectifying channel, subfamily J, member 8 |
| chr2_-_43453734 | 1.07 |
ENST00000282388.3
|
ZFP36L2
|
ZFP36 ring finger protein-like 2 |
| chr1_-_226129083 | 1.06 |
ENST00000420304.2
|
LEFTY2
|
left-right determination factor 2 |
| chr14_-_93799360 | 1.06 |
ENST00000334746.5
ENST00000554565.1 ENST00000298896.3 |
BTBD7
|
BTB (POZ) domain containing 7 |
| chr1_+_220701456 | 1.05 |
ENST00000366918.4
ENST00000402574.1 |
MARK1
|
MAP/microtubule affinity-regulating kinase 1 |
| chr3_+_10206545 | 1.05 |
ENST00000256458.4
|
IRAK2
|
interleukin-1 receptor-associated kinase 2 |
| chr10_+_63661053 | 1.03 |
ENST00000279873.7
|
ARID5B
|
AT rich interactive domain 5B (MRF1-like) |
| chr5_+_56111361 | 1.02 |
ENST00000399503.3
|
MAP3K1
|
mitogen-activated protein kinase kinase kinase 1, E3 ubiquitin protein ligase |
| chr4_+_154125565 | 1.01 |
ENST00000338700.5
|
TRIM2
|
tripartite motif containing 2 |
| chr2_+_239335449 | 1.01 |
ENST00000264607.4
|
ASB1
|
ankyrin repeat and SOCS box containing 1 |
| chr17_-_43568062 | 1.00 |
ENST00000421073.2
ENST00000584420.1 ENST00000589780.1 ENST00000430334.3 |
PLEKHM1
|
pleckstrin homology domain containing, family M (with RUN domain) member 1 |
| chr8_+_28351707 | 1.00 |
ENST00000537916.1
ENST00000523546.1 ENST00000240093.3 |
FZD3
|
frizzled family receptor 3 |
| chr3_-_46037299 | 0.99 |
ENST00000296137.2
|
FYCO1
|
FYVE and coiled-coil domain containing 1 |
| chr10_+_104613980 | 0.98 |
ENST00000339834.5
|
C10orf32
|
chromosome 10 open reading frame 32 |
| chr15_-_61521495 | 0.97 |
ENST00000335670.6
|
RORA
|
RAR-related orphan receptor A |
| chr15_-_83953466 | 0.96 |
ENST00000345382.2
|
BNC1
|
basonuclin 1 |
| chr12_+_8185288 | 0.95 |
ENST00000162391.3
|
FOXJ2
|
forkhead box J2 |
| chr1_-_85156216 | 0.95 |
ENST00000342203.3
ENST00000370612.4 |
SSX2IP
|
synovial sarcoma, X breakpoint 2 interacting protein |
| chr9_-_135996537 | 0.95 |
ENST00000372050.3
ENST00000372047.3 |
RALGDS
|
ral guanine nucleotide dissociation stimulator |
| chr8_-_41909496 | 0.94 |
ENST00000265713.2
ENST00000406337.1 ENST00000396930.3 ENST00000485568.1 ENST00000426524.1 |
KAT6A
|
K(lysine) acetyltransferase 6A |
| chr8_+_1449532 | 0.93 |
ENST00000421627.2
|
DLGAP2
|
discs, large (Drosophila) homolog-associated protein 2 |
| chr5_+_96271141 | 0.93 |
ENST00000231368.5
|
LNPEP
|
leucyl/cystinyl aminopeptidase |
| chr2_-_197036289 | 0.93 |
ENST00000263955.4
|
STK17B
|
serine/threonine kinase 17b |
| chr7_-_142583506 | 0.92 |
ENST00000359396.3
|
TRPV6
|
transient receptor potential cation channel, subfamily V, member 6 |
| chr17_-_40021656 | 0.92 |
ENST00000319121.3
|
KLHL11
|
kelch-like family member 11 |
| chrX_+_119384607 | 0.91 |
ENST00000326624.2
ENST00000557385.1 |
ZBTB33
|
zinc finger and BTB domain containing 33 |
| chr16_-_4323015 | 0.90 |
ENST00000204517.6
|
TFAP4
|
transcription factor AP-4 (activating enhancer binding protein 4) |
| chr9_-_37465396 | 0.90 |
ENST00000307750.4
|
ZBTB5
|
zinc finger and BTB domain containing 5 |
| chr3_-_171178157 | 0.90 |
ENST00000465393.1
ENST00000436636.2 ENST00000369326.5 ENST00000538048.1 ENST00000341852.6 |
TNIK
|
TRAF2 and NCK interacting kinase |
| chr10_+_14920843 | 0.90 |
ENST00000433779.1
ENST00000378325.3 ENST00000354919.6 ENST00000313519.5 ENST00000420416.1 |
SUV39H2
|
suppressor of variegation 3-9 homolog 2 (Drosophila) |
| chr14_+_33408449 | 0.89 |
ENST00000346562.2
ENST00000341321.4 ENST00000548645.1 ENST00000356141.4 ENST00000357798.5 |
NPAS3
|
neuronal PAS domain protein 3 |
| chr2_-_166930131 | 0.89 |
ENST00000303395.4
ENST00000409050.1 ENST00000423058.2 ENST00000375405.3 |
SCN1A
|
sodium channel, voltage-gated, type I, alpha subunit |
| chr21_-_36260980 | 0.88 |
ENST00000344691.4
ENST00000358356.5 |
RUNX1
|
runt-related transcription factor 1 |
| chr9_+_36036430 | 0.88 |
ENST00000377966.3
|
RECK
|
reversion-inducing-cysteine-rich protein with kazal motifs |
| chr20_-_9819479 | 0.88 |
ENST00000378423.1
ENST00000353224.5 |
PAK7
|
p21 protein (Cdc42/Rac)-activated kinase 7 |
| chr9_-_101017862 | 0.85 |
ENST00000375064.1
ENST00000342112.5 |
TBC1D2
|
TBC1 domain family, member 2 |
| chr3_-_197476560 | 0.84 |
ENST00000273582.5
|
KIAA0226
|
KIAA0226 |
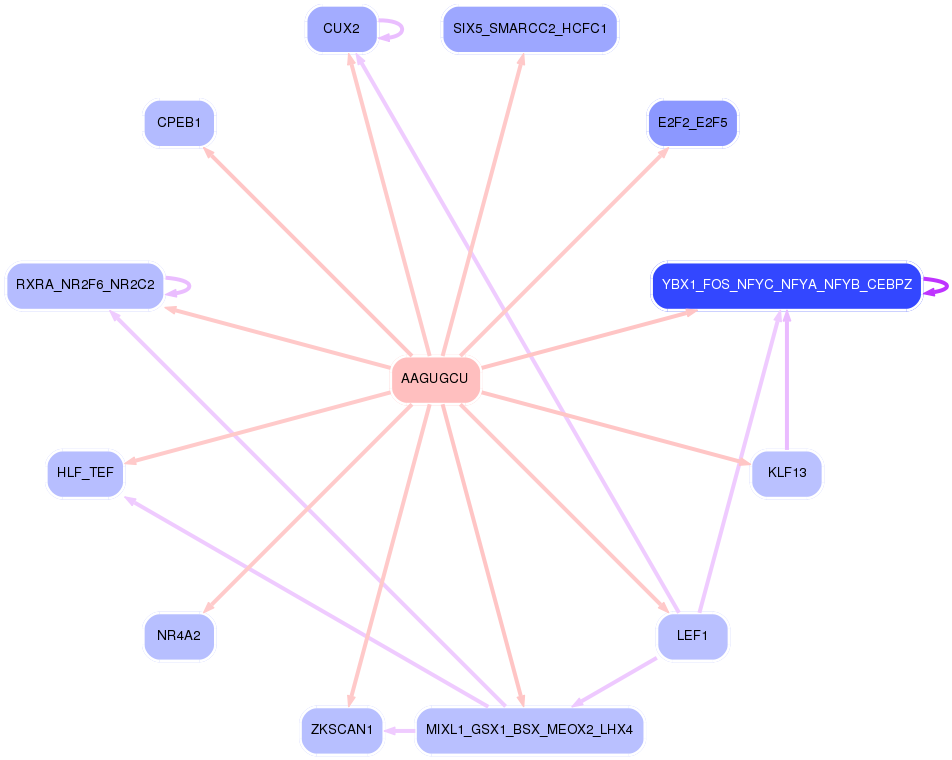
Network of associatons between targets according to the STRING database.

First level regulatory network of AAGUGCU
Gene Ontology Analysis
Gene overrepresentation in biological_process category:
| Log-likelihood per target | Total log-likelihood | Term | Description |
|---|---|---|---|
| 1.2 | 4.7 | GO:0022027 | interkinetic nuclear migration(GO:0022027) |
| 1.1 | 3.3 | GO:0019074 | viral genome packaging(GO:0019072) viral RNA genome packaging(GO:0019074) |
| 0.9 | 2.8 | GO:1900169 | regulation of glucocorticoid mediated signaling pathway(GO:1900169) |
| 0.9 | 5.2 | GO:2000324 | positive regulation of glucocorticoid receptor signaling pathway(GO:2000324) |
| 0.8 | 2.4 | GO:1990168 | protein K33-linked deubiquitination(GO:1990168) |
| 0.8 | 3.1 | GO:0072237 | metanephric proximal tubule development(GO:0072237) |
| 0.8 | 3.8 | GO:0097338 | response to clozapine(GO:0097338) |
| 0.6 | 1.9 | GO:0035948 | positive regulation of gluconeogenesis by positive regulation of transcription from RNA polymerase II promoter(GO:0035948) |
| 0.6 | 1.8 | GO:1904647 | response to rotenone(GO:1904647) |
| 0.6 | 1.7 | GO:0021986 | epithalamus development(GO:0021538) habenula development(GO:0021986) |
| 0.6 | 7.8 | GO:0070050 | neuron cellular homeostasis(GO:0070050) |
| 0.6 | 2.8 | GO:2000382 | positive regulation of mesoderm development(GO:2000382) |
| 0.6 | 3.3 | GO:0052551 | response to defense-related nitric oxide production by other organism involved in symbiotic interaction(GO:0052551) response to defense-related host nitric oxide production(GO:0052565) |
| 0.6 | 3.9 | GO:1903818 | positive regulation of voltage-gated potassium channel activity(GO:1903818) |
| 0.5 | 4.1 | GO:2000766 | negative regulation of cytoplasmic translation(GO:2000766) |
| 0.5 | 3.0 | GO:1903977 | positive regulation of glial cell migration(GO:1903977) |
| 0.5 | 1.5 | GO:0043983 | histone H4-K12 acetylation(GO:0043983) |
| 0.5 | 1.4 | GO:0060164 | regulation of timing of neuron differentiation(GO:0060164) |
| 0.5 | 3.2 | GO:0035701 | hematopoietic stem cell migration(GO:0035701) |
| 0.4 | 2.1 | GO:0071895 | odontoblast differentiation(GO:0071895) |
| 0.4 | 1.7 | GO:0010701 | positive regulation of norepinephrine secretion(GO:0010701) |
| 0.4 | 8.4 | GO:0032012 | regulation of ARF protein signal transduction(GO:0032012) |
| 0.4 | 4.2 | GO:0014877 | response to muscle inactivity involved in regulation of muscle adaptation(GO:0014877) response to denervation involved in regulation of muscle adaptation(GO:0014894) |
| 0.4 | 2.0 | GO:0048690 | regulation of sprouting of injured axon(GO:0048686) regulation of axon extension involved in regeneration(GO:0048690) |
| 0.4 | 3.9 | GO:0045647 | negative regulation of erythrocyte differentiation(GO:0045647) |
| 0.4 | 1.2 | GO:0042264 | peptidyl-aspartic acid hydroxylation(GO:0042264) |
| 0.4 | 1.1 | GO:2000364 | regulation of STAT protein import into nucleus(GO:2000364) positive regulation of STAT protein import into nucleus(GO:2000366) |
| 0.4 | 1.5 | GO:1901674 | histone H3-K27 acetylation(GO:0043974) regulation of histone H3-K27 acetylation(GO:1901674) |
| 0.4 | 1.8 | GO:0035106 | operant conditioning(GO:0035106) |
| 0.4 | 1.8 | GO:0043988 | histone H3-S28 phosphorylation(GO:0043988) histone H2A phosphorylation(GO:1990164) |
| 0.3 | 1.4 | GO:1903984 | positive regulation of TRAIL-activated apoptotic signaling pathway(GO:1903984) |
| 0.3 | 1.0 | GO:0045976 | negative regulation of mitotic cell cycle, embryonic(GO:0045976) |
| 0.3 | 2.0 | GO:0060414 | aorta smooth muscle tissue morphogenesis(GO:0060414) |
| 0.3 | 2.3 | GO:0033029 | regulation of neutrophil apoptotic process(GO:0033029) common myeloid progenitor cell proliferation(GO:0035726) |
| 0.3 | 2.9 | GO:1904781 | positive regulation of protein localization to centrosome(GO:1904781) |
| 0.3 | 3.8 | GO:1901223 | negative regulation of NIK/NF-kappaB signaling(GO:1901223) |
| 0.3 | 1.7 | GO:0035881 | amacrine cell differentiation(GO:0035881) |
| 0.3 | 3.7 | GO:0036500 | ATF6-mediated unfolded protein response(GO:0036500) |
| 0.3 | 1.6 | GO:0016554 | cytidine to uridine editing(GO:0016554) |
| 0.3 | 5.0 | GO:0002347 | response to tumor cell(GO:0002347) |
| 0.3 | 0.8 | GO:0044314 | protein K27-linked ubiquitination(GO:0044314) |
| 0.2 | 2.0 | GO:0001574 | ganglioside biosynthetic process(GO:0001574) |
| 0.2 | 0.7 | GO:0060374 | astrocyte fate commitment(GO:0060018) mast cell differentiation(GO:0060374) |
| 0.2 | 2.1 | GO:0032286 | central nervous system myelin maintenance(GO:0032286) |
| 0.2 | 3.8 | GO:0060004 | reflex(GO:0060004) |
| 0.2 | 3.7 | GO:0061339 | establishment of monopolar cell polarity(GO:0061162) establishment or maintenance of monopolar cell polarity(GO:0061339) |
| 0.2 | 1.5 | GO:1904849 | positive regulation of cell chemotaxis to fibroblast growth factor(GO:1904849) positive regulation of endothelial cell chemotaxis to fibroblast growth factor(GO:2000546) |
| 0.2 | 0.6 | GO:0046619 | optic placode formation involved in camera-type eye formation(GO:0046619) |
| 0.2 | 0.6 | GO:0003099 | vasodilation by norepinephrine-epinephrine involved in regulation of systemic arterial blood pressure(GO:0002025) positive regulation of the force of heart contraction by chemical signal(GO:0003099) |
| 0.2 | 0.4 | GO:0060664 | epithelial cell proliferation involved in salivary gland morphogenesis(GO:0060664) |
| 0.2 | 0.6 | GO:2001045 | closure of optic fissure(GO:0061386) negative regulation of integrin-mediated signaling pathway(GO:2001045) |
| 0.2 | 3.0 | GO:0015671 | oxygen transport(GO:0015671) |
| 0.2 | 1.2 | GO:0055129 | proline biosynthetic process(GO:0006561) L-proline biosynthetic process(GO:0055129) |
| 0.2 | 2.5 | GO:0006054 | N-acetylneuraminate metabolic process(GO:0006054) |
| 0.2 | 4.5 | GO:0010763 | positive regulation of fibroblast migration(GO:0010763) |
| 0.2 | 3.0 | GO:1902083 | negative regulation of peptidyl-cysteine S-nitrosylation(GO:1902083) |
| 0.2 | 1.3 | GO:0060484 | lung-associated mesenchyme development(GO:0060484) |
| 0.2 | 1.1 | GO:1904628 | response to phorbol 13-acetate 12-myristate(GO:1904627) cellular response to phorbol 13-acetate 12-myristate(GO:1904628) |
| 0.2 | 0.7 | GO:0033686 | positive regulation of luteinizing hormone secretion(GO:0033686) |
| 0.2 | 0.7 | GO:1901165 | positive regulation of trophoblast cell migration(GO:1901165) |
| 0.2 | 1.3 | GO:0002051 | osteoblast fate commitment(GO:0002051) |
| 0.2 | 2.5 | GO:0021794 | thalamus development(GO:0021794) |
| 0.2 | 0.5 | GO:1902263 | apoptotic process involved in embryonic digit morphogenesis(GO:1902263) |
| 0.2 | 1.4 | GO:0006390 | transcription from mitochondrial promoter(GO:0006390) |
| 0.1 | 1.5 | GO:0009249 | protein lipoylation(GO:0009249) |
| 0.1 | 0.6 | GO:0052572 | response to immune response of other organism involved in symbiotic interaction(GO:0052564) response to host immune response(GO:0052572) |
| 0.1 | 1.5 | GO:0098870 | neuronal action potential propagation(GO:0019227) action potential propagation(GO:0098870) |
| 0.1 | 1.3 | GO:0042373 | vitamin K metabolic process(GO:0042373) |
| 0.1 | 2.3 | GO:0043508 | negative regulation of JUN kinase activity(GO:0043508) |
| 0.1 | 1.0 | GO:0036123 | histone H3-K9 dimethylation(GO:0036123) |
| 0.1 | 1.3 | GO:0001573 | ganglioside metabolic process(GO:0001573) |
| 0.1 | 1.4 | GO:1900028 | negative regulation of ruffle assembly(GO:1900028) |
| 0.1 | 3.4 | GO:0034243 | regulation of transcription elongation from RNA polymerase II promoter(GO:0034243) |
| 0.1 | 1.6 | GO:1903800 | positive regulation of production of miRNAs involved in gene silencing by miRNA(GO:1903800) |
| 0.1 | 3.1 | GO:0035428 | hexose transmembrane transport(GO:0035428) glucose transmembrane transport(GO:1904659) |
| 0.1 | 0.9 | GO:1904684 | negative regulation of metalloendopeptidase activity(GO:1904684) |
| 0.1 | 0.5 | GO:0006398 | mRNA 3'-end processing by stem-loop binding and cleavage(GO:0006398) |
| 0.1 | 2.6 | GO:0048934 | peripheral nervous system neuron differentiation(GO:0048934) peripheral nervous system neuron development(GO:0048935) |
| 0.1 | 0.8 | GO:0016584 | nucleosome positioning(GO:0016584) |
| 0.1 | 0.8 | GO:0097411 | hypoxia-inducible factor-1alpha signaling pathway(GO:0097411) |
| 0.1 | 0.1 | GO:0060729 | intestinal epithelial structure maintenance(GO:0060729) |
| 0.1 | 0.3 | GO:1903401 | lysine import(GO:0034226) L-lysine import(GO:0061461) L-lysine transmembrane transport(GO:1903401) L-lysine import into cell(GO:1903410) |
| 0.1 | 2.6 | GO:0048665 | neuron fate specification(GO:0048665) |
| 0.1 | 1.6 | GO:0045475 | locomotor rhythm(GO:0045475) |
| 0.1 | 1.7 | GO:0070734 | histone H3-K27 methylation(GO:0070734) |
| 0.1 | 0.7 | GO:0042415 | norepinephrine metabolic process(GO:0042415) |
| 0.1 | 0.4 | GO:0061002 | negative regulation of dendritic spine morphogenesis(GO:0061002) |
| 0.1 | 1.0 | GO:0072383 | plus-end-directed vesicle transport along microtubule(GO:0072383) |
| 0.1 | 0.4 | GO:0043586 | tongue development(GO:0043586) |
| 0.1 | 1.2 | GO:1900122 | positive regulation of receptor binding(GO:1900122) |
| 0.1 | 1.5 | GO:0018345 | protein palmitoylation(GO:0018345) |
| 0.1 | 0.9 | GO:0002480 | antigen processing and presentation of exogenous peptide antigen via MHC class I, TAP-independent(GO:0002480) |
| 0.1 | 0.8 | GO:0071798 | adenosine metabolic process(GO:0046085) response to prostaglandin D(GO:0071798) cellular response to prostaglandin D stimulus(GO:0071799) |
| 0.1 | 1.8 | GO:0007614 | short-term memory(GO:0007614) |
| 0.1 | 3.5 | GO:0000188 | inactivation of MAPK activity(GO:0000188) |
| 0.1 | 1.2 | GO:0071468 | cellular response to acidic pH(GO:0071468) |
| 0.1 | 0.5 | GO:2000807 | regulation of synaptic vesicle clustering(GO:2000807) |
| 0.1 | 1.0 | GO:0021694 | cerebellar Purkinje cell layer formation(GO:0021694) cerebellar Purkinje cell differentiation(GO:0021702) |
| 0.1 | 0.6 | GO:0021800 | cerebral cortex tangential migration(GO:0021800) |
| 0.1 | 2.3 | GO:0070987 | error-free translesion synthesis(GO:0070987) |
| 0.1 | 1.3 | GO:0060122 | inner ear receptor stereocilium organization(GO:0060122) |
| 0.1 | 0.9 | GO:1990035 | calcium ion import across plasma membrane(GO:0098703) calcium ion import into cell(GO:1990035) |
| 0.1 | 1.8 | GO:0006337 | nucleosome disassembly(GO:0006337) |
| 0.1 | 2.8 | GO:0032456 | endocytic recycling(GO:0032456) |
| 0.1 | 1.7 | GO:2000369 | regulation of clathrin-mediated endocytosis(GO:2000369) |
| 0.1 | 2.7 | GO:0008038 | neuron recognition(GO:0008038) |
| 0.1 | 1.1 | GO:1990573 | potassium ion import across plasma membrane(GO:1990573) |
| 0.1 | 0.3 | GO:0051534 | negative regulation of NFAT protein import into nucleus(GO:0051534) |
| 0.1 | 2.4 | GO:0000462 | maturation of SSU-rRNA from tricistronic rRNA transcript (SSU-rRNA, 5.8S rRNA, LSU-rRNA)(GO:0000462) |
| 0.1 | 0.2 | GO:0055073 | L-arginine import(GO:0043091) cadmium ion homeostasis(GO:0055073) arginine import(GO:0090467) L-arginine transport(GO:1902023) |
| 0.1 | 0.5 | GO:0000395 | mRNA 5'-splice site recognition(GO:0000395) |
| 0.1 | 1.4 | GO:0035338 | long-chain fatty-acyl-CoA biosynthetic process(GO:0035338) |
| 0.1 | 0.3 | GO:0051182 | coenzyme transport(GO:0051182) |
| 0.1 | 1.0 | GO:0034162 | toll-like receptor 9 signaling pathway(GO:0034162) |
| 0.1 | 2.4 | GO:1900449 | regulation of glutamate receptor signaling pathway(GO:1900449) |
| 0.1 | 3.7 | GO:0032648 | interferon-beta production(GO:0032608) regulation of interferon-beta production(GO:0032648) |
| 0.1 | 0.5 | GO:0048386 | positive regulation of retinoic acid receptor signaling pathway(GO:0048386) |
| 0.1 | 2.2 | GO:1904837 | beta-catenin-TCF complex assembly(GO:1904837) |
| 0.1 | 2.4 | GO:0045739 | positive regulation of DNA repair(GO:0045739) |
| 0.0 | 0.6 | GO:2000786 | positive regulation of autophagosome assembly(GO:2000786) |
| 0.0 | 1.8 | GO:0072337 | modified amino acid transport(GO:0072337) |
| 0.0 | 0.6 | GO:0008627 | intrinsic apoptotic signaling pathway in response to osmotic stress(GO:0008627) |
| 0.0 | 0.1 | GO:0097368 | establishment of Sertoli cell barrier(GO:0097368) |
| 0.0 | 3.1 | GO:0006400 | tRNA modification(GO:0006400) |
| 0.0 | 2.2 | GO:0008333 | endosome to lysosome transport(GO:0008333) |
| 0.0 | 0.3 | GO:0035624 | receptor transactivation(GO:0035624) |
| 0.0 | 0.2 | GO:0043570 | maintenance of DNA repeat elements(GO:0043570) |
| 0.0 | 0.7 | GO:2000651 | positive regulation of sodium ion transmembrane transporter activity(GO:2000651) |
| 0.0 | 2.1 | GO:0043171 | peptide catabolic process(GO:0043171) |
| 0.0 | 0.6 | GO:0010739 | positive regulation of protein kinase A signaling(GO:0010739) |
| 0.0 | 0.9 | GO:0000185 | activation of MAPKKK activity(GO:0000185) |
| 0.0 | 0.6 | GO:0071481 | cellular response to X-ray(GO:0071481) |
| 0.0 | 1.0 | GO:0002755 | MyD88-dependent toll-like receptor signaling pathway(GO:0002755) |
| 0.0 | 0.3 | GO:0034587 | piRNA metabolic process(GO:0034587) |
| 0.0 | 0.6 | GO:0032836 | glomerular basement membrane development(GO:0032836) |
| 0.0 | 1.2 | GO:0007340 | acrosome reaction(GO:0007340) |
| 0.0 | 2.3 | GO:0030509 | BMP signaling pathway(GO:0030509) |
| 0.0 | 1.3 | GO:0010761 | fibroblast migration(GO:0010761) |
| 0.0 | 0.4 | GO:0044331 | cell-cell adhesion mediated by cadherin(GO:0044331) |
| 0.0 | 2.3 | GO:0043550 | regulation of lipid kinase activity(GO:0043550) |
| 0.0 | 1.9 | GO:0046847 | filopodium assembly(GO:0046847) |
| 0.0 | 1.0 | GO:0060612 | adipose tissue development(GO:0060612) |
| 0.0 | 0.6 | GO:0006978 | DNA damage response, signal transduction by p53 class mediator resulting in transcription of p21 class mediator(GO:0006978) DNA damage response, signal transduction resulting in transcription(GO:0042772) |
| 0.0 | 0.3 | GO:0010759 | positive regulation of macrophage chemotaxis(GO:0010759) |
| 0.0 | 0.2 | GO:1990118 | sodium ion import(GO:0097369) sodium ion import across plasma membrane(GO:0098719) sodium ion import into cell(GO:1990118) |
| 0.0 | 1.1 | GO:0046039 | GTP metabolic process(GO:0046039) |
| 0.0 | 0.9 | GO:0035735 | intraciliary transport involved in cilium morphogenesis(GO:0035735) |
| 0.0 | 0.4 | GO:1902187 | negative regulation of viral release from host cell(GO:1902187) |
| 0.0 | 0.4 | GO:0018298 | protein-chromophore linkage(GO:0018298) |
| 0.0 | 0.3 | GO:0051781 | positive regulation of cell division(GO:0051781) |
| 0.0 | 0.1 | GO:2000195 | negative regulation of female gonad development(GO:2000195) |
| 0.0 | 1.1 | GO:0032212 | positive regulation of telomere maintenance via telomerase(GO:0032212) |
| 0.0 | 1.2 | GO:0060538 | skeletal muscle tissue development(GO:0007519) skeletal muscle organ development(GO:0060538) |
| 0.0 | 0.5 | GO:0097186 | amelogenesis(GO:0097186) |
| 0.0 | 0.1 | GO:0061502 | early endosome to recycling endosome transport(GO:0061502) |
| 0.0 | 0.1 | GO:0051964 | negative regulation of synapse assembly(GO:0051964) |
| 0.0 | 0.9 | GO:0090398 | cellular senescence(GO:0090398) |
| 0.0 | 1.4 | GO:0045540 | regulation of cholesterol biosynthetic process(GO:0045540) |
| 0.0 | 1.2 | GO:0035914 | skeletal muscle cell differentiation(GO:0035914) |
| 0.0 | 0.4 | GO:0001502 | cartilage condensation(GO:0001502) |
| 0.0 | 1.4 | GO:0007077 | mitotic nuclear envelope disassembly(GO:0007077) |
| 0.0 | 1.3 | GO:0070126 | mitochondrial translational elongation(GO:0070125) mitochondrial translational termination(GO:0070126) |
| 0.0 | 0.9 | GO:0007270 | neuron-neuron synaptic transmission(GO:0007270) |
| 0.0 | 0.7 | GO:0031572 | G2 DNA damage checkpoint(GO:0031572) |
| 0.0 | 0.7 | GO:0009988 | cell-cell recognition(GO:0009988) |
| 0.0 | 0.1 | GO:0043985 | histone H4-R3 methylation(GO:0043985) |
| 0.0 | 0.3 | GO:0003334 | keratinocyte development(GO:0003334) |
| 0.0 | 0.3 | GO:0016180 | snRNA processing(GO:0016180) |
| 0.0 | 1.6 | GO:0050868 | negative regulation of T cell activation(GO:0050868) |
| 0.0 | 0.1 | GO:0098700 | neurotransmitter loading into synaptic vesicle(GO:0098700) |
| 0.0 | 0.4 | GO:0000042 | protein targeting to Golgi(GO:0000042) |
| 0.0 | 0.1 | GO:1902237 | positive regulation of endoplasmic reticulum stress-induced intrinsic apoptotic signaling pathway(GO:1902237) |
| 0.0 | 0.2 | GO:0015937 | coenzyme A biosynthetic process(GO:0015937) |
| 0.0 | 0.1 | GO:0097264 | self proteolysis(GO:0097264) |
| 0.0 | 0.2 | GO:0017121 | phospholipid scrambling(GO:0017121) |
| 0.0 | 0.4 | GO:0010863 | positive regulation of phospholipase C activity(GO:0010863) |
| 0.0 | 3.2 | GO:0006367 | transcription initiation from RNA polymerase II promoter(GO:0006367) |
| 0.0 | 1.8 | GO:0007156 | homophilic cell adhesion via plasma membrane adhesion molecules(GO:0007156) |
| 0.0 | 1.1 | GO:0007127 | meiosis I(GO:0007127) |
| 0.0 | 0.8 | GO:1902017 | regulation of cilium assembly(GO:1902017) |
| 0.0 | 0.2 | GO:0070932 | histone H3 deacetylation(GO:0070932) |
| 0.0 | 0.4 | GO:0031102 | neuron projection regeneration(GO:0031102) |
Gene overrepresentation in cellular_component category:
| Log-likelihood per target | Total log-likelihood | Term | Description |
|---|---|---|---|
| 1.7 | 7.0 | GO:0070695 | FHF complex(GO:0070695) |
| 0.7 | 2.0 | GO:0072534 | perineuronal net(GO:0072534) |
| 0.5 | 1.6 | GO:0030895 | apolipoprotein B mRNA editing enzyme complex(GO:0030895) |
| 0.5 | 3.3 | GO:0001520 | outer dense fiber(GO:0001520) |
| 0.5 | 1.4 | GO:0002079 | inner acrosomal membrane(GO:0002079) outer acrosomal membrane(GO:0002081) |
| 0.4 | 1.3 | GO:0034686 | integrin alphav-beta8 complex(GO:0034686) |
| 0.4 | 2.0 | GO:1902937 | inward rectifier potassium channel complex(GO:1902937) |
| 0.4 | 4.4 | GO:0016602 | CCAAT-binding factor complex(GO:0016602) |
| 0.4 | 3.1 | GO:0032593 | insulin-responsive compartment(GO:0032593) |
| 0.4 | 1.1 | GO:0008282 | ATP-sensitive potassium channel complex(GO:0008282) |
| 0.3 | 3.8 | GO:0005662 | DNA replication factor A complex(GO:0005662) |
| 0.3 | 0.8 | GO:0031213 | RSF complex(GO:0031213) |
| 0.2 | 2.9 | GO:1990909 | catenin complex(GO:0016342) Wnt signalosome(GO:1990909) |
| 0.2 | 2.1 | GO:1990907 | beta-catenin-TCF complex(GO:1990907) |
| 0.2 | 4.1 | GO:1990124 | messenger ribonucleoprotein complex(GO:1990124) |
| 0.2 | 1.9 | GO:0000125 | PCAF complex(GO:0000125) |
| 0.2 | 3.8 | GO:0005952 | cAMP-dependent protein kinase complex(GO:0005952) |
| 0.2 | 0.9 | GO:0031905 | early endosome lumen(GO:0031905) |
| 0.2 | 1.2 | GO:0032584 | growth cone membrane(GO:0032584) |
| 0.1 | 3.0 | GO:0044295 | axonal growth cone(GO:0044295) |
| 0.1 | 2.5 | GO:0033270 | paranode region of axon(GO:0033270) |
| 0.1 | 3.3 | GO:0008074 | guanylate cyclase complex, soluble(GO:0008074) |
| 0.1 | 0.4 | GO:1903349 | omegasome membrane(GO:1903349) |
| 0.1 | 1.2 | GO:0097197 | tetraspanin-enriched microdomain(GO:0097197) |
| 0.1 | 3.3 | GO:0032809 | neuronal cell body membrane(GO:0032809) cell body membrane(GO:0044298) |
| 0.1 | 1.1 | GO:0098799 | outer mitochondrial membrane protein complex(GO:0098799) |
| 0.1 | 0.9 | GO:0070776 | H3 histone acetyltransferase complex(GO:0070775) MOZ/MORF histone acetyltransferase complex(GO:0070776) |
| 0.1 | 0.6 | GO:0097129 | cyclin D2-CDK4 complex(GO:0097129) |
| 0.1 | 1.5 | GO:0043194 | axon initial segment(GO:0043194) |
| 0.1 | 0.6 | GO:0030121 | AP-1 adaptor complex(GO:0030121) |
| 0.1 | 3.5 | GO:0030660 | Golgi-associated vesicle membrane(GO:0030660) |
| 0.1 | 0.2 | GO:0032302 | MutSbeta complex(GO:0032302) |
| 0.1 | 1.8 | GO:0071564 | npBAF complex(GO:0071564) |
| 0.1 | 1.4 | GO:0031089 | platelet dense granule lumen(GO:0031089) |
| 0.1 | 2.4 | GO:0032040 | small-subunit processome(GO:0032040) |
| 0.1 | 0.6 | GO:0005587 | collagen type IV trimer(GO:0005587) |
| 0.1 | 2.1 | GO:0005720 | nuclear heterochromatin(GO:0005720) |
| 0.1 | 1.0 | GO:0032433 | filopodium tip(GO:0032433) |
| 0.1 | 2.0 | GO:0005680 | anaphase-promoting complex(GO:0005680) |
| 0.1 | 0.9 | GO:0005883 | neurofilament(GO:0005883) |
| 0.1 | 4.3 | GO:0031463 | Cul3-RING ubiquitin ligase complex(GO:0031463) |
| 0.1 | 0.3 | GO:0071546 | pi-body(GO:0071546) |
| 0.1 | 1.7 | GO:0035371 | microtubule plus-end(GO:0035371) |
| 0.1 | 0.8 | GO:0035102 | PRC1 complex(GO:0035102) |
| 0.1 | 2.0 | GO:0016592 | mediator complex(GO:0016592) |
| 0.1 | 1.0 | GO:0005832 | chaperonin-containing T-complex(GO:0005832) |
| 0.1 | 2.8 | GO:0031519 | PcG protein complex(GO:0031519) |
| 0.0 | 0.1 | GO:0071159 | NF-kappaB complex(GO:0071159) |
| 0.0 | 7.1 | GO:0030176 | integral component of endoplasmic reticulum membrane(GO:0030176) |
| 0.0 | 1.5 | GO:0071339 | MLL1/2 complex(GO:0044665) MLL1 complex(GO:0071339) |
| 0.0 | 4.1 | GO:0005758 | mitochondrial intermembrane space(GO:0005758) |
| 0.0 | 4.1 | GO:0000777 | condensed chromosome kinetochore(GO:0000777) |
| 0.0 | 0.3 | GO:0032039 | integrator complex(GO:0032039) |
| 0.0 | 0.9 | GO:0034451 | centriolar satellite(GO:0034451) |
| 0.0 | 1.9 | GO:0045171 | intercellular bridge(GO:0045171) |
| 0.0 | 2.6 | GO:0031672 | A band(GO:0031672) |
| 0.0 | 1.2 | GO:0005697 | telomerase holoenzyme complex(GO:0005697) |
| 0.0 | 0.4 | GO:0097136 | Bcl-2 family protein complex(GO:0097136) |
| 0.0 | 2.7 | GO:0031461 | cullin-RING ubiquitin ligase complex(GO:0031461) |
| 0.0 | 9.1 | GO:0099572 | postsynaptic density(GO:0014069) postsynaptic specialization(GO:0099572) |
| 0.0 | 4.8 | GO:0031225 | anchored component of membrane(GO:0031225) |
| 0.0 | 0.5 | GO:0030056 | hemidesmosome(GO:0030056) |
| 0.0 | 0.1 | GO:0033553 | rDNA heterochromatin(GO:0033553) |
| 0.0 | 1.9 | GO:0043195 | terminal bouton(GO:0043195) |
| 0.0 | 1.9 | GO:0005913 | cell-cell adherens junction(GO:0005913) |
| 0.0 | 1.5 | GO:0001669 | acrosomal vesicle(GO:0001669) |
| 0.0 | 2.0 | GO:0030175 | filopodium(GO:0030175) |
| 0.0 | 1.5 | GO:0000123 | histone acetyltransferase complex(GO:0000123) |
| 0.0 | 1.9 | GO:0097517 | stress fiber(GO:0001725) contractile actin filament bundle(GO:0097517) |
| 0.0 | 0.4 | GO:0035145 | exon-exon junction complex(GO:0035145) |
| 0.0 | 1.9 | GO:0019866 | mitochondrial inner membrane(GO:0005743) organelle inner membrane(GO:0019866) |
| 0.0 | 1.1 | GO:0060170 | ciliary membrane(GO:0060170) |
| 0.0 | 6.3 | GO:0015629 | actin cytoskeleton(GO:0015629) |
| 0.0 | 1.1 | GO:0005903 | brush border(GO:0005903) |
| 0.0 | 0.5 | GO:0005871 | kinesin complex(GO:0005871) |
Gene overrepresentation in molecular_function category:
| Log-likelihood per target | Total log-likelihood | Term | Description |
|---|---|---|---|
| 1.2 | 7.3 | GO:0010858 | calcium-dependent protein kinase regulator activity(GO:0010858) |
| 1.2 | 3.5 | GO:0008330 | protein tyrosine/threonine phosphatase activity(GO:0008330) |
| 0.8 | 2.4 | GO:1904455 | ubiquitin-specific protease activity involved in negative regulation of ERAD pathway(GO:1904455) |
| 0.8 | 2.3 | GO:0008321 | Ral guanyl-nucleotide exchange factor activity(GO:0008321) |
| 0.6 | 2.6 | GO:0001025 | RNA polymerase III transcription factor binding(GO:0001025) |
| 0.5 | 1.5 | GO:0045322 | unmethylated CpG binding(GO:0045322) |
| 0.4 | 1.8 | GO:0001588 | dopamine neurotransmitter receptor activity, coupled via Gs(GO:0001588) |
| 0.4 | 2.4 | GO:0034511 | U3 snoRNA binding(GO:0034511) |
| 0.4 | 2.0 | GO:0004687 | myosin light chain kinase activity(GO:0004687) |
| 0.4 | 1.9 | GO:0004468 | lysine N-acetyltransferase activity, acting on acetyl phosphate as donor(GO:0004468) |
| 0.4 | 1.1 | GO:0017098 | sulfonylurea receptor binding(GO:0017098) |
| 0.3 | 2.1 | GO:0008440 | inositol-1,4,5-trisphosphate 3-kinase activity(GO:0008440) |
| 0.3 | 1.3 | GO:0016900 | oxidoreductase activity, acting on the CH-OH group of donors, disulfide as acceptor(GO:0016900) vitamin-K-epoxide reductase (warfarin-sensitive) activity(GO:0047057) |
| 0.3 | 5.2 | GO:0035925 | mRNA 3'-UTR AU-rich region binding(GO:0035925) |
| 0.3 | 8.4 | GO:0005086 | ARF guanyl-nucleotide exchange factor activity(GO:0005086) |
| 0.3 | 1.2 | GO:0004735 | pyrroline-5-carboxylate reductase activity(GO:0004735) |
| 0.3 | 2.0 | GO:0003828 | alpha-N-acetylneuraminate alpha-2,8-sialyltransferase activity(GO:0003828) |
| 0.3 | 5.5 | GO:0045295 | gamma-catenin binding(GO:0045295) |
| 0.3 | 1.3 | GO:1990430 | extracellular matrix protein binding(GO:1990430) |
| 0.2 | 3.8 | GO:0004691 | cAMP-dependent protein kinase activity(GO:0004691) |
| 0.2 | 3.0 | GO:0005344 | oxygen transporter activity(GO:0005344) |
| 0.2 | 3.1 | GO:0055056 | D-glucose transmembrane transporter activity(GO:0055056) |
| 0.2 | 0.6 | GO:0004939 | beta-adrenergic receptor activity(GO:0004939) |
| 0.2 | 1.4 | GO:0050682 | AF-2 domain binding(GO:0050682) |
| 0.2 | 1.0 | GO:0046974 | histone methyltransferase activity (H3-K9 specific)(GO:0046974) |
| 0.2 | 0.6 | GO:0016309 | 1-phosphatidylinositol-5-phosphate 4-kinase activity(GO:0016309) |
| 0.2 | 1.6 | GO:0005250 | A-type (transient outward) potassium channel activity(GO:0005250) |
| 0.2 | 2.5 | GO:0003836 | beta-galactoside (CMP) alpha-2,3-sialyltransferase activity(GO:0003836) |
| 0.2 | 0.8 | GO:0004740 | pyruvate dehydrogenase (acetyl-transferring) kinase activity(GO:0004740) |
| 0.2 | 1.1 | GO:1990829 | C-rich single-stranded DNA binding(GO:1990829) |
| 0.2 | 1.3 | GO:0071532 | ankyrin repeat binding(GO:0071532) |
| 0.2 | 4.7 | GO:0051959 | dynein light intermediate chain binding(GO:0051959) |
| 0.2 | 3.0 | GO:0005068 | transmembrane receptor protein tyrosine kinase adaptor activity(GO:0005068) |
| 0.2 | 4.5 | GO:0004708 | MAP kinase kinase activity(GO:0004708) |
| 0.1 | 1.0 | GO:0008142 | oxysterol binding(GO:0008142) |
| 0.1 | 3.6 | GO:0005251 | delayed rectifier potassium channel activity(GO:0005251) |
| 0.1 | 1.2 | GO:0003720 | telomerase activity(GO:0003720) RNA-directed DNA polymerase activity(GO:0003964) |
| 0.1 | 3.3 | GO:0004383 | guanylate cyclase activity(GO:0004383) |
| 0.1 | 3.1 | GO:0070006 | metalloaminopeptidase activity(GO:0070006) |
| 0.1 | 3.0 | GO:0030676 | Rac guanyl-nucleotide exchange factor activity(GO:0030676) |
| 0.1 | 4.5 | GO:0001103 | RNA polymerase II repressing transcription factor binding(GO:0001103) |
| 0.1 | 2.3 | GO:0035497 | cAMP response element binding(GO:0035497) |
| 0.1 | 1.2 | GO:0001135 | transcription factor activity, RNA polymerase II transcription factor recruiting(GO:0001135) |
| 0.1 | 0.3 | GO:0015189 | L-lysine transmembrane transporter activity(GO:0015189) |
| 0.1 | 0.8 | GO:0004957 | prostaglandin E receptor activity(GO:0004957) |
| 0.1 | 1.5 | GO:0035612 | AP-2 adaptor complex binding(GO:0035612) |
| 0.1 | 1.5 | GO:0019707 | protein-cysteine S-palmitoyltransferase activity(GO:0019706) protein-cysteine S-acyltransferase activity(GO:0019707) |
| 0.1 | 2.8 | GO:0005104 | fibroblast growth factor receptor binding(GO:0005104) |
| 0.1 | 0.3 | GO:0051185 | coenzyme transporter activity(GO:0051185) |
| 0.1 | 1.4 | GO:0031957 | very long-chain fatty acid-CoA ligase activity(GO:0031957) |
| 0.1 | 1.9 | GO:0072349 | modified amino acid transmembrane transporter activity(GO:0072349) |
| 0.1 | 2.8 | GO:0043014 | alpha-tubulin binding(GO:0043014) |
| 0.1 | 2.0 | GO:0050998 | nitric-oxide synthase binding(GO:0050998) |
| 0.1 | 2.9 | GO:0070888 | E-box binding(GO:0070888) |
| 0.1 | 2.3 | GO:0008191 | metalloendopeptidase inhibitor activity(GO:0008191) |
| 0.1 | 1.2 | GO:0070679 | inositol 1,4,5 trisphosphate binding(GO:0070679) |
| 0.1 | 1.5 | GO:0003688 | DNA replication origin binding(GO:0003688) |
| 0.1 | 0.6 | GO:0072542 | protein phosphatase activator activity(GO:0072542) |
| 0.1 | 1.7 | GO:0035259 | glucocorticoid receptor binding(GO:0035259) |
| 0.1 | 0.2 | GO:0032181 | heteroduplex DNA loop binding(GO:0000404) double-strand/single-strand DNA junction binding(GO:0000406) dinucleotide repeat insertion binding(GO:0032181) |
| 0.1 | 0.5 | GO:0050733 | RS domain binding(GO:0050733) |
| 0.1 | 0.8 | GO:0005021 | vascular endothelial growth factor-activated receptor activity(GO:0005021) |
| 0.1 | 1.1 | GO:0004716 | receptor signaling protein tyrosine kinase activity(GO:0004716) |
| 0.1 | 1.5 | GO:1905030 | voltage-gated sodium channel activity(GO:0005248) voltage-gated ion channel activity involved in regulation of postsynaptic membrane potential(GO:1905030) |
| 0.1 | 0.4 | GO:0004882 | androgen receptor activity(GO:0004882) |
| 0.1 | 1.3 | GO:1990841 | promoter-specific chromatin binding(GO:1990841) |
| 0.1 | 0.6 | GO:0030346 | protein phosphatase 2B binding(GO:0030346) |
| 0.1 | 3.4 | GO:0070491 | repressing transcription factor binding(GO:0070491) |
| 0.1 | 0.8 | GO:0097371 | MDM2/MDM4 family protein binding(GO:0097371) |
| 0.1 | 1.0 | GO:0042813 | Wnt-activated receptor activity(GO:0042813) |
| 0.1 | 0.2 | GO:0051139 | metal ion:proton antiporter activity(GO:0051139) |
| 0.1 | 1.9 | GO:0018024 | histone-lysine N-methyltransferase activity(GO:0018024) |
| 0.1 | 0.2 | GO:0004594 | pantothenate kinase activity(GO:0004594) |
| 0.1 | 0.5 | GO:0003847 | 1-alkyl-2-acetylglycerophosphocholine esterase activity(GO:0003847) |
| 0.1 | 0.8 | GO:0052629 | phosphatidylinositol-3,5-bisphosphate 3-phosphatase activity(GO:0052629) |
| 0.1 | 16.3 | GO:0001227 | transcriptional repressor activity, RNA polymerase II transcription regulatory region sequence-specific binding(GO:0001227) |
| 0.1 | 3.4 | GO:0030374 | ligand-dependent nuclear receptor transcription coactivator activity(GO:0030374) |
| 0.1 | 1.1 | GO:0050321 | tau-protein kinase activity(GO:0050321) |
| 0.0 | 2.2 | GO:0030507 | spectrin binding(GO:0030507) |
| 0.0 | 1.8 | GO:1990939 | ATP-dependent microtubule motor activity(GO:1990939) |
| 0.0 | 1.2 | GO:0043015 | gamma-tubulin binding(GO:0043015) |
| 0.0 | 0.6 | GO:0086080 | protein binding involved in heterotypic cell-cell adhesion(GO:0086080) |
| 0.0 | 2.0 | GO:0004712 | protein serine/threonine/tyrosine kinase activity(GO:0004712) |
| 0.0 | 1.4 | GO:0003950 | NAD+ ADP-ribosyltransferase activity(GO:0003950) |
| 0.0 | 0.4 | GO:0008020 | G-protein coupled photoreceptor activity(GO:0008020) |
| 0.0 | 0.5 | GO:0038132 | neuregulin binding(GO:0038132) |
| 0.0 | 0.2 | GO:0017128 | phospholipid scramblase activity(GO:0017128) |
| 0.0 | 2.3 | GO:0002039 | p53 binding(GO:0002039) |
| 0.0 | 1.4 | GO:0048306 | calcium-dependent protein binding(GO:0048306) |
| 0.0 | 2.6 | GO:0001046 | core promoter sequence-specific DNA binding(GO:0001046) |
| 0.0 | 0.2 | GO:0015386 | sodium:proton antiporter activity(GO:0015385) potassium:proton antiporter activity(GO:0015386) |
| 0.0 | 1.0 | GO:0044183 | protein binding involved in protein folding(GO:0044183) |
| 0.0 | 1.4 | GO:0035064 | methylated histone binding(GO:0035064) |
| 0.0 | 0.8 | GO:0031210 | phosphatidylcholine binding(GO:0031210) |
| 0.0 | 7.7 | GO:0001077 | transcriptional activator activity, RNA polymerase II core promoter proximal region sequence-specific binding(GO:0001077) |
| 0.0 | 0.9 | GO:0004402 | histone acetyltransferase activity(GO:0004402) peptide-lysine-N-acetyltransferase activity(GO:0061733) |
| 0.0 | 1.6 | GO:0003730 | mRNA 3'-UTR binding(GO:0003730) |
| 0.0 | 9.1 | GO:0004842 | ubiquitin-protein transferase activity(GO:0004842) |
| 0.0 | 1.5 | GO:0008186 | ATP-dependent RNA helicase activity(GO:0004004) RNA-dependent ATPase activity(GO:0008186) |
| 0.0 | 4.4 | GO:0051015 | actin filament binding(GO:0051015) |
| 0.0 | 1.7 | GO:0005262 | calcium channel activity(GO:0005262) |
| 0.0 | 0.6 | GO:0005540 | hyaluronic acid binding(GO:0005540) |
| 0.0 | 0.1 | GO:1990226 | histone methyltransferase binding(GO:1990226) |
| 0.0 | 0.8 | GO:0008028 | monocarboxylic acid transmembrane transporter activity(GO:0008028) |
| 0.0 | 0.1 | GO:0004198 | calcium-dependent cysteine-type endopeptidase activity(GO:0004198) |
| 0.0 | 1.9 | GO:0001228 | transcriptional activator activity, RNA polymerase II transcription regulatory region sequence-specific binding(GO:0001228) |
| 0.0 | 4.7 | GO:0005096 | GTPase activator activity(GO:0005096) |
| 0.0 | 8.8 | GO:0001071 | nucleic acid binding transcription factor activity(GO:0001071) transcription factor activity, sequence-specific DNA binding(GO:0003700) |
| 0.0 | 0.4 | GO:0042162 | telomeric DNA binding(GO:0042162) |
| 0.0 | 0.1 | GO:0008046 | axon guidance receptor activity(GO:0008046) |
Gene overrepresentation in C2:CP category:
| Log-likelihood per target | Total log-likelihood | Term | Description |
|---|---|---|---|
| 0.2 | 2.3 | ST PAC1 RECEPTOR PATHWAY | PAC1 Receptor Pathway |
| 0.2 | 2.6 | PID RANBP2 PATHWAY | Sumoylation by RanBP2 regulates transcriptional repression |
| 0.2 | 0.5 | PID PDGFRA PATHWAY | PDGFR-alpha signaling pathway |
| 0.1 | 7.1 | SIG REGULATION OF THE ACTIN CYTOSKELETON BY RHO GTPASES | Genes related to regulation of the actin cytoskeleton |
| 0.1 | 3.5 | ST MYOCYTE AD PATHWAY | Myocyte Adrenergic Pathway is a specific case of the generalized Adrenergic Pathway. |
| 0.1 | 3.1 | PID IL3 PATHWAY | IL3-mediated signaling events |
| 0.1 | 3.0 | SA PTEN PATHWAY | PTEN is a tumor suppressor that dephosphorylates the lipid messenger phosphatidylinositol triphosphate. |
| 0.1 | 4.9 | PID NETRIN PATHWAY | Netrin-mediated signaling events |
| 0.1 | 1.1 | PID EPHA2 FWD PATHWAY | EPHA2 forward signaling |
| 0.1 | 8.2 | PID AR TF PATHWAY | Regulation of Androgen receptor activity |
| 0.1 | 0.8 | PID VEGF VEGFR PATHWAY | VEGF and VEGFR signaling network |
| 0.1 | 4.4 | PID ARF6 PATHWAY | Arf6 signaling events |
| 0.1 | 1.8 | PID LPA4 PATHWAY | LPA4-mediated signaling events |
| 0.1 | 3.7 | PID AURORA A PATHWAY | Aurora A signaling |
| 0.1 | 2.8 | PID INSULIN GLUCOSE PATHWAY | Insulin-mediated glucose transport |
| 0.1 | 1.2 | PID HIF1A PATHWAY | Hypoxic and oxygen homeostasis regulation of HIF-1-alpha |
| 0.1 | 1.7 | PID P38 MKK3 6PATHWAY | p38 MAPK signaling pathway |
| 0.1 | 3.1 | PID FGF PATHWAY | FGF signaling pathway |
| 0.0 | 3.5 | PID CD8 TCR PATHWAY | TCR signaling in naïve CD8+ T cells |
| 0.0 | 0.8 | PID TXA2PATHWAY | Thromboxane A2 receptor signaling |
| 0.0 | 1.8 | PID INTEGRIN CS PATHWAY | Integrin family cell surface interactions |
| 0.0 | 1.1 | PID ERBB NETWORK PATHWAY | ErbB receptor signaling network |
| 0.0 | 0.7 | PID HIF2PATHWAY | HIF-2-alpha transcription factor network |
| 0.0 | 0.9 | PID TOLL ENDOGENOUS PATHWAY | Endogenous TLR signaling |
| 0.0 | 0.6 | NABA BASEMENT MEMBRANES | Genes encoding structural components of basement membranes |
| 0.0 | 2.4 | PID ERA GENOMIC PATHWAY | Validated nuclear estrogen receptor alpha network |
| 0.0 | 6.2 | NABA ECM GLYCOPROTEINS | Genes encoding structural ECM glycoproteins |
| 0.0 | 0.6 | PID P38 MK2 PATHWAY | p38 signaling mediated by MAPKAP kinases |
| 0.0 | 0.5 | SA PROGRAMMED CELL DEATH | Programmed cell death, or apoptosis, eliminates damaged or unneeded cells. |
| 0.0 | 1.3 | PID NFAT TFPATHWAY | Calcineurin-regulated NFAT-dependent transcription in lymphocytes |
| 0.0 | 1.3 | PID ILK PATHWAY | Integrin-linked kinase signaling |
| 0.0 | 0.9 | PID ERBB1 DOWNSTREAM PATHWAY | ErbB1 downstream signaling |
| 0.0 | 0.6 | PID IL2 STAT5 PATHWAY | IL2 signaling events mediated by STAT5 |
| 0.0 | 0.5 | PID WNT SIGNALING PATHWAY | Wnt signaling network |
| 0.0 | 2.1 | PID CMYB PATHWAY | C-MYB transcription factor network |
| 0.0 | 0.9 | PID AJDISS 2PATHWAY | Posttranslational regulation of adherens junction stability and dissassembly |
| 0.0 | 0.3 | PID TCR CALCIUM PATHWAY | Calcium signaling in the CD4+ TCR pathway |
| 0.0 | 0.6 | PID TNF PATHWAY | TNF receptor signaling pathway |
| 0.0 | 0.6 | NABA PROTEOGLYCANS | Genes encoding proteoglycans |
| 0.0 | 0.5 | PID IL4 2PATHWAY | IL4-mediated signaling events |
| 0.0 | 1.1 | PID MYC REPRESS PATHWAY | Validated targets of C-MYC transcriptional repression |
| 0.0 | 0.2 | PID P38 ALPHA BETA DOWNSTREAM PATHWAY | Signaling mediated by p38-alpha and p38-beta |
Gene overrepresentation in C2:CP:REACTOME category:
| Log-likelihood per target | Total log-likelihood | Term | Description |
|---|---|---|---|
| 0.3 | 4.4 | REACTOME ACTIVATION OF CHAPERONE GENES BY ATF6 ALPHA | Genes involved in Activation of Chaperone Genes by ATF6-alpha |
| 0.2 | 3.3 | REACTOME MRNA DECAY BY 5 TO 3 EXORIBONUCLEASE | Genes involved in mRNA Decay by 5' to 3' Exoribonuclease |
| 0.2 | 1.6 | REACTOME SYNTHESIS OF PIPS AT THE LATE ENDOSOME MEMBRANE | Genes involved in Synthesis of PIPs at the late endosome membrane |
| 0.2 | 0.8 | REACTOME VEGF LIGAND RECEPTOR INTERACTIONS | Genes involved in VEGF ligand-receptor interactions |
| 0.2 | 3.0 | REACTOME THE NLRP3 INFLAMMASOME | Genes involved in The NLRP3 inflammasome |
| 0.1 | 3.1 | REACTOME FACILITATIVE NA INDEPENDENT GLUCOSE TRANSPORTERS | Genes involved in Facilitative Na+-independent glucose transporters |
| 0.1 | 1.6 | REACTOME NOTCH HLH TRANSCRIPTION PATHWAY | Genes involved in Notch-HLH transcription pathway |
| 0.1 | 2.5 | REACTOME TERMINATION OF O GLYCAN BIOSYNTHESIS | Genes involved in Termination of O-glycan biosynthesis |
| 0.1 | 3.8 | REACTOME HORMONE SENSITIVE LIPASE HSL MEDIATED TRIACYLGLYCEROL HYDROLYSIS | Genes involved in Hormone-sensitive lipase (HSL)-mediated triacylglycerol hydrolysis |
| 0.1 | 1.0 | REACTOME IRAK2 MEDIATED ACTIVATION OF TAK1 COMPLEX UPON TLR7 8 OR 9 STIMULATION | Genes involved in IRAK2 mediated activation of TAK1 complex upon TLR7/8 or 9 stimulation |
| 0.1 | 5.1 | REACTOME VOLTAGE GATED POTASSIUM CHANNELS | Genes involved in Voltage gated Potassium channels |
| 0.1 | 2.2 | REACTOME N GLYCAN ANTENNAE ELONGATION | Genes involved in N-Glycan antennae elongation |
| 0.1 | 1.3 | REACTOME SIGNALING BY FGFR3 MUTANTS | Genes involved in Signaling by FGFR3 mutants |
| 0.1 | 2.6 | REACTOME PHOSPHORYLATION OF CD3 AND TCR ZETA CHAINS | Genes involved in Phosphorylation of CD3 and TCR zeta chains |
| 0.1 | 0.9 | REACTOME ENDOSOMAL VACUOLAR PATHWAY | Genes involved in Endosomal/Vacuolar pathway |
| 0.1 | 4.7 | REACTOME NOTCH1 INTRACELLULAR DOMAIN REGULATES TRANSCRIPTION | Genes involved in NOTCH1 Intracellular Domain Regulates Transcription |
| 0.1 | 0.9 | REACTOME CDC6 ASSOCIATION WITH THE ORC ORIGIN COMPLEX | Genes involved in CDC6 association with the ORC:origin complex |
| 0.1 | 0.8 | REACTOME PROSTANOID LIGAND RECEPTORS | Genes involved in Prostanoid ligand receptors |
| 0.1 | 1.8 | REACTOME CTNNB1 PHOSPHORYLATION CASCADE | Genes involved in Beta-catenin phosphorylation cascade |
| 0.1 | 4.3 | REACTOME NRAGE SIGNALS DEATH THROUGH JNK | Genes involved in NRAGE signals death through JNK |
| 0.1 | 1.3 | REACTOME YAP1 AND WWTR1 TAZ STIMULATED GENE EXPRESSION | Genes involved in YAP1- and WWTR1 (TAZ)-stimulated gene expression |
| 0.1 | 1.3 | REACTOME CIRCADIAN REPRESSION OF EXPRESSION BY REV ERBA | Genes involved in Circadian Repression of Expression by REV-ERBA |
| 0.1 | 3.3 | REACTOME NITRIC OXIDE STIMULATES GUANYLATE CYCLASE | Genes involved in Nitric oxide stimulates guanylate cyclase |
| 0.1 | 2.4 | REACTOME AMINE LIGAND BINDING RECEPTORS | Genes involved in Amine ligand-binding receptors |
| 0.0 | 0.8 | REACTOME REGULATION OF PYRUVATE DEHYDROGENASE PDH COMPLEX | Genes involved in Regulation of pyruvate dehydrogenase (PDH) complex |
| 0.0 | 1.1 | REACTOME SHC1 EVENTS IN ERBB4 SIGNALING | Genes involved in SHC1 events in ERBB4 signaling |
| 0.0 | 1.3 | REACTOME REGULATION OF GENE EXPRESSION IN BETA CELLS | Genes involved in Regulation of gene expression in beta cells |
| 0.0 | 0.9 | REACTOME P38MAPK EVENTS | Genes involved in p38MAPK events |
| 0.0 | 0.4 | REACTOME OPSINS | Genes involved in Opsins |
| 0.0 | 1.2 | REACTOME SMAD2 SMAD3 SMAD4 HETEROTRIMER REGULATES TRANSCRIPTION | Genes involved in SMAD2/SMAD3:SMAD4 heterotrimer regulates transcription |
| 0.0 | 1.2 | REACTOME INTERACTION BETWEEN L1 AND ANKYRINS | Genes involved in Interaction between L1 and Ankyrins |
| 0.0 | 1.2 | REACTOME TRAF6 MEDIATED NFKB ACTIVATION | Genes involved in TRAF6 mediated NF-kB activation |
| 0.0 | 2.9 | REACTOME NUCLEAR RECEPTOR TRANSCRIPTION PATHWAY | Genes involved in Nuclear Receptor transcription pathway |
| 0.0 | 0.5 | REACTOME SLBP DEPENDENT PROCESSING OF REPLICATION DEPENDENT HISTONE PRE MRNAS | Genes involved in SLBP Dependent Processing of Replication-Dependent Histone Pre-mRNAs |
| 0.0 | 1.2 | REACTOME NEGATIVE REGULATION OF FGFR SIGNALING | Genes involved in Negative regulation of FGFR signaling |
| 0.0 | 2.0 | REACTOME SMOOTH MUSCLE CONTRACTION | Genes involved in Smooth Muscle Contraction |
| 0.0 | 0.9 | REACTOME SIGNALING BY NODAL | Genes involved in Signaling by NODAL |
| 0.0 | 2.4 | REACTOME NCAM SIGNALING FOR NEURITE OUT GROWTH | Genes involved in NCAM signaling for neurite out-growth |
| 0.0 | 2.1 | REACTOME APOPTOTIC CLEAVAGE OF CELLULAR PROTEINS | Genes involved in Apoptotic cleavage of cellular proteins |
| 0.0 | 1.1 | REACTOME INWARDLY RECTIFYING K CHANNELS | Genes involved in Inwardly rectifying K+ channels |
| 0.0 | 0.9 | REACTOME SIGNALING BY ROBO RECEPTOR | Genes involved in Signaling by Robo receptor |
| 0.0 | 1.7 | REACTOME PPARA ACTIVATES GENE EXPRESSION | Genes involved in PPARA Activates Gene Expression |
| 0.0 | 0.2 | REACTOME VITAMIN B5 PANTOTHENATE METABOLISM | Genes involved in Vitamin B5 (pantothenate) metabolism |
| 0.0 | 1.1 | REACTOME ACTIVATION OF CHAPERONE GENES BY XBP1S | Genes involved in Activation of Chaperone Genes by XBP1(S) |
| 0.0 | 0.9 | REACTOME INTEGRIN CELL SURFACE INTERACTIONS | Genes involved in Integrin cell surface interactions |
| 0.0 | 0.6 | REACTOME TRAFFICKING OF AMPA RECEPTORS | Genes involved in Trafficking of AMPA receptors |
| 0.0 | 2.0 | REACTOME GENERIC TRANSCRIPTION PATHWAY | Genes involved in Generic Transcription Pathway |