Project
GNF SymAtlas + NCI-60 cancer cell lines, comparison of cancers vs non-cancers, human (Su, 2004; Ross, 2000)
Navigation
Downloads
Results for ACUGCAU
Z-value: 1.04
Motif logo

miRNA associated with seed ACUGCAU
| Name | miRBASE accession |
|---|---|
|
hsa-miR-217
|
MIMAT0000274 |
|
hsa-miR-6807-3p
|
MIMAT0027515 |
Activity profile of ACUGCAU motif
Sorted Z-values of ACUGCAU motif
| Promoter | Log-likelihood | Transcript | Gene | Gene Info |
|---|---|---|---|---|
| chr12_-_109125285 | 9.73 |
ENST00000552871.1
ENST00000261401.3 |
CORO1C
|
coronin, actin binding protein, 1C |
| chr9_+_112810878 | 7.50 |
ENST00000434623.2
ENST00000374525.1 |
AKAP2
|
A kinase (PRKA) anchor protein 2 |
| chr10_-_27443155 | 7.19 |
ENST00000427324.1
ENST00000326799.3 |
YME1L1
|
YME1-like 1 ATPase |
| chr9_+_112542572 | 6.79 |
ENST00000374530.3
|
PALM2-AKAP2
|
PALM2-AKAP2 readthrough |
| chr9_+_110045537 | 6.32 |
ENST00000358015.3
|
RAD23B
|
RAD23 homolog B (S. cerevisiae) |
| chr12_-_31479045 | 6.28 |
ENST00000539409.1
ENST00000395766.1 |
FAM60A
|
family with sequence similarity 60, member A |
| chr8_-_103876965 | 6.13 |
ENST00000337198.5
|
AZIN1
|
antizyme inhibitor 1 |
| chr10_+_54074033 | 5.55 |
ENST00000373970.3
|
DKK1
|
dickkopf WNT signaling pathway inhibitor 1 |
| chr2_+_235860616 | 5.43 |
ENST00000392011.2
|
SH3BP4
|
SH3-domain binding protein 4 |
| chr15_-_101792137 | 5.33 |
ENST00000254190.3
|
CHSY1
|
chondroitin sulfate synthase 1 |
| chr15_+_57210818 | 4.99 |
ENST00000438423.2
ENST00000267811.5 ENST00000452095.2 ENST00000559609.1 ENST00000333725.5 |
TCF12
|
transcription factor 12 |
| chr1_-_225840747 | 4.83 |
ENST00000366843.2
ENST00000366844.3 |
ENAH
|
enabled homolog (Drosophila) |
| chr20_+_43514315 | 4.75 |
ENST00000353703.4
|
YWHAB
|
tyrosine 3-monooxygenase/tryptophan 5-monooxygenase activation protein, beta |
| chr12_+_69004619 | 4.54 |
ENST00000250559.9
ENST00000393436.5 ENST00000425247.2 ENST00000489473.2 ENST00000422358.2 ENST00000541167.1 ENST00000538283.1 ENST00000341355.5 ENST00000537460.1 ENST00000450214.2 ENST00000545270.1 ENST00000538980.1 ENST00000542018.1 ENST00000543393.1 |
RAP1B
|
RAP1B, member of RAS oncogene family |
| chr4_-_76598296 | 4.31 |
ENST00000395719.3
|
G3BP2
|
GTPase activating protein (SH3 domain) binding protein 2 |
| chr1_-_70671216 | 4.27 |
ENST00000370952.3
|
LRRC40
|
leucine rich repeat containing 40 |
| chr4_-_69215699 | 4.09 |
ENST00000510746.1
ENST00000344157.4 ENST00000355665.3 |
YTHDC1
|
YTH domain containing 1 |
| chr6_-_99797522 | 3.92 |
ENST00000389677.5
|
FAXC
|
failed axon connections homolog (Drosophila) |
| chr12_-_92539614 | 3.74 |
ENST00000256015.3
|
BTG1
|
B-cell translocation gene 1, anti-proliferative |
| chr3_-_160283348 | 3.72 |
ENST00000334256.4
|
KPNA4
|
karyopherin alpha 4 (importin alpha 3) |
| chr2_+_99953816 | 3.60 |
ENST00000289371.6
|
EIF5B
|
eukaryotic translation initiation factor 5B |
| chr10_-_5855350 | 3.55 |
ENST00000456041.1
ENST00000380181.3 ENST00000418688.1 ENST00000380132.4 ENST00000609712.1 ENST00000380191.4 |
GDI2
|
GDP dissociation inhibitor 2 |
| chr10_-_98346801 | 3.54 |
ENST00000371142.4
|
TM9SF3
|
transmembrane 9 superfamily member 3 |
| chr5_-_133304473 | 3.50 |
ENST00000231512.3
|
C5orf15
|
chromosome 5 open reading frame 15 |
| chr3_-_79068594 | 3.28 |
ENST00000436010.2
|
ROBO1
|
roundabout, axon guidance receptor, homolog 1 (Drosophila) |
| chr19_+_41768401 | 3.25 |
ENST00000352456.3
ENST00000595018.1 ENST00000597725.1 |
HNRNPUL1
|
heterogeneous nuclear ribonucleoprotein U-like 1 |
| chr9_+_33025209 | 3.09 |
ENST00000330899.4
ENST00000544625.1 |
DNAJA1
|
DnaJ (Hsp40) homolog, subfamily A, member 1 |
| chr8_+_98656336 | 3.02 |
ENST00000336273.3
|
MTDH
|
metadherin |
| chr17_-_60142609 | 3.02 |
ENST00000397786.2
|
MED13
|
mediator complex subunit 13 |
| chr5_-_137911049 | 2.80 |
ENST00000297185.3
|
HSPA9
|
heat shock 70kDa protein 9 (mortalin) |
| chr6_+_111195973 | 2.76 |
ENST00000368885.3
ENST00000368882.3 ENST00000451850.2 ENST00000368877.5 |
AMD1
|
adenosylmethionine decarboxylase 1 |
| chr12_+_104359576 | 2.70 |
ENST00000392872.3
ENST00000436021.2 |
TDG
|
thymine-DNA glycosylase |
| chr16_-_66785699 | 2.65 |
ENST00000258198.2
|
DYNC1LI2
|
dynein, cytoplasmic 1, light intermediate chain 2 |
| chr6_+_64281906 | 2.52 |
ENST00000370651.3
|
PTP4A1
|
protein tyrosine phosphatase type IVA, member 1 |
| chr5_+_112312416 | 2.48 |
ENST00000389063.2
|
DCP2
|
decapping mRNA 2 |
| chr3_+_155588300 | 2.41 |
ENST00000496455.2
|
GMPS
|
guanine monphosphate synthase |
| chr17_+_30677136 | 2.23 |
ENST00000394670.4
ENST00000321233.6 ENST00000394673.2 ENST00000341711.6 ENST00000579634.1 ENST00000580759.1 ENST00000342555.6 ENST00000577908.1 ENST00000394679.5 ENST00000582165.1 |
ZNF207
|
zinc finger protein 207 |
| chr7_-_26240357 | 2.18 |
ENST00000354667.4
ENST00000356674.7 |
HNRNPA2B1
|
heterogeneous nuclear ribonucleoprotein A2/B1 |
| chr1_-_244615425 | 2.16 |
ENST00000366535.3
|
ADSS
|
adenylosuccinate synthase |
| chr3_+_180630090 | 2.12 |
ENST00000357559.4
ENST00000305586.7 |
FXR1
|
fragile X mental retardation, autosomal homolog 1 |
| chr1_+_93544791 | 2.04 |
ENST00000545708.1
ENST00000540243.1 ENST00000370298.4 |
MTF2
|
metal response element binding transcription factor 2 |
| chr18_-_18691739 | 1.99 |
ENST00000399799.2
|
ROCK1
|
Rho-associated, coiled-coil containing protein kinase 1 |
| chr17_+_60536002 | 1.97 |
ENST00000582809.1
|
TLK2
|
tousled-like kinase 2 |
| chr6_+_119215308 | 1.94 |
ENST00000229595.5
|
ASF1A
|
anti-silencing function 1A histone chaperone |
| chr12_-_76478686 | 1.93 |
ENST00000261182.8
|
NAP1L1
|
nucleosome assembly protein 1-like 1 |
| chr15_+_41709302 | 1.86 |
ENST00000389629.4
|
RTF1
|
Rtf1, Paf1/RNA polymerase II complex component, homolog (S. cerevisiae) |
| chr17_-_18266797 | 1.84 |
ENST00000316694.3
ENST00000539052.1 |
SHMT1
|
serine hydroxymethyltransferase 1 (soluble) |
| chr5_+_151151471 | 1.73 |
ENST00000394123.3
ENST00000543466.1 |
G3BP1
|
GTPase activating protein (SH3 domain) binding protein 1 |
| chr5_-_127873659 | 1.72 |
ENST00000262464.4
|
FBN2
|
fibrillin 2 |
| chr10_+_89622870 | 1.69 |
ENST00000371953.3
|
PTEN
|
phosphatase and tensin homolog |
| chr12_+_123237321 | 1.68 |
ENST00000280557.6
ENST00000455982.2 |
DENR
|
density-regulated protein |
| chr9_-_95055956 | 1.68 |
ENST00000375629.3
ENST00000447699.2 ENST00000375643.3 ENST00000395554.3 |
IARS
|
isoleucyl-tRNA synthetase |
| chr17_+_30264014 | 1.64 |
ENST00000322652.5
ENST00000580398.1 |
SUZ12
|
SUZ12 polycomb repressive complex 2 subunit |
| chr2_+_228336849 | 1.57 |
ENST00000409979.2
ENST00000310078.8 |
AGFG1
|
ArfGAP with FG repeats 1 |
| chr2_+_28974668 | 1.57 |
ENST00000296122.6
ENST00000395366.2 |
PPP1CB
|
protein phosphatase 1, catalytic subunit, beta isozyme |
| chr1_+_27022485 | 1.52 |
ENST00000324856.7
|
ARID1A
|
AT rich interactive domain 1A (SWI-like) |
| chrX_-_134049262 | 1.52 |
ENST00000370783.3
|
MOSPD1
|
motile sperm domain containing 1 |
| chr1_-_35658736 | 1.46 |
ENST00000357214.5
|
SFPQ
|
splicing factor proline/glutamine-rich |
| chr9_-_74980113 | 1.45 |
ENST00000376962.5
ENST00000376960.4 ENST00000237937.3 |
ZFAND5
|
zinc finger, AN1-type domain 5 |
| chr16_+_16043406 | 1.44 |
ENST00000399410.3
ENST00000399408.2 ENST00000346370.5 ENST00000351154.5 ENST00000345148.5 ENST00000349029.5 |
ABCC1
|
ATP-binding cassette, sub-family C (CFTR/MRP), member 1 |
| chr9_-_15510989 | 1.42 |
ENST00000380715.1
ENST00000380716.4 ENST00000380738.4 ENST00000380733.4 |
PSIP1
|
PC4 and SFRS1 interacting protein 1 |
| chr4_+_77870856 | 1.41 |
ENST00000264893.6
ENST00000502584.1 ENST00000510641.1 |
SEPT11
|
septin 11 |
| chr11_+_125462690 | 1.41 |
ENST00000392708.4
ENST00000529196.1 ENST00000531491.1 |
STT3A
|
STT3A, subunit of the oligosaccharyltransferase complex (catalytic) |
| chr5_+_61602055 | 1.40 |
ENST00000381103.2
|
KIF2A
|
kinesin heavy chain member 2A |
| chr14_+_100705322 | 1.39 |
ENST00000262238.4
|
YY1
|
YY1 transcription factor |
| chr13_+_50656307 | 1.38 |
ENST00000378180.4
|
DLEU1
|
deleted in lymphocytic leukemia 1 (non-protein coding) |
| chr7_-_41742697 | 1.38 |
ENST00000242208.4
|
INHBA
|
inhibin, beta A |
| chr2_+_109335929 | 1.37 |
ENST00000283195.6
|
RANBP2
|
RAN binding protein 2 |
| chr12_+_67663056 | 1.34 |
ENST00000545606.1
|
CAND1
|
cullin-associated and neddylation-dissociated 1 |
| chr2_+_169312350 | 1.33 |
ENST00000305747.6
|
CERS6
|
ceramide synthase 6 |
| chr2_+_181845298 | 1.33 |
ENST00000410062.4
|
UBE2E3
|
ubiquitin-conjugating enzyme E2E 3 |
| chr10_-_88281494 | 1.29 |
ENST00000298767.5
|
WAPAL
|
wings apart-like homolog (Drosophila) |
| chr3_+_113465866 | 1.27 |
ENST00000273398.3
ENST00000538620.1 ENST00000496747.1 ENST00000475322.1 |
ATP6V1A
|
ATPase, H+ transporting, lysosomal 70kDa, V1 subunit A |
| chr1_-_244013384 | 1.27 |
ENST00000366539.1
|
AKT3
|
v-akt murine thymoma viral oncogene homolog 3 |
| chr6_-_79944336 | 1.19 |
ENST00000344726.5
ENST00000275036.7 |
HMGN3
|
high mobility group nucleosomal binding domain 3 |
| chr11_-_85780086 | 1.14 |
ENST00000532317.1
ENST00000528256.1 ENST00000526033.1 |
PICALM
|
phosphatidylinositol binding clathrin assembly protein |
| chr3_+_40351169 | 1.05 |
ENST00000232905.3
|
EIF1B
|
eukaryotic translation initiation factor 1B |
| chr16_+_81069433 | 1.05 |
ENST00000299575.4
|
ATMIN
|
ATM interactor |
| chr15_+_44829255 | 1.02 |
ENST00000261868.5
ENST00000424492.3 |
EIF3J
|
eukaryotic translation initiation factor 3, subunit J |
| chr20_+_62496596 | 1.02 |
ENST00000369927.4
ENST00000346249.4 ENST00000348257.5 ENST00000352482.4 ENST00000351424.4 ENST00000217121.5 ENST00000358548.4 |
TPD52L2
|
tumor protein D52-like 2 |
| chrX_-_131352152 | 1.00 |
ENST00000342983.2
|
RAP2C
|
RAP2C, member of RAS oncogene family |
| chr16_+_12995468 | 0.96 |
ENST00000424107.3
ENST00000558583.1 ENST00000558318.1 |
SHISA9
|
shisa family member 9 |
| chr19_-_47616992 | 0.95 |
ENST00000253048.5
|
ZC3H4
|
zinc finger CCCH-type containing 4 |
| chr12_-_25403737 | 0.95 |
ENST00000256078.4
ENST00000556131.1 ENST00000311936.3 ENST00000557334.1 |
KRAS
|
Kirsten rat sarcoma viral oncogene homolog |
| chr3_+_173116225 | 0.86 |
ENST00000457714.1
|
NLGN1
|
neuroligin 1 |
| chr2_+_9346892 | 0.84 |
ENST00000281419.3
ENST00000315273.4 |
ASAP2
|
ArfGAP with SH3 domain, ankyrin repeat and PH domain 2 |
| chr11_-_67980744 | 0.84 |
ENST00000401547.2
ENST00000453170.1 ENST00000304363.4 |
SUV420H1
|
suppressor of variegation 4-20 homolog 1 (Drosophila) |
| chr12_+_104850740 | 0.76 |
ENST00000547956.1
ENST00000549260.1 ENST00000303694.5 |
CHST11
|
carbohydrate (chondroitin 4) sulfotransferase 11 |
| chr5_-_78809950 | 0.75 |
ENST00000334082.6
|
HOMER1
|
homer homolog 1 (Drosophila) |
| chr10_+_114709999 | 0.73 |
ENST00000355995.4
ENST00000545257.1 ENST00000543371.1 ENST00000536810.1 ENST00000355717.4 ENST00000538897.1 ENST00000534894.1 |
TCF7L2
|
transcription factor 7-like 2 (T-cell specific, HMG-box) |
| chr3_+_11314099 | 0.68 |
ENST00000446450.2
ENST00000354956.5 ENST00000354449.3 ENST00000419112.1 |
ATG7
|
autophagy related 7 |
| chr4_-_66536057 | 0.63 |
ENST00000273854.3
|
EPHA5
|
EPH receptor A5 |
| chr15_-_42264702 | 0.62 |
ENST00000220325.4
|
EHD4
|
EH-domain containing 4 |
| chr10_-_121356007 | 0.61 |
ENST00000369093.2
ENST00000436547.2 |
TIAL1
|
TIA1 cytotoxic granule-associated RNA binding protein-like 1 |
| chr2_+_178077477 | 0.58 |
ENST00000411529.2
ENST00000435711.1 |
HNRNPA3
|
heterogeneous nuclear ribonucleoprotein A3 |
| chr10_+_11206925 | 0.56 |
ENST00000354440.2
ENST00000315874.4 ENST00000427450.1 |
CELF2
|
CUGBP, Elav-like family member 2 |
| chr20_+_1099233 | 0.56 |
ENST00000246015.4
ENST00000335877.6 ENST00000438768.2 |
PSMF1
|
proteasome (prosome, macropain) inhibitor subunit 1 (PI31) |
| chr8_-_74884511 | 0.55 |
ENST00000518127.1
|
TCEB1
|
transcription elongation factor B (SIII), polypeptide 1 (15kDa, elongin C) |
| chr6_+_26199737 | 0.53 |
ENST00000359985.1
|
HIST1H2BF
|
histone cluster 1, H2bf |
| chr1_-_38325256 | 0.52 |
ENST00000373036.4
|
MTF1
|
metal-regulatory transcription factor 1 |
| chr6_+_163835669 | 0.49 |
ENST00000453779.2
ENST00000275262.7 ENST00000392127.2 ENST00000361752.3 |
QKI
|
QKI, KH domain containing, RNA binding |
| chr2_-_24149977 | 0.44 |
ENST00000238789.5
|
ATAD2B
|
ATPase family, AAA domain containing 2B |
| chr3_+_30648066 | 0.41 |
ENST00000359013.4
|
TGFBR2
|
transforming growth factor, beta receptor II (70/80kDa) |
| chr7_-_83824169 | 0.40 |
ENST00000265362.4
|
SEMA3A
|
sema domain, immunoglobulin domain (Ig), short basic domain, secreted, (semaphorin) 3A |
| chr8_+_104831472 | 0.40 |
ENST00000262231.10
ENST00000507740.1 |
RIMS2
|
regulating synaptic membrane exocytosis 2 |
| chr14_+_29234870 | 0.38 |
ENST00000382535.3
|
FOXG1
|
forkhead box G1 |
| chr7_-_26578407 | 0.38 |
ENST00000242109.3
|
KIAA0087
|
KIAA0087 |
| chr1_+_25071848 | 0.37 |
ENST00000374379.4
|
CLIC4
|
chloride intracellular channel 4 |
| chr1_+_229406847 | 0.32 |
ENST00000366690.4
|
RAB4A
|
RAB4A, member RAS oncogene family |
| chr1_+_109234907 | 0.31 |
ENST00000370025.4
ENST00000370022.5 ENST00000370021.1 |
PRPF38B
|
pre-mRNA processing factor 38B |
| chr15_-_83621435 | 0.30 |
ENST00000450735.2
ENST00000426485.1 ENST00000399166.2 ENST00000304231.8 |
HOMER2
|
homer homolog 2 (Drosophila) |
| chr10_+_111967345 | 0.30 |
ENST00000332674.5
ENST00000453116.1 |
MXI1
|
MAX interactor 1, dimerization protein |
| chr6_-_52926539 | 0.28 |
ENST00000350082.5
ENST00000356971.3 |
ICK
|
intestinal cell (MAK-like) kinase |
| chr10_+_43633914 | 0.26 |
ENST00000374466.3
ENST00000374464.1 |
CSGALNACT2
|
chondroitin sulfate N-acetylgalactosaminyltransferase 2 |
| chr8_+_38614807 | 0.25 |
ENST00000330691.6
ENST00000348567.4 |
TACC1
|
transforming, acidic coiled-coil containing protein 1 |
| chr13_+_33160553 | 0.21 |
ENST00000315596.10
|
PDS5B
|
PDS5, regulator of cohesion maintenance, homolog B (S. cerevisiae) |
| chr4_+_57774042 | 0.20 |
ENST00000309042.7
|
REST
|
RE1-silencing transcription factor |
| chrX_+_12993202 | 0.19 |
ENST00000451311.2
ENST00000380636.1 |
TMSB4X
|
thymosin beta 4, X-linked |
| chr20_-_44991813 | 0.18 |
ENST00000372227.1
|
SLC35C2
|
solute carrier family 35 (GDP-fucose transporter), member C2 |
| chr3_-_48342795 | 0.11 |
ENST00000452211.1
ENST00000447724.1 ENST00000415053.1 ENST00000425930.1 ENST00000421967.1 ENST00000426723.1 ENST00000450160.1 ENST00000456495.1 ENST00000435684.1 ENST00000447314.1 ENST00000415644.1 ENST00000442597.1 |
NME6
|
NME/NM23 nucleoside diphosphate kinase 6 |
| chr1_-_24306798 | 0.10 |
ENST00000374452.5
ENST00000492112.2 ENST00000343255.5 ENST00000344989.6 |
SRSF10
|
serine/arginine-rich splicing factor 10 |
| chr8_-_29940628 | 0.10 |
ENST00000545648.1
ENST00000256255.6 |
TMEM66
|
transmembrane protein 66 |
| chr1_-_169455169 | 0.10 |
ENST00000367804.4
ENST00000236137.5 |
SLC19A2
|
solute carrier family 19 (thiamine transporter), member 2 |
| chr5_-_168006591 | 0.07 |
ENST00000239231.6
|
PANK3
|
pantothenate kinase 3 |
| chr16_+_68771128 | 0.06 |
ENST00000261769.5
ENST00000422392.2 |
CDH1
|
cadherin 1, type 1, E-cadherin (epithelial) |
| chr3_-_164913777 | 0.05 |
ENST00000475390.1
|
SLITRK3
|
SLIT and NTRK-like family, member 3 |
| chr12_+_62654119 | 0.05 |
ENST00000353364.3
ENST00000549523.1 ENST00000280377.5 |
USP15
|
ubiquitin specific peptidase 15 |
| chrX_+_9983602 | 0.01 |
ENST00000380861.4
|
WWC3
|
WWC family member 3 |
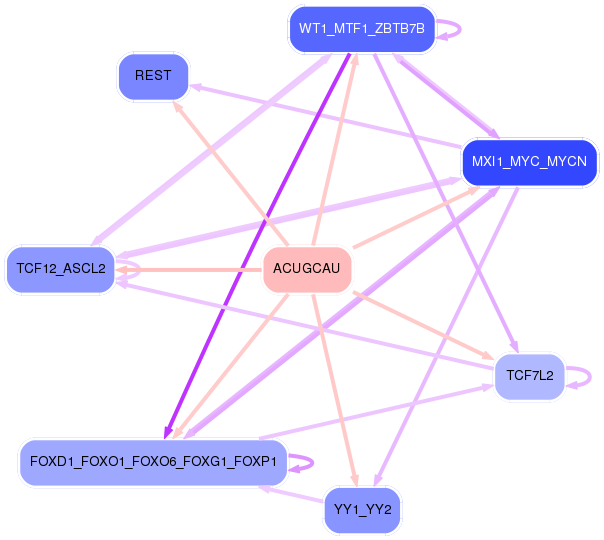
Network of associatons between targets according to the STRING database.

First level regulatory network of ACUGCAU
Gene Ontology Analysis
Gene overrepresentation in biological_process category:
| Log-likelihood per target | Total log-likelihood | Term | Description |
|---|---|---|---|
| 1.8 | 5.5 | GO:0090244 | negative regulation of Wnt signaling pathway involved in heart development(GO:0003308) negative regulation of cell fate specification(GO:0009996) Wnt signaling pathway involved in somitogenesis(GO:0090244) |
| 1.5 | 6.1 | GO:0033387 | putrescine biosynthetic process from ornithine(GO:0033387) |
| 1.2 | 7.2 | GO:0035694 | mitochondrial protein catabolic process(GO:0035694) |
| 1.1 | 3.3 | GO:0021836 | cerebral cortex tangential migration using cell-cell interactions(GO:0021823) postnatal olfactory bulb interneuron migration(GO:0021827) chemorepulsion involved in postnatal olfactory bulb interneuron migration(GO:0021836) regulation of negative chemotaxis(GO:0050923) |
| 0.9 | 2.8 | GO:0006597 | spermine biosynthetic process(GO:0006597) |
| 0.9 | 9.2 | GO:0044387 | negative regulation of protein kinase activity by regulation of protein phosphorylation(GO:0044387) |
| 0.7 | 2.2 | GO:0044208 | 'de novo' AMP biosynthetic process(GO:0044208) |
| 0.7 | 2.7 | GO:1902544 | oxidative DNA demethylation(GO:0035511) regulation of DNA N-glycosylase activity(GO:1902544) |
| 0.7 | 2.0 | GO:0003383 | apical constriction(GO:0003383) |
| 0.6 | 1.8 | GO:1904482 | response to tetrahydrofolate(GO:1904481) cellular response to tetrahydrofolate(GO:1904482) |
| 0.6 | 1.7 | GO:0002188 | translation reinitiation(GO:0002188) |
| 0.6 | 1.7 | GO:0006428 | isoleucyl-tRNA aminoacylation(GO:0006428) |
| 0.5 | 1.5 | GO:0045876 | positive regulation of sister chromatid cohesion(GO:0045876) |
| 0.5 | 1.4 | GO:0060279 | negative regulation of B cell differentiation(GO:0045578) regulation of ovulation(GO:0060278) positive regulation of ovulation(GO:0060279) |
| 0.5 | 1.4 | GO:0090526 | regulation of gluconeogenesis involved in cellular glucose homeostasis(GO:0090526) |
| 0.4 | 2.2 | GO:0044806 | G-quadruplex DNA unwinding(GO:0044806) |
| 0.4 | 1.7 | GO:1903984 | positive regulation of TRAIL-activated apoptotic signaling pathway(GO:1903984) |
| 0.4 | 2.4 | GO:0006177 | GMP biosynthetic process(GO:0006177) |
| 0.4 | 3.1 | GO:1903748 | negative regulation of establishment of protein localization to mitochondrion(GO:1903748) |
| 0.4 | 2.5 | GO:0000290 | deadenylation-dependent decapping of nuclear-transcribed mRNA(GO:0000290) |
| 0.4 | 2.8 | GO:1902037 | negative regulation of hematopoietic stem cell differentiation(GO:1902037) |
| 0.3 | 2.0 | GO:0061087 | negative regulation of histone H3-K27 methylation(GO:0061086) positive regulation of histone H3-K27 methylation(GO:0061087) |
| 0.3 | 3.7 | GO:2000271 | positive regulation of fibroblast apoptotic process(GO:2000271) |
| 0.3 | 1.5 | GO:0003408 | optic cup formation involved in camera-type eye development(GO:0003408) |
| 0.3 | 5.5 | GO:0032486 | Rap protein signal transduction(GO:0032486) |
| 0.3 | 0.9 | GO:0098923 | retrograde trans-synaptic signaling by soluble gas(GO:0098923) trans-synaptic signaling by soluble gas(GO:0099543) trans-synaptic signaling by trans-synaptic complex(GO:0099545) |
| 0.3 | 4.5 | GO:0007253 | cytoplasmic sequestering of NF-kappaB(GO:0007253) |
| 0.3 | 0.8 | GO:0007206 | phospholipase C-activating G-protein coupled glutamate receptor signaling pathway(GO:0007206) |
| 0.2 | 1.4 | GO:0035672 | oligopeptide transmembrane transport(GO:0035672) |
| 0.2 | 2.4 | GO:0031936 | negative regulation of chromatin silencing(GO:0031936) |
| 0.2 | 0.7 | GO:1901859 | late nucleophagy(GO:0044805) negative regulation of mitochondrial DNA replication(GO:0090298) negative regulation of mitochondrial DNA metabolic process(GO:1901859) single-organism membrane invagination(GO:1902534) |
| 0.2 | 5.3 | GO:0045880 | positive regulation of smoothened signaling pathway(GO:0045880) |
| 0.2 | 2.0 | GO:0001672 | regulation of chromatin assembly or disassembly(GO:0001672) |
| 0.2 | 6.3 | GO:0000717 | nucleotide-excision repair, DNA duplex unwinding(GO:0000717) |
| 0.2 | 1.7 | GO:0035583 | sequestering of TGFbeta in extracellular matrix(GO:0035583) |
| 0.2 | 0.9 | GO:0035900 | response to isolation stress(GO:0035900) |
| 0.2 | 0.7 | GO:0010908 | regulation of heparan sulfate proteoglycan biosynthetic process(GO:0010908) positive regulation of heparan sulfate proteoglycan biosynthetic process(GO:0010909) canonical Wnt signaling pathway involved in positive regulation of epithelial to mesenchymal transition(GO:0044334) positive regulation of proteoglycan biosynthetic process(GO:1902730) |
| 0.2 | 1.6 | GO:0001675 | acrosome assembly(GO:0001675) |
| 0.2 | 1.1 | GO:1902963 | regulation of metalloendopeptidase activity involved in amyloid precursor protein catabolic process(GO:1902962) negative regulation of metalloendopeptidase activity involved in amyloid precursor protein catabolic process(GO:1902963) |
| 0.2 | 6.2 | GO:0006376 | mRNA splice site selection(GO:0006376) |
| 0.2 | 1.9 | GO:0001711 | endodermal cell fate commitment(GO:0001711) histone H3-K4 trimethylation(GO:0080182) |
| 0.1 | 1.3 | GO:0010265 | SCF complex assembly(GO:0010265) |
| 0.1 | 0.4 | GO:0002663 | B cell tolerance induction(GO:0002514) regulation of B cell tolerance induction(GO:0002661) positive regulation of B cell tolerance induction(GO:0002663) |
| 0.1 | 4.7 | GO:0043090 | amino acid import(GO:0043090) |
| 0.1 | 3.7 | GO:0019054 | modulation by virus of host process(GO:0019054) |
| 0.1 | 1.6 | GO:0005981 | regulation of glycogen catabolic process(GO:0005981) |
| 0.1 | 4.7 | GO:0051220 | cytoplasmic sequestering of protein(GO:0051220) |
| 0.1 | 1.4 | GO:0010225 | response to UV-C(GO:0010225) |
| 0.1 | 1.0 | GO:0048172 | regulation of short-term neuronal synaptic plasticity(GO:0048172) |
| 0.1 | 2.1 | GO:0060148 | positive regulation of posttranscriptional gene silencing(GO:0060148) positive regulation of gene silencing by miRNA(GO:2000637) |
| 0.1 | 0.4 | GO:0048880 | sensory system development(GO:0048880) |
| 0.1 | 1.3 | GO:0045793 | positive regulation of cell size(GO:0045793) |
| 0.1 | 1.3 | GO:0036295 | cellular response to increased oxygen levels(GO:0036295) |
| 0.1 | 3.0 | GO:2000272 | negative regulation of receptor activity(GO:2000272) |
| 0.1 | 2.7 | GO:0051642 | centrosome localization(GO:0051642) |
| 0.1 | 0.3 | GO:0035720 | intraciliary anterograde transport(GO:0035720) |
| 0.1 | 0.2 | GO:2000705 | dense core granule biogenesis(GO:0061110) regulation of dense core granule biogenesis(GO:2000705) |
| 0.1 | 0.3 | GO:0050653 | chondroitin sulfate proteoglycan biosynthetic process, polysaccharide chain biosynthetic process(GO:0050653) |
| 0.1 | 0.8 | GO:0036342 | post-anal tail morphogenesis(GO:0036342) |
| 0.1 | 2.2 | GO:0007094 | mitotic spindle assembly checkpoint(GO:0007094) spindle assembly checkpoint(GO:0071173) |
| 0.0 | 0.5 | GO:0061158 | 3'-UTR-mediated mRNA destabilization(GO:0061158) |
| 0.0 | 1.0 | GO:1902857 | positive regulation of nonmotile primary cilium assembly(GO:1902857) |
| 0.0 | 0.3 | GO:0032482 | Rab protein signal transduction(GO:0032482) |
| 0.0 | 4.6 | GO:0006446 | regulation of translational initiation(GO:0006446) |
| 0.0 | 0.4 | GO:0098814 | spontaneous neurotransmitter secretion(GO:0061669) spontaneous synaptic transmission(GO:0098814) |
| 0.0 | 1.3 | GO:0070534 | protein K63-linked ubiquitination(GO:0070534) |
| 0.0 | 2.5 | GO:0031663 | lipopolysaccharide-mediated signaling pathway(GO:0031663) |
| 0.0 | 4.3 | GO:1902036 | regulation of hematopoietic stem cell differentiation(GO:1902036) |
| 0.0 | 1.6 | GO:0016574 | histone ubiquitination(GO:0016574) |
| 0.0 | 0.6 | GO:0032793 | positive regulation of CREB transcription factor activity(GO:0032793) |
| 0.0 | 0.3 | GO:0048875 | chemical homeostasis within a tissue(GO:0048875) |
| 0.0 | 0.1 | GO:0071934 | thiamine transport(GO:0015888) thiamine transmembrane transport(GO:0071934) |
| 0.0 | 1.7 | GO:0032508 | DNA duplex unwinding(GO:0032508) |
| 0.0 | 0.4 | GO:0001886 | endothelial cell morphogenesis(GO:0001886) retina vasculature morphogenesis in camera-type eye(GO:0061299) |
| 0.0 | 0.6 | GO:0006907 | pinocytosis(GO:0006907) |
| 0.0 | 1.5 | GO:0048008 | fibroblast migration(GO:0010761) platelet-derived growth factor receptor signaling pathway(GO:0048008) |
| 0.0 | 1.4 | GO:0018279 | protein N-linked glycosylation via asparagine(GO:0018279) |
| 0.0 | 1.3 | GO:0046513 | ceramide biosynthetic process(GO:0046513) |
| 0.0 | 2.5 | GO:0035335 | peptidyl-tyrosine dephosphorylation(GO:0035335) |
| 0.0 | 0.2 | GO:0036066 | protein O-linked fucosylation(GO:0036066) |
| 0.0 | 5.1 | GO:0030336 | negative regulation of cell migration(GO:0030336) |
| 0.0 | 1.4 | GO:0090307 | mitotic spindle assembly(GO:0090307) |
| 0.0 | 3.4 | GO:0008360 | regulation of cell shape(GO:0008360) |
| 0.0 | 1.2 | GO:0061178 | regulation of insulin secretion involved in cellular response to glucose stimulus(GO:0061178) |
| 0.0 | 0.6 | GO:0017145 | stem cell division(GO:0017145) |
| 0.0 | 1.9 | GO:0006334 | nucleosome assembly(GO:0006334) |
| 0.0 | 0.1 | GO:0071680 | response to indole-3-methanol(GO:0071680) cellular response to indole-3-methanol(GO:0071681) |
| 0.0 | 0.4 | GO:0007568 | aging(GO:0007568) |
| 0.0 | 1.4 | GO:0051291 | protein heterooligomerization(GO:0051291) |
| 0.0 | 0.0 | GO:0035616 | histone H2B conserved C-terminal lysine deubiquitination(GO:0035616) |
| 0.0 | 0.1 | GO:0006183 | GTP biosynthetic process(GO:0006183) |
Gene overrepresentation in cellular_component category:
| Log-likelihood per target | Total log-likelihood | Term | Description |
|---|---|---|---|
| 0.8 | 9.8 | GO:0016600 | flotillin complex(GO:0016600) |
| 0.5 | 1.4 | GO:0043512 | inhibin complex(GO:0043511) inhibin A complex(GO:0043512) |
| 0.4 | 3.1 | GO:0098554 | cytoplasmic side of endoplasmic reticulum membrane(GO:0098554) |
| 0.4 | 3.0 | GO:0046581 | intercellular canaliculus(GO:0046581) |
| 0.4 | 6.3 | GO:0000109 | nucleotide-excision repair complex(GO:0000109) |
| 0.3 | 6.3 | GO:0016580 | Sin3 complex(GO:0016580) |
| 0.2 | 1.4 | GO:0044614 | nuclear pore cytoplasmic filaments(GO:0044614) |
| 0.2 | 1.1 | GO:0070381 | endosome to plasma membrane transport vesicle(GO:0070381) |
| 0.2 | 1.9 | GO:0016593 | Cdc73/Paf1 complex(GO:0016593) |
| 0.2 | 0.7 | GO:0070369 | beta-catenin-TCF7L2 complex(GO:0070369) |
| 0.2 | 1.5 | GO:0042382 | paraspeckles(GO:0042382) |
| 0.2 | 1.6 | GO:0001739 | sex chromatin(GO:0001739) |
| 0.2 | 1.6 | GO:0042587 | glycogen granule(GO:0042587) PTW/PP1 phosphatase complex(GO:0072357) |
| 0.2 | 2.5 | GO:0031332 | RISC complex(GO:0016442) RNAi effector complex(GO:0031332) |
| 0.1 | 1.7 | GO:0035749 | myelin sheath adaxonal region(GO:0035749) |
| 0.1 | 1.4 | GO:0008250 | oligosaccharyltransferase complex(GO:0008250) |
| 0.1 | 2.0 | GO:0032059 | bleb(GO:0032059) |
| 0.1 | 1.9 | GO:0035098 | ESC/E(Z) complex(GO:0035098) |
| 0.1 | 1.3 | GO:0033180 | proton-transporting V-type ATPase, V1 domain(GO:0033180) |
| 0.1 | 2.7 | GO:0005868 | cytoplasmic dynein complex(GO:0005868) |
| 0.1 | 3.0 | GO:0016592 | mediator complex(GO:0016592) |
| 0.1 | 1.7 | GO:0017101 | aminoacyl-tRNA synthetase multienzyme complex(GO:0017101) |
| 0.1 | 1.7 | GO:0001527 | microfibril(GO:0001527) fibril(GO:0043205) |
| 0.1 | 1.5 | GO:0071564 | npBAF complex(GO:0071564) |
| 0.1 | 1.4 | GO:0031011 | Ino80 complex(GO:0031011) DNA helicase complex(GO:0033202) |
| 0.1 | 0.3 | GO:0098837 | postsynaptic recycling endosome(GO:0098837) |
| 0.1 | 0.9 | GO:0017146 | NMDA selective glutamate receptor complex(GO:0017146) |
| 0.1 | 5.0 | GO:0017053 | transcriptional repressor complex(GO:0017053) |
| 0.1 | 3.9 | GO:0035577 | azurophil granule membrane(GO:0035577) |
| 0.1 | 1.4 | GO:0097228 | sperm principal piece(GO:0097228) |
| 0.1 | 2.8 | GO:0009295 | nucleoid(GO:0009295) mitochondrial nucleoid(GO:0042645) |
| 0.0 | 0.6 | GO:1990124 | messenger ribonucleoprotein complex(GO:1990124) |
| 0.0 | 4.8 | GO:0005905 | clathrin-coated pit(GO:0005905) |
| 0.0 | 2.3 | GO:0043034 | costamere(GO:0043034) |
| 0.0 | 0.4 | GO:0070022 | transforming growth factor beta receptor homodimeric complex(GO:0070022) |
| 0.0 | 1.0 | GO:0032591 | dendritic spine membrane(GO:0032591) |
| 0.0 | 1.0 | GO:0005852 | eukaryotic translation initiation factor 3 complex(GO:0005852) |
| 0.0 | 3.7 | GO:0018995 | host(GO:0018995) host cell(GO:0043657) |
| 0.0 | 4.8 | GO:0030175 | filopodium(GO:0030175) |
| 0.0 | 2.3 | GO:0010494 | cytoplasmic stress granule(GO:0010494) |
| 0.0 | 0.3 | GO:0071011 | precatalytic spliceosome(GO:0071011) |
| 0.0 | 2.9 | GO:0035578 | azurophil granule lumen(GO:0035578) |
| 0.0 | 1.6 | GO:0055038 | recycling endosome membrane(GO:0055038) |
| 0.0 | 2.2 | GO:0000777 | condensed chromosome kinetochore(GO:0000777) |
| 0.0 | 6.1 | GO:0000790 | nuclear chromatin(GO:0000790) |
| 0.0 | 2.2 | GO:0071013 | catalytic step 2 spliceosome(GO:0071013) |
| 0.0 | 2.2 | GO:0031901 | early endosome membrane(GO:0031901) |
| 0.0 | 0.7 | GO:0000407 | pre-autophagosomal structure(GO:0000407) |
| 0.0 | 0.6 | GO:0005839 | proteasome core complex(GO:0005839) |
| 0.0 | 1.9 | GO:0042470 | melanosome(GO:0042470) pigment granule(GO:0048770) |
| 0.0 | 1.4 | GO:0097517 | stress fiber(GO:0001725) contractile actin filament bundle(GO:0097517) |
| 0.0 | 6.8 | GO:0005743 | mitochondrial inner membrane(GO:0005743) |
| 0.0 | 8.3 | GO:0030529 | intracellular ribonucleoprotein complex(GO:0030529) |
| 0.0 | 0.6 | GO:0005791 | rough endoplasmic reticulum(GO:0005791) |
| 0.0 | 2.4 | GO:0009898 | cytoplasmic side of plasma membrane(GO:0009898) |
Gene overrepresentation in molecular_function category:
| Log-likelihood per target | Total log-likelihood | Term | Description |
|---|---|---|---|
| 1.8 | 5.3 | GO:0050510 | N-acetylgalactosaminyl-proteoglycan 3-beta-glucuronosyltransferase activity(GO:0050510) |
| 0.9 | 6.6 | GO:0050815 | phosphoserine binding(GO:0050815) |
| 0.9 | 2.7 | GO:0043739 | G/U mismatch-specific uracil-DNA glycosylase activity(GO:0043739) |
| 0.9 | 7.2 | GO:0004176 | ATP-dependent peptidase activity(GO:0004176) |
| 0.9 | 6.1 | GO:0042978 | ornithine decarboxylase activator activity(GO:0042978) |
| 0.6 | 1.7 | GO:0016314 | phosphatidylinositol-3,4,5-trisphosphate 3-phosphatase activity(GO:0016314) |
| 0.6 | 1.7 | GO:0004822 | isoleucine-tRNA ligase activity(GO:0004822) |
| 0.5 | 5.5 | GO:0039706 | co-receptor binding(GO:0039706) |
| 0.5 | 3.0 | GO:0008046 | axon guidance receptor activity(GO:0008046) |
| 0.5 | 6.3 | GO:1990247 | N6-methyladenosine-containing RNA binding(GO:1990247) |
| 0.5 | 1.4 | GO:0015235 | cobalamin transporter activity(GO:0015235) |
| 0.5 | 1.4 | GO:0070699 | type II activin receptor binding(GO:0070699) |
| 0.4 | 1.8 | GO:0070905 | serine binding(GO:0070905) |
| 0.4 | 9.0 | GO:0005092 | GDP-dissociation inhibitor activity(GO:0005092) |
| 0.3 | 3.1 | GO:0055131 | C3HC4-type RING finger domain binding(GO:0055131) |
| 0.3 | 2.5 | GO:0050072 | m7G(5')pppN diphosphatase activity(GO:0050072) |
| 0.3 | 1.6 | GO:0017018 | myosin phosphatase activity(GO:0017018) |
| 0.2 | 5.0 | GO:0035497 | cAMP response element binding(GO:0035497) |
| 0.2 | 1.3 | GO:0050291 | sphingosine N-acyltransferase activity(GO:0050291) |
| 0.2 | 1.7 | GO:0030023 | extracellular matrix constituent conferring elasticity(GO:0030023) |
| 0.2 | 2.1 | GO:0002151 | G-quadruplex RNA binding(GO:0002151) RNA strand annealing activity(GO:0033592) |
| 0.2 | 0.8 | GO:0034481 | chondroitin sulfotransferase activity(GO:0034481) |
| 0.2 | 3.0 | GO:0042809 | vitamin D receptor binding(GO:0042809) |
| 0.2 | 2.4 | GO:0016884 | carbon-nitrogen ligase activity, with glutamine as amido-N-donor(GO:0016884) |
| 0.1 | 1.4 | GO:0004579 | dolichyl-diphosphooligosaccharide-protein glycotransferase activity(GO:0004579) |
| 0.1 | 6.3 | GO:0031593 | polyubiquitin binding(GO:0031593) |
| 0.1 | 2.7 | GO:0045504 | dynein heavy chain binding(GO:0045504) |
| 0.1 | 4.6 | GO:0030159 | receptor signaling complex scaffold activity(GO:0030159) |
| 0.1 | 2.0 | GO:0017049 | GTP-Rho binding(GO:0017049) |
| 0.1 | 1.4 | GO:0042301 | phosphate ion binding(GO:0042301) |
| 0.1 | 1.4 | GO:0097100 | supercoiled DNA binding(GO:0097100) |
| 0.1 | 8.3 | GO:0048365 | Rac GTPase binding(GO:0048365) |
| 0.1 | 0.7 | GO:0004839 | ubiquitin activating enzyme activity(GO:0004839) |
| 0.1 | 4.8 | GO:0050699 | WW domain binding(GO:0050699) |
| 0.1 | 0.4 | GO:0005026 | transforming growth factor beta receptor activity, type II(GO:0005026) |
| 0.1 | 7.3 | GO:0003743 | translation initiation factor activity(GO:0003743) |
| 0.1 | 3.7 | GO:0008139 | nuclear localization sequence binding(GO:0008139) |
| 0.1 | 0.6 | GO:0051032 | nucleic acid transmembrane transporter activity(GO:0051032) RNA transmembrane transporter activity(GO:0051033) |
| 0.1 | 1.1 | GO:0032050 | clathrin heavy chain binding(GO:0032050) |
| 0.1 | 6.8 | GO:0019003 | GDP binding(GO:0019003) |
| 0.1 | 3.0 | GO:0051059 | NF-kappaB binding(GO:0051059) |
| 0.1 | 0.6 | GO:0005005 | transmembrane-ephrin receptor activity(GO:0005005) |
| 0.1 | 1.4 | GO:0000400 | four-way junction DNA binding(GO:0000400) |
| 0.1 | 1.4 | GO:0019789 | SUMO transferase activity(GO:0019789) |
| 0.1 | 0.3 | GO:0047238 | glucuronosyl-N-acetylgalactosaminyl-proteoglycan 4-beta-N-acetylgalactosaminyltransferase activity(GO:0047238) |
| 0.1 | 0.9 | GO:0042043 | neurexin family protein binding(GO:0042043) |
| 0.1 | 2.5 | GO:0008138 | protein tyrosine/serine/threonine phosphatase activity(GO:0008138) |
| 0.1 | 3.7 | GO:0035064 | methylated histone binding(GO:0035064) |
| 0.1 | 0.8 | GO:0035256 | G-protein coupled glutamate receptor binding(GO:0035256) |
| 0.1 | 2.8 | GO:0016831 | carboxy-lyase activity(GO:0016831) |
| 0.0 | 2.7 | GO:0031491 | nucleosome binding(GO:0031491) |
| 0.0 | 1.7 | GO:0004003 | ATP-dependent DNA helicase activity(GO:0004003) |
| 0.0 | 1.3 | GO:0046961 | proton-transporting ATPase activity, rotational mechanism(GO:0046961) |
| 0.0 | 1.0 | GO:0070840 | dynein complex binding(GO:0070840) |
| 0.0 | 0.8 | GO:0045295 | gamma-catenin binding(GO:0045295) |
| 0.0 | 0.1 | GO:0015403 | thiamine transmembrane transporter activity(GO:0015234) thiamine uptake transmembrane transporter activity(GO:0015403) |
| 0.0 | 0.6 | GO:0070628 | proteasome binding(GO:0070628) |
| 0.0 | 1.3 | GO:0061650 | ubiquitin conjugating enzyme activity(GO:0061631) ubiquitin-like protein conjugating enzyme activity(GO:0061650) |
| 0.0 | 0.4 | GO:0030215 | semaphorin receptor binding(GO:0030215) |
| 0.0 | 1.0 | GO:0017025 | TBP-class protein binding(GO:0017025) |
| 0.0 | 2.9 | GO:0051082 | unfolded protein binding(GO:0051082) |
| 0.0 | 1.5 | GO:0000980 | RNA polymerase II distal enhancer sequence-specific DNA binding(GO:0000980) |
| 0.0 | 2.3 | GO:0042393 | histone binding(GO:0042393) |
| 0.0 | 0.1 | GO:0004594 | pantothenate kinase activity(GO:0004594) |
| 0.0 | 1.0 | GO:0030165 | PDZ domain binding(GO:0030165) |
| 0.0 | 0.6 | GO:0017091 | AU-rich element binding(GO:0017091) |
| 0.0 | 0.6 | GO:0036002 | pre-mRNA binding(GO:0036002) |
| 0.0 | 2.2 | GO:0008201 | heparin binding(GO:0008201) |
Gene overrepresentation in C2:CP category:
| Log-likelihood per target | Total log-likelihood | Term | Description |
|---|---|---|---|
| 0.2 | 6.8 | ST WNT BETA CATENIN PATHWAY | Wnt/beta-catenin Pathway |
| 0.1 | 9.4 | PID ECADHERIN NASCENT AJ PATHWAY | E-cadherin signaling in the nascent adherens junction |
| 0.1 | 8.1 | ST PHOSPHOINOSITIDE 3 KINASE PATHWAY | PI3K Pathway |
| 0.1 | 2.0 | PID THROMBIN PAR4 PATHWAY | PAR4-mediated thrombin signaling events |
| 0.1 | 1.4 | PID RANBP2 PATHWAY | Sumoylation by RanBP2 regulates transcriptional repression |
| 0.1 | 3.5 | SIG REGULATION OF THE ACTIN CYTOSKELETON BY RHO GTPASES | Genes related to regulation of the actin cytoskeleton |
| 0.1 | 1.4 | PID S1P META PATHWAY | Sphingosine 1-phosphate (S1P) pathway |
| 0.1 | 3.3 | PID AJDISS 2PATHWAY | Posttranslational regulation of adherens junction stability and dissassembly |
| 0.0 | 3.0 | PID PLK1 PATHWAY | PLK1 signaling events |
| 0.0 | 2.0 | PID AR TF PATHWAY | Regulation of Androgen receptor activity |
| 0.0 | 1.6 | ST TUMOR NECROSIS FACTOR PATHWAY | Tumor Necrosis Factor Pathway. |
| 0.0 | 3.1 | PID MYC ACTIV PATHWAY | Validated targets of C-MYC transcriptional activation |
| 0.0 | 1.8 | PID MTOR 4PATHWAY | mTOR signaling pathway |
| 0.0 | 0.5 | PID HIF1A PATHWAY | Hypoxic and oxygen homeostasis regulation of HIF-1-alpha |
| 0.0 | 0.8 | PID ARF6 TRAFFICKING PATHWAY | Arf6 trafficking events |
| 0.0 | 0.2 | PID PRL SIGNALING EVENTS PATHWAY | Signaling events mediated by PRL |
| 0.0 | 0.4 | PID ALK1 PATHWAY | ALK1 signaling events |
Gene overrepresentation in C2:CP:REACTOME category:
| Log-likelihood per target | Total log-likelihood | Term | Description |
|---|---|---|---|
| 0.4 | 3.0 | REACTOME NEGATIVE REGULATION OF THE PI3K AKT NETWORK | Genes involved in Negative regulation of the PI3K/AKT network |
| 0.4 | 7.2 | REACTOME DESTABILIZATION OF MRNA BY BRF1 | Genes involved in Destabilization of mRNA by Butyrate Response Factor 1 (BRF1) |
| 0.3 | 4.6 | REACTOME PURINE RIBONUCLEOSIDE MONOPHOSPHATE BIOSYNTHESIS | Genes involved in Purine ribonucleoside monophosphate biosynthesis |
| 0.2 | 6.3 | REACTOME FORMATION OF INCISION COMPLEX IN GG NER | Genes involved in Formation of incision complex in GG-NER |
| 0.2 | 6.3 | REACTOME CHONDROITIN SULFATE BIOSYNTHESIS | Genes involved in Chondroitin sulfate biosynthesis |
| 0.2 | 4.5 | REACTOME P130CAS LINKAGE TO MAPK SIGNALING FOR INTEGRINS | Genes involved in p130Cas linkage to MAPK signaling for integrins |
| 0.2 | 1.4 | REACTOME APOBEC3G MEDIATED RESISTANCE TO HIV1 INFECTION | Genes involved in APOBEC3G mediated resistance to HIV-1 infection |
| 0.1 | 2.7 | REACTOME BASE FREE SUGAR PHOSPHATE REMOVAL VIA THE SINGLE NUCLEOTIDE REPLACEMENT PATHWAY | Genes involved in Base-free sugar-phosphate removal via the single-nucleotide replacement pathway |
| 0.1 | 7.5 | REACTOME SIGNALING BY ROBO RECEPTOR | Genes involved in Signaling by Robo receptor |
| 0.1 | 2.8 | REACTOME METABOLISM OF POLYAMINES | Genes involved in Metabolism of polyamines |
| 0.1 | 1.4 | REACTOME GLYCOPROTEIN HORMONES | Genes involved in Glycoprotein hormones |
| 0.1 | 5.0 | REACTOME MYOGENESIS | Genes involved in Myogenesis |
| 0.1 | 6.7 | REACTOME REGULATION OF ORNITHINE DECARBOXYLASE ODC | Genes involved in Regulation of ornithine decarboxylase (ODC) |
| 0.1 | 0.5 | REACTOME VIF MEDIATED DEGRADATION OF APOBEC3G | Genes involved in Vif-mediated degradation of APOBEC3G |
| 0.1 | 0.9 | REACTOME P38MAPK EVENTS | Genes involved in p38MAPK events |
| 0.1 | 1.6 | REACTOME HORMONE SENSITIVE LIPASE HSL MEDIATED TRIACYLGLYCEROL HYDROLYSIS | Genes involved in Hormone-sensitive lipase (HSL)-mediated triacylglycerol hydrolysis |
| 0.1 | 1.4 | REACTOME KINESINS | Genes involved in Kinesins |
| 0.0 | 5.1 | REACTOME ANTIVIRAL MECHANISM BY IFN STIMULATED GENES | Genes involved in Antiviral mechanism by IFN-stimulated genes |
| 0.0 | 7.3 | REACTOME SIGNALING BY RHO GTPASES | Genes involved in Signaling by Rho GTPases |
| 0.0 | 2.0 | REACTOME SEMA4D INDUCED CELL MIGRATION AND GROWTH CONE COLLAPSE | Genes involved in Sema4D induced cell migration and growth-cone collapse |
| 0.0 | 1.7 | REACTOME CYTOSOLIC TRNA AMINOACYLATION | Genes involved in Cytosolic tRNA aminoacylation |
| 0.0 | 2.8 | REACTOME MITOCHONDRIAL PROTEIN IMPORT | Genes involved in Mitochondrial Protein Import |
| 0.0 | 1.3 | REACTOME INSULIN RECEPTOR RECYCLING | Genes involved in Insulin receptor recycling |
| 0.0 | 1.3 | REACTOME SPHINGOLIPID DE NOVO BIOSYNTHESIS | Genes involved in Sphingolipid de novo biosynthesis |
| 0.0 | 6.0 | REACTOME MRNA SPLICING | Genes involved in mRNA Splicing |
| 0.0 | 1.4 | REACTOME ABC FAMILY PROTEINS MEDIATED TRANSPORT | Genes involved in ABC-family proteins mediated transport |
| 0.0 | 0.4 | REACTOME TGF BETA RECEPTOR SIGNALING IN EMT EPITHELIAL TO MESENCHYMAL TRANSITION | Genes involved in TGF-beta receptor signaling in EMT (epithelial to mesenchymal transition) |
| 0.0 | 0.4 | REACTOME SEMA3A PLEXIN REPULSION SIGNALING BY INHIBITING INTEGRIN ADHESION | Genes involved in SEMA3A-Plexin repulsion signaling by inhibiting Integrin adhesion |
| 0.0 | 2.7 | REACTOME MHC CLASS II ANTIGEN PRESENTATION | Genes involved in MHC class II antigen presentation |
| 0.0 | 4.6 | REACTOME TRANSLATION | Genes involved in Translation |
| 0.0 | 1.1 | REACTOME GOLGI ASSOCIATED VESICLE BIOGENESIS | Genes involved in Golgi Associated Vesicle Biogenesis |
| 0.0 | 1.4 | REACTOME ASPARAGINE N LINKED GLYCOSYLATION | Genes involved in Asparagine N-linked glycosylation |
| 0.0 | 0.5 | REACTOME PACKAGING OF TELOMERE ENDS | Genes involved in Packaging Of Telomere Ends |
| 0.0 | 2.0 | REACTOME ANTIGEN PROCESSING UBIQUITINATION PROTEASOME DEGRADATION | Genes involved in Antigen processing: Ubiquitination & Proteasome degradation |
| 0.0 | 1.8 | REACTOME METABOLISM OF AMINO ACIDS AND DERIVATIVES | Genes involved in Metabolism of amino acids and derivatives |