Project
GNF SymAtlas + NCI-60 cancer cell lines, comparison of cancers vs non-cancers, human (Su, 2004; Ross, 2000)
Navigation
Downloads
Results for AGCCCUU
Z-value: 1.27
Motif logo

miRNA associated with seed AGCCCUU
| Name | miRBASE accession |
|---|---|
|
hsa-miR-129-1-3p
|
MIMAT0004548 |
|
hsa-miR-129-2-3p
|
MIMAT0004605 |
Activity profile of AGCCCUU motif
Sorted Z-values of AGCCCUU motif
| Promoter | Log-likelihood | Transcript | Gene | Gene Info |
|---|---|---|---|---|
| chrX_-_13956737 | 28.75 |
ENST00000454189.2
|
GPM6B
|
glycoprotein M6B |
| chr1_-_20812690 | 24.15 |
ENST00000375078.3
|
CAMK2N1
|
calcium/calmodulin-dependent protein kinase II inhibitor 1 |
| chr6_-_46293378 | 23.02 |
ENST00000330430.6
|
RCAN2
|
regulator of calcineurin 2 |
| chr11_-_123525289 | 16.95 |
ENST00000392770.2
ENST00000299333.3 ENST00000530277.1 |
SCN3B
|
sodium channel, voltage-gated, type III, beta subunit |
| chr2_+_203499901 | 15.25 |
ENST00000303116.6
ENST00000392238.2 |
FAM117B
|
family with sequence similarity 117, member B |
| chr17_+_43971643 | 14.14 |
ENST00000344290.5
ENST00000262410.5 ENST00000351559.5 ENST00000340799.5 ENST00000535772.1 ENST00000347967.5 |
MAPT
|
microtubule-associated protein tau |
| chr5_-_136834982 | 13.24 |
ENST00000510689.1
ENST00000394945.1 |
SPOCK1
|
sparc/osteonectin, cwcv and kazal-like domains proteoglycan (testican) 1 |
| chr1_-_41131326 | 12.77 |
ENST00000372684.3
|
RIMS3
|
regulating synaptic membrane exocytosis 3 |
| chr22_+_40390930 | 12.69 |
ENST00000333407.6
|
FAM83F
|
family with sequence similarity 83, member F |
| chr8_+_104152922 | 12.06 |
ENST00000309982.5
ENST00000438105.2 ENST00000297574.6 |
BAALC
|
brain and acute leukemia, cytoplasmic |
| chr11_+_121322832 | 11.41 |
ENST00000260197.7
|
SORL1
|
sortilin-related receptor, L(DLR class) A repeats containing |
| chr14_-_45431091 | 10.89 |
ENST00000579157.1
ENST00000396128.4 ENST00000556500.1 |
KLHL28
|
kelch-like family member 28 |
| chr15_-_48470558 | 10.88 |
ENST00000324324.7
|
MYEF2
|
myelin expression factor 2 |
| chr15_-_83316254 | 10.39 |
ENST00000567678.1
ENST00000450751.2 |
CPEB1
|
cytoplasmic polyadenylation element binding protein 1 |
| chr9_-_101471479 | 9.87 |
ENST00000259455.2
|
GABBR2
|
gamma-aminobutyric acid (GABA) B receptor, 2 |
| chr20_-_48532019 | 9.61 |
ENST00000289431.5
|
SPATA2
|
spermatogenesis associated 2 |
| chr10_+_74451883 | 9.56 |
ENST00000373053.3
ENST00000357157.6 |
MCU
|
mitochondrial calcium uniporter |
| chr6_-_136871957 | 9.33 |
ENST00000354570.3
|
MAP7
|
microtubule-associated protein 7 |
| chr11_+_123396528 | 9.02 |
ENST00000322282.7
ENST00000529750.1 |
GRAMD1B
|
GRAM domain containing 1B |
| chrX_+_110339439 | 8.88 |
ENST00000372010.1
ENST00000519681.1 ENST00000372007.5 |
PAK3
|
p21 protein (Cdc42/Rac)-activated kinase 3 |
| chr11_-_22851367 | 8.50 |
ENST00000354193.4
|
SVIP
|
small VCP/p97-interacting protein |
| chr5_+_161274685 | 8.25 |
ENST00000428797.2
|
GABRA1
|
gamma-aminobutyric acid (GABA) A receptor, alpha 1 |
| chr5_+_65018017 | 7.85 |
ENST00000380985.5
ENST00000502464.1 |
NLN
|
neurolysin (metallopeptidase M3 family) |
| chr1_+_205012293 | 7.17 |
ENST00000331830.4
|
CNTN2
|
contactin 2 (axonal) |
| chr19_+_54466179 | 6.95 |
ENST00000270458.2
|
CACNG8
|
calcium channel, voltage-dependent, gamma subunit 8 |
| chr4_-_90229142 | 6.45 |
ENST00000609438.1
|
GPRIN3
|
GPRIN family member 3 |
| chr21_-_32931290 | 6.41 |
ENST00000286827.3
|
TIAM1
|
T-cell lymphoma invasion and metastasis 1 |
| chr12_-_49110613 | 6.34 |
ENST00000261900.3
|
CCNT1
|
cyclin T1 |
| chr12_-_6798523 | 6.33 |
ENST00000319770.3
|
ZNF384
|
zinc finger protein 384 |
| chr4_-_36246060 | 6.11 |
ENST00000303965.4
|
ARAP2
|
ArfGAP with RhoGAP domain, ankyrin repeat and PH domain 2 |
| chr7_-_71801980 | 5.88 |
ENST00000329008.5
|
CALN1
|
calneuron 1 |
| chr8_-_82024290 | 5.83 |
ENST00000220597.4
|
PAG1
|
phosphoprotein associated with glycosphingolipid microdomains 1 |
| chr6_-_99873145 | 5.78 |
ENST00000369239.5
ENST00000438806.1 |
PNISR
|
PNN-interacting serine/arginine-rich protein |
| chr20_-_48099182 | 5.68 |
ENST00000371741.4
|
KCNB1
|
potassium voltage-gated channel, Shab-related subfamily, member 1 |
| chr14_+_85996471 | 5.38 |
ENST00000330753.4
|
FLRT2
|
fibronectin leucine rich transmembrane protein 2 |
| chr6_+_44238203 | 5.27 |
ENST00000451188.2
|
TMEM151B
|
transmembrane protein 151B |
| chr9_-_21335356 | 5.12 |
ENST00000359039.4
|
KLHL9
|
kelch-like family member 9 |
| chr15_-_73925651 | 5.08 |
ENST00000545878.1
ENST00000287226.8 ENST00000345330.4 |
NPTN
|
neuroplastin |
| chr15_+_44580899 | 4.81 |
ENST00000559222.1
ENST00000299957.6 |
CASC4
|
cancer susceptibility candidate 4 |
| chr4_-_76439596 | 4.50 |
ENST00000451788.1
ENST00000512706.1 |
RCHY1
|
ring finger and CHY zinc finger domain containing 1, E3 ubiquitin protein ligase |
| chr16_-_4292071 | 4.49 |
ENST00000399609.3
|
SRL
|
sarcalumenin |
| chr3_+_32147997 | 4.38 |
ENST00000282541.5
|
GPD1L
|
glycerol-3-phosphate dehydrogenase 1-like |
| chr5_+_139493665 | 4.34 |
ENST00000331327.3
|
PURA
|
purine-rich element binding protein A |
| chr2_+_70142189 | 4.12 |
ENST00000264444.2
|
MXD1
|
MAX dimerization protein 1 |
| chr11_-_117186946 | 4.09 |
ENST00000313005.6
ENST00000528053.1 |
BACE1
|
beta-site APP-cleaving enzyme 1 |
| chr19_-_11591848 | 3.98 |
ENST00000359227.3
|
ELAVL3
|
ELAV like neuron-specific RNA binding protein 3 |
| chr10_-_118764862 | 3.91 |
ENST00000260777.10
|
KIAA1598
|
KIAA1598 |
| chr4_-_39640700 | 3.91 |
ENST00000295958.5
|
SMIM14
|
small integral membrane protein 14 |
| chr9_+_131843377 | 3.82 |
ENST00000372546.4
ENST00000406974.3 ENST00000540102.1 |
DOLPP1
|
dolichyldiphosphatase 1 |
| chr15_-_78423886 | 3.82 |
ENST00000258930.3
|
CIB2
|
calcium and integrin binding family member 2 |
| chr3_-_114790179 | 3.80 |
ENST00000462705.1
|
ZBTB20
|
zinc finger and BTB domain containing 20 |
| chr1_+_110527308 | 3.74 |
ENST00000369799.5
|
AHCYL1
|
adenosylhomocysteinase-like 1 |
| chr16_+_19535133 | 3.56 |
ENST00000396212.2
ENST00000381396.5 |
CCP110
|
centriolar coiled coil protein 110kDa |
| chr19_+_44455368 | 3.52 |
ENST00000591168.1
ENST00000587682.1 ENST00000251269.5 |
ZNF221
|
zinc finger protein 221 |
| chr8_+_1449532 | 3.49 |
ENST00000421627.2
|
DLGAP2
|
discs, large (Drosophila) homolog-associated protein 2 |
| chr4_+_72204755 | 3.41 |
ENST00000512686.1
ENST00000340595.3 |
SLC4A4
|
solute carrier family 4 (sodium bicarbonate cotransporter), member 4 |
| chr5_+_118407053 | 3.39 |
ENST00000311085.8
ENST00000539542.1 |
DMXL1
|
Dmx-like 1 |
| chr18_-_65184217 | 3.37 |
ENST00000310045.7
|
DSEL
|
dermatan sulfate epimerase-like |
| chr11_+_61520075 | 3.36 |
ENST00000278836.5
|
MYRF
|
myelin regulatory factor |
| chr1_+_51701924 | 3.29 |
ENST00000242719.3
|
RNF11
|
ring finger protein 11 |
| chr4_+_6784401 | 3.26 |
ENST00000425103.1
ENST00000307659.5 |
KIAA0232
|
KIAA0232 |
| chr15_-_75744014 | 3.22 |
ENST00000394947.3
ENST00000565264.1 |
SIN3A
|
SIN3 transcription regulator family member A |
| chr17_+_11924129 | 3.16 |
ENST00000353533.5
ENST00000415385.3 |
MAP2K4
|
mitogen-activated protein kinase kinase 4 |
| chr16_+_30669720 | 3.12 |
ENST00000356166.6
|
FBRS
|
fibrosin |
| chr13_+_98086445 | 2.99 |
ENST00000245304.4
|
RAP2A
|
RAP2A, member of RAS oncogene family |
| chr16_+_66878814 | 2.99 |
ENST00000394069.3
|
CA7
|
carbonic anhydrase VII |
| chr9_+_129089088 | 2.97 |
ENST00000361171.3
ENST00000545391.1 |
MVB12B
|
multivesicular body subunit 12B |
| chr2_-_122407097 | 2.90 |
ENST00000409078.3
|
CLASP1
|
cytoplasmic linker associated protein 1 |
| chr12_+_48166978 | 2.89 |
ENST00000442218.2
|
SLC48A1
|
solute carrier family 48 (heme transporter), member 1 |
| chr17_+_46125707 | 2.82 |
ENST00000584137.1
ENST00000362042.3 ENST00000585291.1 ENST00000357480.5 |
NFE2L1
|
nuclear factor, erythroid 2-like 1 |
| chr4_-_87281224 | 2.74 |
ENST00000395169.3
ENST00000395161.2 |
MAPK10
|
mitogen-activated protein kinase 10 |
| chr12_-_4758159 | 2.73 |
ENST00000545990.2
|
AKAP3
|
A kinase (PRKA) anchor protein 3 |
| chr2_-_86564776 | 2.71 |
ENST00000165698.5
ENST00000541910.1 ENST00000535845.1 |
REEP1
|
receptor accessory protein 1 |
| chr14_+_23775971 | 2.49 |
ENST00000250405.5
|
BCL2L2
|
BCL2-like 2 |
| chr2_+_73144604 | 2.44 |
ENST00000258106.6
|
EMX1
|
empty spiracles homeobox 1 |
| chr8_-_80680078 | 2.40 |
ENST00000337919.5
ENST00000354724.3 |
HEY1
|
hes-related family bHLH transcription factor with YRPW motif 1 |
| chr22_-_39151463 | 2.40 |
ENST00000405510.1
ENST00000433561.1 |
SUN2
|
Sad1 and UNC84 domain containing 2 |
| chr9_+_136325089 | 2.28 |
ENST00000291722.7
ENST00000316948.4 ENST00000540581.1 |
CACFD1
|
calcium channel flower domain containing 1 |
| chr6_+_45389893 | 2.28 |
ENST00000371432.3
|
RUNX2
|
runt-related transcription factor 2 |
| chr4_+_85504075 | 2.25 |
ENST00000295887.5
|
CDS1
|
CDP-diacylglycerol synthase (phosphatidate cytidylyltransferase) 1 |
| chr1_-_51984908 | 2.25 |
ENST00000371730.2
|
EPS15
|
epidermal growth factor receptor pathway substrate 15 |
| chr5_+_56111361 | 2.18 |
ENST00000399503.3
|
MAP3K1
|
mitogen-activated protein kinase kinase kinase 1, E3 ubiquitin protein ligase |
| chr14_-_93799360 | 2.14 |
ENST00000334746.5
ENST00000554565.1 ENST00000298896.3 |
BTBD7
|
BTB (POZ) domain containing 7 |
| chr12_+_69864129 | 2.11 |
ENST00000547219.1
ENST00000299293.2 ENST00000549921.1 ENST00000550316.1 ENST00000548154.1 ENST00000547414.1 ENST00000550389.1 ENST00000550937.1 ENST00000549092.1 ENST00000550169.1 |
FRS2
|
fibroblast growth factor receptor substrate 2 |
| chr20_-_41818373 | 2.10 |
ENST00000373187.1
ENST00000356100.2 ENST00000373184.1 ENST00000373190.1 |
PTPRT
|
protein tyrosine phosphatase, receptor type, T |
| chr13_+_42622781 | 1.98 |
ENST00000337343.4
ENST00000261491.5 ENST00000379274.2 |
DGKH
|
diacylglycerol kinase, eta |
| chr5_-_107006596 | 1.97 |
ENST00000333274.6
|
EFNA5
|
ephrin-A5 |
| chr16_-_17564738 | 1.90 |
ENST00000261381.6
|
XYLT1
|
xylosyltransferase I |
| chr6_+_72596604 | 1.90 |
ENST00000348717.5
ENST00000517960.1 ENST00000518273.1 ENST00000522291.1 ENST00000521978.1 ENST00000520567.1 ENST00000264839.7 |
RIMS1
|
regulating synaptic membrane exocytosis 1 |
| chr1_+_210001309 | 1.90 |
ENST00000491415.2
|
DIEXF
|
digestive organ expansion factor homolog (zebrafish) |
| chr10_+_72972281 | 1.88 |
ENST00000335350.6
|
UNC5B
|
unc-5 homolog B (C. elegans) |
| chr6_+_56954867 | 1.80 |
ENST00000370708.4
ENST00000370702.1 |
ZNF451
|
zinc finger protein 451 |
| chr6_+_96463840 | 1.78 |
ENST00000302103.5
|
FUT9
|
fucosyltransferase 9 (alpha (1,3) fucosyltransferase) |
| chr2_+_241375069 | 1.78 |
ENST00000264039.2
|
GPC1
|
glypican 1 |
| chr10_-_116286656 | 1.78 |
ENST00000428430.1
ENST00000369266.3 ENST00000392952.3 |
ABLIM1
|
actin binding LIM protein 1 |
| chr18_+_46065393 | 1.71 |
ENST00000256413.3
|
CTIF
|
CBP80/20-dependent translation initiation factor |
| chr18_+_29598335 | 1.69 |
ENST00000217740.3
|
RNF125
|
ring finger protein 125, E3 ubiquitin protein ligase |
| chr2_-_152955537 | 1.64 |
ENST00000201943.5
ENST00000539935.1 |
CACNB4
|
calcium channel, voltage-dependent, beta 4 subunit |
| chr16_-_57513657 | 1.63 |
ENST00000566936.1
ENST00000568617.1 ENST00000567276.1 ENST00000569548.1 ENST00000569250.1 ENST00000564378.1 |
DOK4
|
docking protein 4 |
| chr20_+_43595115 | 1.63 |
ENST00000372806.3
ENST00000396731.4 ENST00000372801.1 ENST00000499879.2 |
STK4
|
serine/threonine kinase 4 |
| chr10_+_101419187 | 1.59 |
ENST00000370489.4
|
ENTPD7
|
ectonucleoside triphosphate diphosphohydrolase 7 |
| chr2_-_70995307 | 1.58 |
ENST00000264436.4
ENST00000355733.3 ENST00000447731.2 ENST00000430656.1 ENST00000413157.2 |
ADD2
|
adducin 2 (beta) |
| chr16_+_28875126 | 1.47 |
ENST00000359285.5
ENST00000538342.1 |
SH2B1
|
SH2B adaptor protein 1 |
| chr10_+_64564469 | 1.47 |
ENST00000373783.1
|
ADO
|
2-aminoethanethiol (cysteamine) dioxygenase |
| chr12_+_74931551 | 1.44 |
ENST00000519948.2
|
ATXN7L3B
|
ataxin 7-like 3B |
| chr3_-_69101413 | 1.38 |
ENST00000398559.2
|
TMF1
|
TATA element modulatory factor 1 |
| chr14_+_64932210 | 1.35 |
ENST00000394718.4
|
AKAP5
|
A kinase (PRKA) anchor protein 5 |
| chr6_+_170102210 | 1.24 |
ENST00000439249.1
ENST00000332290.2 |
C6orf120
|
chromosome 6 open reading frame 120 |
| chr13_+_25875662 | 1.23 |
ENST00000381736.3
ENST00000463407.1 ENST00000381718.3 |
NUPL1
|
nucleoporin like 1 |
| chr1_-_161102421 | 1.18 |
ENST00000490843.2
ENST00000368006.3 ENST00000392188.1 ENST00000545495.1 |
DEDD
|
death effector domain containing |
| chr18_+_9136758 | 1.16 |
ENST00000383440.2
ENST00000262126.4 ENST00000577992.1 |
ANKRD12
|
ankyrin repeat domain 12 |
| chr4_-_170533723 | 1.15 |
ENST00000510533.1
ENST00000439128.2 ENST00000511633.1 ENST00000512193.1 ENST00000507142.1 |
NEK1
|
NIMA-related kinase 1 |
| chr14_-_34420259 | 1.14 |
ENST00000250457.3
ENST00000547327.2 |
EGLN3
|
egl-9 family hypoxia-inducible factor 3 |
| chrX_+_151806637 | 1.13 |
ENST00000370306.2
|
GABRQ
|
gamma-aminobutyric acid (GABA) A receptor, theta |
| chr2_+_24714729 | 1.13 |
ENST00000406961.1
ENST00000405141.1 |
NCOA1
|
nuclear receptor coactivator 1 |
| chr1_-_220445757 | 1.10 |
ENST00000358951.2
|
RAB3GAP2
|
RAB3 GTPase activating protein subunit 2 (non-catalytic) |
| chr9_-_19786926 | 1.08 |
ENST00000341998.2
ENST00000286344.3 |
SLC24A2
|
solute carrier family 24 (sodium/potassium/calcium exchanger), member 2 |
| chr16_-_30134524 | 1.07 |
ENST00000395202.1
ENST00000395199.3 ENST00000263025.4 ENST00000322266.5 ENST00000403394.1 |
MAPK3
|
mitogen-activated protein kinase 3 |
| chr3_-_185826855 | 1.07 |
ENST00000306376.5
|
ETV5
|
ets variant 5 |
| chr12_-_12419703 | 1.03 |
ENST00000543091.1
ENST00000261349.4 |
LRP6
|
low density lipoprotein receptor-related protein 6 |
| chr21_-_39288743 | 1.03 |
ENST00000609713.1
|
KCNJ6
|
potassium inwardly-rectifying channel, subfamily J, member 6 |
| chr2_-_183903133 | 1.01 |
ENST00000361354.4
|
NCKAP1
|
NCK-associated protein 1 |
| chr22_+_39966758 | 0.95 |
ENST00000407673.1
ENST00000401624.1 ENST00000404898.1 ENST00000402142.3 ENST00000336649.4 ENST00000400164.3 |
CACNA1I
|
calcium channel, voltage-dependent, T type, alpha 1I subunit |
| chr22_-_26879734 | 0.95 |
ENST00000422379.2
ENST00000336873.5 ENST00000398145.2 |
HPS4
|
Hermansky-Pudlak syndrome 4 |
| chr9_-_127533519 | 0.92 |
ENST00000487099.2
ENST00000344523.4 ENST00000373584.3 |
NR6A1
|
nuclear receptor subfamily 6, group A, member 1 |
| chr5_-_141257954 | 0.91 |
ENST00000456271.1
ENST00000394536.3 ENST00000503492.1 ENST00000287008.3 |
PCDH1
|
protocadherin 1 |
| chr7_-_128695147 | 0.90 |
ENST00000482320.1
ENST00000393245.1 ENST00000471234.1 |
TNPO3
|
transportin 3 |
| chr15_+_63569731 | 0.89 |
ENST00000261879.5
|
APH1B
|
APH1B gamma secretase subunit |
| chr6_-_11044509 | 0.88 |
ENST00000354666.3
|
ELOVL2
|
ELOVL fatty acid elongase 2 |
| chr3_-_46249878 | 0.87 |
ENST00000296140.3
|
CCR1
|
chemokine (C-C motif) receptor 1 |
| chr14_+_45553296 | 0.87 |
ENST00000355765.6
ENST00000553605.1 |
PRPF39
|
pre-mRNA processing factor 39 |
| chr14_+_56585048 | 0.86 |
ENST00000267460.4
|
PELI2
|
pellino E3 ubiquitin protein ligase family member 2 |
| chr19_+_18747775 | 0.84 |
ENST00000300976.4
ENST00000595182.1 ENST00000599006.1 |
KLHL26
|
kelch-like family member 26 |
| chr10_-_115904361 | 0.84 |
ENST00000428953.1
ENST00000543782.1 |
C10orf118
|
chromosome 10 open reading frame 118 |
| chr9_+_140772226 | 0.83 |
ENST00000277551.2
ENST00000371372.1 ENST00000277549.5 ENST00000371363.1 ENST00000371357.1 ENST00000371355.4 |
CACNA1B
|
calcium channel, voltage-dependent, N type, alpha 1B subunit |
| chr12_-_117319236 | 0.83 |
ENST00000257572.5
|
HRK
|
harakiri, BCL2 interacting protein (contains only BH3 domain) |
| chr1_+_200708671 | 0.81 |
ENST00000358823.2
|
CAMSAP2
|
calmodulin regulated spectrin-associated protein family, member 2 |
| chr4_+_3768075 | 0.80 |
ENST00000509482.1
ENST00000330055.5 |
ADRA2C
|
adrenoceptor alpha 2C |
| chr8_-_116681221 | 0.80 |
ENST00000395715.3
|
TRPS1
|
trichorhinophalangeal syndrome I |
| chr8_+_26240414 | 0.80 |
ENST00000380629.2
|
BNIP3L
|
BCL2/adenovirus E1B 19kDa interacting protein 3-like |
| chr14_+_101193164 | 0.79 |
ENST00000341267.4
|
DLK1
|
delta-like 1 homolog (Drosophila) |
| chr14_+_59104741 | 0.78 |
ENST00000395153.3
ENST00000335867.4 |
DACT1
|
dishevelled-binding antagonist of beta-catenin 1 |
| chr15_+_79724858 | 0.75 |
ENST00000305428.3
|
KIAA1024
|
KIAA1024 |
| chr11_+_63606373 | 0.74 |
ENST00000402010.2
ENST00000315032.8 ENST00000377809.4 ENST00000413835.2 ENST00000377810.3 |
MARK2
|
MAP/microtubule affinity-regulating kinase 2 |
| chr9_-_80646374 | 0.73 |
ENST00000286548.4
|
GNAQ
|
guanine nucleotide binding protein (G protein), q polypeptide |
| chr22_-_39268308 | 0.73 |
ENST00000407418.3
|
CBX6
|
chromobox homolog 6 |
| chr13_-_31736027 | 0.72 |
ENST00000380406.5
ENST00000320027.5 ENST00000380405.4 |
HSPH1
|
heat shock 105kDa/110kDa protein 1 |
| chr17_+_5031687 | 0.71 |
ENST00000250066.6
ENST00000304328.5 |
USP6
|
ubiquitin specific peptidase 6 (Tre-2 oncogene) |
| chr12_-_56583332 | 0.70 |
ENST00000347471.4
ENST00000267064.4 ENST00000394023.3 |
SMARCC2
|
SWI/SNF related, matrix associated, actin dependent regulator of chromatin, subfamily c, member 2 |
| chr3_+_29322803 | 0.68 |
ENST00000396583.3
ENST00000383767.2 |
RBMS3
|
RNA binding motif, single stranded interacting protein 3 |
| chr1_+_77333117 | 0.67 |
ENST00000477717.1
|
ST6GALNAC5
|
ST6 (alpha-N-acetyl-neuraminyl-2,3-beta-galactosyl-1,3)-N-acetylgalactosaminide alpha-2,6-sialyltransferase 5 |
| chr10_+_60272814 | 0.65 |
ENST00000373886.3
|
BICC1
|
bicaudal C homolog 1 (Drosophila) |
| chr20_+_43374421 | 0.62 |
ENST00000372861.3
|
KCNK15
|
potassium channel, subfamily K, member 15 |
| chr11_-_47198380 | 0.59 |
ENST00000419701.2
ENST00000526342.1 ENST00000528444.1 ENST00000530596.1 ENST00000525398.1 ENST00000319543.6 ENST00000426335.2 ENST00000527927.1 ENST00000525314.1 |
ARFGAP2
|
ADP-ribosylation factor GTPase activating protein 2 |
| chr5_-_137368708 | 0.58 |
ENST00000033079.3
|
FAM13B
|
family with sequence similarity 13, member B |
| chr2_-_54087066 | 0.56 |
ENST00000394705.2
ENST00000352846.3 ENST00000406625.2 |
GPR75
GPR75-ASB3
ASB3
|
G protein-coupled receptor 75 GPR75-ASB3 readthrough Ankyrin repeat and SOCS box protein 3 |
| chr6_+_50786414 | 0.55 |
ENST00000344788.3
ENST00000393655.3 ENST00000263046.4 |
TFAP2B
|
transcription factor AP-2 beta (activating enhancer binding protein 2 beta) |
| chr9_+_37800758 | 0.50 |
ENST00000242323.7
|
DCAF10
|
DDB1 and CUL4 associated factor 10 |
| chr5_-_43313574 | 0.49 |
ENST00000325110.6
ENST00000433297.2 |
HMGCS1
|
3-hydroxy-3-methylglutaryl-CoA synthase 1 (soluble) |
| chr21_-_34144157 | 0.48 |
ENST00000331923.4
|
PAXBP1
|
PAX3 and PAX7 binding protein 1 |
| chr6_+_37225540 | 0.46 |
ENST00000373491.3
|
TBC1D22B
|
TBC1 domain family, member 22B |
| chr17_+_58677539 | 0.45 |
ENST00000305921.3
|
PPM1D
|
protein phosphatase, Mg2+/Mn2+ dependent, 1D |
| chr2_+_45878790 | 0.45 |
ENST00000306156.3
|
PRKCE
|
protein kinase C, epsilon |
| chr17_-_73775839 | 0.43 |
ENST00000592643.1
ENST00000591890.1 ENST00000587171.1 ENST00000254810.4 ENST00000589599.1 |
H3F3B
|
H3 histone, family 3B (H3.3B) |
| chr9_-_124989804 | 0.43 |
ENST00000373755.2
ENST00000373754.2 |
LHX6
|
LIM homeobox 6 |
| chr10_+_11206925 | 0.41 |
ENST00000354440.2
ENST00000315874.4 ENST00000427450.1 |
CELF2
|
CUGBP, Elav-like family member 2 |
| chr15_+_33603147 | 0.41 |
ENST00000415757.3
ENST00000389232.4 |
RYR3
|
ryanodine receptor 3 |
| chr6_-_108279369 | 0.38 |
ENST00000369002.4
|
SEC63
|
SEC63 homolog (S. cerevisiae) |
| chr2_+_242577027 | 0.33 |
ENST00000402096.1
ENST00000404914.3 |
ATG4B
|
autophagy related 4B, cysteine peptidase |
| chr12_-_81331697 | 0.32 |
ENST00000552864.1
|
LIN7A
|
lin-7 homolog A (C. elegans) |
| chr1_-_93426998 | 0.31 |
ENST00000370310.4
|
FAM69A
|
family with sequence similarity 69, member A |
| chr13_-_49107303 | 0.31 |
ENST00000344532.3
|
RCBTB2
|
regulator of chromosome condensation (RCC1) and BTB (POZ) domain containing protein 2 |
| chr2_-_172750733 | 0.30 |
ENST00000392592.4
ENST00000422440.2 |
SLC25A12
|
solute carrier family 25 (aspartate/glutamate carrier), member 12 |
| chr9_+_129567282 | 0.29 |
ENST00000449886.1
ENST00000373464.4 ENST00000450858.1 |
ZBTB43
|
zinc finger and BTB domain containing 43 |
| chr5_+_176560742 | 0.27 |
ENST00000439151.2
|
NSD1
|
nuclear receptor binding SET domain protein 1 |
| chr12_+_130646999 | 0.26 |
ENST00000539839.1
ENST00000229030.4 |
FZD10
|
frizzled family receptor 10 |
| chr22_-_22863466 | 0.26 |
ENST00000406426.1
ENST00000360412.2 |
ZNF280B
|
zinc finger protein 280B |
| chr9_-_73736511 | 0.26 |
ENST00000377110.3
ENST00000377111.2 |
TRPM3
|
transient receptor potential cation channel, subfamily M, member 3 |
| chr3_+_38495333 | 0.23 |
ENST00000352511.4
|
ACVR2B
|
activin A receptor, type IIB |
| chr16_-_15736953 | 0.21 |
ENST00000548025.1
ENST00000551742.1 ENST00000602337.1 ENST00000344181.3 ENST00000396368.3 |
KIAA0430
|
KIAA0430 |
| chr4_+_177241094 | 0.20 |
ENST00000503362.1
|
SPCS3
|
signal peptidase complex subunit 3 homolog (S. cerevisiae) |
| chr3_-_52931557 | 0.18 |
ENST00000504329.1
ENST00000355083.5 |
TMEM110-MUSTN1
TMEM110
|
TMEM110-MUSTN1 readthrough transmembrane protein 110 |
| chr22_+_41697520 | 0.18 |
ENST00000352645.4
|
ZC3H7B
|
zinc finger CCCH-type containing 7B |
| chrX_+_16804544 | 0.17 |
ENST00000380122.5
ENST00000398155.4 |
TXLNG
|
taxilin gamma |
| chr4_-_68620053 | 0.14 |
ENST00000420975.2
ENST00000226413.4 |
GNRHR
|
gonadotropin-releasing hormone receptor |
| chr17_-_79885576 | 0.11 |
ENST00000574686.1
ENST00000357736.4 |
MAFG
|
v-maf avian musculoaponeurotic fibrosarcoma oncogene homolog G |
| chr6_+_37321748 | 0.10 |
ENST00000373479.4
ENST00000394443.4 |
RNF8
|
ring finger protein 8, E3 ubiquitin protein ligase |
| chr13_-_40177261 | 0.09 |
ENST00000379589.3
|
LHFP
|
lipoma HMGIC fusion partner |
| chr22_-_31688431 | 0.01 |
ENST00000402249.3
ENST00000443175.1 ENST00000215912.5 ENST00000441972.1 |
PIK3IP1
|
phosphoinositide-3-kinase interacting protein 1 |
| chr14_-_76127519 | 0.01 |
ENST00000256319.6
|
C14orf1
|
chromosome 14 open reading frame 1 |
Network of associatons between targets according to the STRING database.

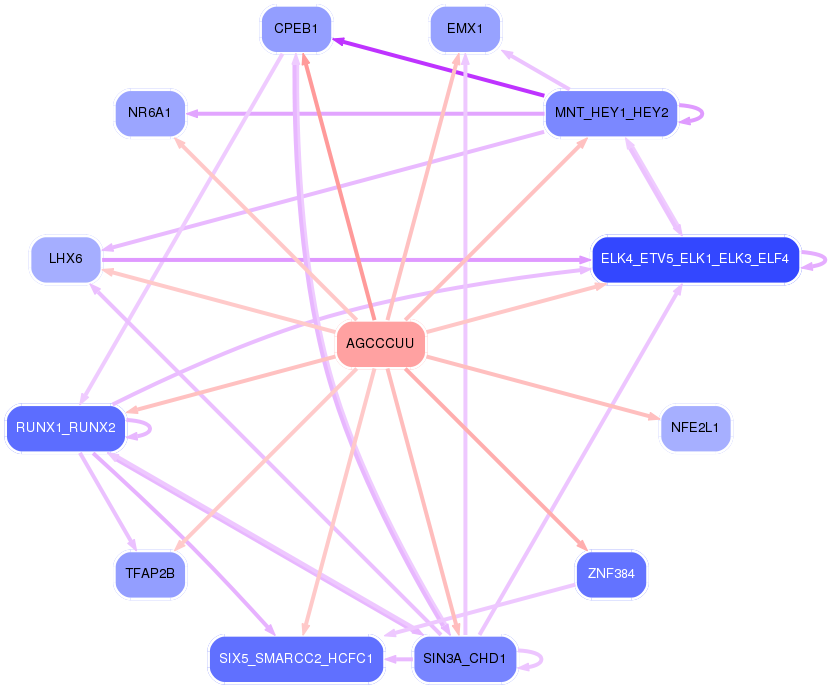
First level regulatory network of AGCCCUU
Gene Ontology Analysis
Gene overrepresentation in biological_process category:
| Log-likelihood per target | Total log-likelihood | Term | Description |
|---|---|---|---|
| 3.8 | 11.4 | GO:1902948 | regulation of choline O-acetyltransferase activity(GO:1902769) positive regulation of choline O-acetyltransferase activity(GO:1902771) negative regulation of tau-protein kinase activity(GO:1902948) positive regulation of early endosome to recycling endosome transport(GO:1902955) negative regulation of aspartic-type endopeptidase activity involved in amyloid precursor protein catabolic process(GO:1902960) negative regulation of neurofibrillary tangle assembly(GO:1902997) negative regulation of aspartic-type peptidase activity(GO:1905246) |
| 3.0 | 21.3 | GO:0060373 | regulation of ventricular cardiac muscle cell membrane depolarization(GO:0060373) |
| 2.9 | 28.8 | GO:0051581 | negative regulation of neurotransmitter uptake(GO:0051581) serotonin uptake(GO:0051610) regulation of serotonin uptake(GO:0051611) negative regulation of serotonin uptake(GO:0051612) |
| 2.8 | 8.5 | GO:1903070 | negative regulation of ER-associated ubiquitin-dependent protein catabolic process(GO:1903070) |
| 2.8 | 14.1 | GO:0090258 | negative regulation of mitochondrial fission(GO:0090258) |
| 2.6 | 7.8 | GO:1902809 | skeletal muscle fiber differentiation(GO:0098528) regulation of skeletal muscle fiber differentiation(GO:1902809) |
| 2.4 | 7.2 | GO:0060168 | regulation of axon diameter(GO:0031133) positive regulation of adenosine receptor signaling pathway(GO:0060168) |
| 1.8 | 8.8 | GO:2000671 | regulation of motor neuron apoptotic process(GO:2000671) |
| 1.7 | 5.1 | GO:0048170 | positive regulation of long-term neuronal synaptic plasticity(GO:0048170) |
| 1.6 | 9.6 | GO:0036444 | calcium ion transmembrane import into mitochondrion(GO:0036444) |
| 1.3 | 10.4 | GO:2000766 | negative regulation of cytoplasmic translation(GO:2000766) |
| 1.1 | 3.2 | GO:0051595 | response to methylglyoxal(GO:0051595) |
| 1.1 | 6.4 | GO:1904338 | regulation of dopaminergic neuron differentiation(GO:1904338) |
| 1.0 | 1.0 | GO:0090244 | Wnt signaling pathway involved in somitogenesis(GO:0090244) |
| 0.9 | 5.4 | GO:0061343 | cell adhesion involved in heart morphogenesis(GO:0061343) |
| 0.9 | 3.6 | GO:0032053 | ciliary basal body organization(GO:0032053) |
| 0.7 | 2.1 | GO:0046619 | optic placode formation involved in camera-type eye formation(GO:0046619) |
| 0.6 | 6.3 | GO:1901409 | positive regulation of phosphorylation of RNA polymerase II C-terminal domain(GO:1901409) |
| 0.6 | 2.4 | GO:0021796 | cerebral cortex regionalization(GO:0021796) |
| 0.6 | 2.4 | GO:2000820 | negative regulation of transcription from RNA polymerase II promoter involved in smooth muscle cell differentiation(GO:2000820) |
| 0.6 | 3.0 | GO:0032849 | positive regulation of cellular pH reduction(GO:0032849) |
| 0.5 | 3.8 | GO:0046465 | dolichyl diphosphate biosynthetic process(GO:0006489) dolichyl diphosphate metabolic process(GO:0046465) |
| 0.5 | 3.7 | GO:0033353 | S-adenosylmethionine cycle(GO:0033353) |
| 0.5 | 21.6 | GO:0070884 | regulation of calcineurin-NFAT signaling cascade(GO:0070884) |
| 0.4 | 4.3 | GO:0006268 | DNA unwinding involved in DNA replication(GO:0006268) |
| 0.4 | 18.1 | GO:0007214 | gamma-aminobutyric acid signaling pathway(GO:0007214) |
| 0.4 | 2.4 | GO:0031022 | nuclear migration along microfilament(GO:0031022) |
| 0.4 | 9.3 | GO:0010763 | positive regulation of fibroblast migration(GO:0010763) |
| 0.4 | 1.1 | GO:0045925 | positive regulation of female receptivity(GO:0045925) |
| 0.4 | 3.4 | GO:0032286 | central nervous system myelin maintenance(GO:0032286) |
| 0.4 | 2.9 | GO:1903690 | negative regulation of wound healing, spreading of epidermal cells(GO:1903690) |
| 0.4 | 14.7 | GO:0048791 | calcium ion-regulated exocytosis of neurotransmitter(GO:0048791) |
| 0.4 | 2.5 | GO:0060011 | Sertoli cell proliferation(GO:0060011) |
| 0.4 | 1.8 | GO:0030200 | heparan sulfate proteoglycan catabolic process(GO:0030200) |
| 0.3 | 2.7 | GO:0007258 | JUN phosphorylation(GO:0007258) |
| 0.3 | 1.6 | GO:0060800 | regulation of cell differentiation involved in embryonic placenta development(GO:0060800) |
| 0.3 | 2.3 | GO:0006655 | phosphatidylglycerol biosynthetic process(GO:0006655) |
| 0.3 | 2.3 | GO:0019065 | receptor-mediated endocytosis of virus by host cell(GO:0019065) endocytosis involved in viral entry into host cell(GO:0075509) |
| 0.3 | 1.0 | GO:0048075 | positive regulation of eye pigmentation(GO:0048075) |
| 0.3 | 7.0 | GO:2000311 | regulation of alpha-amino-3-hydroxy-5-methyl-4-isoxazole propionate selective glutamate receptor activity(GO:2000311) |
| 0.3 | 3.0 | GO:0045198 | establishment of epithelial cell apical/basal polarity(GO:0045198) |
| 0.3 | 1.5 | GO:0033564 | anterior/posterior axon guidance(GO:0033564) |
| 0.3 | 2.3 | GO:0002051 | osteoblast fate commitment(GO:0002051) |
| 0.3 | 3.4 | GO:0070070 | proton-transporting V-type ATPase complex assembly(GO:0070070) vacuolar proton-transporting V-type ATPase complex assembly(GO:0070072) |
| 0.3 | 1.4 | GO:2000843 | testosterone secretion(GO:0035936) regulation of testosterone secretion(GO:2000843) positive regulation of testosterone secretion(GO:2000845) |
| 0.3 | 1.1 | GO:0060762 | regulation of branching involved in mammary gland duct morphogenesis(GO:0060762) |
| 0.3 | 2.9 | GO:0015886 | heme transport(GO:0015886) |
| 0.3 | 1.8 | GO:0060633 | negative regulation of transcription initiation from RNA polymerase II promoter(GO:0060633) |
| 0.2 | 4.2 | GO:0071318 | cellular response to ATP(GO:0071318) |
| 0.2 | 1.1 | GO:1903059 | regulation of protein lipidation(GO:1903059) positive regulation of protein lipidation(GO:1903061) |
| 0.2 | 1.1 | GO:0000189 | MAPK import into nucleus(GO:0000189) |
| 0.2 | 0.8 | GO:0032811 | negative regulation of epinephrine secretion(GO:0032811) epidermal growth factor-activated receptor transactivation by G-protein coupled receptor signaling pathway(GO:0035625) |
| 0.2 | 2.0 | GO:0048672 | positive regulation of collateral sprouting(GO:0048672) |
| 0.2 | 3.0 | GO:0043162 | ubiquitin-dependent protein catabolic process via the multivesicular body sorting pathway(GO:0043162) |
| 0.2 | 13.2 | GO:0010812 | negative regulation of cell-substrate adhesion(GO:0010812) |
| 0.2 | 4.5 | GO:0070987 | error-free translesion synthesis(GO:0070987) |
| 0.1 | 1.8 | GO:0042355 | fucose catabolic process(GO:0019317) L-fucose metabolic process(GO:0042354) L-fucose catabolic process(GO:0042355) |
| 0.1 | 1.9 | GO:0030206 | chondroitin sulfate biosynthetic process(GO:0030206) |
| 0.1 | 0.7 | GO:1903748 | negative regulation of establishment of protein localization to mitochondrion(GO:1903748) |
| 0.1 | 0.5 | GO:0008063 | Toll signaling pathway(GO:0008063) |
| 0.1 | 3.4 | GO:0030208 | dermatan sulfate biosynthetic process(GO:0030208) |
| 0.1 | 0.8 | GO:0035694 | mitochondrial protein catabolic process(GO:0035694) |
| 0.1 | 0.8 | GO:1900107 | regulation of nodal signaling pathway(GO:1900107) |
| 0.1 | 4.1 | GO:0010738 | regulation of protein kinase A signaling(GO:0010738) |
| 0.1 | 1.5 | GO:0000098 | sulfur amino acid catabolic process(GO:0000098) |
| 0.1 | 0.3 | GO:0051697 | protein delipidation(GO:0051697) |
| 0.1 | 10.9 | GO:0014902 | myotube differentiation(GO:0014902) |
| 0.1 | 1.0 | GO:2000601 | positive regulation of Arp2/3 complex-mediated actin nucleation(GO:2000601) |
| 0.1 | 0.3 | GO:0043490 | malate-aspartate shuttle(GO:0043490) |
| 0.1 | 4.1 | GO:0050435 | beta-amyloid metabolic process(GO:0050435) |
| 0.1 | 1.6 | GO:0034656 | nucleobase-containing small molecule catabolic process(GO:0034656) |
| 0.1 | 0.9 | GO:0007220 | Notch receptor processing(GO:0007220) |
| 0.1 | 0.9 | GO:0000395 | mRNA 5'-splice site recognition(GO:0000395) |
| 0.1 | 0.9 | GO:0039536 | negative regulation of RIG-I signaling pathway(GO:0039536) |
| 0.1 | 3.8 | GO:0032728 | positive regulation of interferon-beta production(GO:0032728) |
| 0.1 | 2.8 | GO:0006783 | heme biosynthetic process(GO:0006783) |
| 0.1 | 0.3 | GO:0038031 | non-canonical Wnt signaling pathway via JNK cascade(GO:0038031) |
| 0.1 | 9.3 | GO:0006970 | response to osmotic stress(GO:0006970) |
| 0.1 | 0.7 | GO:0045634 | regulation of melanocyte differentiation(GO:0045634) |
| 0.1 | 0.5 | GO:0072501 | cellular divalent inorganic anion homeostasis(GO:0072501) |
| 0.1 | 0.4 | GO:0006620 | posttranslational protein targeting to membrane(GO:0006620) |
| 0.1 | 3.4 | GO:0015701 | bicarbonate transport(GO:0015701) |
| 0.1 | 0.3 | GO:1903361 | protein localization to basolateral plasma membrane(GO:1903361) |
| 0.1 | 2.2 | GO:0002755 | MyD88-dependent toll-like receptor signaling pathway(GO:0002755) |
| 0.1 | 0.5 | GO:2000288 | positive regulation of myoblast proliferation(GO:2000288) |
| 0.1 | 0.2 | GO:0032237 | activation of store-operated calcium channel activity(GO:0032237) positive regulation of NFAT protein import into nucleus(GO:0051533) regulation of store-operated calcium channel activity(GO:1901339) positive regulation of store-operated calcium channel activity(GO:1901341) |
| 0.1 | 0.8 | GO:0032464 | positive regulation of protein homooligomerization(GO:0032464) |
| 0.1 | 0.6 | GO:0030322 | stabilization of membrane potential(GO:0030322) |
| 0.1 | 0.5 | GO:0071372 | cellular response to follicle-stimulating hormone stimulus(GO:0071372) |
| 0.1 | 1.6 | GO:0050901 | leukocyte tethering or rolling(GO:0050901) |
| 0.1 | 0.9 | GO:0090026 | positive regulation of monocyte chemotaxis(GO:0090026) |
| 0.1 | 2.0 | GO:0007205 | protein kinase C-activating G-protein coupled receptor signaling pathway(GO:0007205) |
| 0.1 | 3.4 | GO:0051865 | protein autoubiquitination(GO:0051865) |
| 0.1 | 5.8 | GO:0050868 | negative regulation of T cell activation(GO:0050868) |
| 0.1 | 1.0 | GO:0045956 | positive regulation of calcium ion-dependent exocytosis(GO:0045956) |
| 0.0 | 1.9 | GO:0000462 | maturation of SSU-rRNA from tricistronic rRNA transcript (SSU-rRNA, 5.8S rRNA, LSU-rRNA)(GO:0000462) |
| 0.0 | 1.1 | GO:0006919 | activation of cysteine-type endopeptidase activity involved in apoptotic process(GO:0006919) |
| 0.0 | 0.4 | GO:0021830 | interneuron migration from the subpallium to the cortex(GO:0021830) cerebral cortex GABAergic interneuron migration(GO:0021853) interneuron migration(GO:1904936) |
| 0.0 | 1.1 | GO:0060292 | long term synaptic depression(GO:0060292) |
| 0.0 | 0.8 | GO:0048265 | response to pain(GO:0048265) |
| 0.0 | 0.3 | GO:0034770 | regulation of histone H3-K36 methylation(GO:0000414) histone H4-K20 methylation(GO:0034770) |
| 0.0 | 0.7 | GO:0009312 | oligosaccharide biosynthetic process(GO:0009312) |
| 0.0 | 0.1 | GO:0097210 | response to gonadotropin-releasing hormone(GO:0097210) cellular response to gonadotropin-releasing hormone(GO:0097211) |
| 0.0 | 1.6 | GO:1901385 | regulation of voltage-gated calcium channel activity(GO:1901385) |
| 0.0 | 0.2 | GO:0032927 | positive regulation of activin receptor signaling pathway(GO:0032927) |
| 0.0 | 3.5 | GO:0007270 | neuron-neuron synaptic transmission(GO:0007270) |
| 0.0 | 0.8 | GO:0045746 | negative regulation of Notch signaling pathway(GO:0045746) |
| 0.0 | 0.5 | GO:0035970 | peptidyl-threonine dephosphorylation(GO:0035970) |
| 0.0 | 0.7 | GO:0006337 | nucleosome disassembly(GO:0006337) |
| 0.0 | 1.0 | GO:0010107 | potassium ion import(GO:0010107) |
| 0.0 | 1.5 | GO:0045840 | positive regulation of mitotic nuclear division(GO:0045840) |
| 0.0 | 5.2 | GO:0006469 | negative regulation of protein kinase activity(GO:0006469) |
| 0.0 | 11.4 | GO:0048232 | spermatogenesis(GO:0007283) male gamete generation(GO:0048232) |
| 0.0 | 0.3 | GO:0016048 | detection of temperature stimulus(GO:0016048) |
| 0.0 | 1.7 | GO:0006446 | regulation of translational initiation(GO:0006446) |
| 0.0 | 0.3 | GO:0071786 | endoplasmic reticulum tubular network organization(GO:0071786) |
| 0.0 | 0.7 | GO:0045197 | establishment or maintenance of epithelial cell apical/basal polarity(GO:0045197) |
| 0.0 | 1.1 | GO:1902476 | chloride transmembrane transport(GO:1902476) |
| 0.0 | 1.2 | GO:0031338 | regulation of vesicle fusion(GO:0031338) |
| 0.0 | 0.4 | GO:0006376 | mRNA splice site selection(GO:0006376) |
| 0.0 | 1.3 | GO:0035335 | peptidyl-tyrosine dephosphorylation(GO:0035335) |
| 0.0 | 0.9 | GO:0006636 | unsaturated fatty acid biosynthetic process(GO:0006636) |
Gene overrepresentation in cellular_component category:
| Log-likelihood per target | Total log-likelihood | Term | Description |
|---|---|---|---|
| 3.3 | 9.9 | GO:0038039 | G-protein coupled receptor heterodimeric complex(GO:0038039) |
| 2.8 | 14.1 | GO:0045298 | tubulin complex(GO:0045298) |
| 2.4 | 9.6 | GO:1990246 | uniplex complex(GO:1990246) |
| 1.1 | 3.4 | GO:0043291 | RAVE complex(GO:0043291) |
| 1.0 | 20.4 | GO:0033268 | node of Ranvier(GO:0033268) |
| 1.0 | 16.9 | GO:0001518 | voltage-gated sodium channel complex(GO:0001518) |
| 0.9 | 8.5 | GO:0030868 | smooth endoplasmic reticulum membrane(GO:0030868) smooth endoplasmic reticulum part(GO:0097425) |
| 0.8 | 11.4 | GO:0005641 | nuclear envelope lumen(GO:0005641) |
| 0.7 | 4.4 | GO:0009331 | glycerol-3-phosphate dehydrogenase complex(GO:0009331) |
| 0.6 | 3.8 | GO:0005927 | muscle tendon junction(GO:0005927) |
| 0.6 | 6.3 | GO:0008024 | cyclin/CDK positive transcription elongation factor complex(GO:0008024) |
| 0.5 | 10.4 | GO:1990124 | messenger ribonucleoprotein complex(GO:1990124) |
| 0.5 | 2.9 | GO:0030981 | cortical microtubule cytoskeleton(GO:0030981) |
| 0.4 | 3.0 | GO:0000813 | ESCRT I complex(GO:0000813) |
| 0.4 | 5.1 | GO:0060077 | inhibitory synapse(GO:0060077) |
| 0.4 | 4.5 | GO:0033018 | sarcoplasmic reticulum lumen(GO:0033018) |
| 0.3 | 1.0 | GO:1990851 | Wnt-Frizzled-LRP5/6 complex(GO:1990851) |
| 0.3 | 14.7 | GO:0048786 | presynaptic active zone(GO:0048786) |
| 0.3 | 6.4 | GO:0044295 | axonal growth cone(GO:0044295) |
| 0.3 | 4.3 | GO:0005662 | DNA replication factor A complex(GO:0005662) |
| 0.3 | 9.4 | GO:1902711 | GABA-A receptor complex(GO:1902711) |
| 0.3 | 5.7 | GO:0044298 | neuronal cell body membrane(GO:0032809) cell body membrane(GO:0044298) |
| 0.2 | 2.7 | GO:0035686 | sperm fibrous sheath(GO:0035686) |
| 0.2 | 16.5 | GO:0031463 | Cul3-RING ubiquitin ligase complex(GO:0031463) |
| 0.2 | 7.0 | GO:0032281 | AMPA glutamate receptor complex(GO:0032281) |
| 0.2 | 1.0 | GO:0031085 | BLOC-3 complex(GO:0031085) |
| 0.2 | 2.5 | GO:0097136 | Bcl-2 family protein complex(GO:0097136) |
| 0.2 | 2.4 | GO:0034993 | microtubule organizing center attachment site(GO:0034992) LINC complex(GO:0034993) |
| 0.1 | 2.9 | GO:0071782 | endoplasmic reticulum tubular network(GO:0071782) |
| 0.1 | 3.2 | GO:0016580 | Sin3 complex(GO:0016580) |
| 0.1 | 2.0 | GO:0031362 | anchored component of external side of plasma membrane(GO:0031362) |
| 0.1 | 3.2 | GO:0032839 | dendrite cytoplasm(GO:0032839) |
| 0.1 | 32.9 | GO:0014069 | postsynaptic density(GO:0014069) postsynaptic specialization(GO:0099572) |
| 0.1 | 0.7 | GO:0097427 | microtubule bundle(GO:0097427) |
| 0.1 | 2.3 | GO:0030122 | AP-2 adaptor complex(GO:0030122) |
| 0.1 | 1.0 | GO:0031209 | SCAR complex(GO:0031209) |
| 0.1 | 7.8 | GO:0005758 | mitochondrial intermembrane space(GO:0005758) |
| 0.1 | 0.9 | GO:0070765 | gamma-secretase complex(GO:0070765) |
| 0.1 | 27.2 | GO:0045121 | membrane raft(GO:0045121) |
| 0.1 | 1.9 | GO:0032040 | small-subunit processome(GO:0032040) |
| 0.1 | 0.9 | GO:0000243 | commitment complex(GO:0000243) |
| 0.1 | 0.8 | GO:0030877 | beta-catenin destruction complex(GO:0030877) |
| 0.1 | 9.1 | GO:0001650 | fibrillar center(GO:0001650) |
| 0.1 | 1.1 | GO:0000242 | pericentriolar material(GO:0000242) |
| 0.1 | 9.3 | GO:0005875 | microtubule associated complex(GO:0005875) |
| 0.1 | 0.8 | GO:1990752 | microtubule end(GO:1990752) |
| 0.0 | 7.0 | GO:0055037 | recycling endosome(GO:0055037) |
| 0.0 | 3.6 | GO:0005814 | centriole(GO:0005814) |
| 0.0 | 2.5 | GO:0032588 | trans-Golgi network membrane(GO:0032588) |
| 0.0 | 0.7 | GO:0071564 | npBAF complex(GO:0071564) |
| 0.0 | 0.2 | GO:0005787 | signal peptidase complex(GO:0005787) |
| 0.0 | 0.7 | GO:0071682 | endocytic vesicle lumen(GO:0071682) |
| 0.0 | 2.1 | GO:0005913 | cell-cell adherens junction(GO:0005913) |
| 0.0 | 1.8 | GO:0032580 | Golgi cisterna membrane(GO:0032580) |
| 0.0 | 0.5 | GO:0080008 | Cul4-RING E3 ubiquitin ligase complex(GO:0080008) |
| 0.0 | 5.1 | GO:0005768 | endosome(GO:0005768) |
| 0.0 | 0.8 | GO:0005891 | voltage-gated calcium channel complex(GO:0005891) |
| 0.0 | 1.6 | GO:0001725 | stress fiber(GO:0001725) contractile actin filament bundle(GO:0097517) |
| 0.0 | 3.6 | GO:0016324 | apical plasma membrane(GO:0016324) |
| 0.0 | 1.0 | GO:0008076 | voltage-gated potassium channel complex(GO:0008076) potassium channel complex(GO:0034705) |
| 0.0 | 0.5 | GO:0005834 | heterotrimeric G-protein complex(GO:0005834) |
| 0.0 | 1.6 | GO:0030666 | endocytic vesicle membrane(GO:0030666) |
| 0.0 | 3.4 | GO:0016323 | basolateral plasma membrane(GO:0016323) |
| 0.0 | 0.4 | GO:0033017 | sarcoplasmic reticulum membrane(GO:0033017) |
| 0.0 | 6.2 | GO:0016607 | nuclear speck(GO:0016607) |
| 0.0 | 0.7 | GO:0031519 | PcG protein complex(GO:0031519) |
| 0.0 | 2.9 | GO:0098852 | lysosomal membrane(GO:0005765) lytic vacuole membrane(GO:0098852) |
Gene overrepresentation in molecular_function category:
| Log-likelihood per target | Total log-likelihood | Term | Description |
|---|---|---|---|
| 4.0 | 24.2 | GO:0010858 | calcium-dependent protein kinase regulator activity(GO:0010858) |
| 3.8 | 23.0 | GO:0008597 | calcium-dependent protein serine/threonine phosphatase regulator activity(GO:0008597) |
| 3.5 | 14.1 | GO:0099609 | microtubule lateral binding(GO:0099609) |
| 3.4 | 16.9 | GO:0086006 | voltage-gated sodium channel activity involved in cardiac muscle cell action potential(GO:0086006) |
| 3.3 | 9.9 | GO:0004965 | G-protein coupled GABA receptor activity(GO:0004965) |
| 1.4 | 4.3 | GO:0032422 | purine-rich negative regulatory element binding(GO:0032422) |
| 1.4 | 4.1 | GO:0008798 | beta-aspartyl-peptidase activity(GO:0008798) |
| 1.3 | 5.1 | GO:0005105 | type 1 fibroblast growth factor receptor binding(GO:0005105) |
| 1.1 | 3.4 | GO:0047757 | chondroitin-glucuronate 5-epimerase activity(GO:0047757) |
| 1.0 | 8.2 | GO:1904315 | neurotransmitter receptor activity involved in regulation of postsynaptic membrane potential(GO:0099529) transmitter-gated ion channel activity involved in regulation of postsynaptic membrane potential(GO:1904315) |
| 0.8 | 6.3 | GO:0097322 | 7SK snRNA binding(GO:0097322) |
| 0.8 | 2.3 | GO:0004605 | phosphatidate cytidylyltransferase activity(GO:0004605) |
| 0.7 | 2.9 | GO:0043515 | kinetochore binding(GO:0043515) |
| 0.7 | 11.4 | GO:0030306 | ADP-ribosylation factor binding(GO:0030306) |
| 0.7 | 2.0 | GO:0005169 | neurotrophin TRKB receptor binding(GO:0005169) |
| 0.6 | 10.4 | GO:0035925 | mRNA 3'-UTR AU-rich region binding(GO:0035925) |
| 0.6 | 1.9 | GO:0030158 | protein xylosyltransferase activity(GO:0030158) |
| 0.6 | 3.7 | GO:0004013 | adenosylhomocysteinase activity(GO:0004013) trialkylsulfonium hydrolase activity(GO:0016802) |
| 0.6 | 2.4 | GO:0035939 | microsatellite binding(GO:0035939) |
| 0.6 | 2.9 | GO:0070097 | delta-catenin binding(GO:0070097) |
| 0.5 | 15.8 | GO:0004708 | MAP kinase kinase activity(GO:0004708) |
| 0.5 | 13.2 | GO:0008191 | metalloendopeptidase inhibitor activity(GO:0008191) |
| 0.4 | 7.9 | GO:0005068 | transmembrane receptor protein tyrosine kinase adaptor activity(GO:0005068) |
| 0.4 | 0.4 | GO:0048763 | calcium-induced calcium release activity(GO:0048763) |
| 0.4 | 1.8 | GO:0061665 | SUMO ligase activity(GO:0061665) |
| 0.4 | 5.4 | GO:0045499 | chemorepellent activity(GO:0045499) |
| 0.3 | 1.0 | GO:0008332 | low voltage-gated calcium channel activity(GO:0008332) |
| 0.3 | 1.9 | GO:0034511 | U3 snoRNA binding(GO:0034511) |
| 0.3 | 0.9 | GO:0030627 | pre-mRNA 5'-splice site binding(GO:0030627) |
| 0.3 | 2.9 | GO:0015232 | heme transporter activity(GO:0015232) |
| 0.3 | 0.8 | GO:0004938 | alpha2-adrenergic receptor activity(GO:0004938) |
| 0.2 | 15.7 | GO:0043621 | protein self-association(GO:0043621) |
| 0.2 | 0.7 | GO:0001665 | alpha-N-acetylgalactosaminide alpha-2,6-sialyltransferase activity(GO:0001665) |
| 0.2 | 1.8 | GO:0046920 | alpha-(1->3)-fucosyltransferase activity(GO:0046920) |
| 0.2 | 5.7 | GO:0005251 | delayed rectifier potassium channel activity(GO:0005251) |
| 0.2 | 1.1 | GO:0008273 | calcium, potassium:sodium antiporter activity(GO:0008273) |
| 0.2 | 4.0 | GO:0017091 | AU-rich element binding(GO:0017091) |
| 0.2 | 4.6 | GO:0030676 | Rac guanyl-nucleotide exchange factor activity(GO:0030676) |
| 0.2 | 3.4 | GO:0008510 | sodium:bicarbonate symporter activity(GO:0008510) |
| 0.2 | 3.0 | GO:0004089 | carbonate dehydratase activity(GO:0004089) |
| 0.2 | 6.8 | GO:0005245 | voltage-gated calcium channel activity(GO:0005245) |
| 0.1 | 2.4 | GO:0043495 | protein anchor(GO:0043495) |
| 0.1 | 6.1 | GO:0005547 | phosphatidylinositol-3,4,5-trisphosphate binding(GO:0005547) |
| 0.1 | 1.0 | GO:0071936 | coreceptor activity involved in Wnt signaling pathway(GO:0071936) |
| 0.1 | 2.5 | GO:0051400 | BH domain binding(GO:0051400) |
| 0.1 | 0.7 | GO:0031826 | type 2A serotonin receptor binding(GO:0031826) |
| 0.1 | 9.4 | GO:0005262 | calcium channel activity(GO:0005262) |
| 0.1 | 0.5 | GO:0035276 | ethanol binding(GO:0035276) |
| 0.1 | 1.3 | GO:0008179 | adenylate cyclase binding(GO:0008179) protein phosphatase 2B binding(GO:0030346) |
| 0.1 | 2.0 | GO:0004143 | diacylglycerol kinase activity(GO:0004143) |
| 0.1 | 19.0 | GO:0044325 | ion channel binding(GO:0044325) |
| 0.1 | 3.8 | GO:0001106 | RNA polymerase II transcription corepressor activity(GO:0001106) |
| 0.1 | 0.5 | GO:0046912 | transferase activity, transferring acyl groups, acyl groups converted into alkyl on transfer(GO:0046912) |
| 0.1 | 0.3 | GO:0042799 | histone methyltransferase activity (H4-K20 specific)(GO:0042799) |
| 0.1 | 1.1 | GO:0017162 | aryl hydrocarbon receptor binding(GO:0017162) |
| 0.1 | 1.4 | GO:0016493 | C-C chemokine receptor activity(GO:0016493) |
| 0.1 | 1.8 | GO:0043395 | heparan sulfate proteoglycan binding(GO:0043395) |
| 0.1 | 1.6 | GO:0071889 | 14-3-3 protein binding(GO:0071889) |
| 0.1 | 2.4 | GO:0030507 | spectrin binding(GO:0030507) |
| 0.1 | 2.2 | GO:0004709 | MAP kinase kinase kinase activity(GO:0004709) |
| 0.1 | 0.3 | GO:0097016 | L27 domain binding(GO:0097016) |
| 0.1 | 0.6 | GO:0022841 | potassium ion leak channel activity(GO:0022841) |
| 0.1 | 0.3 | GO:0015183 | L-aspartate transmembrane transporter activity(GO:0015183) |
| 0.1 | 0.9 | GO:0034450 | ubiquitin-ubiquitin ligase activity(GO:0034450) |
| 0.1 | 1.0 | GO:0015467 | G-protein activated inward rectifier potassium channel activity(GO:0015467) |
| 0.1 | 1.5 | GO:0016702 | oxidoreductase activity, acting on single donors with incorporation of molecular oxygen, incorporation of two atoms of oxygen(GO:0016702) |
| 0.1 | 2.8 | GO:0001205 | transcriptional activator activity, RNA polymerase II distal enhancer sequence-specific binding(GO:0001205) |
| 0.1 | 2.7 | GO:0051018 | protein kinase A binding(GO:0051018) |
| 0.1 | 4.5 | GO:0002039 | p53 binding(GO:0002039) |
| 0.1 | 6.0 | GO:0004222 | metalloendopeptidase activity(GO:0004222) |
| 0.1 | 0.3 | GO:0005087 | Ran guanyl-nucleotide exchange factor activity(GO:0005087) |
| 0.1 | 2.3 | GO:0031593 | polyubiquitin binding(GO:0031593) |
| 0.0 | 7.9 | GO:0001078 | transcriptional repressor activity, RNA polymerase II core promoter proximal region sequence-specific binding(GO:0001078) |
| 0.0 | 1.6 | GO:0043539 | protein serine/threonine kinase activator activity(GO:0043539) |
| 0.0 | 18.7 | GO:0004842 | ubiquitin-protein transferase activity(GO:0004842) |
| 0.0 | 1.1 | GO:0005326 | neurotransmitter transporter activity(GO:0005326) |
| 0.0 | 0.8 | GO:0005521 | lamin binding(GO:0005521) |
| 0.0 | 0.2 | GO:0017002 | activin-activated receptor activity(GO:0017002) |
| 0.0 | 0.7 | GO:0050321 | tau-protein kinase activity(GO:0050321) |
| 0.0 | 4.4 | GO:0003697 | single-stranded DNA binding(GO:0003697) |
| 0.0 | 2.3 | GO:0070491 | repressing transcription factor binding(GO:0070491) |
| 0.0 | 0.7 | GO:0043014 | alpha-tubulin binding(GO:0043014) |
| 0.0 | 6.1 | GO:0000287 | magnesium ion binding(GO:0000287) |
| 0.0 | 0.7 | GO:0031492 | nucleosomal DNA binding(GO:0031492) |
| 0.0 | 1.1 | GO:0017112 | Rab guanyl-nucleotide exchange factor activity(GO:0017112) |
| 0.0 | 0.5 | GO:0051019 | mitogen-activated protein kinase binding(GO:0051019) |
| 0.0 | 0.3 | GO:0042813 | Wnt-activated receptor activity(GO:0042813) |
| 0.0 | 1.5 | GO:0035591 | signaling adaptor activity(GO:0035591) |
| 0.0 | 1.7 | GO:0017137 | Rab GTPase binding(GO:0017137) |
| 0.0 | 0.9 | GO:0004879 | RNA polymerase II transcription factor activity, ligand-activated sequence-specific DNA binding(GO:0004879) transcription factor activity, direct ligand regulated sequence-specific DNA binding(GO:0098531) |
| 0.0 | 0.4 | GO:0036002 | pre-mRNA binding(GO:0036002) |
Gene overrepresentation in C2:CP category:
| Log-likelihood per target | Total log-likelihood | Term | Description |
|---|---|---|---|
| 0.8 | 14.1 | PID P38 GAMMA DELTA PATHWAY | Signaling mediated by p38-gamma and p38-delta |
| 0.4 | 24.4 | PID TCR CALCIUM PATHWAY | Calcium signaling in the CD4+ TCR pathway |
| 0.3 | 19.0 | ST JNK MAPK PATHWAY | JNK MAPK Pathway |
| 0.3 | 1.1 | SA G2 AND M PHASES | Cdc25 activates the cdc2/cyclin B complex to induce the G2/M transition. |
| 0.3 | 7.5 | PID ARF6 DOWNSTREAM PATHWAY | Arf6 downstream pathway |
| 0.2 | 13.2 | NABA PROTEOGLYCANS | Genes encoding proteoglycans |
| 0.2 | 10.4 | PID AURORA A PATHWAY | Aurora A signaling |
| 0.1 | 7.6 | PID ARF6 PATHWAY | Arf6 signaling events |
| 0.1 | 22.9 | PID P53 DOWNSTREAM PATHWAY | Direct p53 effectors |
| 0.1 | 5.1 | PID AURORA B PATHWAY | Aurora B signaling |
| 0.1 | 5.8 | PID HES HEY PATHWAY | Notch-mediated HES/HEY network |
| 0.1 | 1.6 | PID RET PATHWAY | Signaling events regulated by Ret tyrosine kinase |
| 0.1 | 7.9 | PID SHP2 PATHWAY | SHP2 signaling |
| 0.1 | 2.8 | PID P38 ALPHA BETA PATHWAY | Regulation of p38-alpha and p38-beta |
| 0.1 | 7.3 | PID HDAC CLASSI PATHWAY | Signaling events mediated by HDAC Class I |
| 0.1 | 4.7 | PID NOTCH PATHWAY | Notch signaling pathway |
| 0.1 | 1.0 | PID BETA CATENIN DEG PATHWAY | Degradation of beta catenin |
| 0.0 | 1.8 | PID GLYPICAN 1PATHWAY | Glypican 1 network |
| 0.0 | 1.5 | PID NETRIN PATHWAY | Netrin-mediated signaling events |
| 0.0 | 1.1 | PID CONE PATHWAY | Visual signal transduction: Cones |
| 0.0 | 1.1 | PID IL12 STAT4 PATHWAY | IL12 signaling mediated by STAT4 |
| 0.0 | 0.8 | ST WNT BETA CATENIN PATHWAY | Wnt/beta-catenin Pathway |
| 0.0 | 0.8 | PID ATF2 PATHWAY | ATF-2 transcription factor network |
| 0.0 | 1.0 | PID ECADHERIN STABILIZATION PATHWAY | Stabilization and expansion of the E-cadherin adherens junction |
| 0.0 | 0.5 | PID IL8 CXCR1 PATHWAY | IL8- and CXCR1-mediated signaling events |
| 0.0 | 0.5 | PID HNF3B PATHWAY | FOXA2 and FOXA3 transcription factor networks |
| 0.0 | 0.3 | PID WNT SIGNALING PATHWAY | Wnt signaling network |
Gene overrepresentation in C2:CP:REACTOME category:
| Log-likelihood per target | Total log-likelihood | Term | Description |
|---|---|---|---|
| 0.5 | 9.9 | REACTOME CLASS C 3 METABOTROPIC GLUTAMATE PHEROMONE RECEPTORS | Genes involved in Class C/3 (Metabotropic glutamate/pheromone receptors) |
| 0.5 | 16.9 | REACTOME INTERACTION BETWEEN L1 AND ANKYRINS | Genes involved in Interaction between L1 and Ankyrins |
| 0.4 | 14.1 | REACTOME CASPASE MEDIATED CLEAVAGE OF CYTOSKELETAL PROTEINS | Genes involved in Caspase-mediated cleavage of cytoskeletal proteins |
| 0.3 | 5.9 | REACTOME JNK C JUN KINASES PHOSPHORYLATION AND ACTIVATION MEDIATED BY ACTIVATED HUMAN TAK1 | Genes involved in JNK (c-Jun kinases) phosphorylation and activation mediated by activated human TAK1 |
| 0.3 | 8.2 | REACTOME GABA A RECEPTOR ACTIVATION | Genes involved in GABA A receptor activation |
| 0.2 | 3.8 | REACTOME SYNTHESIS OF SUBSTRATES IN N GLYCAN BIOSYTHESIS | Genes involved in Synthesis of substrates in N-glycan biosythesis |
| 0.2 | 5.8 | REACTOME PHOSPHORYLATION OF CD3 AND TCR ZETA CHAINS | Genes involved in Phosphorylation of CD3 and TCR zeta chains |
| 0.2 | 3.0 | REACTOME REVERSIBLE HYDRATION OF CARBON DIOXIDE | Genes involved in Reversible Hydration of Carbon Dioxide |
| 0.2 | 8.3 | REACTOME TRAFFICKING OF AMPA RECEPTORS | Genes involved in Trafficking of AMPA receptors |
| 0.1 | 4.4 | REACTOME SYNTHESIS OF PA | Genes involved in Synthesis of PA |
| 0.1 | 6.3 | REACTOME ELONGATION ARREST AND RECOVERY | Genes involved in Elongation arrest and recovery |
| 0.1 | 8.0 | REACTOME NCAM1 INTERACTIONS | Genes involved in NCAM1 interactions |
| 0.1 | 0.9 | REACTOME IRAK1 RECRUITS IKK COMPLEX | Genes involved in IRAK1 recruits IKK complex |
| 0.1 | 5.7 | REACTOME VOLTAGE GATED POTASSIUM CHANNELS | Genes involved in Voltage gated Potassium channels |
| 0.1 | 1.5 | REACTOME ROLE OF DCC IN REGULATING APOPTOSIS | Genes involved in Role of DCC in regulating apoptosis |
| 0.1 | 3.9 | REACTOME RECYCLING PATHWAY OF L1 | Genes involved in Recycling pathway of L1 |
| 0.1 | 1.9 | REACTOME NOREPINEPHRINE NEUROTRANSMITTER RELEASE CYCLE | Genes involved in Norepinephrine Neurotransmitter Release Cycle |
| 0.1 | 1.1 | REACTOME ACTIVATION OF THE AP1 FAMILY OF TRANSCRIPTION FACTORS | Genes involved in Activation of the AP-1 family of transcription factors |
| 0.1 | 4.6 | REACTOME NRAGE SIGNALS DEATH THROUGH JNK | Genes involved in NRAGE signals death through JNK |
| 0.1 | 3.1 | REACTOME YAP1 AND WWTR1 TAZ STIMULATED GENE EXPRESSION | Genes involved in YAP1- and WWTR1 (TAZ)-stimulated gene expression |
| 0.1 | 2.3 | REACTOME EGFR DOWNREGULATION | Genes involved in EGFR downregulation |
| 0.1 | 0.9 | REACTOME REGULATED PROTEOLYSIS OF P75NTR | Genes involved in Regulated proteolysis of p75NTR |
| 0.1 | 0.7 | REACTOME REGULATION OF INSULIN SECRETION BY ACETYLCHOLINE | Genes involved in Regulation of Insulin Secretion by Acetylcholine |
| 0.1 | 2.2 | REACTOME TRAF6 MEDIATED NFKB ACTIVATION | Genes involved in TRAF6 mediated NF-kB activation |
| 0.1 | 1.6 | REACTOME DCC MEDIATED ATTRACTIVE SIGNALING | Genes involved in DCC mediated attractive signaling |
| 0.1 | 1.8 | REACTOME HS GAG DEGRADATION | Genes involved in HS-GAG degradation |
| 0.1 | 1.6 | REACTOME SIGNALING BY HIPPO | Genes involved in Signaling by Hippo |
| 0.1 | 1.5 | REACTOME PROLACTIN RECEPTOR SIGNALING | Genes involved in Prolactin receptor signaling |
| 0.1 | 2.4 | REACTOME EFFECTS OF PIP2 HYDROLYSIS | Genes involved in Effects of PIP2 hydrolysis |
| 0.1 | 1.4 | REACTOME NEGATIVE REGULATORS OF RIG I MDA5 SIGNALING | Genes involved in Negative regulators of RIG-I/MDA5 signaling |
| 0.1 | 2.0 | REACTOME NEGATIVE REGULATION OF FGFR SIGNALING | Genes involved in Negative regulation of FGFR signaling |
| 0.0 | 0.9 | REACTOME ALPHA LINOLENIC ACID ALA METABOLISM | Genes involved in alpha-linolenic acid (ALA) metabolism |
| 0.0 | 0.8 | REACTOME ACTIVATED NOTCH1 TRANSMITS SIGNAL TO THE NUCLEUS | Genes involved in Activated NOTCH1 Transmits Signal to the Nucleus |
| 0.0 | 2.4 | REACTOME NOTCH1 INTRACELLULAR DOMAIN REGULATES TRANSCRIPTION | Genes involved in NOTCH1 Intracellular Domain Regulates Transcription |
| 0.0 | 4.5 | REACTOME TRANSPORT OF INORGANIC CATIONS ANIONS AND AMINO ACIDS OLIGOPEPTIDES | Genes involved in Transport of inorganic cations/anions and amino acids/oligopeptides |
| 0.0 | 8.2 | REACTOME ANTIGEN PROCESSING UBIQUITINATION PROTEASOME DEGRADATION | Genes involved in Antigen processing: Ubiquitination & Proteasome degradation |
| 0.0 | 1.0 | REACTOME INHIBITION OF VOLTAGE GATED CA2 CHANNELS VIA GBETA GAMMA SUBUNITS | Genes involved in Inhibition of voltage gated Ca2+ channels via Gbeta/gamma subunits |
| 0.0 | 1.2 | REACTOME NEP NS2 INTERACTS WITH THE CELLULAR EXPORT MACHINERY | Genes involved in NEP/NS2 Interacts with the Cellular Export Machinery |
| 0.0 | 2.4 | REACTOME MEIOTIC SYNAPSIS | Genes involved in Meiotic Synapsis |
| 0.0 | 2.3 | REACTOME MITOTIC PROMETAPHASE | Genes involved in Mitotic Prometaphase |
| 0.0 | 3.7 | REACTOME FACTORS INVOLVED IN MEGAKARYOCYTE DEVELOPMENT AND PLATELET PRODUCTION | Genes involved in Factors involved in megakaryocyte development and platelet production |
| 0.0 | 0.5 | REACTOME CHOLESTEROL BIOSYNTHESIS | Genes involved in Cholesterol biosynthesis |
| 0.0 | 0.9 | REACTOME CHEMOKINE RECEPTORS BIND CHEMOKINES | Genes involved in Chemokine receptors bind chemokines |
| 0.0 | 0.2 | REACTOME SYNTHESIS SECRETION AND DEACYLATION OF GHRELIN | Genes involved in Synthesis, Secretion, and Deacylation of Ghrelin |
| 0.0 | 1.4 | REACTOME SIGNALING BY RHO GTPASES | Genes involved in Signaling by Rho GTPases |