Project
GNF SymAtlas + NCI-60 cancer cell lines, comparison of cancers vs non-cancers, human (Su, 2004; Ross, 2000)
Navigation
Downloads
Results for AUGGCUU
Z-value: 0.68
Motif logo

miRNA associated with seed AUGGCUU
| Name | miRBASE accession |
|---|---|
|
hsa-miR-135a-5p
|
MIMAT0000428 |
|
hsa-miR-135b-5p
|
MIMAT0000758 |
Activity profile of AUGGCUU motif
Sorted Z-values of AUGGCUU motif
| Promoter | Log-likelihood | Transcript | Gene | Gene Info |
|---|---|---|---|---|
| chr8_+_24772455 | 18.33 |
ENST00000433454.2
|
NEFM
|
neurofilament, medium polypeptide |
| chr15_-_48470558 | 16.31 |
ENST00000324324.7
|
MYEF2
|
myelin expression factor 2 |
| chr16_+_58497567 | 14.80 |
ENST00000258187.5
|
NDRG4
|
NDRG family member 4 |
| chr9_-_93405352 | 12.42 |
ENST00000375765.3
|
DIRAS2
|
DIRAS family, GTP-binding RAS-like 2 |
| chr12_+_79258547 | 12.08 |
ENST00000457153.2
|
SYT1
|
synaptotagmin I |
| chr15_+_91643442 | 11.47 |
ENST00000394232.1
|
SV2B
|
synaptic vesicle glycoprotein 2B |
| chr16_+_1662326 | 11.25 |
ENST00000397412.3
|
CRAMP1L
|
Crm, cramped-like (Drosophila) |
| chr3_+_49591881 | 10.31 |
ENST00000296452.4
|
BSN
|
bassoon presynaptic cytomatrix protein |
| chr18_+_32558208 | 9.59 |
ENST00000436190.2
|
MAPRE2
|
microtubule-associated protein, RP/EB family, member 2 |
| chr15_+_31619013 | 9.58 |
ENST00000307145.3
|
KLF13
|
Kruppel-like factor 13 |
| chr17_-_8066250 | 8.90 |
ENST00000488857.1
ENST00000481878.1 ENST00000316509.6 ENST00000498285.1 |
VAMP2
RP11-599B13.6
|
vesicle-associated membrane protein 2 (synaptobrevin 2) Uncharacterized protein |
| chr7_-_139876812 | 8.54 |
ENST00000397560.2
|
JHDM1D
|
lysine (K)-specific demethylase 7A |
| chr22_+_40390930 | 8.23 |
ENST00000333407.6
|
FAM83F
|
family with sequence similarity 83, member F |
| chr16_+_8768422 | 8.06 |
ENST00000268251.8
ENST00000564714.1 |
ABAT
|
4-aminobutyrate aminotransferase |
| chr18_+_72201829 | 7.57 |
ENST00000582365.1
|
CNDP1
|
carnosine dipeptidase 1 (metallopeptidase M20 family) |
| chr7_-_35734730 | 7.56 |
ENST00000396081.1
ENST00000311350.3 |
HERPUD2
|
HERPUD family member 2 |
| chr17_-_9929581 | 7.53 |
ENST00000437099.2
ENST00000396115.2 |
GAS7
|
growth arrest-specific 7 |
| chr11_+_121322832 | 7.52 |
ENST00000260197.7
|
SORL1
|
sortilin-related receptor, L(DLR class) A repeats containing |
| chr7_+_77325738 | 7.48 |
ENST00000334955.8
|
RSBN1L
|
round spermatid basic protein 1-like |
| chr19_-_17799008 | 7.18 |
ENST00000519716.2
|
UNC13A
|
unc-13 homolog A (C. elegans) |
| chr4_+_47033345 | 7.12 |
ENST00000295454.3
|
GABRB1
|
gamma-aminobutyric acid (GABA) A receptor, beta 1 |
| chr12_-_111021110 | 6.92 |
ENST00000354300.3
|
PPTC7
|
PTC7 protein phosphatase homolog (S. cerevisiae) |
| chr17_+_40834580 | 6.84 |
ENST00000264638.4
|
CNTNAP1
|
contactin associated protein 1 |
| chr11_-_117186946 | 6.76 |
ENST00000313005.6
ENST00000528053.1 |
BACE1
|
beta-site APP-cleaving enzyme 1 |
| chr19_+_18263928 | 6.69 |
ENST00000222254.8
|
PIK3R2
|
phosphoinositide-3-kinase, regulatory subunit 2 (beta) |
| chr5_-_136834982 | 6.65 |
ENST00000510689.1
ENST00000394945.1 |
SPOCK1
|
sparc/osteonectin, cwcv and kazal-like domains proteoglycan (testican) 1 |
| chr10_-_81205373 | 6.27 |
ENST00000372336.3
|
ZCCHC24
|
zinc finger, CCHC domain containing 24 |
| chr6_+_138483058 | 6.12 |
ENST00000251691.4
|
KIAA1244
|
KIAA1244 |
| chr5_+_112043186 | 5.96 |
ENST00000509732.1
ENST00000457016.1 ENST00000507379.1 |
APC
|
adenomatous polyposis coli |
| chr13_-_67804445 | 5.91 |
ENST00000456367.1
ENST00000377861.3 ENST00000544246.1 |
PCDH9
|
protocadherin 9 |
| chrX_-_135849484 | 5.90 |
ENST00000370620.1
ENST00000535227.1 |
ARHGEF6
|
Rac/Cdc42 guanine nucleotide exchange factor (GEF) 6 |
| chr15_+_27111510 | 5.83 |
ENST00000335625.5
|
GABRA5
|
gamma-aminobutyric acid (GABA) A receptor, alpha 5 |
| chr20_-_32031680 | 5.83 |
ENST00000217381.2
|
SNTA1
|
syntrophin, alpha 1 |
| chr1_+_24882560 | 5.80 |
ENST00000374392.2
|
NCMAP
|
noncompact myelin associated protein |
| chr1_+_183605200 | 5.77 |
ENST00000304685.4
|
RGL1
|
ral guanine nucleotide dissociation stimulator-like 1 |
| chrX_-_13956737 | 5.75 |
ENST00000454189.2
|
GPM6B
|
glycoprotein M6B |
| chr14_-_81687197 | 5.68 |
ENST00000553612.1
|
GTF2A1
|
general transcription factor IIA, 1, 19/37kDa |
| chr2_-_201936302 | 5.67 |
ENST00000453765.1
ENST00000452799.1 ENST00000446678.1 ENST00000418596.3 |
FAM126B
|
family with sequence similarity 126, member B |
| chr14_-_45431091 | 5.67 |
ENST00000579157.1
ENST00000396128.4 ENST00000556500.1 |
KLHL28
|
kelch-like family member 28 |
| chr19_-_38714847 | 5.58 |
ENST00000420980.2
ENST00000355526.4 |
DPF1
|
D4, zinc and double PHD fingers family 1 |
| chr7_+_149535455 | 5.44 |
ENST00000223210.4
ENST00000460379.1 |
ZNF862
|
zinc finger protein 862 |
| chr17_-_78450398 | 5.35 |
ENST00000306773.4
|
NPTX1
|
neuronal pentraxin I |
| chr8_+_58907104 | 5.33 |
ENST00000361488.3
|
FAM110B
|
family with sequence similarity 110, member B |
| chr8_-_18871159 | 5.33 |
ENST00000327040.8
ENST00000440756.2 |
PSD3
|
pleckstrin and Sec7 domain containing 3 |
| chr2_+_61404624 | 5.29 |
ENST00000394457.3
|
AHSA2
|
AHA1, activator of heat shock 90kDa protein ATPase homolog 2 (yeast) |
| chrX_-_18372792 | 5.04 |
ENST00000251900.4
|
SCML2
|
sex comb on midleg-like 2 (Drosophila) |
| chr11_-_1593150 | 5.01 |
ENST00000397374.3
|
DUSP8
|
dual specificity phosphatase 8 |
| chr15_-_72410109 | 4.87 |
ENST00000564571.1
|
MYO9A
|
myosin IXA |
| chr3_-_56502375 | 4.86 |
ENST00000288221.6
|
ERC2
|
ELKS/RAB6-interacting/CAST family member 2 |
| chr13_-_41240717 | 4.65 |
ENST00000379561.5
|
FOXO1
|
forkhead box O1 |
| chr20_-_61569227 | 4.65 |
ENST00000266070.4
ENST00000395335.2 ENST00000266071.5 |
DIDO1
|
death inducer-obliterator 1 |
| chr7_+_4721885 | 4.61 |
ENST00000328914.4
|
FOXK1
|
forkhead box K1 |
| chr1_+_171810606 | 4.61 |
ENST00000358155.4
ENST00000367733.2 ENST00000355305.5 ENST00000367731.1 |
DNM3
|
dynamin 3 |
| chr10_+_76871454 | 4.58 |
ENST00000372687.4
|
SAMD8
|
sterile alpha motif domain containing 8 |
| chrY_+_15016725 | 4.55 |
ENST00000336079.3
|
DDX3Y
|
DEAD (Asp-Glu-Ala-Asp) box helicase 3, Y-linked |
| chr20_-_48532019 | 4.43 |
ENST00000289431.5
|
SPATA2
|
spermatogenesis associated 2 |
| chr19_-_2702681 | 4.23 |
ENST00000382159.3
|
GNG7
|
guanine nucleotide binding protein (G protein), gamma 7 |
| chr6_-_34664612 | 4.19 |
ENST00000374023.3
ENST00000374026.3 |
C6orf106
|
chromosome 6 open reading frame 106 |
| chr9_-_123476719 | 4.18 |
ENST00000373930.3
|
MEGF9
|
multiple EGF-like-domains 9 |
| chr7_-_138666053 | 4.17 |
ENST00000440172.1
ENST00000422774.1 |
KIAA1549
|
KIAA1549 |
| chr2_+_128848881 | 4.13 |
ENST00000259253.6
|
UGGT1
|
UDP-glucose glycoprotein glucosyltransferase 1 |
| chr2_-_240322643 | 4.09 |
ENST00000345617.3
|
HDAC4
|
histone deacetylase 4 |
| chr2_-_175351744 | 4.08 |
ENST00000295500.4
ENST00000392552.2 ENST00000392551.2 |
GPR155
|
G protein-coupled receptor 155 |
| chr11_-_108093329 | 4.02 |
ENST00000278612.8
|
NPAT
|
nuclear protein, ataxia-telangiectasia locus |
| chr12_+_111471828 | 3.96 |
ENST00000261726.6
|
CUX2
|
cut-like homeobox 2 |
| chr8_-_27115903 | 3.95 |
ENST00000350889.4
ENST00000519997.1 ENST00000519614.1 ENST00000522908.1 ENST00000265770.7 |
STMN4
|
stathmin-like 4 |
| chr14_+_74111578 | 3.90 |
ENST00000554113.1
ENST00000555631.2 ENST00000553645.2 ENST00000311089.3 ENST00000555919.3 ENST00000554339.1 ENST00000554871.1 |
DNAL1
|
dynein, axonemal, light chain 1 |
| chr3_+_43328004 | 3.88 |
ENST00000454177.1
ENST00000429705.2 ENST00000296088.7 ENST00000437827.1 |
SNRK
|
SNF related kinase |
| chr20_-_48099182 | 3.85 |
ENST00000371741.4
|
KCNB1
|
potassium voltage-gated channel, Shab-related subfamily, member 1 |
| chr4_+_140374961 | 3.84 |
ENST00000305626.5
|
RAB33B
|
RAB33B, member RAS oncogene family |
| chr17_-_44896047 | 3.81 |
ENST00000225512.5
|
WNT3
|
wingless-type MMTV integration site family, member 3 |
| chr5_-_114598548 | 3.81 |
ENST00000379615.3
ENST00000419445.1 |
PGGT1B
|
protein geranylgeranyltransferase type I, beta subunit |
| chr8_+_94929168 | 3.76 |
ENST00000518107.1
ENST00000396200.3 |
PDP1
|
pyruvate dehyrogenase phosphatase catalytic subunit 1 |
| chr5_-_32313019 | 3.74 |
ENST00000280285.5
ENST00000264934.5 |
MTMR12
|
myotubularin related protein 12 |
| chr10_+_97515409 | 3.71 |
ENST00000371207.3
ENST00000543964.1 |
ENTPD1
|
ectonucleoside triphosphate diphosphohydrolase 1 |
| chr11_+_62475130 | 3.70 |
ENST00000294117.5
|
GNG3
|
guanine nucleotide binding protein (G protein), gamma 3 |
| chr2_+_166095898 | 3.67 |
ENST00000424833.1
ENST00000375437.2 ENST00000357398.3 |
SCN2A
|
sodium channel, voltage-gated, type II, alpha subunit |
| chr7_-_71801980 | 3.66 |
ENST00000329008.5
|
CALN1
|
calneuron 1 |
| chr13_+_98086445 | 3.65 |
ENST00000245304.4
|
RAP2A
|
RAP2A, member of RAS oncogene family |
| chr1_+_27719148 | 3.65 |
ENST00000374024.3
|
GPR3
|
G protein-coupled receptor 3 |
| chr19_+_4007644 | 3.48 |
ENST00000262971.2
|
PIAS4
|
protein inhibitor of activated STAT, 4 |
| chr9_-_79520989 | 3.48 |
ENST00000376713.3
ENST00000376718.3 ENST00000428286.1 |
PRUNE2
|
prune homolog 2 (Drosophila) |
| chr4_-_42659102 | 3.45 |
ENST00000264449.10
ENST00000510289.1 ENST00000381668.5 |
ATP8A1
|
ATPase, aminophospholipid transporter (APLT), class I, type 8A, member 1 |
| chr7_-_37956409 | 3.36 |
ENST00000436072.2
|
SFRP4
|
secreted frizzled-related protein 4 |
| chr11_-_118047376 | 3.34 |
ENST00000278947.5
|
SCN2B
|
sodium channel, voltage-gated, type II, beta subunit |
| chr14_-_75593708 | 3.32 |
ENST00000557673.1
ENST00000238616.5 |
NEK9
|
NIMA-related kinase 9 |
| chr2_-_2334888 | 3.29 |
ENST00000428368.2
ENST00000399161.2 |
MYT1L
|
myelin transcription factor 1-like |
| chr6_-_99797522 | 3.27 |
ENST00000389677.5
|
FAXC
|
failed axon connections homolog (Drosophila) |
| chr1_+_159141397 | 3.23 |
ENST00000368124.4
ENST00000368125.4 ENST00000416746.1 |
CADM3
|
cell adhesion molecule 3 |
| chr14_+_56585048 | 3.23 |
ENST00000267460.4
|
PELI2
|
pellino E3 ubiquitin protein ligase family member 2 |
| chr10_+_76586348 | 3.21 |
ENST00000372724.1
ENST00000287239.4 ENST00000372714.1 |
KAT6B
|
K(lysine) acetyltransferase 6B |
| chr1_-_233431458 | 3.20 |
ENST00000258229.9
ENST00000430153.1 |
PCNXL2
|
pecanex-like 2 (Drosophila) |
| chr1_-_155942086 | 3.16 |
ENST00000368315.4
|
ARHGEF2
|
Rho/Rac guanine nucleotide exchange factor (GEF) 2 |
| chr19_+_589893 | 3.15 |
ENST00000251287.2
|
HCN2
|
hyperpolarization activated cyclic nucleotide-gated potassium channel 2 |
| chr18_-_29522989 | 3.15 |
ENST00000582539.1
ENST00000283351.4 ENST00000582513.1 |
TRAPPC8
|
trafficking protein particle complex 8 |
| chr22_+_50247449 | 3.04 |
ENST00000216268.5
|
ZBED4
|
zinc finger, BED-type containing 4 |
| chr6_+_72596604 | 3.00 |
ENST00000348717.5
ENST00000517960.1 ENST00000518273.1 ENST00000522291.1 ENST00000521978.1 ENST00000520567.1 ENST00000264839.7 |
RIMS1
|
regulating synaptic membrane exocytosis 1 |
| chr17_+_79373540 | 3.00 |
ENST00000307745.7
|
RP11-1055B8.7
|
BAH and coiled-coil domain-containing protein 1 |
| chr5_+_76506706 | 2.97 |
ENST00000340978.3
ENST00000346042.3 ENST00000264917.5 ENST00000342343.4 ENST00000333194.4 |
PDE8B
|
phosphodiesterase 8B |
| chr12_+_27396901 | 2.97 |
ENST00000541191.1
ENST00000389032.3 |
STK38L
|
serine/threonine kinase 38 like |
| chr2_+_108602971 | 2.96 |
ENST00000409059.1
ENST00000540517.1 ENST00000264047.2 |
SLC5A7
|
solute carrier family 5 (sodium/choline cotransporter), member 7 |
| chr9_+_131843377 | 2.88 |
ENST00000372546.4
ENST00000406974.3 ENST00000540102.1 |
DOLPP1
|
dolichyldiphosphatase 1 |
| chr3_+_138066539 | 2.88 |
ENST00000289104.4
|
MRAS
|
muscle RAS oncogene homolog |
| chr7_+_152456829 | 2.86 |
ENST00000377776.3
ENST00000256001.8 ENST00000397282.2 |
ACTR3B
|
ARP3 actin-related protein 3 homolog B (yeast) |
| chr5_+_149109825 | 2.84 |
ENST00000360453.4
ENST00000394320.3 ENST00000309241.5 |
PPARGC1B
|
peroxisome proliferator-activated receptor gamma, coactivator 1 beta |
| chr4_-_16900217 | 2.84 |
ENST00000441778.2
|
LDB2
|
LIM domain binding 2 |
| chr19_-_40324255 | 2.80 |
ENST00000593685.1
ENST00000600611.1 |
DYRK1B
|
dual-specificity tyrosine-(Y)-phosphorylation regulated kinase 1B |
| chr5_+_175223313 | 2.74 |
ENST00000359546.4
|
CPLX2
|
complexin 2 |
| chr4_-_87281224 | 2.70 |
ENST00000395169.3
ENST00000395161.2 |
MAPK10
|
mitogen-activated protein kinase 10 |
| chr1_-_154842741 | 2.70 |
ENST00000271915.4
|
KCNN3
|
potassium intermediate/small conductance calcium-activated channel, subfamily N, member 3 |
| chr2_-_213403565 | 2.68 |
ENST00000342788.4
ENST00000436443.1 |
ERBB4
|
v-erb-b2 avian erythroblastic leukemia viral oncogene homolog 4 |
| chr6_+_151815143 | 2.66 |
ENST00000239374.7
ENST00000367290.5 |
CCDC170
|
coiled-coil domain containing 170 |
| chr6_+_87865262 | 2.65 |
ENST00000369577.3
ENST00000518845.1 ENST00000339907.4 ENST00000496806.2 |
ZNF292
|
zinc finger protein 292 |
| chr2_-_47798044 | 2.65 |
ENST00000327876.4
|
KCNK12
|
potassium channel, subfamily K, member 12 |
| chr20_+_42875887 | 2.63 |
ENST00000342560.5
|
GDAP1L1
|
ganglioside induced differentiation associated protein 1-like 1 |
| chr11_+_68228186 | 2.61 |
ENST00000393799.2
ENST00000393800.2 ENST00000528635.1 ENST00000533127.1 ENST00000529907.1 ENST00000529344.1 ENST00000534534.1 ENST00000524845.1 ENST00000265637.4 ENST00000524904.1 ENST00000393801.3 ENST00000265636.5 ENST00000529710.1 |
PPP6R3
|
protein phosphatase 6, regulatory subunit 3 |
| chr1_+_209757051 | 2.55 |
ENST00000009105.1
ENST00000423146.1 ENST00000361322.2 |
CAMK1G
|
calcium/calmodulin-dependent protein kinase IG |
| chr17_-_66287257 | 2.54 |
ENST00000327268.4
|
SLC16A6
|
solute carrier family 16, member 6 |
| chr13_+_42622781 | 2.53 |
ENST00000337343.4
ENST00000261491.5 ENST00000379274.2 |
DGKH
|
diacylglycerol kinase, eta |
| chr5_-_131132658 | 2.48 |
ENST00000514667.1
ENST00000511848.1 ENST00000510461.1 |
CTC-432M15.3
FNIP1
|
Folliculin-interacting protein 1 folliculin interacting protein 1 |
| chr17_-_7832753 | 2.46 |
ENST00000303790.2
|
KCNAB3
|
potassium voltage-gated channel, shaker-related subfamily, beta member 3 |
| chr7_+_31092076 | 2.43 |
ENST00000304166.4
|
ADCYAP1R1
|
adenylate cyclase activating polypeptide 1 (pituitary) receptor type I |
| chr1_+_203595903 | 2.38 |
ENST00000367218.3
ENST00000367219.3 ENST00000391954.2 |
ATP2B4
|
ATPase, Ca++ transporting, plasma membrane 4 |
| chr15_-_34628951 | 2.37 |
ENST00000397707.2
ENST00000560611.1 |
SLC12A6
|
solute carrier family 12 (potassium/chloride transporter), member 6 |
| chr2_-_129076151 | 2.37 |
ENST00000259241.6
|
HS6ST1
|
heparan sulfate 6-O-sulfotransferase 1 |
| chr17_-_7197881 | 2.36 |
ENST00000007699.5
|
YBX2
|
Y box binding protein 2 |
| chr18_+_42260861 | 2.33 |
ENST00000282030.5
|
SETBP1
|
SET binding protein 1 |
| chr15_-_45815005 | 2.32 |
ENST00000261867.4
|
SLC30A4
|
solute carrier family 30 (zinc transporter), member 4 |
| chr8_+_28747884 | 2.29 |
ENST00000287701.10
ENST00000444075.1 ENST00000403668.2 ENST00000519662.1 ENST00000558662.1 ENST00000523613.1 ENST00000560599.1 ENST00000397358.3 |
HMBOX1
|
homeobox containing 1 |
| chr15_-_61521495 | 2.27 |
ENST00000335670.6
|
RORA
|
RAR-related orphan receptor A |
| chr1_+_15943995 | 2.26 |
ENST00000480945.1
|
DDI2
|
DNA-damage inducible 1 homolog 2 (S. cerevisiae) |
| chr20_-_3996036 | 2.23 |
ENST00000336095.6
|
RNF24
|
ring finger protein 24 |
| chr7_+_99613195 | 2.22 |
ENST00000324306.6
|
ZKSCAN1
|
zinc finger with KRAB and SCAN domains 1 |
| chr5_-_160973649 | 2.22 |
ENST00000393959.1
ENST00000517547.1 |
GABRB2
|
gamma-aminobutyric acid (GABA) A receptor, beta 2 |
| chr9_+_4985228 | 2.21 |
ENST00000381652.3
|
JAK2
|
Janus kinase 2 |
| chr8_-_8751068 | 2.21 |
ENST00000276282.6
|
MFHAS1
|
malignant fibrous histiocytoma amplified sequence 1 |
| chr1_+_97187318 | 2.19 |
ENST00000609116.1
ENST00000370198.1 ENST00000370197.1 ENST00000426398.2 ENST00000394184.3 |
PTBP2
|
polypyrimidine tract binding protein 2 |
| chr12_+_105501487 | 2.18 |
ENST00000332180.5
|
KIAA1033
|
KIAA1033 |
| chr10_+_120967072 | 2.15 |
ENST00000392870.2
|
GRK5
|
G protein-coupled receptor kinase 5 |
| chr14_+_99947715 | 2.15 |
ENST00000389879.5
ENST00000557441.1 ENST00000555049.1 ENST00000555842.1 |
CCNK
|
cyclin K |
| chr10_-_1779663 | 2.14 |
ENST00000381312.1
|
ADARB2
|
adenosine deaminase, RNA-specific, B2 (non-functional) |
| chr5_+_75378997 | 2.13 |
ENST00000502798.2
|
SV2C
|
synaptic vesicle glycoprotein 2C |
| chr5_+_109025067 | 2.13 |
ENST00000261483.4
|
MAN2A1
|
mannosidase, alpha, class 2A, member 1 |
| chr10_-_62149433 | 2.08 |
ENST00000280772.2
|
ANK3
|
ankyrin 3, node of Ranvier (ankyrin G) |
| chr21_-_39288743 | 2.08 |
ENST00000609713.1
|
KCNJ6
|
potassium inwardly-rectifying channel, subfamily J, member 6 |
| chr10_+_101419187 | 2.08 |
ENST00000370489.4
|
ENTPD7
|
ectonucleoside triphosphate diphosphohydrolase 7 |
| chr6_+_96463840 | 2.03 |
ENST00000302103.5
|
FUT9
|
fucosyltransferase 9 (alpha (1,3) fucosyltransferase) |
| chr1_+_162039558 | 1.98 |
ENST00000530878.1
ENST00000361897.5 |
NOS1AP
|
nitric oxide synthase 1 (neuronal) adaptor protein |
| chr10_+_103113802 | 1.95 |
ENST00000370187.3
|
BTRC
|
beta-transducin repeat containing E3 ubiquitin protein ligase |
| chr5_+_135468516 | 1.94 |
ENST00000507118.1
ENST00000511116.1 ENST00000545279.1 ENST00000545620.1 |
SMAD5
|
SMAD family member 5 |
| chr3_+_142442841 | 1.93 |
ENST00000476941.1
ENST00000273482.6 |
TRPC1
|
transient receptor potential cation channel, subfamily C, member 1 |
| chr21_+_30671189 | 1.91 |
ENST00000286800.3
|
BACH1
|
BTB and CNC homology 1, basic leucine zipper transcription factor 1 |
| chr21_-_32931290 | 1.87 |
ENST00000286827.3
|
TIAM1
|
T-cell lymphoma invasion and metastasis 1 |
| chr12_+_64845660 | 1.86 |
ENST00000331710.5
|
TBK1
|
TANK-binding kinase 1 |
| chr4_+_78078304 | 1.85 |
ENST00000316355.5
ENST00000354403.5 ENST00000502280.1 |
CCNG2
|
cyclin G2 |
| chr14_+_69865401 | 1.82 |
ENST00000556605.1
ENST00000336643.5 ENST00000031146.4 |
SLC39A9
|
solute carrier family 39, member 9 |
| chr1_+_145438469 | 1.80 |
ENST00000369317.4
|
TXNIP
|
thioredoxin interacting protein |
| chr6_+_170102210 | 1.79 |
ENST00000439249.1
ENST00000332290.2 |
C6orf120
|
chromosome 6 open reading frame 120 |
| chr11_+_13299186 | 1.79 |
ENST00000527998.1
ENST00000396441.3 ENST00000533520.1 ENST00000529825.1 ENST00000389707.4 ENST00000401424.1 ENST00000529388.1 ENST00000530357.1 ENST00000403290.1 ENST00000361003.4 ENST00000389708.3 ENST00000403510.3 ENST00000482049.1 |
ARNTL
|
aryl hydrocarbon receptor nuclear translocator-like |
| chr2_-_175499294 | 1.78 |
ENST00000392547.2
|
WIPF1
|
WAS/WASL interacting protein family, member 1 |
| chrX_+_12156582 | 1.74 |
ENST00000380682.1
|
FRMPD4
|
FERM and PDZ domain containing 4 |
| chr9_-_127905736 | 1.74 |
ENST00000336505.6
ENST00000373549.4 |
SCAI
|
suppressor of cancer cell invasion |
| chr1_-_220445757 | 1.70 |
ENST00000358951.2
|
RAB3GAP2
|
RAB3 GTPase activating protein subunit 2 (non-catalytic) |
| chr22_+_38004473 | 1.70 |
ENST00000414350.3
ENST00000343632.4 |
GGA1
|
golgi-associated, gamma adaptin ear containing, ARF binding protein 1 |
| chr19_-_12834739 | 1.70 |
ENST00000589337.1
ENST00000425528.1 ENST00000441499.1 ENST00000588216.1 |
TNPO2
|
transportin 2 |
| chr11_-_119599794 | 1.68 |
ENST00000264025.3
|
PVRL1
|
poliovirus receptor-related 1 (herpesvirus entry mediator C) |
| chr15_+_42066632 | 1.68 |
ENST00000457542.2
ENST00000221214.6 ENST00000260357.7 ENST00000456763.2 |
MAPKBP1
|
mitogen-activated protein kinase binding protein 1 |
| chr1_+_20208870 | 1.67 |
ENST00000375120.3
|
OTUD3
|
OTU domain containing 3 |
| chr10_+_102295616 | 1.65 |
ENST00000299163.6
|
HIF1AN
|
hypoxia inducible factor 1, alpha subunit inhibitor |
| chr10_-_99052382 | 1.65 |
ENST00000453547.2
ENST00000316676.8 ENST00000358308.3 ENST00000466484.1 ENST00000358531.4 |
ARHGAP19-SLIT1
ARHGAP19
|
ARHGAP19-SLIT1 readthrough (NMD candidate) Rho GTPase activating protein 19 |
| chr1_+_28995231 | 1.64 |
ENST00000373816.1
|
GMEB1
|
glucocorticoid modulatory element binding protein 1 |
| chr17_-_62340581 | 1.64 |
ENST00000258991.3
ENST00000583738.1 ENST00000584379.1 |
TEX2
|
testis expressed 2 |
| chr8_-_20161466 | 1.64 |
ENST00000381569.1
|
LZTS1
|
leucine zipper, putative tumor suppressor 1 |
| chr12_-_58027138 | 1.60 |
ENST00000341156.4
|
B4GALNT1
|
beta-1,4-N-acetyl-galactosaminyl transferase 1 |
| chr15_-_64648273 | 1.60 |
ENST00000607537.1
ENST00000303052.7 ENST00000303032.6 |
CSNK1G1
|
casein kinase 1, gamma 1 |
| chr6_+_136172820 | 1.58 |
ENST00000308191.6
|
PDE7B
|
phosphodiesterase 7B |
| chr17_+_59529743 | 1.58 |
ENST00000589003.1
ENST00000393853.4 |
TBX4
|
T-box 4 |
| chr3_-_135914615 | 1.58 |
ENST00000309993.2
|
MSL2
|
male-specific lethal 2 homolog (Drosophila) |
| chr17_+_38474489 | 1.55 |
ENST00000394089.2
ENST00000425707.3 |
RARA
|
retinoic acid receptor, alpha |
| chr20_-_9819479 | 1.52 |
ENST00000378423.1
ENST00000353224.5 |
PAK7
|
p21 protein (Cdc42/Rac)-activated kinase 7 |
| chr3_+_16926441 | 1.52 |
ENST00000418129.2
ENST00000396755.2 |
PLCL2
|
phospholipase C-like 2 |
| chr2_+_7057523 | 1.51 |
ENST00000320892.6
|
RNF144A
|
ring finger protein 144A |
| chr6_-_26659913 | 1.50 |
ENST00000480036.1
ENST00000415922.2 |
ZNF322
|
zinc finger protein 322 |
| chr10_+_105253661 | 1.46 |
ENST00000369780.4
|
NEURL
|
neuralized E3 ubiquitin protein ligase 1 |
| chr2_+_18059906 | 1.45 |
ENST00000304101.4
|
KCNS3
|
potassium voltage-gated channel, delayed-rectifier, subfamily S, member 3 |
| chr14_-_23388338 | 1.42 |
ENST00000555209.1
ENST00000554256.1 ENST00000557403.1 ENST00000557549.1 ENST00000555676.1 ENST00000557571.1 ENST00000557464.1 ENST00000554618.1 ENST00000556862.1 ENST00000555722.1 ENST00000346528.5 ENST00000542016.2 ENST00000399922.2 ENST00000557227.1 ENST00000359890.3 |
RBM23
|
RNA binding motif protein 23 |
| chr16_+_2076869 | 1.42 |
ENST00000424542.2
ENST00000432365.2 |
SLC9A3R2
|
solute carrier family 9, subfamily A (NHE3, cation proton antiporter 3), member 3 regulator 2 |
| chr19_+_10527449 | 1.39 |
ENST00000592685.1
ENST00000380702.2 |
PDE4A
|
phosphodiesterase 4A, cAMP-specific |
| chr1_-_184723942 | 1.38 |
ENST00000318130.8
|
EDEM3
|
ER degradation enhancer, mannosidase alpha-like 3 |
| chr1_-_150849208 | 1.35 |
ENST00000358595.5
|
ARNT
|
aryl hydrocarbon receptor nuclear translocator |
| chr8_-_133493200 | 1.35 |
ENST00000388996.4
|
KCNQ3
|
potassium voltage-gated channel, KQT-like subfamily, member 3 |
| chr6_-_11044509 | 1.33 |
ENST00000354666.3
|
ELOVL2
|
ELOVL fatty acid elongase 2 |
| chr17_-_43568062 | 1.30 |
ENST00000421073.2
ENST00000584420.1 ENST00000589780.1 ENST00000430334.3 |
PLEKHM1
|
pleckstrin homology domain containing, family M (with RUN domain) member 1 |
| chr9_-_19786926 | 1.30 |
ENST00000341998.2
ENST00000286344.3 |
SLC24A2
|
solute carrier family 24 (sodium/potassium/calcium exchanger), member 2 |
| chr8_-_143696833 | 1.29 |
ENST00000356613.2
|
ARC
|
activity-regulated cytoskeleton-associated protein |
| chr2_+_24714729 | 1.29 |
ENST00000406961.1
ENST00000405141.1 |
NCOA1
|
nuclear receptor coactivator 1 |
| chr19_-_344786 | 1.27 |
ENST00000264819.4
|
MIER2
|
mesoderm induction early response 1, family member 2 |
| chr5_+_112312416 | 1.25 |
ENST00000389063.2
|
DCP2
|
decapping mRNA 2 |
| chr18_+_905104 | 1.24 |
ENST00000579794.1
|
ADCYAP1
|
adenylate cyclase activating polypeptide 1 (pituitary) |
| chr8_-_23315190 | 1.22 |
ENST00000356206.6
ENST00000358689.4 ENST00000417069.2 |
ENTPD4
|
ectonucleoside triphosphate diphosphohydrolase 4 |
Network of associatons between targets according to the STRING database.

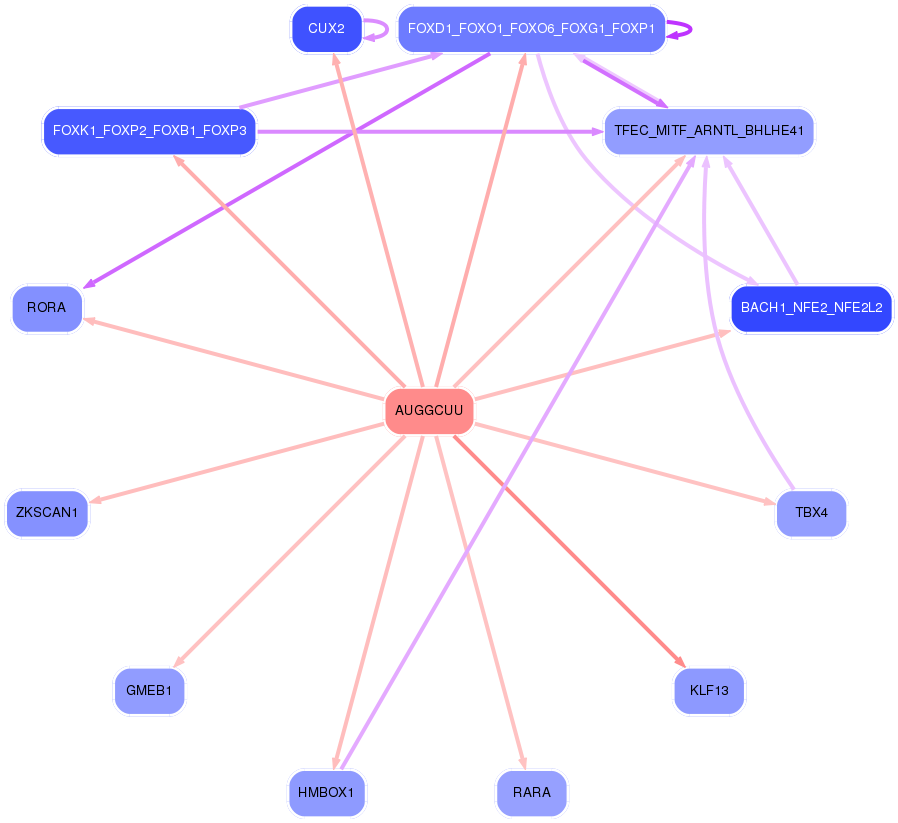
First level regulatory network of AUGGCUU
Gene Ontology Analysis
Gene overrepresentation in biological_process category:
| Log-likelihood per target | Total log-likelihood | Term | Description |
|---|---|---|---|
| 6.1 | 18.3 | GO:0033693 | neurofilament bundle assembly(GO:0033693) |
| 4.0 | 12.1 | GO:0098746 | fast, calcium ion-dependent exocytosis of neurotransmitter(GO:0098746) |
| 2.5 | 7.5 | GO:1902997 | regulation of choline O-acetyltransferase activity(GO:1902769) positive regulation of choline O-acetyltransferase activity(GO:1902771) negative regulation of tau-protein kinase activity(GO:1902948) positive regulation of early endosome to recycling endosome transport(GO:1902955) negative regulation of aspartic-type endopeptidase activity involved in amyloid precursor protein catabolic process(GO:1902960) negative regulation of neurofibrillary tangle assembly(GO:1902997) negative regulation of aspartic-type peptidase activity(GO:1905246) |
| 2.0 | 8.1 | GO:1904450 | negative regulation of gamma-aminobutyric acid secretion(GO:0014053) aspartate secretion(GO:0061528) regulation of aspartate secretion(GO:1904448) positive regulation of aspartate secretion(GO:1904450) |
| 1.9 | 5.8 | GO:0032290 | peripheral nervous system myelin formation(GO:0032290) |
| 1.8 | 7.2 | GO:0099525 | presynaptic dense core granule exocytosis(GO:0099525) |
| 1.5 | 4.6 | GO:0016185 | synaptic vesicle budding from presynaptic endocytic zone membrane(GO:0016185) |
| 1.5 | 14.8 | GO:2001135 | regulation of endocytic recycling(GO:2001135) |
| 1.4 | 4.1 | GO:0097359 | UDP-glucosylation(GO:0097359) |
| 1.3 | 8.9 | GO:1903593 | regulation of histamine secretion by mast cell(GO:1903593) |
| 1.3 | 3.8 | GO:0060061 | Spemann organizer formation(GO:0060061) |
| 1.1 | 3.4 | GO:2000118 | regulation of sodium-dependent phosphate transport(GO:2000118) |
| 1.1 | 1.1 | GO:0071878 | negative regulation of adrenergic receptor signaling pathway(GO:0071878) |
| 1.1 | 2.1 | GO:0045925 | positive regulation of female receptivity(GO:0045925) |
| 1.0 | 6.8 | GO:0002175 | protein localization to paranode region of axon(GO:0002175) |
| 1.0 | 3.8 | GO:0010701 | positive regulation of norepinephrine secretion(GO:0010701) |
| 1.0 | 9.6 | GO:0045647 | negative regulation of erythrocyte differentiation(GO:0045647) |
| 1.0 | 3.8 | GO:0051771 | negative regulation of nitric-oxide synthase biosynthetic process(GO:0051771) |
| 0.9 | 4.6 | GO:1902617 | regulation of gluconeogenesis by regulation of transcription from RNA polymerase II promoter(GO:0035947) response to fluoride(GO:1902617) |
| 0.9 | 2.7 | GO:2000364 | regulation of STAT protein import into nucleus(GO:2000364) positive regulation of STAT protein import into nucleus(GO:2000366) |
| 0.9 | 3.5 | GO:0061091 | regulation of phospholipid translocation(GO:0061091) positive regulation of phospholipid translocation(GO:0061092) |
| 0.8 | 1.7 | GO:1900425 | negative regulation of defense response to bacterium(GO:1900425) |
| 0.8 | 1.6 | GO:0061428 | negative regulation of transcription from RNA polymerase II promoter in response to hypoxia(GO:0061428) |
| 0.8 | 2.4 | GO:1903248 | regulation of cellular amine catabolic process(GO:0033241) negative regulation of cellular amine catabolic process(GO:0033242) negative regulation of the force of heart contraction(GO:0098736) regulation of arginine catabolic process(GO:1900081) negative regulation of arginine catabolic process(GO:1900082) regulation of citrulline biosynthetic process(GO:1903248) negative regulation of citrulline biosynthetic process(GO:1903249) negative regulation of cellular amino acid biosynthetic process(GO:2000283) |
| 0.8 | 3.2 | GO:0071802 | negative regulation of podosome assembly(GO:0071802) |
| 0.8 | 3.1 | GO:0030242 | pexophagy(GO:0030242) |
| 0.7 | 2.2 | GO:0060398 | regulation of growth hormone receptor signaling pathway(GO:0060398) |
| 0.7 | 2.1 | GO:0044828 | negative regulation by host of viral genome replication(GO:0044828) |
| 0.7 | 3.5 | GO:1902231 | positive regulation of intrinsic apoptotic signaling pathway in response to DNA damage(GO:1902231) |
| 0.7 | 6.0 | GO:1904781 | positive regulation of protein localization to centrosome(GO:1904781) |
| 0.6 | 2.5 | GO:0002904 | positive regulation of B cell apoptotic process(GO:0002904) |
| 0.6 | 4.9 | GO:0006686 | sphingomyelin biosynthetic process(GO:0006686) |
| 0.6 | 2.4 | GO:0008063 | Toll signaling pathway(GO:0008063) |
| 0.6 | 2.4 | GO:0009386 | translational attenuation(GO:0009386) |
| 0.6 | 5.8 | GO:0051610 | negative regulation of neurotransmitter uptake(GO:0051581) serotonin uptake(GO:0051610) regulation of serotonin uptake(GO:0051611) negative regulation of serotonin uptake(GO:0051612) |
| 0.6 | 1.7 | GO:1903371 | regulation of endoplasmic reticulum tubular network organization(GO:1903371) |
| 0.6 | 3.3 | GO:0046684 | response to pyrethroid(GO:0046684) |
| 0.5 | 3.8 | GO:1903433 | regulation of constitutive secretory pathway(GO:1903433) |
| 0.5 | 3.1 | GO:0071321 | cellular response to cGMP(GO:0071321) |
| 0.5 | 2.1 | GO:1900827 | positive regulation of cell communication by electrical coupling(GO:0010650) maintenance of protein location in membrane(GO:0072658) maintenance of protein location in plasma membrane(GO:0072660) positive regulation of membrane depolarization during cardiac muscle cell action potential(GO:1900827) |
| 0.5 | 1.5 | GO:0001923 | B-1 B cell differentiation(GO:0001923) |
| 0.5 | 5.1 | GO:0034983 | peptidyl-lysine deacetylation(GO:0034983) |
| 0.5 | 2.0 | GO:1902261 | regulation of nitric oxide mediated signal transduction(GO:0010749) positive regulation of delayed rectifier potassium channel activity(GO:1902261) |
| 0.5 | 2.4 | GO:0042539 | hypotonic salinity response(GO:0042539) cellular hypotonic salinity response(GO:0071477) |
| 0.5 | 9.3 | GO:0071420 | cellular response to histamine(GO:0071420) |
| 0.5 | 2.3 | GO:0061088 | regulation of sequestering of zinc ion(GO:0061088) |
| 0.4 | 5.8 | GO:1902083 | negative regulation of peptidyl-cysteine S-nitrosylation(GO:1902083) |
| 0.4 | 1.8 | GO:0090403 | oxidative stress-induced premature senescence(GO:0090403) |
| 0.4 | 7.0 | GO:0034656 | nucleobase-containing small molecule catabolic process(GO:0034656) |
| 0.4 | 1.7 | GO:0051835 | positive regulation of synapse structural plasticity(GO:0051835) |
| 0.4 | 3.0 | GO:1900619 | acetylcholine metabolic process(GO:0008291) acetate ester metabolic process(GO:1900619) |
| 0.4 | 1.7 | GO:1990167 | protein K27-linked deubiquitination(GO:1990167) |
| 0.4 | 2.9 | GO:0006489 | dolichyl diphosphate biosynthetic process(GO:0006489) dolichyl diphosphate metabolic process(GO:0046465) |
| 0.4 | 3.7 | GO:0008627 | intrinsic apoptotic signaling pathway in response to osmotic stress(GO:0008627) |
| 0.4 | 1.6 | GO:0030259 | lipid glycosylation(GO:0030259) |
| 0.4 | 1.6 | GO:0060010 | Sertoli cell fate commitment(GO:0060010) |
| 0.4 | 1.2 | GO:0072092 | ureteric bud invasion(GO:0072092) |
| 0.4 | 3.7 | GO:0060385 | axonogenesis involved in innervation(GO:0060385) |
| 0.4 | 3.7 | GO:0045198 | establishment of epithelial cell apical/basal polarity(GO:0045198) |
| 0.3 | 1.0 | GO:0010748 | regulation of plasma membrane long-chain fatty acid transport(GO:0010746) negative regulation of plasma membrane long-chain fatty acid transport(GO:0010748) |
| 0.3 | 2.7 | GO:0007258 | JUN phosphorylation(GO:0007258) |
| 0.3 | 3.9 | GO:0036158 | outer dynein arm assembly(GO:0036158) |
| 0.3 | 1.3 | GO:2000969 | positive regulation of alpha-amino-3-hydroxy-5-methyl-4-isoxazole propionate selective glutamate receptor activity(GO:2000969) |
| 0.3 | 2.8 | GO:0006390 | transcription from mitochondrial promoter(GO:0006390) |
| 0.3 | 1.2 | GO:0070253 | somatostatin secretion(GO:0070253) |
| 0.3 | 0.9 | GO:0044205 | 'de novo' UMP biosynthetic process(GO:0044205) |
| 0.3 | 0.9 | GO:0031064 | negative regulation of histone deacetylation(GO:0031064) |
| 0.3 | 5.8 | GO:0060384 | innervation(GO:0060384) |
| 0.3 | 7.4 | GO:2001275 | positive regulation of glucose import in response to insulin stimulus(GO:2001275) |
| 0.3 | 1.4 | GO:0097466 | protein deglycosylation involved in glycoprotein catabolic process(GO:0035977) glycoprotein ERAD pathway(GO:0097466) mannose trimming involved in glycoprotein ERAD pathway(GO:1904382) |
| 0.3 | 5.5 | GO:0032012 | regulation of ARF protein signal transduction(GO:0032012) |
| 0.3 | 3.5 | GO:0098828 | positive regulation of inhibitory postsynaptic potential(GO:0097151) modulation of inhibitory postsynaptic potential(GO:0098828) |
| 0.3 | 1.9 | GO:0098989 | NMDA selective glutamate receptor signaling pathway(GO:0098989) |
| 0.3 | 2.1 | GO:0006013 | mannose metabolic process(GO:0006013) |
| 0.2 | 1.9 | GO:0002051 | osteoblast fate commitment(GO:0002051) |
| 0.2 | 1.0 | GO:0019276 | UDP-N-acetylgalactosamine metabolic process(GO:0019276) |
| 0.2 | 1.7 | GO:0000290 | deadenylation-dependent decapping of nuclear-transcribed mRNA(GO:0000290) |
| 0.2 | 2.6 | GO:0030322 | stabilization of membrane potential(GO:0030322) |
| 0.2 | 2.1 | GO:0007217 | tachykinin receptor signaling pathway(GO:0007217) |
| 0.2 | 0.9 | GO:1904016 | response to Thyroglobulin triiodothyronine(GO:1904016) |
| 0.2 | 1.9 | GO:0045359 | positive regulation of interferon-beta biosynthetic process(GO:0045359) |
| 0.2 | 2.6 | GO:0006518 | peptide metabolic process(GO:0006518) |
| 0.2 | 3.8 | GO:0050812 | regulation of acetyl-CoA biosynthetic process from pyruvate(GO:0010510) regulation of acyl-CoA biosynthetic process(GO:0050812) |
| 0.2 | 1.2 | GO:1904381 | Golgi apparatus mannose trimming(GO:1904381) |
| 0.2 | 4.0 | GO:0007614 | short-term memory(GO:0007614) |
| 0.2 | 0.5 | GO:1900114 | positive regulation of histone H3-K9 trimethylation(GO:1900114) |
| 0.2 | 2.3 | GO:0021702 | cerebellar Purkinje cell layer formation(GO:0021694) cerebellar Purkinje cell differentiation(GO:0021702) |
| 0.2 | 2.0 | GO:0042354 | fucose catabolic process(GO:0019317) L-fucose metabolic process(GO:0042354) L-fucose catabolic process(GO:0042355) |
| 0.2 | 1.0 | GO:0038161 | prolactin signaling pathway(GO:0038161) |
| 0.2 | 7.9 | GO:0071377 | cellular response to glucagon stimulus(GO:0071377) |
| 0.2 | 0.3 | GO:0003343 | proepicardium development(GO:0003342) septum transversum development(GO:0003343) |
| 0.2 | 2.7 | GO:0031915 | positive regulation of synaptic plasticity(GO:0031915) |
| 0.2 | 0.9 | GO:0016078 | tRNA catabolic process(GO:0016078) |
| 0.1 | 1.2 | GO:1903690 | negative regulation of wound healing, spreading of epidermal cells(GO:1903690) |
| 0.1 | 6.8 | GO:0006509 | membrane protein ectodomain proteolysis(GO:0006509) beta-amyloid metabolic process(GO:0050435) |
| 0.1 | 17.8 | GO:0014902 | myotube differentiation(GO:0014902) |
| 0.1 | 3.6 | GO:0040020 | regulation of meiotic nuclear division(GO:0040020) |
| 0.1 | 5.9 | GO:0006198 | cAMP catabolic process(GO:0006198) |
| 0.1 | 10.7 | GO:0035418 | protein localization to synapse(GO:0035418) |
| 0.1 | 0.3 | GO:1904861 | excitatory synapse assembly(GO:1904861) |
| 0.1 | 5.9 | GO:0000083 | regulation of transcription involved in G1/S transition of mitotic cell cycle(GO:0000083) |
| 0.1 | 1.4 | GO:0046886 | positive regulation of hormone biosynthetic process(GO:0046886) |
| 0.1 | 0.4 | GO:0061535 | gamma-aminobutyric acid secretion, neurotransmission(GO:0061534) glutamate secretion, neurotransmission(GO:0061535) |
| 0.1 | 1.1 | GO:0007175 | negative regulation of epidermal growth factor-activated receptor activity(GO:0007175) |
| 0.1 | 1.1 | GO:0097012 | cellular response to granulocyte macrophage colony-stimulating factor stimulus(GO:0097011) response to granulocyte macrophage colony-stimulating factor(GO:0097012) |
| 0.1 | 0.5 | GO:1901165 | positive regulation of trophoblast cell migration(GO:1901165) |
| 0.1 | 3.9 | GO:0007019 | microtubule depolymerization(GO:0007019) |
| 0.1 | 2.5 | GO:0036109 | alpha-linolenic acid metabolic process(GO:0036109) |
| 0.1 | 2.4 | GO:0060732 | positive regulation of inositol phosphate biosynthetic process(GO:0060732) |
| 0.1 | 1.0 | GO:0015816 | glycine transport(GO:0015816) |
| 0.1 | 0.6 | GO:0043988 | histone H3-S28 phosphorylation(GO:0043988) histone H2A phosphorylation(GO:1990164) |
| 0.1 | 0.6 | GO:0010793 | regulation of mRNA export from nucleus(GO:0010793) |
| 0.1 | 2.8 | GO:0010669 | epithelial structure maintenance(GO:0010669) |
| 0.1 | 5.4 | GO:1901998 | toxin transport(GO:1901998) |
| 0.1 | 1.7 | GO:0006610 | ribosomal protein import into nucleus(GO:0006610) |
| 0.1 | 1.7 | GO:0035024 | negative regulation of Rho protein signal transduction(GO:0035024) |
| 0.1 | 0.5 | GO:0071543 | diadenosine polyphosphate catabolic process(GO:0015961) diphosphoinositol polyphosphate metabolic process(GO:0071543) diadenosine pentaphosphate metabolic process(GO:1901906) diadenosine pentaphosphate catabolic process(GO:1901907) diadenosine hexaphosphate metabolic process(GO:1901908) diadenosine hexaphosphate catabolic process(GO:1901909) adenosine 5'-(hexahydrogen pentaphosphate) metabolic process(GO:1901910) adenosine 5'-(hexahydrogen pentaphosphate) catabolic process(GO:1901911) |
| 0.1 | 0.9 | GO:0016576 | histone dephosphorylation(GO:0016576) |
| 0.1 | 0.7 | GO:0042426 | choline catabolic process(GO:0042426) |
| 0.1 | 1.0 | GO:0035845 | photoreceptor cell outer segment organization(GO:0035845) |
| 0.1 | 0.5 | GO:1901660 | calcium ion export(GO:1901660) |
| 0.1 | 0.7 | GO:0044387 | negative regulation of protein kinase activity by regulation of protein phosphorylation(GO:0044387) |
| 0.1 | 1.8 | GO:0002347 | response to tumor cell(GO:0002347) |
| 0.1 | 1.8 | GO:0006829 | zinc II ion transport(GO:0006829) |
| 0.1 | 1.0 | GO:0038063 | collagen-activated tyrosine kinase receptor signaling pathway(GO:0038063) |
| 0.1 | 2.3 | GO:0032212 | positive regulation of telomere maintenance via telomerase(GO:0032212) |
| 0.1 | 1.2 | GO:0043508 | negative regulation of JUN kinase activity(GO:0043508) |
| 0.1 | 2.0 | GO:0045879 | negative regulation of smoothened signaling pathway(GO:0045879) |
| 0.1 | 5.9 | GO:0030032 | lamellipodium assembly(GO:0030032) |
| 0.1 | 0.5 | GO:1903378 | positive regulation of oxidative stress-induced neuron intrinsic apoptotic signaling pathway(GO:1903378) |
| 0.1 | 1.3 | GO:0060081 | membrane hyperpolarization(GO:0060081) |
| 0.1 | 4.9 | GO:0010812 | negative regulation of cell-substrate adhesion(GO:0010812) |
| 0.1 | 1.2 | GO:0060716 | labyrinthine layer blood vessel development(GO:0060716) |
| 0.1 | 1.9 | GO:0048665 | neuron fate specification(GO:0048665) |
| 0.1 | 2.6 | GO:0010107 | potassium ion import(GO:0010107) |
| 0.1 | 2.5 | GO:0007205 | protein kinase C-activating G-protein coupled receptor signaling pathway(GO:0007205) |
| 0.1 | 1.9 | GO:0051281 | positive regulation of release of sequestered calcium ion into cytosol(GO:0051281) |
| 0.1 | 0.6 | GO:0016236 | macroautophagy(GO:0016236) |
| 0.1 | 0.3 | GO:0048388 | endosomal lumen acidification(GO:0048388) |
| 0.1 | 0.3 | GO:0035372 | protein localization to microtubule(GO:0035372) |
| 0.1 | 0.7 | GO:0070932 | histone H3 deacetylation(GO:0070932) |
| 0.1 | 0.2 | GO:1902498 | regulation of protein autoubiquitination(GO:1902498) |
| 0.1 | 2.3 | GO:0006376 | mRNA splice site selection(GO:0006376) |
| 0.1 | 10.9 | GO:0006836 | neurotransmitter transport(GO:0006836) |
| 0.1 | 4.9 | GO:0009301 | snRNA transcription(GO:0009301) snRNA transcription from RNA polymerase II promoter(GO:0042795) |
| 0.1 | 0.4 | GO:0007256 | activation of JNKK activity(GO:0007256) |
| 0.1 | 0.5 | GO:0016584 | nucleosome positioning(GO:0016584) |
| 0.0 | 2.0 | GO:0043966 | histone H3 acetylation(GO:0043966) |
| 0.0 | 1.3 | GO:0060292 | long term synaptic depression(GO:0060292) |
| 0.0 | 1.6 | GO:0043984 | histone H4-K16 acetylation(GO:0043984) |
| 0.0 | 1.0 | GO:0015937 | coenzyme A biosynthetic process(GO:0015937) |
| 0.0 | 0.3 | GO:0071542 | dopaminergic neuron differentiation(GO:0071542) |
| 0.0 | 0.2 | GO:1903898 | negative regulation of PERK-mediated unfolded protein response(GO:1903898) |
| 0.0 | 0.4 | GO:0035562 | negative regulation of chromatin binding(GO:0035562) |
| 0.0 | 0.4 | GO:0036342 | post-anal tail morphogenesis(GO:0036342) |
| 0.0 | 4.8 | GO:0071805 | cellular potassium ion transport(GO:0071804) potassium ion transmembrane transport(GO:0071805) |
| 0.0 | 0.5 | GO:0007616 | long-term memory(GO:0007616) |
| 0.0 | 0.1 | GO:0060158 | phospholipase C-activating dopamine receptor signaling pathway(GO:0060158) |
| 0.0 | 0.4 | GO:1903830 | magnesium ion transmembrane transport(GO:1903830) |
| 0.0 | 0.6 | GO:0030828 | positive regulation of cGMP biosynthetic process(GO:0030828) |
| 0.0 | 1.0 | GO:0007140 | male meiosis(GO:0007140) |
| 0.0 | 0.7 | GO:0032456 | endocytic recycling(GO:0032456) |
| 0.0 | 0.7 | GO:0035914 | skeletal muscle cell differentiation(GO:0035914) |
| 0.0 | 0.4 | GO:0007095 | mitotic G2 DNA damage checkpoint(GO:0007095) |
| 0.0 | 0.8 | GO:0000188 | inactivation of MAPK activity(GO:0000188) |
| 0.0 | 0.3 | GO:0010991 | negative regulation of SMAD protein complex assembly(GO:0010991) |
| 0.0 | 1.1 | GO:0048477 | oogenesis(GO:0048477) |
| 0.0 | 5.5 | GO:0043406 | positive regulation of MAP kinase activity(GO:0043406) |
| 0.0 | 4.3 | GO:0007601 | visual perception(GO:0007601) |
| 0.0 | 1.6 | GO:0048167 | regulation of synaptic plasticity(GO:0048167) |
| 0.0 | 0.6 | GO:0007274 | neuromuscular synaptic transmission(GO:0007274) |
| 0.0 | 0.1 | GO:0010825 | positive regulation of centrosome duplication(GO:0010825) |
| 0.0 | 0.4 | GO:0051028 | mRNA transport(GO:0051028) |
| 0.0 | 2.9 | GO:0007156 | homophilic cell adhesion via plasma membrane adhesion molecules(GO:0007156) |
| 0.0 | 1.0 | GO:0007270 | neuron-neuron synaptic transmission(GO:0007270) |
| 0.0 | 2.5 | GO:0015718 | monocarboxylic acid transport(GO:0015718) |
| 0.0 | 0.4 | GO:0051262 | protein tetramerization(GO:0051262) |
| 0.0 | 1.1 | GO:0006501 | C-terminal protein lipidation(GO:0006501) |
| 0.0 | 0.5 | GO:0034314 | Arp2/3 complex-mediated actin nucleation(GO:0034314) |
| 0.0 | 6.7 | GO:0007283 | spermatogenesis(GO:0007283) male gamete generation(GO:0048232) |
| 0.0 | 0.2 | GO:0048671 | negative regulation of collateral sprouting(GO:0048671) |
| 0.0 | 0.2 | GO:0000098 | sulfur amino acid catabolic process(GO:0000098) |
| 0.0 | 0.2 | GO:0071711 | basement membrane organization(GO:0071711) |
| 0.0 | 1.7 | GO:0030048 | actin filament-based movement(GO:0030048) |
| 0.0 | 0.1 | GO:0006620 | posttranslational protein targeting to membrane(GO:0006620) |
Gene overrepresentation in cellular_component category:
| Log-likelihood per target | Total log-likelihood | Term | Description |
|---|---|---|---|
| 2.6 | 21.0 | GO:0060199 | clathrin-sculpted glutamate transport vesicle(GO:0060199) clathrin-sculpted glutamate transport vesicle membrane(GO:0060203) |
| 2.4 | 7.2 | GO:0044305 | calyx of Held(GO:0044305) |
| 2.0 | 8.1 | GO:0032144 | 4-aminobutyrate transaminase complex(GO:0032144) |
| 1.3 | 19.3 | GO:0005883 | neurofilament(GO:0005883) |
| 1.3 | 3.8 | GO:0005953 | CAAX-protein geranylgeranyltransferase complex(GO:0005953) |
| 1.0 | 16.3 | GO:0033270 | paranode region of axon(GO:0033270) |
| 0.9 | 4.6 | GO:0098843 | postsynaptic endocytic zone(GO:0098843) |
| 0.7 | 2.1 | GO:0002945 | cyclin K-CDK13 complex(GO:0002945) |
| 0.6 | 5.8 | GO:0016013 | syntrophin complex(GO:0016013) |
| 0.6 | 7.3 | GO:1990909 | Wnt signalosome(GO:1990909) |
| 0.6 | 4.5 | GO:0005672 | transcription factor TFIIA complex(GO:0005672) |
| 0.5 | 2.1 | GO:0005797 | Golgi medial cisterna(GO:0005797) |
| 0.5 | 4.0 | GO:0097504 | Gemini of coiled bodies(GO:0097504) |
| 0.5 | 7.5 | GO:0005641 | nuclear envelope lumen(GO:0005641) |
| 0.5 | 3.9 | GO:0036157 | outer dynein arm(GO:0036157) |
| 0.4 | 15.2 | GO:1902711 | GABA-A receptor complex(GO:1902711) |
| 0.4 | 10.1 | GO:0033268 | node of Ranvier(GO:0033268) |
| 0.4 | 18.6 | GO:0048786 | presynaptic active zone(GO:0048786) |
| 0.4 | 2.0 | GO:1902937 | inward rectifier potassium channel complex(GO:1902937) |
| 0.4 | 2.7 | GO:0070033 | synaptobrevin 2-SNAP-25-syntaxin-1a-complexin II complex(GO:0070033) synaptobrevin 2-SNAP-25-syntaxin-3-complexin complex(GO:0070554) |
| 0.4 | 3.3 | GO:0001518 | voltage-gated sodium channel complex(GO:0001518) |
| 0.3 | 10.8 | GO:0035371 | microtubule plus-end(GO:0035371) |
| 0.3 | 3.2 | GO:0070776 | H3 histone acetyltransferase complex(GO:0070775) MOZ/MORF histone acetyltransferase complex(GO:0070776) |
| 0.3 | 4.1 | GO:0016461 | unconventional myosin complex(GO:0016461) |
| 0.3 | 1.2 | GO:0031166 | integral component of vacuolar membrane(GO:0031166) |
| 0.3 | 6.6 | GO:0005942 | phosphatidylinositol 3-kinase complex(GO:0005942) |
| 0.3 | 3.1 | GO:0030008 | TRAPP complex(GO:0030008) |
| 0.2 | 1.6 | GO:0072487 | MSL complex(GO:0072487) |
| 0.2 | 1.0 | GO:0033553 | rDNA heterochromatin(GO:0033553) |
| 0.2 | 6.5 | GO:0030173 | integral component of Golgi membrane(GO:0030173) |
| 0.2 | 3.8 | GO:0044298 | neuronal cell body membrane(GO:0032809) cell body membrane(GO:0044298) |
| 0.2 | 13.6 | GO:0030672 | synaptic vesicle membrane(GO:0030672) exocytic vesicle membrane(GO:0099501) |
| 0.2 | 5.5 | GO:0044322 | endoplasmic reticulum quality control compartment(GO:0044322) |
| 0.2 | 1.8 | GO:0033391 | chromatoid body(GO:0033391) |
| 0.2 | 1.0 | GO:0097129 | cyclin D2-CDK4 complex(GO:0097129) |
| 0.2 | 0.5 | GO:0031213 | RSF complex(GO:0031213) |
| 0.2 | 1.7 | GO:0097431 | mitotic spindle pole(GO:0097431) |
| 0.2 | 2.9 | GO:0005885 | Arp2/3 protein complex(GO:0005885) |
| 0.1 | 8.1 | GO:0005834 | heterotrimeric G-protein complex(GO:0005834) |
| 0.1 | 0.9 | GO:0000172 | ribonuclease MRP complex(GO:0000172) |
| 0.1 | 1.0 | GO:0005587 | collagen type IV trimer(GO:0005587) |
| 0.1 | 6.8 | GO:0005771 | multivesicular body(GO:0005771) |
| 0.1 | 7.2 | GO:0031594 | neuromuscular junction(GO:0031594) |
| 0.1 | 1.6 | GO:0043198 | dendritic shaft(GO:0043198) |
| 0.1 | 0.9 | GO:0019907 | cyclin-dependent protein kinase activating kinase holoenzyme complex(GO:0019907) |
| 0.1 | 2.4 | GO:0097228 | sperm principal piece(GO:0097228) |
| 0.1 | 1.9 | GO:0044295 | axonal growth cone(GO:0044295) |
| 0.1 | 3.2 | GO:0031904 | endosome lumen(GO:0031904) |
| 0.1 | 12.8 | GO:0030426 | growth cone(GO:0030426) |
| 0.1 | 0.4 | GO:0099634 | postsynaptic density membrane(GO:0098839) postsynaptic specialization membrane(GO:0099634) |
| 0.1 | 8.6 | GO:0032587 | ruffle membrane(GO:0032587) |
| 0.1 | 6.4 | GO:0034705 | voltage-gated potassium channel complex(GO:0008076) potassium channel complex(GO:0034705) |
| 0.1 | 19.5 | GO:0016323 | basolateral plasma membrane(GO:0016323) |
| 0.1 | 4.5 | GO:0031463 | Cul3-RING ubiquitin ligase complex(GO:0031463) |
| 0.1 | 3.7 | GO:0055038 | recycling endosome membrane(GO:0055038) |
| 0.1 | 3.5 | GO:0035577 | azurophil granule membrane(GO:0035577) |
| 0.1 | 0.5 | GO:0097136 | Bcl-2 family protein complex(GO:0097136) |
| 0.0 | 0.1 | GO:0005879 | axonemal microtubule(GO:0005879) asymmetric synapse(GO:0032279) |
| 0.0 | 1.2 | GO:0071565 | nBAF complex(GO:0071565) |
| 0.0 | 1.1 | GO:0071141 | SMAD protein complex(GO:0071141) |
| 0.0 | 1.7 | GO:0030131 | clathrin adaptor complex(GO:0030131) |
| 0.0 | 0.2 | GO:0097443 | sorting endosome(GO:0097443) |
| 0.0 | 1.0 | GO:0000930 | gamma-tubulin complex(GO:0000930) |
| 0.0 | 3.3 | GO:0005776 | autophagosome(GO:0005776) |
| 0.0 | 1.1 | GO:0090568 | nuclear transcriptional repressor complex(GO:0090568) |
| 0.0 | 3.1 | GO:0005913 | cell-cell adherens junction(GO:0005913) |
| 0.0 | 2.5 | GO:0005791 | rough endoplasmic reticulum(GO:0005791) |
| 0.0 | 1.4 | GO:0031519 | PcG protein complex(GO:0031519) |
| 0.0 | 1.8 | GO:0001726 | ruffle(GO:0001726) |
| 0.0 | 0.6 | GO:0008074 | guanylate cyclase complex, soluble(GO:0008074) |
| 0.0 | 0.6 | GO:0035327 | transcriptionally active chromatin(GO:0035327) |
| 0.0 | 1.8 | GO:0005758 | mitochondrial intermembrane space(GO:0005758) |
| 0.0 | 1.2 | GO:0032588 | trans-Golgi network membrane(GO:0032588) |
| 0.0 | 1.3 | GO:0001669 | acrosomal vesicle(GO:0001669) |
| 0.0 | 2.1 | GO:0030666 | endocytic vesicle membrane(GO:0030666) |
| 0.0 | 0.2 | GO:0042622 | photoreceptor outer segment membrane(GO:0042622) |
| 0.0 | 1.9 | GO:0031252 | cell leading edge(GO:0031252) |
| 0.0 | 0.6 | GO:0042734 | presynaptic membrane(GO:0042734) |
| 0.0 | 0.4 | GO:0030660 | Golgi-associated vesicle membrane(GO:0030660) |
| 0.0 | 0.3 | GO:0045335 | phagocytic vesicle(GO:0045335) |
Gene overrepresentation in molecular_function category:
| Log-likelihood per target | Total log-likelihood | Term | Description |
|---|---|---|---|
| 2.4 | 12.1 | GO:0030348 | syntaxin-3 binding(GO:0030348) |
| 2.3 | 6.8 | GO:0008798 | beta-aspartyl-peptidase activity(GO:0008798) |
| 2.0 | 8.1 | GO:0032145 | 4-aminobutyrate transaminase activity(GO:0003867) succinate-semialdehyde dehydrogenase binding(GO:0032145) (S)-3-amino-2-methylpropionate transaminase activity(GO:0047298) |
| 1.9 | 5.8 | GO:0008321 | Ral guanyl-nucleotide exchange factor activity(GO:0008321) |
| 1.6 | 4.9 | GO:0033188 | sphingomyelin synthase activity(GO:0033188) ceramide cholinephosphotransferase activity(GO:0047493) |
| 1.4 | 4.1 | GO:0003980 | UDP-glucose:glycoprotein glucosyltransferase activity(GO:0003980) |
| 1.3 | 3.8 | GO:0004662 | CAAX-protein geranylgeranyltransferase activity(GO:0004662) |
| 1.0 | 4.1 | GO:0001025 | RNA polymerase III transcription factor binding(GO:0001025) |
| 0.9 | 3.7 | GO:0015220 | choline transmembrane transporter activity(GO:0015220) |
| 0.8 | 2.4 | GO:0036487 | nitric-oxide synthase inhibitor activity(GO:0036487) |
| 0.8 | 3.1 | GO:0005222 | intracellular cAMP activated cation channel activity(GO:0005222) |
| 0.7 | 11.7 | GO:0030306 | ADP-ribosylation factor binding(GO:0030306) |
| 0.7 | 18.8 | GO:0017075 | syntaxin-1 binding(GO:0017075) |
| 0.7 | 2.1 | GO:0047696 | beta-adrenergic receptor kinase activity(GO:0047696) |
| 0.7 | 3.5 | GO:0061665 | SUMO ligase activity(GO:0061665) |
| 0.7 | 14.6 | GO:0050811 | GABA receptor binding(GO:0050811) |
| 0.7 | 12.4 | GO:0050998 | nitric-oxide synthase binding(GO:0050998) |
| 0.7 | 7.4 | GO:0046935 | 1-phosphatidylinositol-3-kinase regulator activity(GO:0046935) |
| 0.7 | 3.3 | GO:0086006 | voltage-gated sodium channel activity involved in cardiac muscle cell action potential(GO:0086006) |
| 0.6 | 3.8 | GO:0004741 | [pyruvate dehydrogenase (lipoamide)] phosphatase activity(GO:0004741) |
| 0.6 | 2.5 | GO:0042030 | ATPase inhibitor activity(GO:0042030) |
| 0.5 | 2.7 | GO:0016286 | small conductance calcium-activated potassium channel activity(GO:0016286) |
| 0.5 | 5.8 | GO:0019911 | structural constituent of myelin sheath(GO:0019911) |
| 0.5 | 2.7 | GO:0016909 | JUN kinase activity(GO:0004705) SAP kinase activity(GO:0016909) |
| 0.4 | 2.8 | GO:0050682 | AF-2 domain binding(GO:0050682) |
| 0.4 | 1.1 | GO:0004938 | alpha2-adrenergic receptor activity(GO:0004938) |
| 0.4 | 4.7 | GO:0015924 | mannosyl-oligosaccharide mannosidase activity(GO:0015924) |
| 0.4 | 4.9 | GO:0017110 | nucleoside-diphosphatase activity(GO:0017110) |
| 0.3 | 1.4 | GO:0004874 | aryl hydrocarbon receptor activity(GO:0004874) |
| 0.3 | 5.9 | GO:0031702 | type 1 angiotensin receptor binding(GO:0031702) |
| 0.3 | 2.3 | GO:0008142 | oxysterol binding(GO:0008142) |
| 0.3 | 1.6 | GO:0008376 | acetylgalactosaminyltransferase activity(GO:0008376) |
| 0.3 | 2.2 | GO:0005237 | inhibitory extracellular ligand-gated ion channel activity(GO:0005237) |
| 0.3 | 7.6 | GO:0008191 | metalloendopeptidase inhibitor activity(GO:0008191) |
| 0.3 | 1.2 | GO:0043515 | kinetochore binding(GO:0043515) |
| 0.3 | 7.6 | GO:0016805 | dipeptidase activity(GO:0016805) |
| 0.3 | 2.1 | GO:0004000 | adenosine deaminase activity(GO:0004000) |
| 0.3 | 2.6 | GO:0022841 | potassium ion leak channel activity(GO:0022841) |
| 0.3 | 1.3 | GO:0008273 | calcium, potassium:sodium antiporter activity(GO:0008273) |
| 0.3 | 2.3 | GO:0003720 | telomerase activity(GO:0003720) RNA-directed DNA polymerase activity(GO:0003964) |
| 0.3 | 2.0 | GO:0046920 | alpha-(1->3)-fucosyltransferase activity(GO:0046920) |
| 0.2 | 1.0 | GO:0004594 | pantothenate kinase activity(GO:0004594) |
| 0.2 | 1.0 | GO:0043398 | HLH domain binding(GO:0043398) |
| 0.2 | 1.0 | GO:0015375 | glycine:sodium symporter activity(GO:0015375) |
| 0.2 | 6.0 | GO:0051010 | microtubule plus-end binding(GO:0051010) |
| 0.2 | 1.6 | GO:0071532 | ankyrin repeat binding(GO:0071532) |
| 0.2 | 0.9 | GO:0016635 | oxidoreductase activity, acting on the CH-CH group of donors, quinone or related compound as acceptor(GO:0016635) |
| 0.2 | 3.7 | GO:1905030 | voltage-gated sodium channel activity(GO:0005248) voltage-gated ion channel activity involved in regulation of postsynaptic membrane potential(GO:1905030) |
| 0.2 | 0.9 | GO:0034648 | histone demethylase activity (H3-dimethyl-K4 specific)(GO:0034648) |
| 0.2 | 2.4 | GO:0015379 | potassium:chloride symporter activity(GO:0015379) potassium ion symporter activity(GO:0022820) |
| 0.2 | 5.3 | GO:0005086 | ARF guanyl-nucleotide exchange factor activity(GO:0005086) |
| 0.2 | 5.0 | GO:0030676 | Rac guanyl-nucleotide exchange factor activity(GO:0030676) |
| 0.2 | 2.3 | GO:0017162 | aryl hydrocarbon receptor binding(GO:0017162) |
| 0.2 | 3.1 | GO:0017151 | DEAD/H-box RNA helicase binding(GO:0017151) |
| 0.2 | 5.3 | GO:0005251 | delayed rectifier potassium channel activity(GO:0005251) |
| 0.2 | 0.6 | GO:0004117 | calmodulin-dependent cyclic-nucleotide phosphodiesterase activity(GO:0004117) |
| 0.2 | 1.8 | GO:0050072 | m7G(5')pppN diphosphatase activity(GO:0050072) |
| 0.2 | 3.9 | GO:0045504 | dynein heavy chain binding(GO:0045504) |
| 0.2 | 1.0 | GO:0004925 | prolactin receptor activity(GO:0004925) |
| 0.2 | 1.6 | GO:0044323 | retinoic acid-responsive element binding(GO:0044323) |
| 0.2 | 1.0 | GO:0047237 | glucuronylgalactosylproteoglycan 4-beta-N-acetylgalactosaminyltransferase activity(GO:0047237) |
| 0.2 | 4.6 | GO:0001223 | transcription coactivator binding(GO:0001223) |
| 0.2 | 0.5 | GO:0086089 | voltage-gated potassium channel activity involved in atrial cardiac muscle cell action potential repolarization(GO:0086089) |
| 0.2 | 1.9 | GO:0001206 | transcriptional repressor activity, RNA polymerase II distal enhancer sequence-specific binding(GO:0001206) |
| 0.2 | 3.8 | GO:0048018 | receptor agonist activity(GO:0048018) |
| 0.2 | 6.5 | GO:0043130 | ubiquitin-like protein binding(GO:0032182) ubiquitin binding(GO:0043130) |
| 0.2 | 6.5 | GO:0017025 | TBP-class protein binding(GO:0017025) |
| 0.2 | 1.0 | GO:0044547 | DNA topoisomerase binding(GO:0044547) |
| 0.2 | 2.4 | GO:0034483 | heparan sulfate sulfotransferase activity(GO:0034483) |
| 0.2 | 2.7 | GO:0004716 | receptor signaling protein tyrosine kinase activity(GO:0004716) |
| 0.2 | 5.9 | GO:0004115 | 3',5'-cyclic-AMP phosphodiesterase activity(GO:0004115) |
| 0.1 | 2.5 | GO:0004143 | diacylglycerol kinase activity(GO:0004143) |
| 0.1 | 2.1 | GO:0015467 | G-protein activated inward rectifier potassium channel activity(GO:0015467) |
| 0.1 | 1.5 | GO:0030274 | LIM domain binding(GO:0030274) |
| 0.1 | 3.5 | GO:0004012 | phospholipid-translocating ATPase activity(GO:0004012) |
| 0.1 | 0.5 | GO:0016361 | activin receptor activity, type I(GO:0016361) |
| 0.1 | 1.1 | GO:0003997 | acyl-CoA oxidase activity(GO:0003997) |
| 0.1 | 2.3 | GO:0005385 | zinc ion transmembrane transporter activity(GO:0005385) |
| 0.1 | 20.4 | GO:0005200 | structural constituent of cytoskeleton(GO:0005200) |
| 0.1 | 2.7 | GO:0042813 | Wnt-activated receptor activity(GO:0042813) |
| 0.1 | 0.5 | GO:1990841 | promoter-specific chromatin binding(GO:1990841) |
| 0.1 | 3.6 | GO:0001671 | ATPase activator activity(GO:0001671) |
| 0.1 | 0.4 | GO:0034481 | chondroitin sulfotransferase activity(GO:0034481) |
| 0.1 | 1.8 | GO:0005522 | profilin binding(GO:0005522) |
| 0.1 | 2.1 | GO:0008353 | RNA polymerase II carboxy-terminal domain kinase activity(GO:0008353) |
| 0.1 | 1.2 | GO:0051428 | peptide hormone receptor binding(GO:0051428) |
| 0.1 | 4.4 | GO:0017112 | Rab guanyl-nucleotide exchange factor activity(GO:0017112) |
| 0.1 | 10.5 | GO:0003697 | single-stranded DNA binding(GO:0003697) |
| 0.1 | 0.6 | GO:0000990 | transcription factor activity, core RNA polymerase binding(GO:0000990) |
| 0.1 | 0.7 | GO:0033192 | calmodulin-dependent protein phosphatase activity(GO:0033192) |
| 0.1 | 1.0 | GO:0043548 | phosphatidylinositol 3-kinase binding(GO:0043548) |
| 0.1 | 2.5 | GO:0004683 | calmodulin-dependent protein kinase activity(GO:0004683) |
| 0.1 | 3.1 | GO:0045309 | protein phosphorylated amino acid binding(GO:0045309) |
| 0.1 | 0.7 | GO:0031386 | protein tag(GO:0031386) |
| 0.1 | 23.0 | GO:0005525 | GTP binding(GO:0005525) |
| 0.1 | 2.6 | GO:0019903 | protein phosphatase binding(GO:0019903) |
| 0.1 | 2.9 | GO:0005249 | voltage-gated potassium channel activity(GO:0005249) |
| 0.1 | 0.3 | GO:0072320 | volume-sensitive chloride channel activity(GO:0072320) |
| 0.1 | 2.6 | GO:0004364 | glutathione transferase activity(GO:0004364) |
| 0.1 | 0.3 | GO:0005025 | transforming growth factor beta receptor activity, type I(GO:0005025) |
| 0.1 | 4.1 | GO:0003774 | motor activity(GO:0003774) |
| 0.1 | 15.6 | GO:0015631 | tubulin binding(GO:0015631) |
| 0.1 | 5.8 | GO:0005070 | SH3/SH2 adaptor activity(GO:0005070) |
| 0.0 | 2.2 | GO:0036002 | pre-mRNA binding(GO:0036002) |
| 0.0 | 0.6 | GO:0070679 | inositol 1,4,5 trisphosphate binding(GO:0070679) |
| 0.0 | 1.3 | GO:0051219 | phosphoprotein binding(GO:0051219) |
| 0.0 | 3.2 | GO:0004402 | histone acetyltransferase activity(GO:0004402) |
| 0.0 | 1.3 | GO:0004407 | histone deacetylase activity(GO:0004407) |
| 0.0 | 2.5 | GO:0008028 | monocarboxylic acid transmembrane transporter activity(GO:0008028) |
| 0.0 | 0.5 | GO:0015266 | protein channel activity(GO:0015266) BH3 domain binding(GO:0051434) |
| 0.0 | 2.3 | GO:0004712 | protein serine/threonine/tyrosine kinase activity(GO:0004712) |
| 0.0 | 1.1 | GO:0031624 | ubiquitin conjugating enzyme binding(GO:0031624) |
| 0.0 | 1.5 | GO:0008536 | Ran GTPase binding(GO:0008536) |
| 0.0 | 0.3 | GO:0070412 | R-SMAD binding(GO:0070412) |
| 0.0 | 0.4 | GO:0008429 | phosphatidylethanolamine binding(GO:0008429) |
| 0.0 | 0.4 | GO:0015095 | magnesium ion transmembrane transporter activity(GO:0015095) |
| 0.0 | 0.1 | GO:0005168 | neurotrophin TRKA receptor binding(GO:0005168) |
| 0.0 | 0.4 | GO:0019894 | kinesin binding(GO:0019894) |
| 0.0 | 4.6 | GO:0000287 | magnesium ion binding(GO:0000287) |
| 0.0 | 0.5 | GO:0043325 | phosphatidylinositol-3,4-bisphosphate binding(GO:0043325) |
| 0.0 | 0.4 | GO:0008349 | MAP kinase kinase kinase kinase activity(GO:0008349) |
| 0.0 | 2.6 | GO:0017137 | Rab GTPase binding(GO:0017137) |
| 0.0 | 0.5 | GO:0005388 | calcium-transporting ATPase activity(GO:0005388) |
| 0.0 | 1.7 | GO:0032947 | protein complex scaffold(GO:0032947) |
| 0.0 | 0.7 | GO:0017022 | myosin binding(GO:0017022) |
| 0.0 | 0.4 | GO:0005227 | calcium activated cation channel activity(GO:0005227) |
| 0.0 | 0.0 | GO:0097100 | supercoiled DNA binding(GO:0097100) |
| 0.0 | 6.1 | GO:0004842 | ubiquitin-protein transferase activity(GO:0004842) |
| 0.0 | 0.8 | GO:0001105 | RNA polymerase II transcription coactivator activity(GO:0001105) |
| 0.0 | 0.2 | GO:0005004 | GPI-linked ephrin receptor activity(GO:0005004) |
| 0.0 | 0.3 | GO:0000983 | transcription factor activity, RNA polymerase II core promoter sequence-specific(GO:0000983) |
Gene overrepresentation in C2:CP category:
| Log-likelihood per target | Total log-likelihood | Term | Description |
|---|---|---|---|
| 0.3 | 14.0 | ST GA12 PATHWAY | G alpha 12 Pathway |
| 0.3 | 5.8 | PID P38 GAMMA DELTA PATHWAY | Signaling mediated by p38-gamma and p38-delta |
| 0.3 | 14.8 | SIG CD40PATHWAYMAP | Genes related to CD40 signaling |
| 0.3 | 4.1 | PID RANBP2 PATHWAY | Sumoylation by RanBP2 regulates transcriptional repression |
| 0.2 | 2.2 | ST IL 13 PATHWAY | Interleukin 13 (IL-13) Pathway |
| 0.2 | 6.1 | ST GRANULE CELL SURVIVAL PATHWAY | Granule Cell Survival Pathway is a specific case of more general PAC1 Receptor Pathway. |
| 0.2 | 7.4 | PID TRAIL PATHWAY | TRAIL signaling pathway |
| 0.1 | 5.3 | PID INSULIN GLUCOSE PATHWAY | Insulin-mediated glucose transport |
| 0.1 | 4.4 | PID HDAC CLASSIII PATHWAY | Signaling events mediated by HDAC Class III |
| 0.1 | 5.0 | PID P38 ALPHA BETA PATHWAY | Regulation of p38-alpha and p38-beta |
| 0.1 | 8.2 | PID RAC1 REG PATHWAY | Regulation of RAC1 activity |
| 0.1 | 3.1 | PID WNT SIGNALING PATHWAY | Wnt signaling network |
| 0.1 | 3.5 | PID RETINOIC ACID PATHWAY | Retinoic acid receptors-mediated signaling |
| 0.1 | 1.7 | PID NECTIN PATHWAY | Nectin adhesion pathway |
| 0.1 | 3.5 | PID IFNG PATHWAY | IFN-gamma pathway |
| 0.1 | 2.7 | PID ERBB NETWORK PATHWAY | ErbB receptor signaling network |
| 0.1 | 1.2 | PID ECADHERIN KERATINOCYTE PATHWAY | E-cadherin signaling in keratinocytes |
| 0.1 | 1.6 | PID WNT CANONICAL PATHWAY | Canonical Wnt signaling pathway |
| 0.1 | 3.7 | NABA PROTEOGLYCANS | Genes encoding proteoglycans |
| 0.1 | 1.3 | PID CONE PATHWAY | Visual signal transduction: Cones |
| 0.0 | 2.9 | PID FCER1 PATHWAY | Fc-epsilon receptor I signaling in mast cells |
| 0.0 | 2.3 | PID HIF2PATHWAY | HIF-2-alpha transcription factor network |
| 0.0 | 3.9 | WNT SIGNALING | Genes related to Wnt-mediated signal transduction |
| 0.0 | 1.6 | PID RHOA PATHWAY | RhoA signaling pathway |
| 0.0 | 0.8 | PID FAK PATHWAY | Signaling events mediated by focal adhesion kinase |
| 0.0 | 0.6 | PID LPA4 PATHWAY | LPA4-mediated signaling events |
| 0.0 | 1.4 | PID LYSOPHOSPHOLIPID PATHWAY | LPA receptor mediated events |
| 0.0 | 1.0 | PID RET PATHWAY | Signaling events regulated by Ret tyrosine kinase |
| 0.0 | 2.7 | PID HIF1 TFPATHWAY | HIF-1-alpha transcription factor network |
| 0.0 | 0.5 | ST ADRENERGIC | Adrenergic Pathway |
| 0.0 | 0.3 | PID IL2 PI3K PATHWAY | IL2 signaling events mediated by PI3K |
| 0.0 | 1.8 | ST INTEGRIN SIGNALING PATHWAY | Integrin Signaling Pathway |
| 0.0 | 0.9 | PID PTP1B PATHWAY | Signaling events mediated by PTP1B |
| 0.0 | 1.0 | NABA BASEMENT MEMBRANES | Genes encoding structural components of basement membranes |
| 0.0 | 0.4 | PID RAS PATHWAY | Regulation of Ras family activation |
| 0.0 | 0.5 | PID PI3KCI PATHWAY | Class I PI3K signaling events |
| 0.0 | 0.7 | PID P38 ALPHA BETA DOWNSTREAM PATHWAY | Signaling mediated by p38-alpha and p38-beta |
| 0.0 | 0.3 | PID INTEGRIN5 PATHWAY | Beta5 beta6 beta7 and beta8 integrin cell surface interactions |
| 0.0 | 0.2 | PID EPHA FWDPATHWAY | EPHA forward signaling |
Gene overrepresentation in C2:CP:REACTOME category:
| Log-likelihood per target | Total log-likelihood | Term | Description |
|---|---|---|---|
| 1.3 | 24.0 | REACTOME NOREPINEPHRINE NEUROTRANSMITTER RELEASE CYCLE | Genes involved in Norepinephrine Neurotransmitter Release Cycle |
| 0.5 | 3.0 | REACTOME ACETYLCHOLINE NEUROTRANSMITTER RELEASE CYCLE | Genes involved in Acetylcholine Neurotransmitter Release Cycle |
| 0.5 | 15.2 | REACTOME GABA A RECEPTOR ACTIVATION | Genes involved in GABA A receptor activation |
| 0.4 | 8.1 | REACTOME GABA SYNTHESIS RELEASE REUPTAKE AND DEGRADATION | Genes involved in GABA synthesis, release, reuptake and degradation |
| 0.4 | 7.4 | REACTOME IL 7 SIGNALING | Genes involved in Interleukin-7 signaling |
| 0.3 | 7.9 | REACTOME G BETA GAMMA SIGNALLING THROUGH PLC BETA | Genes involved in G beta:gamma signalling through PLC beta |
| 0.3 | 5.5 | REACTOME CALNEXIN CALRETICULIN CYCLE | Genes involved in Calnexin/calreticulin cycle |
| 0.3 | 10.4 | REACTOME INTERACTION BETWEEN L1 AND ANKYRINS | Genes involved in Interaction between L1 and Ankyrins |
| 0.2 | 3.8 | REACTOME REGULATION OF PYRUVATE DEHYDROGENASE PDH COMPLEX | Genes involved in Regulation of pyruvate dehydrogenase (PDH) complex |
| 0.2 | 5.9 | REACTOME CIRCADIAN REPRESSION OF EXPRESSION BY REV ERBA | Genes involved in Circadian Repression of Expression by REV-ERBA |
| 0.2 | 2.4 | REACTOME IRAK1 RECRUITS IKK COMPLEX | Genes involved in IRAK1 recruits IKK complex |
| 0.2 | 2.9 | REACTOME SYNTHESIS OF SUBSTRATES IN N GLYCAN BIOSYTHESIS | Genes involved in Synthesis of substrates in N-glycan biosythesis |
| 0.2 | 5.0 | REACTOME CELL EXTRACELLULAR MATRIX INTERACTIONS | Genes involved in Cell-extracellular matrix interactions |
| 0.2 | 2.7 | REACTOME JNK C JUN KINASES PHOSPHORYLATION AND ACTIVATION MEDIATED BY ACTIVATED HUMAN TAK1 | Genes involved in JNK (c-Jun kinases) phosphorylation and activation mediated by activated human TAK1 |
| 0.2 | 15.4 | REACTOME POTASSIUM CHANNELS | Genes involved in Potassium Channels |
| 0.2 | 3.7 | REACTOME CTNNB1 PHOSPHORYLATION CASCADE | Genes involved in Beta-catenin phosphorylation cascade |
| 0.1 | 3.7 | REACTOME GLUCAGON TYPE LIGAND RECEPTORS | Genes involved in Glucagon-type ligand receptors |
| 0.1 | 2.2 | REACTOME IL 6 SIGNALING | Genes involved in Interleukin-6 signaling |
| 0.1 | 2.5 | REACTOME ALPHA LINOLENIC ACID ALA METABOLISM | Genes involved in alpha-linolenic acid (ALA) metabolism |
| 0.1 | 3.7 | REACTOME REGULATION OF GENE EXPRESSION IN BETA CELLS | Genes involved in Regulation of gene expression in beta cells |
| 0.1 | 1.7 | REACTOME MRNA DECAY BY 5 TO 3 EXORIBONUCLEASE | Genes involved in mRNA Decay by 5' to 3' Exoribonuclease |
| 0.1 | 1.9 | REACTOME TRAF3 DEPENDENT IRF ACTIVATION PATHWAY | Genes involved in TRAF3-dependent IRF activation pathway |
| 0.1 | 1.8 | REACTOME THE NLRP3 INFLAMMASOME | Genes involved in The NLRP3 inflammasome |
| 0.1 | 1.1 | REACTOME INHIBITION OF INSULIN SECRETION BY ADRENALINE NORADRENALINE | Genes involved in Inhibition of Insulin Secretion by Adrenaline/Noradrenaline |
| 0.1 | 3.9 | REACTOME RNA POL II TRANSCRIPTION PRE INITIATION AND PROMOTER OPENING | Genes involved in RNA Polymerase II Transcription Pre-Initiation And Promoter Opening |
| 0.1 | 3.0 | REACTOME REGULATION OF HYPOXIA INDUCIBLE FACTOR HIF BY OXYGEN | Genes involved in Regulation of Hypoxia-inducible Factor (HIF) by Oxygen |
| 0.1 | 1.7 | REACTOME AMINE COMPOUND SLC TRANSPORTERS | Genes involved in Amine compound SLC transporters |
| 0.1 | 3.9 | REACTOME ION TRANSPORT BY P TYPE ATPASES | Genes involved in Ion transport by P-type ATPases |
| 0.1 | 1.6 | REACTOME RNA POL III CHAIN ELONGATION | Genes involved in RNA Polymerase III Chain Elongation |
| 0.1 | 1.0 | REACTOME VITAMIN B5 PANTOTHENATE METABOLISM | Genes involved in Vitamin B5 (pantothenate) metabolism |
| 0.1 | 1.5 | REACTOME SHC1 EVENTS IN ERBB4 SIGNALING | Genes involved in SHC1 events in ERBB4 signaling |
| 0.1 | 1.0 | REACTOME SIGNAL ATTENUATION | Genes involved in Signal attenuation |
| 0.0 | 4.6 | REACTOME G ALPHA S SIGNALLING EVENTS | Genes involved in G alpha (s) signalling events |
| 0.0 | 4.2 | REACTOME MEIOTIC SYNAPSIS | Genes involved in Meiotic Synapsis |
| 0.0 | 3.1 | REACTOME CLASS B 2 SECRETIN FAMILY RECEPTORS | Genes involved in Class B/2 (Secretin family receptors) |
| 0.0 | 1.5 | REACTOME ACTIVATED NOTCH1 TRANSMITS SIGNAL TO THE NUCLEUS | Genes involved in Activated NOTCH1 Transmits Signal to the Nucleus |
| 0.0 | 0.5 | REACTOME SIGNALING BY NODAL | Genes involved in Signaling by NODAL |
| 0.0 | 1.2 | REACTOME ANTIGEN ACTIVATES B CELL RECEPTOR LEADING TO GENERATION OF SECOND MESSENGERS | Genes involved in Antigen Activates B Cell Receptor Leading to Generation of Second Messengers |
| 0.0 | 1.2 | REACTOME EFFECTS OF PIP2 HYDROLYSIS | Genes involved in Effects of PIP2 hydrolysis |
| 0.0 | 0.9 | REACTOME PYRIMIDINE METABOLISM | Genes involved in Pyrimidine metabolism |
| 0.0 | 2.0 | REACTOME SIGNALING BY WNT | Genes involved in Signaling by Wnt |
| 0.0 | 1.3 | REACTOME NOTCH1 INTRACELLULAR DOMAIN REGULATES TRANSCRIPTION | Genes involved in NOTCH1 Intracellular Domain Regulates Transcription |
| 0.0 | 0.5 | REACTOME DEPOSITION OF NEW CENPA CONTAINING NUCLEOSOMES AT THE CENTROMERE | Genes involved in Deposition of New CENPA-containing Nucleosomes at the Centromere |
| 0.0 | 1.0 | REACTOME G1 PHASE | Genes involved in G1 Phase |
| 0.0 | 0.1 | REACTOME REGULATION OF INSULIN SECRETION BY ACETYLCHOLINE | Genes involved in Regulation of Insulin Secretion by Acetylcholine |
| 0.0 | 0.6 | REACTOME NITRIC OXIDE STIMULATES GUANYLATE CYCLASE | Genes involved in Nitric oxide stimulates guanylate cyclase |
| 0.0 | 0.6 | REACTOME RECYCLING PATHWAY OF L1 | Genes involved in Recycling pathway of L1 |
| 0.0 | 1.6 | REACTOME TRANSPORT OF INORGANIC CATIONS ANIONS AND AMINO ACIDS OLIGOPEPTIDES | Genes involved in Transport of inorganic cations/anions and amino acids/oligopeptides |
| 0.0 | 2.1 | REACTOME G ALPHA Q SIGNALLING EVENTS | Genes involved in G alpha (q) signalling events |
| 0.0 | 1.2 | REACTOME LOSS OF NLP FROM MITOTIC CENTROSOMES | Genes involved in Loss of Nlp from mitotic centrosomes |
| 0.0 | 0.2 | REACTOME REGULATION OF IFNG SIGNALING | Genes involved in Regulation of IFNG signaling |