Project
GNF SymAtlas + NCI-60 cancer cell lines, comparison of cancers vs non-cancers, human (Su, 2004; Ross, 2000)
Navigation
Downloads
Results for AUUGCAC
Z-value: 0.11
Motif logo

miRNA associated with seed AUUGCAC
| Name | miRBASE accession |
|---|---|
|
hsa-miR-25-3p
|
MIMAT0000081 |
|
hsa-miR-32-5p
|
MIMAT0000090 |
|
hsa-miR-92a-3p
|
MIMAT0000092 |
|
hsa-miR-92b-3p
|
MIMAT0003218 |
|
hsa-miR-363-3p
|
MIMAT0000707 |
|
hsa-miR-367-3p
|
MIMAT0000719 |
Activity profile of AUUGCAC motif
Sorted Z-values of AUUGCAC motif
| Promoter | Log-likelihood | Transcript | Gene | Gene Info |
|---|---|---|---|---|
| chr11_-_12030629 | 10.52 |
ENST00000396505.2
|
DKK3
|
dickkopf WNT signaling pathway inhibitor 3 |
| chr4_-_176923483 | 9.88 |
ENST00000280187.7
ENST00000512509.1 |
GPM6A
|
glycoprotein M6A |
| chr8_+_24772455 | 9.74 |
ENST00000433454.2
|
NEFM
|
neurofilament, medium polypeptide |
| chr5_+_71403061 | 9.40 |
ENST00000512974.1
ENST00000296755.7 |
MAP1B
|
microtubule-associated protein 1B |
| chr12_+_79258547 | 8.31 |
ENST00000457153.2
|
SYT1
|
synaptotagmin I |
| chr20_+_44657845 | 7.97 |
ENST00000243964.3
|
SLC12A5
|
solute carrier family 12 (potassium/chloride transporter), member 5 |
| chr1_+_10271674 | 7.35 |
ENST00000377086.1
|
KIF1B
|
kinesin family member 1B |
| chr1_+_51701924 | 7.31 |
ENST00000242719.3
|
RNF11
|
ring finger protein 11 |
| chr8_+_132916318 | 6.40 |
ENST00000254624.5
ENST00000522709.1 |
EFR3A
|
EFR3 homolog A (S. cerevisiae) |
| chr15_-_73925651 | 6.37 |
ENST00000545878.1
ENST00000287226.8 ENST00000345330.4 |
NPTN
|
neuroplastin |
| chr6_+_107811162 | 5.99 |
ENST00000317357.5
|
SOBP
|
sine oculis binding protein homolog (Drosophila) |
| chr4_-_174320687 | 5.84 |
ENST00000296506.3
|
SCRG1
|
stimulator of chondrogenesis 1 |
| chr3_+_115342159 | 5.67 |
ENST00000305124.6
|
GAP43
|
growth associated protein 43 |
| chr17_+_44668035 | 5.22 |
ENST00000398238.4
ENST00000225282.8 |
NSF
|
N-ethylmaleimide-sensitive factor |
| chr19_+_47104493 | 5.13 |
ENST00000291295.9
ENST00000597743.1 |
CALM3
|
calmodulin 3 (phosphorylase kinase, delta) |
| chr12_+_8234807 | 4.97 |
ENST00000339754.5
|
NECAP1
|
NECAP endocytosis associated 1 |
| chr5_+_125758813 | 4.69 |
ENST00000285689.3
ENST00000515200.1 |
GRAMD3
|
GRAM domain containing 3 |
| chr2_-_169104651 | 4.57 |
ENST00000355999.4
|
STK39
|
serine threonine kinase 39 |
| chr3_+_11034403 | 4.57 |
ENST00000287766.4
ENST00000425938.1 |
SLC6A1
|
solute carrier family 6 (neurotransmitter transporter), member 1 |
| chr3_-_123603137 | 4.55 |
ENST00000360304.3
ENST00000359169.1 ENST00000346322.5 ENST00000360772.3 |
MYLK
|
myosin light chain kinase |
| chr8_+_38088861 | 4.44 |
ENST00000397166.2
ENST00000533100.1 |
DDHD2
|
DDHD domain containing 2 |
| chr1_+_110527308 | 4.37 |
ENST00000369799.5
|
AHCYL1
|
adenosylhomocysteinase-like 1 |
| chr2_+_187454749 | 4.24 |
ENST00000261023.3
ENST00000374907.3 |
ITGAV
|
integrin, alpha V |
| chr11_+_121322832 | 4.12 |
ENST00000260197.7
|
SORL1
|
sortilin-related receptor, L(DLR class) A repeats containing |
| chr14_+_93389425 | 3.98 |
ENST00000216492.5
ENST00000334654.4 |
CHGA
|
chromogranin A (parathyroid secretory protein 1) |
| chr17_+_11924129 | 3.94 |
ENST00000353533.5
ENST00000415385.3 |
MAP2K4
|
mitogen-activated protein kinase kinase 4 |
| chr2_+_64068074 | 3.84 |
ENST00000394417.2
ENST00000484142.1 ENST00000482668.1 ENST00000467648.2 |
UGP2
|
UDP-glucose pyrophosphorylase 2 |
| chr22_+_29876197 | 3.78 |
ENST00000310624.6
|
NEFH
|
neurofilament, heavy polypeptide |
| chr3_-_127542021 | 3.70 |
ENST00000434178.2
|
MGLL
|
monoglyceride lipase |
| chr11_+_123396528 | 3.67 |
ENST00000322282.7
ENST00000529750.1 |
GRAMD1B
|
GRAM domain containing 1B |
| chr10_+_70748487 | 3.57 |
ENST00000361983.4
|
KIAA1279
|
KIAA1279 |
| chr3_+_49591881 | 3.54 |
ENST00000296452.4
|
BSN
|
bassoon presynaptic cytomatrix protein |
| chr8_+_20054878 | 3.51 |
ENST00000276390.2
ENST00000519667.1 |
ATP6V1B2
|
ATPase, H+ transporting, lysosomal 56/58kDa, V1 subunit B2 |
| chr2_-_2334888 | 3.47 |
ENST00000428368.2
ENST00000399161.2 |
MYT1L
|
myelin transcription factor 1-like |
| chr4_-_139163491 | 3.47 |
ENST00000280612.5
|
SLC7A11
|
solute carrier family 7 (anionic amino acid transporter light chain, xc- system), member 11 |
| chr1_+_244214577 | 3.46 |
ENST00000358704.4
|
ZBTB18
|
zinc finger and BTB domain containing 18 |
| chr11_-_45687128 | 3.42 |
ENST00000308064.2
|
CHST1
|
carbohydrate (keratan sulfate Gal-6) sulfotransferase 1 |
| chr8_+_11141925 | 3.42 |
ENST00000221086.3
|
MTMR9
|
myotubularin related protein 9 |
| chr16_+_11762270 | 3.39 |
ENST00000329565.5
|
SNN
|
stannin |
| chr3_-_120170052 | 3.36 |
ENST00000295633.3
|
FSTL1
|
follistatin-like 1 |
| chr5_+_65222299 | 3.20 |
ENST00000284037.5
|
ERBB2IP
|
erbb2 interacting protein |
| chr4_-_153457197 | 3.20 |
ENST00000281708.4
|
FBXW7
|
F-box and WD repeat domain containing 7, E3 ubiquitin protein ligase |
| chr15_-_65809581 | 3.18 |
ENST00000341861.5
|
DPP8
|
dipeptidyl-peptidase 8 |
| chr14_+_29234870 | 3.13 |
ENST00000382535.3
|
FOXG1
|
forkhead box G1 |
| chr13_-_77900814 | 3.12 |
ENST00000544440.2
|
MYCBP2
|
MYC binding protein 2, E3 ubiquitin protein ligase |
| chr10_+_99185917 | 3.10 |
ENST00000334828.5
|
PGAM1
|
phosphoglycerate mutase 1 (brain) |
| chr8_+_41348072 | 3.08 |
ENST00000405786.2
|
GOLGA7
|
golgin A7 |
| chr6_-_128841503 | 3.08 |
ENST00000368215.3
ENST00000532331.1 ENST00000368213.5 ENST00000368207.3 ENST00000525459.1 ENST00000368210.3 ENST00000368226.4 ENST00000368227.3 |
PTPRK
|
protein tyrosine phosphatase, receptor type, K |
| chr22_-_38669030 | 3.07 |
ENST00000361906.3
|
TMEM184B
|
transmembrane protein 184B |
| chr10_-_73848531 | 3.07 |
ENST00000373109.2
|
SPOCK2
|
sparc/osteonectin, cwcv and kazal-like domains proteoglycan (testican) 2 |
| chr19_+_41725088 | 3.01 |
ENST00000301178.4
|
AXL
|
AXL receptor tyrosine kinase |
| chr18_-_53255766 | 3.00 |
ENST00000566286.1
ENST00000564999.1 ENST00000566279.1 ENST00000354452.3 ENST00000356073.4 |
TCF4
|
transcription factor 4 |
| chr22_-_36236265 | 3.00 |
ENST00000414461.2
ENST00000416721.2 ENST00000449924.2 ENST00000262829.7 ENST00000397305.3 |
RBFOX2
|
RNA binding protein, fox-1 homolog (C. elegans) 2 |
| chr17_+_30813576 | 2.98 |
ENST00000313401.3
|
CDK5R1
|
cyclin-dependent kinase 5, regulatory subunit 1 (p35) |
| chr5_+_109025067 | 2.88 |
ENST00000261483.4
|
MAN2A1
|
mannosidase, alpha, class 2A, member 1 |
| chr8_-_104427313 | 2.74 |
ENST00000297578.4
|
SLC25A32
|
solute carrier family 25 (mitochondrial folate carrier), member 32 |
| chr6_+_69345166 | 2.70 |
ENST00000370598.1
|
BAI3
|
brain-specific angiogenesis inhibitor 3 |
| chr15_-_52861394 | 2.69 |
ENST00000563277.1
ENST00000566423.1 |
ARPP19
|
cAMP-regulated phosphoprotein, 19kDa |
| chr20_+_53092123 | 2.58 |
ENST00000262593.5
|
DOK5
|
docking protein 5 |
| chr9_-_140351928 | 2.53 |
ENST00000339554.3
|
NSMF
|
NMDA receptor synaptonuclear signaling and neuronal migration factor |
| chr7_+_106685079 | 2.50 |
ENST00000265717.4
|
PRKAR2B
|
protein kinase, cAMP-dependent, regulatory, type II, beta |
| chr6_-_52441713 | 2.49 |
ENST00000182527.3
|
TRAM2
|
translocation associated membrane protein 2 |
| chr7_+_94139105 | 2.49 |
ENST00000297273.4
|
CASD1
|
CAS1 domain containing 1 |
| chr7_-_44530479 | 2.47 |
ENST00000355451.7
|
NUDCD3
|
NudC domain containing 3 |
| chrX_+_146993449 | 2.39 |
ENST00000218200.8
ENST00000370471.3 ENST00000370477.1 |
FMR1
|
fragile X mental retardation 1 |
| chr13_-_110438914 | 2.39 |
ENST00000375856.3
|
IRS2
|
insulin receptor substrate 2 |
| chr7_+_108210012 | 2.38 |
ENST00000249356.3
|
DNAJB9
|
DnaJ (Hsp40) homolog, subfamily B, member 9 |
| chr3_+_4535025 | 2.38 |
ENST00000302640.8
ENST00000354582.6 ENST00000423119.2 ENST00000357086.4 ENST00000456211.2 |
ITPR1
|
inositol 1,4,5-trisphosphate receptor, type 1 |
| chr6_-_16761678 | 2.34 |
ENST00000244769.4
ENST00000436367.1 |
ATXN1
|
ataxin 1 |
| chr13_+_48807288 | 2.34 |
ENST00000378565.5
|
ITM2B
|
integral membrane protein 2B |
| chr12_-_15942309 | 2.26 |
ENST00000544064.1
ENST00000543523.1 ENST00000536793.1 |
EPS8
|
epidermal growth factor receptor pathway substrate 8 |
| chr5_+_152870106 | 2.26 |
ENST00000285900.5
|
GRIA1
|
glutamate receptor, ionotropic, AMPA 1 |
| chr8_-_66546439 | 2.24 |
ENST00000276569.3
|
ARMC1
|
armadillo repeat containing 1 |
| chr1_+_167905894 | 2.17 |
ENST00000367843.3
ENST00000432587.2 ENST00000312263.6 |
DCAF6
|
DDB1 and CUL4 associated factor 6 |
| chr6_+_158733692 | 2.14 |
ENST00000367094.2
ENST00000367097.3 |
TULP4
|
tubby like protein 4 |
| chr16_-_71758602 | 2.13 |
ENST00000568954.1
|
PHLPP2
|
PH domain and leucine rich repeat protein phosphatase 2 |
| chr12_-_29534074 | 2.07 |
ENST00000546839.1
ENST00000360150.4 ENST00000552155.1 ENST00000550353.1 ENST00000548441.1 ENST00000552132.1 |
ERGIC2
|
ERGIC and golgi 2 |
| chr2_+_198380289 | 2.07 |
ENST00000233892.4
ENST00000409916.1 |
MOB4
|
MOB family member 4, phocein |
| chr3_-_56502375 | 2.03 |
ENST00000288221.6
|
ERC2
|
ELKS/RAB6-interacting/CAST family member 2 |
| chr6_-_80657292 | 2.00 |
ENST00000369816.4
|
ELOVL4
|
ELOVL fatty acid elongase 4 |
| chr3_+_20081515 | 1.99 |
ENST00000263754.4
|
KAT2B
|
K(lysine) acetyltransferase 2B |
| chr8_+_79578282 | 1.97 |
ENST00000263849.4
|
ZC2HC1A
|
zinc finger, C2HC-type containing 1A |
| chr1_+_174769006 | 1.95 |
ENST00000489615.1
|
RABGAP1L
|
RAB GTPase activating protein 1-like |
| chr10_+_1095416 | 1.89 |
ENST00000358220.1
|
WDR37
|
WD repeat domain 37 |
| chr16_+_7382745 | 1.87 |
ENST00000436368.2
ENST00000311745.5 ENST00000355637.4 ENST00000340209.4 |
RBFOX1
|
RNA binding protein, fox-1 homolog (C. elegans) 1 |
| chr8_-_101965146 | 1.84 |
ENST00000395957.2
ENST00000395948.2 ENST00000457309.1 |
YWHAZ
|
tyrosine 3-monooxygenase/tryptophan 5-monooxygenase activation protein, zeta |
| chr5_-_77844974 | 1.83 |
ENST00000515007.2
|
LHFPL2
|
lipoma HMGIC fusion partner-like 2 |
| chr20_+_19193269 | 1.82 |
ENST00000328041.6
|
SLC24A3
|
solute carrier family 24 (sodium/potassium/calcium exchanger), member 3 |
| chr14_+_102829300 | 1.80 |
ENST00000359520.7
|
TECPR2
|
tectonin beta-propeller repeat containing 2 |
| chr17_-_79139817 | 1.80 |
ENST00000326724.4
|
AATK
|
apoptosis-associated tyrosine kinase |
| chr10_+_96162242 | 1.78 |
ENST00000225235.4
|
TBC1D12
|
TBC1 domain family, member 12 |
| chr10_+_63661053 | 1.77 |
ENST00000279873.7
|
ARID5B
|
AT rich interactive domain 5B (MRF1-like) |
| chr13_+_32605437 | 1.75 |
ENST00000380250.3
|
FRY
|
furry homolog (Drosophila) |
| chr1_-_94703118 | 1.75 |
ENST00000260526.6
ENST00000370217.3 |
ARHGAP29
|
Rho GTPase activating protein 29 |
| chr18_-_21166841 | 1.74 |
ENST00000269228.5
|
NPC1
|
Niemann-Pick disease, type C1 |
| chr5_-_157002775 | 1.73 |
ENST00000257527.4
|
ADAM19
|
ADAM metallopeptidase domain 19 |
| chr16_+_53088885 | 1.70 |
ENST00000566029.1
ENST00000447540.1 |
CHD9
|
chromodomain helicase DNA binding protein 9 |
| chr1_-_179846928 | 1.68 |
ENST00000367612.3
ENST00000609928.1 |
TOR1AIP2
|
torsin A interacting protein 2 |
| chr4_+_169418195 | 1.67 |
ENST00000261509.6
ENST00000335742.7 |
PALLD
|
palladin, cytoskeletal associated protein |
| chr17_+_2496971 | 1.63 |
ENST00000397195.5
|
PAFAH1B1
|
platelet-activating factor acetylhydrolase 1b, regulatory subunit 1 (45kDa) |
| chr17_+_46985731 | 1.62 |
ENST00000360943.5
|
UBE2Z
|
ubiquitin-conjugating enzyme E2Z |
| chr10_-_32345305 | 1.62 |
ENST00000302418.4
|
KIF5B
|
kinesin family member 5B |
| chr12_+_110719032 | 1.62 |
ENST00000395494.2
|
ATP2A2
|
ATPase, Ca++ transporting, cardiac muscle, slow twitch 2 |
| chr11_+_73019282 | 1.62 |
ENST00000263674.3
|
ARHGEF17
|
Rho guanine nucleotide exchange factor (GEF) 17 |
| chr15_-_83316254 | 1.62 |
ENST00000567678.1
ENST00000450751.2 |
CPEB1
|
cytoplasmic polyadenylation element binding protein 1 |
| chr5_+_118407053 | 1.60 |
ENST00000311085.8
ENST00000539542.1 |
DMXL1
|
Dmx-like 1 |
| chr17_-_53499310 | 1.60 |
ENST00000262065.3
|
MMD
|
monocyte to macrophage differentiation-associated |
| chr12_-_63328817 | 1.55 |
ENST00000228705.6
|
PPM1H
|
protein phosphatase, Mg2+/Mn2+ dependent, 1H |
| chr20_+_30865429 | 1.53 |
ENST00000375712.3
|
KIF3B
|
kinesin family member 3B |
| chr8_+_1772132 | 1.53 |
ENST00000349830.3
ENST00000520359.1 ENST00000518288.1 ENST00000398560.1 |
ARHGEF10
|
Rho guanine nucleotide exchange factor (GEF) 10 |
| chr11_-_790060 | 1.53 |
ENST00000330106.4
|
CEND1
|
cell cycle exit and neuronal differentiation 1 |
| chr4_-_141348999 | 1.52 |
ENST00000325617.5
|
CLGN
|
calmegin |
| chr4_-_76598296 | 1.49 |
ENST00000395719.3
|
G3BP2
|
GTPase activating protein (SH3 domain) binding protein 2 |
| chr14_+_104182061 | 1.49 |
ENST00000216602.6
|
ZFYVE21
|
zinc finger, FYVE domain containing 21 |
| chr17_-_1465924 | 1.48 |
ENST00000573231.1
ENST00000576722.1 ENST00000576761.1 ENST00000576010.2 ENST00000313486.7 ENST00000539476.1 |
PITPNA
|
phosphatidylinositol transfer protein, alpha |
| chr7_-_766879 | 1.48 |
ENST00000537384.1
ENST00000417852.1 |
PRKAR1B
|
protein kinase, cAMP-dependent, regulatory, type I, beta |
| chr8_+_104831472 | 1.48 |
ENST00000262231.10
ENST00000507740.1 |
RIMS2
|
regulating synaptic membrane exocytosis 2 |
| chr2_-_202316260 | 1.47 |
ENST00000332624.3
|
TRAK2
|
trafficking protein, kinesin binding 2 |
| chr22_-_47134077 | 1.43 |
ENST00000541677.1
ENST00000216264.8 |
CERK
|
ceramide kinase |
| chr3_+_150321068 | 1.42 |
ENST00000471696.1
ENST00000477889.1 ENST00000485923.1 |
SELT
|
Selenoprotein T |
| chr8_-_103876965 | 1.42 |
ENST00000337198.5
|
AZIN1
|
antizyme inhibitor 1 |
| chr19_-_3700388 | 1.39 |
ENST00000589578.1
ENST00000537021.1 ENST00000539785.1 ENST00000335312.3 |
PIP5K1C
|
phosphatidylinositol-4-phosphate 5-kinase, type I, gamma |
| chr3_-_79068594 | 1.38 |
ENST00000436010.2
|
ROBO1
|
roundabout, axon guidance receptor, homolog 1 (Drosophila) |
| chr9_+_137533615 | 1.36 |
ENST00000371817.3
|
COL5A1
|
collagen, type V, alpha 1 |
| chr9_+_116207007 | 1.32 |
ENST00000374140.2
|
RGS3
|
regulator of G-protein signaling 3 |
| chr7_-_105029329 | 1.30 |
ENST00000393651.3
ENST00000460391.1 |
SRPK2
|
SRSF protein kinase 2 |
| chr21_-_34100244 | 1.29 |
ENST00000382491.3
ENST00000357345.3 ENST00000429236.1 |
SYNJ1
|
synaptojanin 1 |
| chr15_+_85523671 | 1.25 |
ENST00000310298.4
ENST00000557957.1 |
PDE8A
|
phosphodiesterase 8A |
| chr1_-_27481401 | 1.25 |
ENST00000263980.3
|
SLC9A1
|
solute carrier family 9, subfamily A (NHE1, cation proton antiporter 1), member 1 |
| chr3_-_37217756 | 1.21 |
ENST00000440230.1
ENST00000421276.2 ENST00000421307.1 ENST00000354379.4 |
LRRFIP2
|
leucine rich repeat (in FLII) interacting protein 2 |
| chr6_-_100016527 | 1.19 |
ENST00000523985.1
ENST00000518714.1 ENST00000520371.1 |
CCNC
|
cyclin C |
| chr14_+_57735614 | 1.18 |
ENST00000261558.3
|
AP5M1
|
adaptor-related protein complex 5, mu 1 subunit |
| chr3_-_142166904 | 1.17 |
ENST00000264951.4
|
XRN1
|
5'-3' exoribonuclease 1 |
| chr10_+_64564469 | 1.16 |
ENST00000373783.1
|
ADO
|
2-aminoethanethiol (cysteamine) dioxygenase |
| chr19_+_39881951 | 1.16 |
ENST00000315588.5
ENST00000594368.1 ENST00000599213.2 ENST00000596297.1 |
MED29
|
mediator complex subunit 29 |
| chr15_+_33603147 | 1.16 |
ENST00000415757.3
ENST00000389232.4 |
RYR3
|
ryanodine receptor 3 |
| chrX_-_77041685 | 1.16 |
ENST00000373344.5
ENST00000395603.3 |
ATRX
|
alpha thalassemia/mental retardation syndrome X-linked |
| chr8_-_117886955 | 1.16 |
ENST00000297338.2
|
RAD21
|
RAD21 homolog (S. pombe) |
| chr12_-_133405288 | 1.15 |
ENST00000204726.3
|
GOLGA3
|
golgin A3 |
| chr9_-_36400213 | 1.15 |
ENST00000259605.6
ENST00000353739.4 |
RNF38
|
ring finger protein 38 |
| chr20_+_1875110 | 1.14 |
ENST00000400068.3
|
SIRPA
|
signal-regulatory protein alpha |
| chr1_-_205719295 | 1.12 |
ENST00000367142.4
|
NUCKS1
|
nuclear casein kinase and cyclin-dependent kinase substrate 1 |
| chr10_-_119134918 | 1.11 |
ENST00000334464.5
|
PDZD8
|
PDZ domain containing 8 |
| chr7_-_35734730 | 1.10 |
ENST00000396081.1
ENST00000311350.3 |
HERPUD2
|
HERPUD family member 2 |
| chr14_+_65171099 | 1.10 |
ENST00000247226.7
|
PLEKHG3
|
pleckstrin homology domain containing, family G (with RhoGef domain) member 3 |
| chr19_-_45663408 | 1.10 |
ENST00000317951.4
|
NKPD1
|
NTPase, KAP family P-loop domain containing 1 |
| chr12_+_57984965 | 1.08 |
ENST00000540759.2
ENST00000551772.1 ENST00000550465.1 ENST00000354947.5 |
PIP4K2C
|
phosphatidylinositol-5-phosphate 4-kinase, type II, gamma |
| chr1_-_84464780 | 1.06 |
ENST00000260505.8
|
TTLL7
|
tubulin tyrosine ligase-like family, member 7 |
| chr15_-_28567298 | 0.98 |
ENST00000261609.7
|
HERC2
|
HECT and RLD domain containing E3 ubiquitin protein ligase 2 |
| chr9_-_135819987 | 0.96 |
ENST00000298552.3
ENST00000403810.1 |
TSC1
|
tuberous sclerosis 1 |
| chr8_-_23315190 | 0.95 |
ENST00000356206.6
ENST00000358689.4 ENST00000417069.2 |
ENTPD4
|
ectonucleoside triphosphate diphosphohydrolase 4 |
| chr15_-_49447835 | 0.94 |
ENST00000388901.5
ENST00000299259.6 |
COPS2
|
COP9 signalosome subunit 2 |
| chr17_-_62340581 | 0.91 |
ENST00000258991.3
ENST00000583738.1 ENST00000584379.1 |
TEX2
|
testis expressed 2 |
| chr14_+_59104741 | 0.91 |
ENST00000395153.3
ENST00000335867.4 |
DACT1
|
dishevelled-binding antagonist of beta-catenin 1 |
| chr4_-_39640700 | 0.90 |
ENST00000295958.5
|
SMIM14
|
small integral membrane protein 14 |
| chr2_-_200322723 | 0.90 |
ENST00000417098.1
|
SATB2
|
SATB homeobox 2 |
| chr17_-_19880992 | 0.89 |
ENST00000395536.3
ENST00000576896.1 ENST00000225737.6 |
AKAP10
|
A kinase (PRKA) anchor protein 10 |
| chr6_-_8064567 | 0.88 |
ENST00000543936.1
ENST00000397457.2 |
BLOC1S5
|
biogenesis of lysosomal organelles complex-1, subunit 5, muted |
| chr3_+_57261743 | 0.88 |
ENST00000288266.3
|
APPL1
|
adaptor protein, phosphotyrosine interaction, PH domain and leucine zipper containing 1 |
| chr1_-_177133818 | 0.86 |
ENST00000424564.2
ENST00000361833.2 |
ASTN1
|
astrotactin 1 |
| chr1_+_183605200 | 0.86 |
ENST00000304685.4
|
RGL1
|
ral guanine nucleotide dissociation stimulator-like 1 |
| chr10_+_112257596 | 0.82 |
ENST00000369583.3
|
DUSP5
|
dual specificity phosphatase 5 |
| chr20_-_4804244 | 0.81 |
ENST00000379400.3
|
RASSF2
|
Ras association (RalGDS/AF-6) domain family member 2 |
| chr20_+_24449821 | 0.80 |
ENST00000376862.3
|
SYNDIG1
|
synapse differentiation inducing 1 |
| chr14_+_62229075 | 0.80 |
ENST00000216294.4
|
SNAPC1
|
small nuclear RNA activating complex, polypeptide 1, 43kDa |
| chr2_+_207308220 | 0.79 |
ENST00000264377.3
|
ADAM23
|
ADAM metallopeptidase domain 23 |
| chr15_-_48937982 | 0.78 |
ENST00000316623.5
|
FBN1
|
fibrillin 1 |
| chr2_+_219081817 | 0.78 |
ENST00000315717.5
ENST00000420104.1 ENST00000295685.10 |
ARPC2
|
actin related protein 2/3 complex, subunit 2, 34kDa |
| chr6_-_82957433 | 0.78 |
ENST00000306270.7
|
IBTK
|
inhibitor of Bruton agammaglobulinemia tyrosine kinase |
| chr9_-_80646374 | 0.76 |
ENST00000286548.4
|
GNAQ
|
guanine nucleotide binding protein (G protein), q polypeptide |
| chr2_+_162480845 | 0.76 |
ENST00000375514.5
ENST00000415876.2 |
SLC4A10
|
solute carrier family 4, sodium bicarbonate transporter, member 10 |
| chr2_-_160472952 | 0.76 |
ENST00000541068.2
ENST00000355831.2 ENST00000343439.5 ENST00000392782.1 |
BAZ2B
|
bromodomain adjacent to zinc finger domain, 2B |
| chr1_-_67266939 | 0.74 |
ENST00000304526.2
|
INSL5
|
insulin-like 5 |
| chr9_-_14314066 | 0.74 |
ENST00000397575.3
|
NFIB
|
nuclear factor I/B |
| chr10_+_86088381 | 0.74 |
ENST00000224756.8
ENST00000372088.2 |
CCSER2
|
coiled-coil serine-rich protein 2 |
| chr4_+_48018781 | 0.73 |
ENST00000295461.5
|
NIPAL1
|
NIPA-like domain containing 1 |
| chr1_-_46598284 | 0.73 |
ENST00000423209.1
ENST00000262741.5 |
PIK3R3
|
phosphoinositide-3-kinase, regulatory subunit 3 (gamma) |
| chr6_-_132834184 | 0.73 |
ENST00000367941.2
ENST00000367937.4 |
STX7
|
syntaxin 7 |
| chr3_+_37284668 | 0.72 |
ENST00000361924.2
ENST00000444882.1 ENST00000356847.4 ENST00000450863.2 ENST00000429018.1 |
GOLGA4
|
golgin A4 |
| chr2_-_239197201 | 0.70 |
ENST00000254658.3
|
PER2
|
period circadian clock 2 |
| chr13_+_98794810 | 0.69 |
ENST00000595437.1
|
FARP1
|
FERM, RhoGEF (ARHGEF) and pleckstrin domain protein 1 (chondrocyte-derived) |
| chr10_-_62149433 | 0.69 |
ENST00000280772.2
|
ANK3
|
ankyrin 3, node of Ranvier (ankyrin G) |
| chr5_+_133861790 | 0.68 |
ENST00000395003.1
|
PHF15
|
jade family PHD finger 2 |
| chr11_+_22359562 | 0.68 |
ENST00000263160.3
|
SLC17A6
|
solute carrier family 17 (vesicular glutamate transporter), member 6 |
| chr4_+_2470664 | 0.67 |
ENST00000314289.8
ENST00000541204.1 ENST00000502316.1 ENST00000507247.1 ENST00000509258.1 ENST00000511859.1 |
RNF4
|
ring finger protein 4 |
| chr3_+_187930719 | 0.66 |
ENST00000312675.4
|
LPP
|
LIM domain containing preferred translocation partner in lipoma |
| chr2_+_198365122 | 0.66 |
ENST00000604458.1
|
HSPE1-MOB4
|
HSPE1-MOB4 readthrough |
| chr2_+_131862900 | 0.62 |
ENST00000438882.2
ENST00000538982.1 ENST00000404460.1 |
PLEKHB2
|
pleckstrin homology domain containing, family B (evectins) member 2 |
| chr9_+_4490394 | 0.62 |
ENST00000262352.3
|
SLC1A1
|
solute carrier family 1 (neuronal/epithelial high affinity glutamate transporter, system Xag), member 1 |
| chr11_+_64126614 | 0.61 |
ENST00000528057.1
ENST00000334205.4 ENST00000294261.4 |
RPS6KA4
|
ribosomal protein S6 kinase, 90kDa, polypeptide 4 |
| chr2_+_182756615 | 0.61 |
ENST00000431877.2
ENST00000320370.7 |
SSFA2
|
sperm specific antigen 2 |
| chr5_-_137090028 | 0.61 |
ENST00000314940.4
|
HNRNPA0
|
heterogeneous nuclear ribonucleoprotein A0 |
| chr16_-_70323422 | 0.60 |
ENST00000261772.8
|
AARS
|
alanyl-tRNA synthetase |
| chr6_-_99873145 | 0.60 |
ENST00000369239.5
ENST00000438806.1 |
PNISR
|
PNN-interacting serine/arginine-rich protein |
| chr2_+_24714729 | 0.60 |
ENST00000406961.1
ENST00000405141.1 |
NCOA1
|
nuclear receptor coactivator 1 |
| chr17_-_74236382 | 0.59 |
ENST00000592271.1
ENST00000319945.6 ENST00000269391.6 |
RNF157
|
ring finger protein 157 |
| chr11_-_67980744 | 0.58 |
ENST00000401547.2
ENST00000453170.1 ENST00000304363.4 |
SUV420H1
|
suppressor of variegation 4-20 homolog 1 (Drosophila) |
| chr1_-_153919128 | 0.58 |
ENST00000361217.4
|
DENND4B
|
DENN/MADD domain containing 4B |
| chr18_+_55711575 | 0.58 |
ENST00000356462.6
ENST00000400345.3 ENST00000589054.1 ENST00000256832.7 |
NEDD4L
|
neural precursor cell expressed, developmentally down-regulated 4-like, E3 ubiquitin protein ligase |
| chr5_-_179780312 | 0.58 |
ENST00000253778.8
|
GFPT2
|
glutamine-fructose-6-phosphate transaminase 2 |
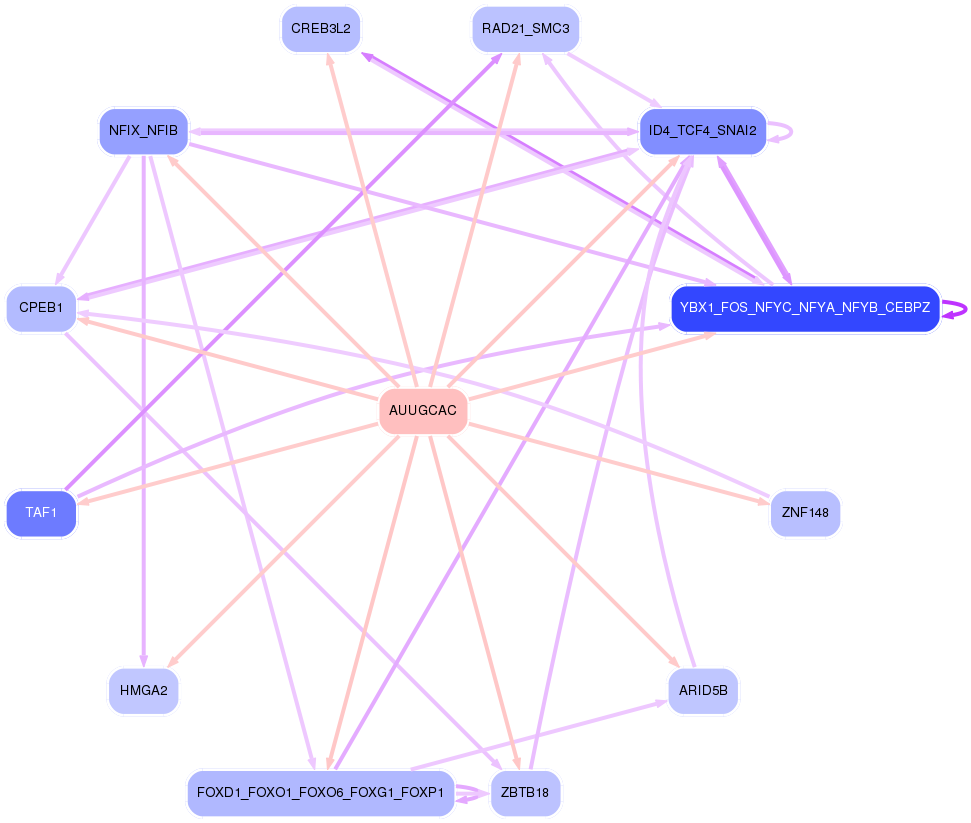
Network of associatons between targets according to the STRING database.

First level regulatory network of AUUGCAC
Gene Ontology Analysis
Gene overrepresentation in biological_process category:
| Log-likelihood per target | Total log-likelihood | Term | Description |
|---|---|---|---|
| 4.5 | 13.5 | GO:0033693 | neurofilament bundle assembly(GO:0033693) |
| 2.8 | 8.3 | GO:0098746 | fast, calcium ion-dependent exocytosis of neurotransmitter(GO:0098746) |
| 2.6 | 10.5 | GO:1990262 | regulation of anti-Mullerian hormone signaling pathway(GO:1902612) negative regulation of anti-Mullerian hormone signaling pathway(GO:1902613) anti-Mullerian hormone signaling pathway(GO:1990262) |
| 2.5 | 7.4 | GO:1904647 | response to rotenone(GO:1904647) |
| 2.1 | 6.4 | GO:0048170 | positive regulation of long-term neuronal synaptic plasticity(GO:0048170) |
| 2.0 | 8.0 | GO:0030644 | cellular chloride ion homeostasis(GO:0030644) |
| 1.5 | 4.6 | GO:0023016 | signal transduction by trans-phosphorylation(GO:0023016) |
| 1.4 | 4.1 | GO:1902955 | regulation of choline O-acetyltransferase activity(GO:1902769) positive regulation of choline O-acetyltransferase activity(GO:1902771) negative regulation of tau-protein kinase activity(GO:1902948) positive regulation of early endosome to recycling endosome transport(GO:1902955) negative regulation of aspartic-type endopeptidase activity involved in amyloid precursor protein catabolic process(GO:1902960) negative regulation of neurofibrillary tangle assembly(GO:1902997) negative regulation of aspartic-type peptidase activity(GO:1905246) |
| 1.3 | 4.0 | GO:1901899 | positive regulation of relaxation of cardiac muscle(GO:1901899) |
| 1.3 | 3.9 | GO:0072709 | cellular response to sorbitol(GO:0072709) |
| 1.1 | 4.6 | GO:0014054 | positive regulation of gamma-aminobutyric acid secretion(GO:0014054) |
| 1.1 | 4.2 | GO:0045715 | negative regulation of low-density lipoprotein particle receptor biosynthetic process(GO:0045715) |
| 1.0 | 3.0 | GO:0021718 | superior olivary nucleus development(GO:0021718) superior olivary nucleus maturation(GO:0021722) |
| 0.9 | 2.7 | GO:0035350 | FAD transport(GO:0015883) FAD transmembrane transport(GO:0035350) |
| 0.8 | 0.8 | GO:0097091 | synaptic vesicle clustering(GO:0097091) |
| 0.8 | 3.1 | GO:0043456 | regulation of pentose-phosphate shunt(GO:0043456) |
| 0.8 | 3.8 | GO:0019255 | glucose 1-phosphate metabolic process(GO:0019255) |
| 0.7 | 7.0 | GO:0016198 | axon choice point recognition(GO:0016198) |
| 0.7 | 2.0 | GO:0035948 | positive regulation of gluconeogenesis by positive regulation of transcription from RNA polymerase II promoter(GO:0035948) |
| 0.6 | 3.2 | GO:2000639 | regulation of SREBP signaling pathway(GO:2000638) negative regulation of SREBP signaling pathway(GO:2000639) |
| 0.6 | 1.3 | GO:0086092 | regulation of the force of heart contraction by cardiac conduction(GO:0086092) |
| 0.6 | 4.4 | GO:0033353 | S-adenosylmethionine cycle(GO:0033353) |
| 0.6 | 3.1 | GO:0018231 | peptidyl-L-cysteine S-palmitoylation(GO:0018230) peptidyl-S-diacylglycerol-L-cysteine biosynthetic process from peptidyl-cysteine(GO:0018231) |
| 0.6 | 2.9 | GO:2000301 | negative regulation of synaptic vesicle exocytosis(GO:2000301) |
| 0.6 | 2.3 | GO:0070358 | actin polymerization-dependent cell motility(GO:0070358) |
| 0.5 | 1.6 | GO:1903233 | regulation of calcium ion-dependent exocytosis of neurotransmitter(GO:1903233) calcium ion import into sarcoplasmic reticulum(GO:1990036) |
| 0.5 | 3.7 | GO:2000124 | regulation of endocannabinoid signaling pathway(GO:2000124) |
| 0.5 | 9.4 | GO:0061339 | establishment of monopolar cell polarity(GO:0061162) establishment or maintenance of monopolar cell polarity(GO:0061339) |
| 0.5 | 3.0 | GO:0048549 | positive regulation of pinocytosis(GO:0048549) |
| 0.5 | 2.5 | GO:0097338 | response to clozapine(GO:0097338) |
| 0.5 | 3.0 | GO:0010724 | regulation of definitive erythrocyte differentiation(GO:0010724) |
| 0.5 | 1.5 | GO:0098937 | dendritic transport(GO:0098935) anterograde dendritic transport(GO:0098937) |
| 0.5 | 2.4 | GO:0050882 | voluntary musculoskeletal movement(GO:0050882) |
| 0.4 | 2.4 | GO:1903960 | regulation of plasma membrane long-chain fatty acid transport(GO:0010746) negative regulation of plasma membrane long-chain fatty acid transport(GO:0010748) negative regulation of anion transmembrane transport(GO:1903960) |
| 0.4 | 2.9 | GO:0006013 | mannose metabolic process(GO:0006013) |
| 0.4 | 2.5 | GO:0045048 | protein insertion into ER membrane(GO:0045048) |
| 0.4 | 1.4 | GO:0033387 | putrescine biosynthetic process from ornithine(GO:0033387) |
| 0.3 | 1.4 | GO:1903224 | regulation of endodermal cell differentiation(GO:1903224) |
| 0.3 | 4.5 | GO:0014820 | tonic smooth muscle contraction(GO:0014820) |
| 0.3 | 1.6 | GO:0035617 | stress granule disassembly(GO:0035617) |
| 0.3 | 1.3 | GO:1904978 | regulation of endosome organization(GO:1904978) |
| 0.3 | 1.5 | GO:0021590 | cerebellum maturation(GO:0021590) cerebellar cortex maturation(GO:0021699) |
| 0.3 | 1.8 | GO:0034626 | fatty acid elongation, saturated fatty acid(GO:0019367) fatty acid elongation, unsaturated fatty acid(GO:0019368) fatty acid elongation, monounsaturated fatty acid(GO:0034625) fatty acid elongation, polyunsaturated fatty acid(GO:0034626) |
| 0.3 | 2.7 | GO:0045722 | positive regulation of gluconeogenesis(GO:0045722) |
| 0.3 | 2.3 | GO:0042985 | negative regulation of amyloid precursor protein biosynthetic process(GO:0042985) |
| 0.3 | 1.2 | GO:0045875 | negative regulation of sister chromatid cohesion(GO:0045875) |
| 0.3 | 2.3 | GO:0099566 | regulation of postsynaptic cytosolic calcium ion concentration(GO:0099566) |
| 0.3 | 1.1 | GO:0019046 | release from viral latency(GO:0019046) |
| 0.3 | 1.6 | GO:0051661 | maintenance of centrosome location(GO:0051661) |
| 0.3 | 1.3 | GO:0035063 | nuclear speck organization(GO:0035063) |
| 0.3 | 4.8 | GO:0089711 | L-glutamate transmembrane transport(GO:0089711) |
| 0.2 | 5.2 | GO:0001921 | positive regulation of receptor recycling(GO:0001921) |
| 0.2 | 8.4 | GO:0051491 | positive regulation of filopodium assembly(GO:0051491) |
| 0.2 | 1.8 | GO:0090043 | regulation of tubulin deacetylation(GO:0090043) |
| 0.2 | 1.7 | GO:2000189 | positive regulation of cholesterol homeostasis(GO:2000189) |
| 0.2 | 3.0 | GO:0010839 | negative regulation of keratinocyte proliferation(GO:0010839) |
| 0.2 | 0.6 | GO:0006419 | alanyl-tRNA aminoacylation(GO:0006419) |
| 0.2 | 1.8 | GO:0071286 | cellular response to magnesium ion(GO:0071286) |
| 0.2 | 0.6 | GO:0045925 | positive regulation of female receptivity(GO:0045925) |
| 0.2 | 0.8 | GO:0042796 | snRNA transcription from RNA polymerase III promoter(GO:0042796) |
| 0.2 | 4.4 | GO:0034389 | lipid particle organization(GO:0034389) |
| 0.2 | 1.0 | GO:0051029 | rRNA transport(GO:0051029) |
| 0.2 | 1.2 | GO:0045876 | positive regulation of sister chromatid cohesion(GO:0045876) |
| 0.2 | 0.7 | GO:2000253 | positive regulation of feeding behavior(GO:2000253) |
| 0.2 | 0.6 | GO:0016344 | meiotic chromosome movement towards spindle pole(GO:0016344) |
| 0.2 | 0.5 | GO:0090611 | ubiquitin-independent protein catabolic process via the multivesicular body sorting pathway(GO:0090611) negative regulation of exosomal secretion(GO:1903542) regulation of centriole elongation(GO:1903722) |
| 0.2 | 3.4 | GO:0006012 | galactose metabolic process(GO:0006012) |
| 0.2 | 1.1 | GO:0018095 | protein polyglutamylation(GO:0018095) |
| 0.2 | 2.6 | GO:0051386 | regulation of neurotrophin TRK receptor signaling pathway(GO:0051386) |
| 0.2 | 1.5 | GO:0072383 | plus-end-directed vesicle transport along microtubule(GO:0072383) |
| 0.2 | 0.7 | GO:0090234 | regulation of kinetochore assembly(GO:0090234) |
| 0.2 | 1.5 | GO:0098814 | spontaneous neurotransmitter secretion(GO:0061669) spontaneous synaptic transmission(GO:0098814) |
| 0.2 | 0.9 | GO:0009191 | ribonucleoside diphosphate catabolic process(GO:0009191) |
| 0.2 | 0.8 | GO:0035582 | sequestering of BMP in extracellular matrix(GO:0035582) |
| 0.2 | 0.9 | GO:1900107 | embryonic hindgut morphogenesis(GO:0048619) regulation of nodal signaling pathway(GO:1900107) |
| 0.1 | 3.1 | GO:0019800 | peptide cross-linking via chondroitin 4-sulfate glycosaminoglycan(GO:0019800) |
| 0.1 | 0.7 | GO:1902473 | regulation of protein localization to synapse(GO:1902473) |
| 0.1 | 0.6 | GO:0042986 | positive regulation of amyloid precursor protein biosynthetic process(GO:0042986) |
| 0.1 | 0.7 | GO:0051941 | regulation of amino acid uptake involved in synaptic transmission(GO:0051941) regulation of glutamate uptake involved in transmission of nerve impulse(GO:0051946) regulation of L-glutamate import(GO:1900920) |
| 0.1 | 3.5 | GO:0090383 | phagosome acidification(GO:0090383) |
| 0.1 | 1.6 | GO:0070070 | proton-transporting V-type ATPase complex assembly(GO:0070070) vacuolar proton-transporting V-type ATPase complex assembly(GO:0070072) |
| 0.1 | 1.5 | GO:2001224 | positive regulation of neuron migration(GO:2001224) |
| 0.1 | 1.8 | GO:0051683 | establishment of Golgi localization(GO:0051683) Golgi reassembly(GO:0090168) |
| 0.1 | 0.6 | GO:0043988 | histone H3-S28 phosphorylation(GO:0043988) |
| 0.1 | 1.2 | GO:1901409 | positive regulation of phosphorylation of RNA polymerase II C-terminal domain(GO:1901409) |
| 0.1 | 0.6 | GO:2001288 | positive regulation of caveolin-mediated endocytosis(GO:2001288) |
| 0.1 | 0.3 | GO:1990519 | pyrimidine nucleotide transport(GO:0006864) mitochondrial pyrimidine nucleotide import(GO:1990519) |
| 0.1 | 0.7 | GO:0021740 | trigeminal sensory nucleus development(GO:0021730) principal sensory nucleus of trigeminal nerve development(GO:0021740) negative regulation of epithelial cell proliferation involved in lung morphogenesis(GO:2000795) |
| 0.1 | 0.3 | GO:0031052 | mesodermal-endodermal cell signaling(GO:0003131) programmed DNA elimination(GO:0031049) chromosome breakage(GO:0031052) histone H2A-S139 phosphorylation(GO:0035978) histone H2A phosphorylation(GO:1990164) positive regulation of cellular response to X-ray(GO:2000685) |
| 0.1 | 0.3 | GO:0002904 | positive regulation of B cell apoptotic process(GO:0002904) |
| 0.1 | 6.8 | GO:0051865 | protein autoubiquitination(GO:0051865) |
| 0.1 | 0.4 | GO:0006542 | glutamine biosynthetic process(GO:0006542) |
| 0.1 | 3.4 | GO:2000785 | regulation of autophagosome assembly(GO:2000785) |
| 0.1 | 1.5 | GO:2000480 | negative regulation of cAMP-dependent protein kinase activity(GO:2000480) |
| 0.1 | 0.6 | GO:0032483 | regulation of Rab protein signal transduction(GO:0032483) |
| 0.1 | 1.6 | GO:0050932 | regulation of pigment cell differentiation(GO:0050932) |
| 0.1 | 0.4 | GO:1990167 | protein K27-linked deubiquitination(GO:1990167) |
| 0.1 | 0.3 | GO:0043983 | histone H4-K12 acetylation(GO:0043983) response to actinomycin D(GO:0072716) |
| 0.1 | 0.7 | GO:0015693 | magnesium ion transport(GO:0015693) |
| 0.1 | 0.8 | GO:1901223 | negative regulation of NIK/NF-kappaB signaling(GO:1901223) |
| 0.1 | 1.2 | GO:0000098 | sulfur amino acid catabolic process(GO:0000098) |
| 0.1 | 0.3 | GO:0010693 | apoptotic process involved in outflow tract morphogenesis(GO:0003275) negative regulation of alkaline phosphatase activity(GO:0010693) positive regulation of catagen(GO:0051795) regulation of apoptotic process involved in outflow tract morphogenesis(GO:1902256) |
| 0.1 | 0.2 | GO:0036369 | transcription factor catabolic process(GO:0036369) |
| 0.1 | 1.5 | GO:0007253 | cytoplasmic sequestering of NF-kappaB(GO:0007253) |
| 0.1 | 0.6 | GO:0035331 | negative regulation of hippo signaling(GO:0035331) |
| 0.1 | 4.6 | GO:0090102 | cochlea development(GO:0090102) |
| 0.1 | 0.5 | GO:0016557 | peroxisome membrane biogenesis(GO:0016557) |
| 0.1 | 1.2 | GO:0016075 | rRNA catabolic process(GO:0016075) |
| 0.1 | 1.6 | GO:0051770 | positive regulation of nitric-oxide synthase biosynthetic process(GO:0051770) |
| 0.1 | 0.4 | GO:0007340 | acrosome reaction(GO:0007340) |
| 0.1 | 0.2 | GO:0090283 | regulation of protein glycosylation in Golgi(GO:0090283) |
| 0.1 | 1.9 | GO:0000460 | maturation of 5.8S rRNA(GO:0000460) |
| 0.1 | 0.4 | GO:0009048 | dosage compensation by inactivation of X chromosome(GO:0009048) |
| 0.1 | 3.5 | GO:0035418 | protein localization to synapse(GO:0035418) |
| 0.1 | 0.9 | GO:0000338 | protein deneddylation(GO:0000338) |
| 0.1 | 0.6 | GO:0006002 | fructose 6-phosphate metabolic process(GO:0006002) |
| 0.1 | 0.2 | GO:1904386 | response to thyroxine(GO:0097068) response to L-phenylalanine derivative(GO:1904386) |
| 0.1 | 1.4 | GO:0048488 | synaptic vesicle endocytosis(GO:0048488) |
| 0.1 | 1.8 | GO:0016577 | histone demethylation(GO:0016577) |
| 0.1 | 0.1 | GO:0035720 | intraciliary anterograde transport(GO:0035720) |
| 0.1 | 0.4 | GO:1900045 | negative regulation of histone ubiquitination(GO:0033183) histone H2A K63-linked ubiquitination(GO:0070535) negative regulation of protein K63-linked ubiquitination(GO:1900045) regulation of histone H2A K63-linked ubiquitination(GO:1901314) negative regulation of histone H2A K63-linked ubiquitination(GO:1901315) negative regulation of protein polyubiquitination(GO:1902915) |
| 0.1 | 1.1 | GO:0048665 | neuron fate specification(GO:0048665) |
| 0.1 | 2.1 | GO:0061512 | protein localization to cilium(GO:0061512) |
| 0.1 | 0.9 | GO:0007158 | neuron cell-cell adhesion(GO:0007158) |
| 0.0 | 1.9 | GO:0006661 | phosphatidylinositol biosynthetic process(GO:0006661) |
| 0.0 | 0.9 | GO:0010510 | regulation of acetyl-CoA biosynthetic process from pyruvate(GO:0010510) regulation of acyl-CoA biosynthetic process(GO:0050812) |
| 0.0 | 0.4 | GO:0016559 | peroxisome fission(GO:0016559) |
| 0.0 | 1.3 | GO:1903206 | negative regulation of hydrogen peroxide-induced cell death(GO:1903206) |
| 0.0 | 0.4 | GO:0060235 | lens induction in camera-type eye(GO:0060235) |
| 0.0 | 0.3 | GO:0030643 | cellular phosphate ion homeostasis(GO:0030643) cellular trivalent inorganic anion homeostasis(GO:0072502) |
| 0.0 | 1.7 | GO:0000188 | inactivation of MAPK activity(GO:0000188) |
| 0.0 | 6.8 | GO:0090002 | establishment of protein localization to plasma membrane(GO:0090002) |
| 0.0 | 0.3 | GO:0090382 | phagosome maturation(GO:0090382) |
| 0.0 | 0.1 | GO:1902746 | regulation of lens fiber cell differentiation(GO:1902746) |
| 0.0 | 1.6 | GO:0007029 | endoplasmic reticulum organization(GO:0007029) |
| 0.0 | 0.7 | GO:2001275 | positive regulation of glucose import in response to insulin stimulus(GO:2001275) |
| 0.0 | 0.8 | GO:0061099 | negative regulation of protein tyrosine kinase activity(GO:0061099) |
| 0.0 | 1.5 | GO:0007339 | binding of sperm to zona pellucida(GO:0007339) |
| 0.0 | 1.5 | GO:0006509 | membrane protein ectodomain proteolysis(GO:0006509) |
| 0.0 | 1.9 | GO:0000381 | regulation of alternative mRNA splicing, via spliceosome(GO:0000381) |
| 0.0 | 0.3 | GO:0006903 | vesicle targeting(GO:0006903) |
| 0.0 | 0.8 | GO:0022011 | myelination in peripheral nervous system(GO:0022011) peripheral nervous system axon ensheathment(GO:0032292) |
| 0.0 | 0.2 | GO:0090154 | positive regulation of sphingolipid biosynthetic process(GO:0090154) positive regulation of ceramide biosynthetic process(GO:2000304) |
| 0.0 | 1.6 | GO:0019835 | cytolysis(GO:0019835) |
| 0.0 | 0.9 | GO:0002076 | osteoblast development(GO:0002076) |
| 0.0 | 0.3 | GO:0061635 | regulation of protein complex stability(GO:0061635) |
| 0.0 | 2.0 | GO:0006890 | retrograde vesicle-mediated transport, Golgi to ER(GO:0006890) |
| 0.0 | 0.6 | GO:0070935 | 3'-UTR-mediated mRNA stabilization(GO:0070935) |
| 0.0 | 0.5 | GO:0048147 | negative regulation of fibroblast proliferation(GO:0048147) |
| 0.0 | 0.1 | GO:2000417 | negative regulation of eosinophil migration(GO:2000417) |
| 0.0 | 0.6 | GO:0006458 | 'de novo' protein folding(GO:0006458) |
| 0.0 | 0.1 | GO:0060613 | fat pad development(GO:0060613) |
| 0.0 | 0.2 | GO:1902373 | negative regulation of mRNA catabolic process(GO:1902373) |
| 0.0 | 0.0 | GO:0061386 | closure of optic fissure(GO:0061386) |
| 0.0 | 1.1 | GO:0015914 | phospholipid transport(GO:0015914) |
| 0.0 | 0.4 | GO:0015937 | coenzyme A biosynthetic process(GO:0015937) |
| 0.0 | 3.3 | GO:0042594 | response to starvation(GO:0042594) |
| 0.0 | 0.5 | GO:0007020 | microtubule nucleation(GO:0007020) |
| 0.0 | 1.1 | GO:0030433 | ER-associated ubiquitin-dependent protein catabolic process(GO:0030433) |
| 0.0 | 0.2 | GO:1904896 | ESCRT complex disassembly(GO:1904896) ESCRT III complex disassembly(GO:1904903) |
| 0.0 | 3.5 | GO:0007266 | Rho protein signal transduction(GO:0007266) |
| 0.0 | 0.3 | GO:0030252 | growth hormone secretion(GO:0030252) |
| 0.0 | 0.3 | GO:0032012 | ARF protein signal transduction(GO:0032011) regulation of ARF protein signal transduction(GO:0032012) |
| 0.0 | 0.0 | GO:0097498 | endothelial tube lumen extension(GO:0097498) |
| 0.0 | 0.2 | GO:0034453 | microtubule anchoring(GO:0034453) |
| 0.0 | 1.1 | GO:0006672 | ceramide metabolic process(GO:0006672) |
| 0.0 | 0.4 | GO:0070534 | protein K63-linked ubiquitination(GO:0070534) |
| 0.0 | 0.3 | GO:0036152 | phosphatidylethanolamine acyl-chain remodeling(GO:0036152) |
| 0.0 | 0.8 | GO:0015701 | bicarbonate transport(GO:0015701) |
| 0.0 | 3.1 | GO:0006457 | protein folding(GO:0006457) |
| 0.0 | 0.7 | GO:0001578 | microtubule bundle formation(GO:0001578) |
| 0.0 | 0.2 | GO:0070588 | calcium ion transmembrane transport(GO:0070588) |
| 0.0 | 0.9 | GO:0006665 | sphingolipid metabolic process(GO:0006665) |
| 0.0 | 0.3 | GO:0043496 | regulation of protein homodimerization activity(GO:0043496) |
| 0.0 | 0.1 | GO:0010592 | positive regulation of lamellipodium assembly(GO:0010592) |
| 0.0 | 0.8 | GO:0031338 | regulation of vesicle fusion(GO:0031338) |
| 0.0 | 0.2 | GO:0006610 | ribosomal protein import into nucleus(GO:0006610) |
| 0.0 | 0.0 | GO:0035330 | regulation of hippo signaling(GO:0035330) |
Gene overrepresentation in cellular_component category:
| Log-likelihood per target | Total log-likelihood | Term | Description |
|---|---|---|---|
| 1.7 | 8.3 | GO:0060201 | clathrin-sculpted acetylcholine transport vesicle(GO:0060200) clathrin-sculpted acetylcholine transport vesicle membrane(GO:0060201) |
| 1.4 | 4.2 | GO:0034686 | integrin alphav-beta6 complex(GO:0034685) integrin alphav-beta8 complex(GO:0034686) |
| 0.9 | 13.2 | GO:0005883 | neurofilament(GO:0005883) |
| 0.8 | 5.7 | GO:0032584 | growth cone membrane(GO:0032584) |
| 0.8 | 2.4 | GO:0019034 | viral replication complex(GO:0019034) |
| 0.7 | 3.0 | GO:0016533 | cyclin-dependent protein kinase 5 holoenzyme complex(GO:0016533) |
| 0.7 | 2.9 | GO:0005797 | Golgi medial cisterna(GO:0005797) |
| 0.6 | 11.5 | GO:0044295 | axonal growth cone(GO:0044295) |
| 0.5 | 1.6 | GO:0043291 | RAVE complex(GO:0043291) |
| 0.5 | 1.5 | GO:0005873 | plus-end kinesin complex(GO:0005873) |
| 0.5 | 5.7 | GO:0060077 | inhibitory synapse(GO:0060077) |
| 0.5 | 2.3 | GO:0042272 | nuclear RNA export factor complex(GO:0042272) |
| 0.5 | 3.2 | GO:1990452 | Parkin-FBXW7-Cul1 ubiquitin ligase complex(GO:1990452) |
| 0.5 | 1.4 | GO:0005588 | collagen type V trimer(GO:0005588) |
| 0.5 | 2.3 | GO:0044308 | axonal spine(GO:0044308) |
| 0.4 | 3.1 | GO:0002178 | palmitoyltransferase complex(GO:0002178) |
| 0.4 | 1.2 | GO:0090498 | extrinsic component of Golgi membrane(GO:0090498) |
| 0.4 | 0.8 | GO:0097442 | CA3 pyramidal cell dendrite(GO:0097442) |
| 0.4 | 4.1 | GO:0005641 | nuclear envelope lumen(GO:0005641) |
| 0.3 | 1.9 | GO:0070545 | PeBoW complex(GO:0070545) |
| 0.3 | 1.2 | GO:0000798 | nuclear cohesin complex(GO:0000798) |
| 0.3 | 4.0 | GO:0042583 | chromaffin granule(GO:0042583) |
| 0.3 | 16.4 | GO:0043198 | dendritic shaft(GO:0043198) |
| 0.3 | 3.5 | GO:0033180 | proton-transporting V-type ATPase, V1 domain(GO:0033180) |
| 0.3 | 2.4 | GO:0005955 | calcineurin complex(GO:0005955) |
| 0.3 | 0.8 | GO:0036195 | muscle cell projection(GO:0036194) muscle cell projection membrane(GO:0036195) |
| 0.3 | 3.0 | GO:0033643 | host cell part(GO:0033643) |
| 0.2 | 1.0 | GO:0033596 | TSC1-TSC2 complex(GO:0033596) |
| 0.2 | 0.9 | GO:0031166 | integral component of vacuolar membrane(GO:0031166) |
| 0.2 | 2.0 | GO:0000125 | PCAF complex(GO:0000125) |
| 0.2 | 0.2 | GO:0030014 | CCR4-NOT complex(GO:0030014) |
| 0.2 | 9.9 | GO:1904115 | axon cytoplasm(GO:1904115) |
| 0.2 | 2.3 | GO:0017146 | NMDA selective glutamate receptor complex(GO:0017146) |
| 0.2 | 5.1 | GO:0032839 | dendrite cytoplasm(GO:0032839) |
| 0.2 | 7.0 | GO:0048786 | presynaptic active zone(GO:0048786) |
| 0.1 | 15.0 | GO:0001750 | photoreceptor outer segment(GO:0001750) |
| 0.1 | 1.6 | GO:0097470 | ribbon synapse(GO:0097470) |
| 0.1 | 0.7 | GO:0044300 | cerebellar mossy fiber(GO:0044300) |
| 0.1 | 0.3 | GO:0005879 | axonemal microtubule(GO:0005879) |
| 0.1 | 0.3 | GO:1903349 | omegasome membrane(GO:1903349) |
| 0.1 | 1.2 | GO:0031618 | nuclear pericentric heterochromatin(GO:0031618) |
| 0.1 | 1.5 | GO:0005952 | cAMP-dependent protein kinase complex(GO:0005952) |
| 0.1 | 1.4 | GO:0001891 | phagocytic cup(GO:0001891) |
| 0.1 | 2.5 | GO:0030173 | integral component of Golgi membrane(GO:0030173) |
| 0.1 | 2.1 | GO:0005868 | cytoplasmic dynein complex(GO:0005868) |
| 0.1 | 3.5 | GO:0045171 | intercellular bridge(GO:0045171) |
| 0.1 | 0.5 | GO:0005875 | microtubule associated complex(GO:0005875) |
| 0.1 | 2.0 | GO:0080008 | Cul4-RING E3 ubiquitin ligase complex(GO:0080008) |
| 0.1 | 4.3 | GO:0097610 | cleavage furrow(GO:0032154) cell surface furrow(GO:0097610) |
| 0.1 | 1.8 | GO:0031092 | platelet alpha granule membrane(GO:0031092) |
| 0.1 | 2.3 | GO:0030660 | Golgi-associated vesicle membrane(GO:0030660) |
| 0.1 | 2.1 | GO:0016592 | mediator complex(GO:0016592) |
| 0.1 | 1.2 | GO:0030119 | AP-type membrane coat adaptor complex(GO:0030119) |
| 0.1 | 8.5 | GO:0055037 | recycling endosome(GO:0055037) |
| 0.1 | 0.3 | GO:1990425 | ryanodine receptor complex(GO:1990425) |
| 0.1 | 3.7 | GO:0030134 | ER to Golgi transport vesicle(GO:0030134) |
| 0.1 | 1.3 | GO:0030132 | clathrin coat of coated pit(GO:0030132) |
| 0.1 | 0.5 | GO:0016593 | Cdc73/Paf1 complex(GO:0016593) |
| 0.1 | 0.7 | GO:0030877 | beta-catenin destruction complex(GO:0030877) |
| 0.1 | 0.2 | GO:0000815 | ESCRT III complex(GO:0000815) |
| 0.0 | 5.6 | GO:0044306 | neuron projection terminus(GO:0044306) |
| 0.0 | 3.7 | GO:0030665 | clathrin-coated vesicle membrane(GO:0030665) |
| 0.0 | 4.4 | GO:0031902 | late endosome membrane(GO:0031902) |
| 0.0 | 1.3 | GO:0090533 | cation-transporting ATPase complex(GO:0090533) |
| 0.0 | 1.8 | GO:0033116 | endoplasmic reticulum-Golgi intermediate compartment membrane(GO:0033116) |
| 0.0 | 5.0 | GO:0030427 | site of polarized growth(GO:0030427) |
| 0.0 | 0.4 | GO:0045254 | pyruvate dehydrogenase complex(GO:0045254) |
| 0.0 | 0.6 | GO:0005885 | Arp2/3 protein complex(GO:0005885) |
| 0.0 | 0.7 | GO:0014731 | spectrin-associated cytoskeleton(GO:0014731) |
| 0.0 | 2.4 | GO:0005791 | rough endoplasmic reticulum(GO:0005791) |
| 0.0 | 0.9 | GO:0090545 | NuRD complex(GO:0016581) CHD-type complex(GO:0090545) |
| 0.0 | 0.3 | GO:0035985 | senescence-associated heterochromatin focus(GO:0035985) |
| 0.0 | 1.2 | GO:0033017 | sarcoplasmic reticulum membrane(GO:0033017) |
| 0.0 | 4.0 | GO:0000922 | spindle pole(GO:0000922) |
| 0.0 | 0.2 | GO:0031519 | PcG protein complex(GO:0031519) |
| 0.0 | 0.9 | GO:0030136 | clathrin-coated vesicle(GO:0030136) |
| 0.0 | 0.9 | GO:0008180 | COP9 signalosome(GO:0008180) |
| 0.0 | 6.3 | GO:0019898 | extrinsic component of membrane(GO:0019898) |
| 0.0 | 2.3 | GO:0005578 | proteinaceous extracellular matrix(GO:0005578) |
| 0.0 | 0.5 | GO:0005779 | integral component of peroxisomal membrane(GO:0005779) intrinsic component of peroxisomal membrane(GO:0031231) |
| 0.0 | 0.6 | GO:0005771 | multivesicular body(GO:0005771) |
| 0.0 | 0.6 | GO:0005884 | actin filament(GO:0005884) |
| 0.0 | 1.3 | GO:0000777 | condensed chromosome kinetochore(GO:0000777) |
| 0.0 | 1.8 | GO:0042470 | melanosome(GO:0042470) pigment granule(GO:0048770) |
| 0.0 | 1.2 | GO:0032580 | Golgi cisterna membrane(GO:0032580) |
| 0.0 | 1.2 | GO:0036126 | sperm flagellum(GO:0036126) |
| 0.0 | 0.7 | GO:0030672 | synaptic vesicle membrane(GO:0030672) exocytic vesicle membrane(GO:0099501) |
| 0.0 | 4.3 | GO:0005788 | endoplasmic reticulum lumen(GO:0005788) |
| 0.0 | 1.2 | GO:0030863 | cortical cytoskeleton(GO:0030863) |
| 0.0 | 1.0 | GO:0005814 | centriole(GO:0005814) |
| 0.0 | 2.6 | GO:0005929 | cilium(GO:0005929) |
| 0.0 | 0.5 | GO:0045335 | phagocytic vesicle(GO:0045335) |
| 0.0 | 0.3 | GO:0005876 | spindle microtubule(GO:0005876) |
| 0.0 | 0.7 | GO:0048471 | perinuclear region of cytoplasm(GO:0048471) |
Gene overrepresentation in molecular_function category:
| Log-likelihood per target | Total log-likelihood | Term | Description |
|---|---|---|---|
| 2.2 | 6.7 | GO:0032184 | SUMO polymer binding(GO:0032184) |
| 1.7 | 8.3 | GO:0030348 | syntaxin-3 binding(GO:0030348) |
| 1.6 | 6.4 | GO:0005105 | type 1 fibroblast growth factor receptor binding(GO:0005105) |
| 1.3 | 3.8 | GO:0003983 | UTP:glucose-1-phosphate uridylyltransferase activity(GO:0003983) UTP-monosaccharide-1-phosphate uridylyltransferase activity(GO:0051748) |
| 1.0 | 3.0 | GO:0016534 | cyclin-dependent protein kinase 5 activator activity(GO:0016534) |
| 0.9 | 4.7 | GO:0034046 | poly(G) binding(GO:0034046) |
| 0.9 | 2.7 | GO:0015230 | FAD transmembrane transporter activity(GO:0015230) |
| 0.9 | 4.5 | GO:0004687 | myosin light chain kinase activity(GO:0004687) |
| 0.8 | 4.2 | GO:1990430 | extracellular matrix protein binding(GO:1990430) |
| 0.8 | 3.1 | GO:0004619 | bisphosphoglycerate mutase activity(GO:0004082) phosphoglycerate mutase activity(GO:0004619) 2,3-bisphosphoglycerate-dependent phosphoglycerate mutase activity(GO:0046538) |
| 0.8 | 4.6 | GO:0005332 | gamma-aminobutyric acid:sodium symporter activity(GO:0005332) gamma-aminobutyric acid transmembrane transporter activity(GO:0015185) |
| 0.7 | 1.5 | GO:0000285 | 1-phosphatidylinositol-3-phosphate 5-kinase activity(GO:0000285) |
| 0.7 | 4.4 | GO:0016802 | adenosylhomocysteinase activity(GO:0004013) trialkylsulfonium hydrolase activity(GO:0016802) |
| 0.7 | 8.0 | GO:0015379 | potassium:chloride symporter activity(GO:0015379) potassium ion symporter activity(GO:0022820) |
| 0.7 | 3.5 | GO:0005294 | neutral L-amino acid secondary active transmembrane transporter activity(GO:0005294) |
| 0.6 | 2.4 | GO:0005220 | inositol 1,4,5-trisphosphate-sensitive calcium-release channel activity(GO:0005220) |
| 0.6 | 5.7 | GO:0035727 | lysophosphatidic acid binding(GO:0035727) |
| 0.5 | 3.4 | GO:0001517 | N-acetylglucosamine 6-O-sulfotransferase activity(GO:0001517) |
| 0.5 | 0.9 | GO:0070097 | delta-catenin binding(GO:0070097) |
| 0.4 | 1.6 | GO:0099609 | microtubule lateral binding(GO:0099609) |
| 0.4 | 3.2 | GO:0050816 | phosphothreonine binding(GO:0050816) |
| 0.4 | 2.0 | GO:0004468 | lysine N-acetyltransferase activity, acting on acetyl phosphate as donor(GO:0004468) |
| 0.4 | 1.2 | GO:0015616 | DNA translocase activity(GO:0015616) |
| 0.4 | 1.9 | GO:0016308 | 1-phosphatidylinositol-4-phosphate 5-kinase activity(GO:0016308) |
| 0.4 | 1.8 | GO:0008273 | calcium, potassium:sodium antiporter activity(GO:0008273) |
| 0.4 | 4.7 | GO:0052629 | phosphatidylinositol-3,5-bisphosphate 3-phosphatase activity(GO:0052629) |
| 0.4 | 1.1 | GO:0016309 | 1-phosphatidylinositol-5-phosphate 4-kinase activity(GO:0016309) |
| 0.3 | 1.8 | GO:0102337 | fatty acid elongase activity(GO:0009922) 3-oxo-arachidoyl-CoA synthase activity(GO:0102336) 3-oxo-cerotoyl-CoA synthase activity(GO:0102337) 3-oxo-lignoceronyl-CoA synthase activity(GO:0102338) |
| 0.3 | 1.2 | GO:0048763 | calcium-induced calcium release activity(GO:0048763) |
| 0.3 | 0.9 | GO:0008321 | Ral guanyl-nucleotide exchange factor activity(GO:0008321) |
| 0.3 | 3.7 | GO:0047372 | acylglycerol lipase activity(GO:0047372) |
| 0.3 | 2.3 | GO:0099583 | neurotransmitter receptor activity involved in regulation of postsynaptic membrane potential(GO:0099529) neurotransmitter receptor activity involved in regulation of postsynaptic cytosolic calcium ion concentration(GO:0099583) transmitter-gated ion channel activity involved in regulation of postsynaptic membrane potential(GO:1904315) |
| 0.3 | 4.1 | GO:0030306 | ADP-ribosylation factor binding(GO:0030306) |
| 0.2 | 3.0 | GO:0001087 | transcription factor activity, sequence-specific DNA binding, RNA polymerase recruiting(GO:0001011) transcription factor activity, TFIIB-class binding(GO:0001087) |
| 0.2 | 1.4 | GO:0008046 | axon guidance receptor activity(GO:0008046) |
| 0.2 | 4.8 | GO:0017075 | syntaxin-1 binding(GO:0017075) |
| 0.2 | 2.5 | GO:0016413 | O-acetyltransferase activity(GO:0016413) |
| 0.2 | 1.1 | GO:0070740 | tubulin-glutamic acid ligase activity(GO:0070740) |
| 0.2 | 12.1 | GO:0019894 | kinesin binding(GO:0019894) |
| 0.2 | 1.6 | GO:0034452 | dynactin binding(GO:0034452) |
| 0.2 | 1.4 | GO:0042978 | ornithine decarboxylase activator activity(GO:0042978) |
| 0.2 | 0.6 | GO:0004813 | alanine-tRNA ligase activity(GO:0004813) |
| 0.2 | 3.0 | GO:0032036 | myosin heavy chain binding(GO:0032036) |
| 0.2 | 4.0 | GO:0008603 | cAMP-dependent protein kinase inhibitor activity(GO:0004862) cAMP-dependent protein kinase regulator activity(GO:0008603) |
| 0.2 | 1.4 | GO:0001727 | lipid kinase activity(GO:0001727) |
| 0.2 | 3.7 | GO:0031435 | mitogen-activated protein kinase kinase kinase binding(GO:0031435) |
| 0.2 | 0.8 | GO:0030292 | protein tyrosine kinase inhibitor activity(GO:0030292) |
| 0.2 | 4.4 | GO:0004806 | triglyceride lipase activity(GO:0004806) |
| 0.2 | 1.5 | GO:0008526 | phosphatidylinositol transporter activity(GO:0008526) |
| 0.1 | 0.9 | GO:0043422 | protein kinase B binding(GO:0043422) |
| 0.1 | 1.2 | GO:0051880 | G-quadruplex DNA binding(GO:0051880) |
| 0.1 | 3.2 | GO:0008239 | dipeptidyl-peptidase activity(GO:0008239) |
| 0.1 | 2.1 | GO:0019706 | protein-cysteine S-palmitoyltransferase activity(GO:0019706) protein-cysteine S-acyltransferase activity(GO:0019707) |
| 0.1 | 0.8 | GO:0031826 | type 2A serotonin receptor binding(GO:0031826) |
| 0.1 | 3.5 | GO:0046961 | proton-transporting ATPase activity, rotational mechanism(GO:0046961) |
| 0.1 | 3.1 | GO:0008191 | metalloendopeptidase inhibitor activity(GO:0008191) |
| 0.1 | 2.4 | GO:0045295 | gamma-catenin binding(GO:0045295) |
| 0.1 | 0.3 | GO:0015218 | pyrimidine nucleotide transmembrane transporter activity(GO:0015218) |
| 0.1 | 0.3 | GO:0035501 | MH1 domain binding(GO:0035501) |
| 0.1 | 0.7 | GO:0046935 | 1-phosphatidylinositol-3-kinase regulator activity(GO:0046935) |
| 0.1 | 1.3 | GO:0030346 | protein phosphatase 2B binding(GO:0030346) |
| 0.1 | 1.4 | GO:0048407 | platelet-derived growth factor binding(GO:0048407) |
| 0.1 | 0.4 | GO:0016880 | glutamate-ammonia ligase activity(GO:0004356) ammonia ligase activity(GO:0016211) acid-ammonia (or amide) ligase activity(GO:0016880) |
| 0.1 | 0.6 | GO:0019871 | sodium channel inhibitor activity(GO:0019871) |
| 0.1 | 0.4 | GO:0004594 | pantothenate kinase activity(GO:0004594) |
| 0.1 | 0.3 | GO:0035252 | UDP-xylosyltransferase activity(GO:0035252) xylosyltransferase activity(GO:0042285) |
| 0.1 | 0.3 | GO:0000822 | inositol hexakisphosphate binding(GO:0000822) |
| 0.1 | 2.9 | GO:0016799 | hydrolase activity, hydrolyzing N-glycosyl compounds(GO:0016799) |
| 0.1 | 0.4 | GO:0004739 | pyruvate dehydrogenase (acetyl-transferring) activity(GO:0004739) |
| 0.1 | 0.3 | GO:0034714 | type III transforming growth factor beta receptor binding(GO:0034714) |
| 0.1 | 0.6 | GO:0015501 | glutamate:sodium symporter activity(GO:0015501) |
| 0.1 | 0.5 | GO:0004741 | [pyruvate dehydrogenase (lipoamide)] phosphatase activity(GO:0004741) |
| 0.1 | 2.4 | GO:0043548 | phosphatidylinositol 3-kinase binding(GO:0043548) |
| 0.1 | 1.7 | GO:0051371 | muscle alpha-actinin binding(GO:0051371) |
| 0.1 | 0.3 | GO:0046404 | ATP-dependent polydeoxyribonucleotide 5'-hydroxyl-kinase activity(GO:0046404) polydeoxyribonucleotide kinase activity(GO:0051733) ATP-dependent polynucleotide kinase activity(GO:0051734) |
| 0.1 | 0.3 | GO:0042030 | ATPase inhibitor activity(GO:0042030) |
| 0.1 | 1.6 | GO:0044548 | S100 protein binding(GO:0044548) |
| 0.1 | 0.6 | GO:0017091 | AU-rich element binding(GO:0017091) |
| 0.1 | 1.8 | GO:0030275 | LRR domain binding(GO:0030275) |
| 0.1 | 0.2 | GO:0004616 | phosphogluconate dehydrogenase (decarboxylating) activity(GO:0004616) |
| 0.1 | 20.3 | GO:0008017 | microtubule binding(GO:0008017) |
| 0.1 | 0.7 | GO:0019869 | chloride channel inhibitor activity(GO:0019869) |
| 0.1 | 0.3 | GO:0047144 | 2-acylglycerol-3-phosphate O-acyltransferase activity(GO:0047144) |
| 0.1 | 1.0 | GO:0032183 | SUMO binding(GO:0032183) |
| 0.1 | 0.7 | GO:0005313 | L-glutamate transmembrane transporter activity(GO:0005313) acidic amino acid transmembrane transporter activity(GO:0015172) |
| 0.1 | 0.7 | GO:0015095 | magnesium ion transmembrane transporter activity(GO:0015095) |
| 0.1 | 1.8 | GO:0030159 | receptor signaling complex scaffold activity(GO:0030159) |
| 0.1 | 0.3 | GO:0045134 | uridine-diphosphatase activity(GO:0045134) |
| 0.1 | 0.2 | GO:0016230 | sphingomyelin phosphodiesterase activator activity(GO:0016230) |
| 0.1 | 6.6 | GO:0005262 | calcium channel activity(GO:0005262) |
| 0.1 | 1.0 | GO:0032794 | GTPase activating protein binding(GO:0032794) |
| 0.0 | 1.7 | GO:0015248 | sterol transporter activity(GO:0015248) |
| 0.0 | 1.7 | GO:0001671 | ATPase activator activity(GO:0001671) |
| 0.0 | 2.2 | GO:0061631 | ubiquitin conjugating enzyme activity(GO:0061631) |
| 0.0 | 2.1 | GO:0004864 | protein phosphatase inhibitor activity(GO:0004864) |
| 0.0 | 1.2 | GO:0016702 | oxidoreductase activity, acting on single donors with incorporation of molecular oxygen, incorporation of two atoms of oxygen(GO:0016702) |
| 0.0 | 0.6 | GO:0017162 | aryl hydrocarbon receptor binding(GO:0017162) |
| 0.0 | 0.6 | GO:0017034 | Rap guanyl-nucleotide exchange factor activity(GO:0017034) |
| 0.0 | 0.8 | GO:0008510 | sodium:bicarbonate symporter activity(GO:0008510) |
| 0.0 | 3.9 | GO:0004702 | receptor signaling protein serine/threonine kinase activity(GO:0004702) |
| 0.0 | 0.6 | GO:0051787 | misfolded protein binding(GO:0051787) |
| 0.0 | 2.5 | GO:0048306 | calcium-dependent protein binding(GO:0048306) |
| 0.0 | 1.3 | GO:0044183 | protein binding involved in protein folding(GO:0044183) |
| 0.0 | 2.3 | GO:0001540 | beta-amyloid binding(GO:0001540) |
| 0.0 | 3.5 | GO:0005089 | Rho guanyl-nucleotide exchange factor activity(GO:0005089) |
| 0.0 | 0.3 | GO:0019855 | calcium channel inhibitor activity(GO:0019855) |
| 0.0 | 1.3 | GO:0016538 | cyclin-dependent protein serine/threonine kinase regulator activity(GO:0016538) |
| 0.0 | 0.2 | GO:0097493 | extracellular matrix constituent conferring elasticity(GO:0030023) structural molecule activity conferring elasticity(GO:0097493) |
| 0.0 | 0.5 | GO:0008494 | translation activator activity(GO:0008494) |
| 0.0 | 2.5 | GO:0051082 | unfolded protein binding(GO:0051082) |
| 0.0 | 1.0 | GO:0005158 | insulin receptor binding(GO:0005158) |
| 0.0 | 0.4 | GO:0017017 | MAP kinase tyrosine/serine/threonine phosphatase activity(GO:0017017) |
| 0.0 | 4.0 | GO:0044325 | ion channel binding(GO:0044325) |
| 0.0 | 0.5 | GO:0034237 | protein kinase A regulatory subunit binding(GO:0034237) |
| 0.0 | 2.5 | GO:0005070 | SH3/SH2 adaptor activity(GO:0005070) |
| 0.0 | 0.1 | GO:0004711 | ribosomal protein S6 kinase activity(GO:0004711) |
| 0.0 | 0.3 | GO:0003688 | DNA replication origin binding(GO:0003688) |
| 0.0 | 0.3 | GO:0031489 | myosin V binding(GO:0031489) |
| 0.0 | 0.4 | GO:0046966 | thyroid hormone receptor binding(GO:0046966) |
| 0.0 | 2.2 | GO:0017137 | Rab GTPase binding(GO:0017137) |
| 0.0 | 0.6 | GO:0017112 | Rab guanyl-nucleotide exchange factor activity(GO:0017112) |
| 0.0 | 0.5 | GO:0032452 | histone demethylase activity(GO:0032452) |
| 0.0 | 0.3 | GO:0016505 | peptidase activator activity involved in apoptotic process(GO:0016505) |
| 0.0 | 0.2 | GO:0016881 | acid-amino acid ligase activity(GO:0016881) |
| 0.0 | 0.0 | GO:0001181 | transcription factor activity, core RNA polymerase I binding(GO:0001181) |
Gene overrepresentation in C2:CP category:
| Log-likelihood per target | Total log-likelihood | Term | Description |
|---|---|---|---|
| 0.3 | 14.0 | ST WNT BETA CATENIN PATHWAY | Wnt/beta-catenin Pathway |
| 0.3 | 12.8 | PID LIS1 PATHWAY | Lissencephaly gene (LIS1) in neuronal migration and development |
| 0.2 | 8.7 | PID NCADHERIN PATHWAY | N-cadherin signaling events |
| 0.2 | 10.3 | SIG CD40PATHWAYMAP | Genes related to CD40 signaling |
| 0.2 | 5.0 | PID INTEGRIN5 PATHWAY | Beta5 beta6 beta7 and beta8 integrin cell surface interactions |
| 0.1 | 3.0 | ST GAQ PATHWAY | G alpha q Pathway |
| 0.1 | 2.4 | SIG IL4RECEPTOR IN B LYPHOCYTES | Genes related to IL4 rceptor signaling in B lymphocytes |
| 0.1 | 3.9 | SIG REGULATION OF THE ACTIN CYTOSKELETON BY RHO GTPASES | Genes related to regulation of the actin cytoskeleton |
| 0.1 | 3.2 | PID MYC PATHWAY | C-MYC pathway |
| 0.1 | 3.3 | PID INTEGRIN A4B1 PATHWAY | Alpha4 beta1 integrin signaling events |
| 0.1 | 2.0 | PID HDAC CLASSIII PATHWAY | Signaling events mediated by HDAC Class III |
| 0.1 | 2.3 | PID RAC1 REG PATHWAY | Regulation of RAC1 activity |
| 0.1 | 3.1 | NABA PROTEOGLYCANS | Genes encoding proteoglycans |
| 0.1 | 2.7 | PID EPHB FWD PATHWAY | EPHB forward signaling |
| 0.1 | 3.9 | PID RHOA REG PATHWAY | Regulation of RhoA activity |
| 0.0 | 1.2 | PID RET PATHWAY | Signaling events regulated by Ret tyrosine kinase |
| 0.0 | 0.8 | PID BCR 5PATHWAY | BCR signaling pathway |
| 0.0 | 2.9 | PID NFAT TFPATHWAY | Calcineurin-regulated NFAT-dependent transcription in lymphocytes |
| 0.0 | 0.5 | ST GRANULE CELL SURVIVAL PATHWAY | Granule Cell Survival Pathway is a specific case of more general PAC1 Receptor Pathway. |
| 0.0 | 1.2 | PID AURORA A PATHWAY | Aurora A signaling |
| 0.0 | 0.7 | PID ERBB1 RECEPTOR PROXIMAL PATHWAY | EGF receptor (ErbB1) signaling pathway |
| 0.0 | 1.4 | PID AJDISS 2PATHWAY | Posttranslational regulation of adherens junction stability and dissassembly |
| 0.0 | 0.7 | PID CIRCADIAN PATHWAY | Circadian rhythm pathway |
| 0.0 | 0.5 | PID NETRIN PATHWAY | Netrin-mediated signaling events |
| 0.0 | 2.6 | PID ERBB1 DOWNSTREAM PATHWAY | ErbB1 downstream signaling |
| 0.0 | 1.4 | PID SYNDECAN 1 PATHWAY | Syndecan-1-mediated signaling events |
| 0.0 | 1.2 | PID REG GR PATHWAY | Glucocorticoid receptor regulatory network |
| 0.0 | 0.7 | PID CERAMIDE PATHWAY | Ceramide signaling pathway |
| 0.0 | 0.3 | PID TCR CALCIUM PATHWAY | Calcium signaling in the CD4+ TCR pathway |
| 0.0 | 0.3 | PID HEDGEHOG 2PATHWAY | Signaling events mediated by the Hedgehog family |
| 0.0 | 0.6 | PID TRKR PATHWAY | Neurotrophic factor-mediated Trk receptor signaling |
Gene overrepresentation in C2:CP:REACTOME category:
| Log-likelihood per target | Total log-likelihood | Term | Description |
|---|---|---|---|
| 0.5 | 8.3 | REACTOME DOPAMINE NEUROTRANSMITTER RELEASE CYCLE | Genes involved in Dopamine Neurotransmitter Release Cycle |
| 0.3 | 7.5 | REACTOME TRAFFICKING OF GLUR2 CONTAINING AMPA RECEPTORS | Genes involved in Trafficking of GluR2-containing AMPA receptors |
| 0.2 | 5.1 | REACTOME RAS ACTIVATION UOPN CA2 INFUX THROUGH NMDA RECEPTOR | Genes involved in Ras activation uopn Ca2+ infux through NMDA receptor |
| 0.2 | 1.4 | REACTOME SEMA3A PLEXIN REPULSION SIGNALING BY INHIBITING INTEGRIN ADHESION | Genes involved in SEMA3A-Plexin repulsion signaling by inhibiting Integrin adhesion |
| 0.2 | 4.6 | REACTOME NA CL DEPENDENT NEUROTRANSMITTER TRANSPORTERS | Genes involved in Na+/Cl- dependent neurotransmitter transporters |
| 0.2 | 4.2 | REACTOME PECAM1 INTERACTIONS | Genes involved in PECAM1 interactions |
| 0.2 | 3.9 | REACTOME JNK C JUN KINASES PHOSPHORYLATION AND ACTIVATION MEDIATED BY ACTIVATED HUMAN TAK1 | Genes involved in JNK (c-Jun kinases) phosphorylation and activation mediated by activated human TAK1 |
| 0.2 | 2.0 | REACTOME NOTCH HLH TRANSCRIPTION PATHWAY | Genes involved in Notch-HLH transcription pathway |
| 0.1 | 3.8 | REACTOME GLUCURONIDATION | Genes involved in Glucuronidation |
| 0.1 | 2.9 | REACTOME N GLYCAN ANTENNAE ELONGATION IN THE MEDIAL TRANS GOLGI | Genes involved in N-glycan antennae elongation in the medial/trans-Golgi |
| 0.1 | 3.7 | REACTOME HORMONE SENSITIVE LIPASE HSL MEDIATED TRIACYLGLYCEROL HYDROLYSIS | Genes involved in Hormone-sensitive lipase (HSL)-mediated triacylglycerol hydrolysis |
| 0.1 | 2.4 | REACTOME SIGNAL ATTENUATION | Genes involved in Signal attenuation |
| 0.1 | 3.2 | REACTOME KINESINS | Genes involved in Kinesins |
| 0.1 | 3.5 | REACTOME INSULIN RECEPTOR RECYCLING | Genes involved in Insulin receptor recycling |
| 0.1 | 12.5 | REACTOME TRANSPORT OF INORGANIC CATIONS ANIONS AND AMINO ACIDS OLIGOPEPTIDES | Genes involved in Transport of inorganic cations/anions and amino acids/oligopeptides |
| 0.1 | 1.6 | REACTOME PRE NOTCH PROCESSING IN GOLGI | Genes involved in Pre-NOTCH Processing in Golgi |
| 0.1 | 3.4 | REACTOME KERATAN SULFATE BIOSYNTHESIS | Genes involved in Keratan sulfate biosynthesis |
| 0.1 | 4.0 | REACTOME DARPP 32 EVENTS | Genes involved in DARPP-32 events |
| 0.1 | 3.2 | REACTOME ASSOCIATION OF TRIC CCT WITH TARGET PROTEINS DURING BIOSYNTHESIS | Genes involved in Association of TriC/CCT with target proteins during biosynthesis |
| 0.1 | 0.7 | REACTOME DESTABILIZATION OF MRNA BY BRF1 | Genes involved in Destabilization of mRNA by Butyrate Response Factor 1 (BRF1) |
| 0.1 | 1.8 | REACTOME SYNTHESIS OF VERY LONG CHAIN FATTY ACYL COAS | Genes involved in Synthesis of very long-chain fatty acyl-CoAs |
| 0.1 | 1.9 | REACTOME CRMPS IN SEMA3A SIGNALING | Genes involved in CRMPs in Sema3A signaling |
| 0.1 | 0.8 | REACTOME REGULATION OF INSULIN SECRETION BY ACETYLCHOLINE | Genes involved in Regulation of Insulin Secretion by Acetylcholine |
| 0.1 | 4.1 | REACTOME SMOOTH MUSCLE CONTRACTION | Genes involved in Smooth Muscle Contraction |
| 0.1 | 1.8 | REACTOME DESTABILIZATION OF MRNA BY KSRP | Genes involved in Destabilization of mRNA by KSRP |
| 0.1 | 3.1 | REACTOME GLYCOLYSIS | Genes involved in Glycolysis |
| 0.1 | 0.9 | REACTOME ROLE OF DCC IN REGULATING APOPTOSIS | Genes involved in Role of DCC in regulating apoptosis |
| 0.1 | 1.4 | REACTOME ACTIVATION OF RAC | Genes involved in Activation of Rac |
| 0.1 | 4.6 | REACTOME GOLGI ASSOCIATED VESICLE BIOGENESIS | Genes involved in Golgi Associated Vesicle Biogenesis |
| 0.1 | 2.8 | REACTOME MYOGENESIS | Genes involved in Myogenesis |
| 0.1 | 0.5 | REACTOME SYNTHESIS OF PIPS AT THE LATE ENDOSOME MEMBRANE | Genes involved in Synthesis of PIPs at the late endosome membrane |
| 0.1 | 0.9 | REACTOME REGULATION OF PYRUVATE DEHYDROGENASE PDH COMPLEX | Genes involved in Regulation of pyruvate dehydrogenase (PDH) complex |
| 0.0 | 1.1 | REACTOME SIGNAL REGULATORY PROTEIN SIRP FAMILY INTERACTIONS | Genes involved in Signal regulatory protein (SIRP) family interactions |
| 0.0 | 0.9 | REACTOME ABCA TRANSPORTERS IN LIPID HOMEOSTASIS | Genes involved in ABCA transporters in lipid homeostasis |
| 0.0 | 0.5 | REACTOME ROLE OF SECOND MESSENGERS IN NETRIN1 SIGNALING | Genes involved in Role of second messengers in netrin-1 signaling |
| 0.0 | 0.6 | REACTOME SYNTHESIS OF SUBSTRATES IN N GLYCAN BIOSYTHESIS | Genes involved in Synthesis of substrates in N-glycan biosythesis |
| 0.0 | 0.5 | REACTOME ACTIVATION OF CHAPERONE GENES BY ATF6 ALPHA | Genes involved in Activation of Chaperone Genes by ATF6-alpha |
| 0.0 | 0.7 | REACTOME IL 7 SIGNALING | Genes involved in Interleukin-7 signaling |
| 0.0 | 0.7 | REACTOME CIRCADIAN CLOCK | Genes involved in Circadian Clock |
| 0.0 | 0.7 | REACTOME REGULATION OF RHEB GTPASE ACTIVITY BY AMPK | Genes involved in Regulation of Rheb GTPase activity by AMPK |
| 0.0 | 1.4 | REACTOME GLYCOSPHINGOLIPID METABOLISM | Genes involved in Glycosphingolipid metabolism |
| 0.0 | 0.7 | REACTOME PROTEOLYTIC CLEAVAGE OF SNARE COMPLEX PROTEINS | Genes involved in Proteolytic cleavage of SNARE complex proteins |
| 0.0 | 1.5 | REACTOME RNA POL III TRANSCRIPTION | Genes involved in RNA Polymerase III Transcription |
| 0.0 | 5.0 | REACTOME SIGNALING BY RHO GTPASES | Genes involved in Signaling by Rho GTPases |
| 0.0 | 0.6 | REACTOME ARMS MEDIATED ACTIVATION | Genes involved in ARMS-mediated activation |
| 0.0 | 2.6 | REACTOME AMYLOIDS | Genes involved in Amyloids |
| 0.0 | 0.7 | REACTOME ENDOSOMAL SORTING COMPLEX REQUIRED FOR TRANSPORT ESCRT | Genes involved in Endosomal Sorting Complex Required For Transport (ESCRT) |
| 0.0 | 0.6 | REACTOME RECYCLING PATHWAY OF L1 | Genes involved in Recycling pathway of L1 |
| 0.0 | 1.3 | REACTOME NOTCH1 INTRACELLULAR DOMAIN REGULATES TRANSCRIPTION | Genes involved in NOTCH1 Intracellular Domain Regulates Transcription |
| 0.0 | 2.2 | REACTOME MITOTIC PROMETAPHASE | Genes involved in Mitotic Prometaphase |
| 0.0 | 0.3 | REACTOME TGF BETA RECEPTOR SIGNALING IN EMT EPITHELIAL TO MESENCHYMAL TRANSITION | Genes involved in TGF-beta receptor signaling in EMT (epithelial to mesenchymal transition) |
| 0.0 | 1.4 | REACTOME REGULATION OF ORNITHINE DECARBOXYLASE ODC | Genes involved in Regulation of ornithine decarboxylase (ODC) |
| 0.0 | 0.6 | REACTOME CYTOSOLIC TRNA AMINOACYLATION | Genes involved in Cytosolic tRNA aminoacylation |
| 0.0 | 1.2 | REACTOME METABOLISM OF VITAMINS AND COFACTORS | Genes involved in Metabolism of vitamins and cofactors |
| 0.0 | 0.3 | REACTOME ACYL CHAIN REMODELLING OF PE | Genes involved in Acyl chain remodelling of PE |
| 0.0 | 0.4 | REACTOME AMINO ACID SYNTHESIS AND INTERCONVERSION TRANSAMINATION | Genes involved in Amino acid synthesis and interconversion (transamination) |
| 0.0 | 0.3 | REACTOME SIGNALING BY BMP | Genes involved in Signaling by BMP |
| 0.0 | 0.3 | REACTOME SIGNALING BY HIPPO | Genes involved in Signaling by Hippo |