Project
GNF SymAtlas + NCI-60 cancer cell lines, comparison of cancers vs non-cancers, human (Su, 2004; Ross, 2000)
Navigation
Downloads
Results for DMC1
Z-value: 0.03
Motif logo

Transcription factors associated with DMC1
| Gene Symbol | Gene ID | Gene Info |
|---|---|---|
|
DMC1
|
ENSG00000100206.5 | DNA meiotic recombinase 1 |
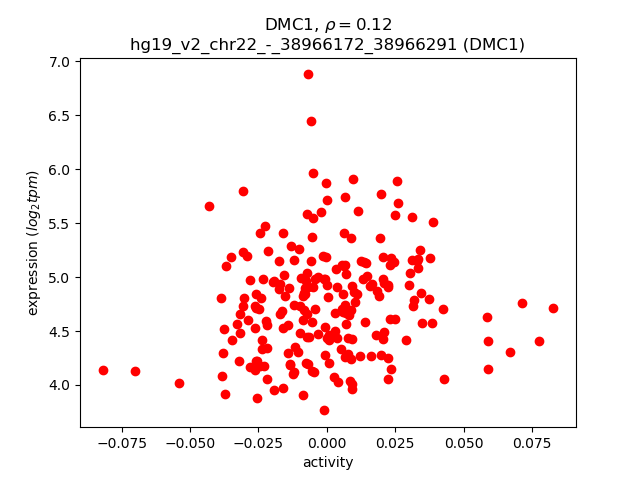
Activity-expression correlation:
| Gene | Promoter | Pearson corr. coef. | P-value | Plot |
|---|---|---|---|---|
| DMC1 | hg19_v2_chr22_-_38966172_38966291 | 0.12 | 7.0e-02 | Click! |
Activity profile of DMC1 motif
Sorted Z-values of DMC1 motif
| Promoter | Log-likelihood | Transcript | Gene | Gene Info |
|---|---|---|---|---|
| chr12_-_8803128 | 7.65 |
ENST00000543467.1
|
MFAP5
|
microfibrillar associated protein 5 |
| chr2_-_190044480 | 7.42 |
ENST00000374866.3
|
COL5A2
|
collagen, type V, alpha 2 |
| chr12_-_9268707 | 6.16 |
ENST00000318602.7
|
A2M
|
alpha-2-macroglobulin |
| chr2_+_187454749 | 4.97 |
ENST00000261023.3
ENST00000374907.3 |
ITGAV
|
integrin, alpha V |
| chr12_-_50677255 | 4.46 |
ENST00000551691.1
ENST00000394943.3 ENST00000341247.4 |
LIMA1
|
LIM domain and actin binding 1 |
| chr3_+_148457585 | 3.15 |
ENST00000402260.1
|
AGTR1
|
angiotensin II receptor, type 1 |
| chr11_-_85779971 | 2.85 |
ENST00000393346.3
|
PICALM
|
phosphatidylinositol binding clathrin assembly protein |
| chr14_-_21492113 | 2.77 |
ENST00000554094.1
|
NDRG2
|
NDRG family member 2 |
| chr11_+_71238313 | 2.66 |
ENST00000398536.4
|
KRTAP5-7
|
keratin associated protein 5-7 |
| chr3_+_101546827 | 2.54 |
ENST00000461724.1
ENST00000483180.1 ENST00000394054.2 |
NFKBIZ
|
nuclear factor of kappa light polypeptide gene enhancer in B-cells inhibitor, zeta |
| chr14_-_21492251 | 2.47 |
ENST00000554398.1
|
NDRG2
|
NDRG family member 2 |
| chr19_+_11466062 | 2.32 |
ENST00000251473.5
ENST00000591329.1 ENST00000586380.1 |
DKFZP761J1410
|
Lipid phosphate phosphatase-related protein type 2 |
| chr11_-_85780086 | 2.10 |
ENST00000532317.1
ENST00000528256.1 ENST00000526033.1 |
PICALM
|
phosphatidylinositol binding clathrin assembly protein |
| chr14_-_21491477 | 1.96 |
ENST00000298684.5
ENST00000557169.1 ENST00000553563.1 |
NDRG2
|
NDRG family member 2 |
| chr10_+_17851362 | 1.87 |
ENST00000331429.2
ENST00000457317.1 |
MRC1L1
|
cDNA FLJ56855, highly similar to Macrophage mannose receptor 1 |
| chr4_-_76944621 | 1.72 |
ENST00000306602.1
|
CXCL10
|
chemokine (C-X-C motif) ligand 10 |
| chr2_+_201173667 | 1.65 |
ENST00000409755.3
|
SPATS2L
|
spermatogenesis associated, serine-rich 2-like |
| chr2_+_233497931 | 1.63 |
ENST00000264059.3
|
EFHD1
|
EF-hand domain family, member D1 |
| chr10_-_74856608 | 1.55 |
ENST00000307116.2
ENST00000373008.2 ENST00000412021.2 ENST00000394890.2 ENST00000263556.3 ENST00000440381.1 |
P4HA1
|
prolyl 4-hydroxylase, alpha polypeptide I |
| chr3_-_99569821 | 1.50 |
ENST00000487087.1
|
FILIP1L
|
filamin A interacting protein 1-like |
| chr18_+_56892724 | 1.34 |
ENST00000456142.3
ENST00000530323.1 |
GRP
|
gastrin-releasing peptide |
| chrX_+_65382433 | 1.28 |
ENST00000374727.3
|
HEPH
|
hephaestin |
| chr17_+_57297807 | 1.24 |
ENST00000284116.4
ENST00000581140.1 ENST00000581276.1 |
GDPD1
|
glycerophosphodiester phosphodiesterase domain containing 1 |
| chrX_-_134305322 | 1.23 |
ENST00000276241.6
ENST00000344129.2 |
CXorf48
|
cancer/testis antigen 55 |
| chr12_-_71031185 | 1.15 |
ENST00000548122.1
ENST00000551525.1 ENST00000550358.1 |
PTPRB
|
protein tyrosine phosphatase, receptor type, B |
| chr19_-_3600549 | 1.11 |
ENST00000589966.1
|
TBXA2R
|
thromboxane A2 receptor |
| chr22_+_21133469 | 1.09 |
ENST00000406799.1
|
SERPIND1
|
serpin peptidase inhibitor, clade D (heparin cofactor), member 1 |
| chr5_-_82969405 | 1.08 |
ENST00000510978.1
|
HAPLN1
|
hyaluronan and proteoglycan link protein 1 |
| chr10_-_104597286 | 1.05 |
ENST00000369887.3
|
CYP17A1
|
cytochrome P450, family 17, subfamily A, polypeptide 1 |
| chr1_+_18958008 | 0.98 |
ENST00000420770.2
ENST00000400661.3 |
PAX7
|
paired box 7 |
| chr15_-_49103235 | 0.96 |
ENST00000380950.2
|
CEP152
|
centrosomal protein 152kDa |
| chr4_+_106473768 | 0.95 |
ENST00000265154.2
ENST00000420470.2 |
ARHGEF38
|
Rho guanine nucleotide exchange factor (GEF) 38 |
| chr10_-_62332357 | 0.85 |
ENST00000503366.1
|
ANK3
|
ankyrin 3, node of Ranvier (ankyrin G) |
| chr2_+_219246746 | 0.84 |
ENST00000233202.6
|
SLC11A1
|
solute carrier family 11 (proton-coupled divalent metal ion transporter), member 1 |
| chr7_-_22539771 | 0.80 |
ENST00000406890.2
ENST00000424363.1 |
STEAP1B
|
STEAP family member 1B |
| chr12_-_71031220 | 0.76 |
ENST00000334414.6
|
PTPRB
|
protein tyrosine phosphatase, receptor type, B |
| chr1_-_11863571 | 0.71 |
ENST00000376583.3
|
MTHFR
|
methylenetetrahydrofolate reductase (NAD(P)H) |
| chr11_+_71846764 | 0.70 |
ENST00000456237.1
ENST00000442948.2 ENST00000546166.1 |
FOLR3
|
folate receptor 3 (gamma) |
| chr3_-_141747950 | 0.62 |
ENST00000497579.1
|
TFDP2
|
transcription factor Dp-2 (E2F dimerization partner 2) |
| chr11_+_71846748 | 0.61 |
ENST00000445078.2
|
FOLR3
|
folate receptor 3 (gamma) |
| chr7_+_47694842 | 0.51 |
ENST00000408988.2
|
C7orf65
|
chromosome 7 open reading frame 65 |
| chr2_-_48982708 | 0.51 |
ENST00000428232.1
ENST00000405626.1 ENST00000294954.7 |
LHCGR
|
luteinizing hormone/choriogonadotropin receptor |
| chr14_+_74318513 | 0.49 |
ENST00000555228.1
ENST00000555661.1 |
PTGR2
|
prostaglandin reductase 2 |
| chr10_+_74870253 | 0.48 |
ENST00000544879.1
ENST00000537969.1 ENST00000372997.3 |
NUDT13
|
nudix (nucleoside diphosphate linked moiety X)-type motif 13 |
| chr7_+_150758304 | 0.47 |
ENST00000482950.1
ENST00000463414.1 ENST00000310317.5 |
SLC4A2
|
solute carrier family 4 (anion exchanger), member 2 |
| chr18_-_5396271 | 0.47 |
ENST00000579951.1
|
EPB41L3
|
erythrocyte membrane protein band 4.1-like 3 |
| chr10_+_74870206 | 0.46 |
ENST00000357321.4
ENST00000349051.5 |
NUDT13
|
nudix (nucleoside diphosphate linked moiety X)-type motif 13 |
| chr2_-_48982857 | 0.43 |
ENST00000403273.1
ENST00000401907.1 ENST00000344775.3 |
LHCGR
|
luteinizing hormone/choriogonadotropin receptor |
| chr2_-_21022818 | 0.39 |
ENST00000440866.2
ENST00000541941.1 ENST00000402479.2 ENST00000435420.2 ENST00000432947.1 ENST00000403006.2 ENST00000419825.2 ENST00000381090.3 ENST00000237822.3 ENST00000412261.1 |
C2orf43
|
chromosome 2 open reading frame 43 |
| chr14_+_74318611 | 0.39 |
ENST00000555976.1
ENST00000267568.4 |
PTGR2
|
prostaglandin reductase 2 |
| chr19_+_44617511 | 0.37 |
ENST00000262894.6
ENST00000588926.1 ENST00000592780.1 |
ZNF225
|
zinc finger protein 225 |
| chr11_-_73720276 | 0.36 |
ENST00000348534.4
|
UCP3
|
uncoupling protein 3 (mitochondrial, proton carrier) |
| chr20_+_123010 | 0.35 |
ENST00000382398.3
|
DEFB126
|
defensin, beta 126 |
| chr6_-_62996066 | 0.34 |
ENST00000281156.4
|
KHDRBS2
|
KH domain containing, RNA binding, signal transduction associated 2 |
| chr16_-_30122717 | 0.32 |
ENST00000566613.1
|
GDPD3
|
glycerophosphodiester phosphodiesterase domain containing 3 |
| chr11_-_73720122 | 0.28 |
ENST00000426995.2
|
UCP3
|
uncoupling protein 3 (mitochondrial, proton carrier) |
| chr10_-_135187193 | 0.27 |
ENST00000368547.3
|
ECHS1
|
enoyl CoA hydratase, short chain, 1, mitochondrial |
| chr20_-_21378666 | 0.26 |
ENST00000351817.4
|
NKX2-4
|
NK2 homeobox 4 |
| chr3_-_119276575 | 0.22 |
ENST00000383669.3
ENST00000383668.3 |
CD80
|
CD80 molecule |
| chr2_-_31637560 | 0.22 |
ENST00000379416.3
|
XDH
|
xanthine dehydrogenase |
| chr1_-_190446759 | 0.18 |
ENST00000367462.3
|
BRINP3
|
bone morphogenetic protein/retinoic acid inducible neural-specific 3 |
| chr3_-_141747459 | 0.16 |
ENST00000477292.1
ENST00000478006.1 ENST00000495310.1 ENST00000486111.1 |
TFDP2
|
transcription factor Dp-2 (E2F dimerization partner 2) |
| chr8_-_101734907 | 0.16 |
ENST00000318607.5
ENST00000521865.1 ENST00000520804.1 ENST00000522720.1 ENST00000521067.1 |
PABPC1
|
poly(A) binding protein, cytoplasmic 1 |
| chr2_-_75426826 | 0.13 |
ENST00000305249.5
|
TACR1
|
tachykinin receptor 1 |
| chr12_-_53901266 | 0.02 |
ENST00000609999.1
ENST00000267017.3 |
NPFF
|
neuropeptide FF-amide peptide precursor |
| chrX_-_49965663 | 0.01 |
ENST00000376056.2
ENST00000376058.2 ENST00000358526.2 |
AKAP4
|
A kinase (PRKA) anchor protein 4 |
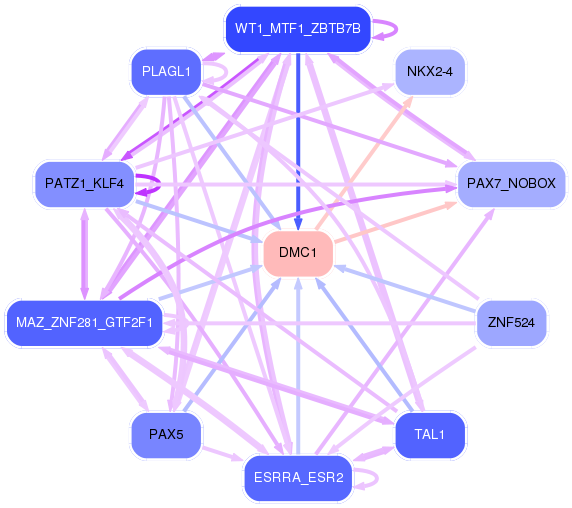
Network of associatons between targets according to the STRING database.

First level regulatory network of DMC1
Gene Ontology Analysis
Gene overrepresentation in biological_process category:
| Log-likelihood per target | Total log-likelihood | Term | Description |
|---|---|---|---|
| 1.9 | 7.4 | GO:1903224 | regulation of endodermal cell differentiation(GO:1903224) |
| 1.2 | 5.0 | GO:0045715 | negative regulation of low-density lipoprotein particle receptor biosynthetic process(GO:0045715) |
| 0.8 | 3.1 | GO:0086097 | phospholipase C-activating angiotensin-activated signaling pathway(GO:0086097) |
| 0.7 | 4.9 | GO:1902963 | regulation of metalloendopeptidase activity involved in amyloid precursor protein catabolic process(GO:1902962) negative regulation of metalloendopeptidase activity involved in amyloid precursor protein catabolic process(GO:1902963) |
| 0.5 | 6.2 | GO:0001867 | complement activation, lectin pathway(GO:0001867) |
| 0.4 | 7.2 | GO:0090360 | platelet-derived growth factor production(GO:0090360) regulation of platelet-derived growth factor production(GO:0090361) |
| 0.4 | 1.1 | GO:0038193 | thromboxane A2 signaling pathway(GO:0038193) |
| 0.3 | 1.7 | GO:1901509 | regulation of endothelial tube morphogenesis(GO:1901509) |
| 0.3 | 1.3 | GO:0036343 | psychomotor behavior(GO:0036343) |
| 0.3 | 0.9 | GO:0042700 | luteinizing hormone signaling pathway(GO:0042700) |
| 0.2 | 1.0 | GO:0014816 | skeletal muscle satellite cell differentiation(GO:0014816) |
| 0.2 | 0.8 | GO:0010650 | positive regulation of cell communication by electrical coupling(GO:0010650) maintenance of protein location in membrane(GO:0072658) maintenance of protein location in plasma membrane(GO:0072660) positive regulation of membrane depolarization during cardiac muscle cell action potential(GO:1900827) |
| 0.2 | 1.5 | GO:0018401 | peptidyl-proline hydroxylation to 4-hydroxy-L-proline(GO:0018401) |
| 0.2 | 7.7 | GO:0060216 | definitive hemopoiesis(GO:0060216) |
| 0.2 | 0.6 | GO:0055073 | cadmium ion homeostasis(GO:0055073) |
| 0.2 | 0.8 | GO:0098706 | ferric iron import into cell(GO:0097461) ferric iron import across plasma membrane(GO:0098706) |
| 0.2 | 1.0 | GO:0098535 | de novo centriole assembly(GO:0098535) |
| 0.2 | 1.1 | GO:0008218 | bioluminescence(GO:0008218) |
| 0.1 | 0.7 | GO:0033274 | response to vitamin B2(GO:0033274) heterochromatin maintenance(GO:0070829) |
| 0.1 | 1.3 | GO:0015884 | folic acid transport(GO:0015884) |
| 0.1 | 0.2 | GO:0006145 | purine nucleobase catabolic process(GO:0006145) |
| 0.1 | 0.5 | GO:0002175 | protein localization to paranode region of axon(GO:0002175) |
| 0.1 | 4.5 | GO:0031529 | ruffle organization(GO:0031529) |
| 0.1 | 1.0 | GO:0006702 | androgen biosynthetic process(GO:0006702) |
| 0.0 | 0.9 | GO:0006825 | copper ion transport(GO:0006825) |
| 0.0 | 0.6 | GO:1990845 | adaptive thermogenesis(GO:1990845) |
| 0.0 | 0.2 | GO:0045425 | regulation of granulocyte macrophage colony-stimulating factor biosynthetic process(GO:0045423) positive regulation of granulocyte macrophage colony-stimulating factor biosynthetic process(GO:0045425) |
| 0.0 | 0.1 | GO:0003051 | angiotensin-mediated drinking behavior(GO:0003051) operant conditioning(GO:0035106) |
| 0.0 | 0.9 | GO:0006692 | prostanoid metabolic process(GO:0006692) prostaglandin metabolic process(GO:0006693) |
| 0.0 | 0.8 | GO:0000083 | regulation of transcription involved in G1/S transition of mitotic cell cycle(GO:0000083) |
| 0.0 | 2.7 | GO:0031424 | keratinization(GO:0031424) |
| 0.0 | 0.9 | GO:0015949 | nucleobase-containing small molecule interconversion(GO:0015949) |
| 0.0 | 0.2 | GO:2000622 | regulation of nuclear-transcribed mRNA catabolic process, nonsense-mediated decay(GO:2000622) negative regulation of nuclear-transcribed mRNA catabolic process, nonsense-mediated decay(GO:2000623) |
| 0.0 | 1.2 | GO:0034308 | primary alcohol metabolic process(GO:0034308) |
| 0.0 | 1.9 | GO:0035335 | peptidyl-tyrosine dephosphorylation(GO:0035335) |
Gene overrepresentation in cellular_component category:
| Log-likelihood per target | Total log-likelihood | Term | Description |
|---|---|---|---|
| 2.5 | 7.4 | GO:0005588 | collagen type V trimer(GO:0005588) |
| 1.7 | 5.0 | GO:0034686 | integrin alphav-beta6 complex(GO:0034685) integrin alphav-beta8 complex(GO:0034686) |
| 0.8 | 4.9 | GO:0070381 | endosome to plasma membrane transport vesicle(GO:0070381) |
| 0.5 | 1.5 | GO:0016222 | procollagen-proline 4-dioxygenase complex(GO:0016222) |
| 0.3 | 7.7 | GO:0001527 | microfibril(GO:0001527) fibril(GO:0043205) |
| 0.3 | 1.0 | GO:0098536 | deuterosome(GO:0098536) |
| 0.1 | 0.2 | GO:0098636 | protein complex involved in cell adhesion(GO:0098636) |
| 0.1 | 2.7 | GO:0045095 | keratin filament(GO:0045095) |
| 0.1 | 4.5 | GO:0097610 | cleavage furrow(GO:0032154) cell surface furrow(GO:0097610) |
| 0.0 | 0.8 | GO:0043194 | axon initial segment(GO:0043194) |
| 0.0 | 6.2 | GO:0031093 | platelet alpha granule lumen(GO:0031093) |
| 0.0 | 7.2 | GO:0030426 | growth cone(GO:0030426) |
| 0.0 | 0.5 | GO:0033270 | paranode region of axon(GO:0033270) |
| 0.0 | 2.5 | GO:0000932 | cytoplasmic mRNA processing body(GO:0000932) |
| 0.0 | 1.3 | GO:1904724 | tertiary granule lumen(GO:1904724) |
| 0.0 | 0.2 | GO:1990124 | messenger ribonucleoprotein complex(GO:1990124) |
| 0.0 | 1.1 | GO:0001669 | acrosomal vesicle(GO:0001669) |
Gene overrepresentation in molecular_function category:
| Log-likelihood per target | Total log-likelihood | Term | Description |
|---|---|---|---|
| 2.1 | 6.2 | GO:0019959 | interleukin-8 binding(GO:0019959) |
| 1.0 | 3.1 | GO:0001596 | angiotensin type I receptor activity(GO:0001596) |
| 1.0 | 5.0 | GO:1990430 | extracellular matrix protein binding(GO:1990430) |
| 0.4 | 4.9 | GO:0032050 | clathrin heavy chain binding(GO:0032050) |
| 0.4 | 1.1 | GO:0004960 | thromboxane receptor activity(GO:0004960) thromboxane A2 receptor activity(GO:0004961) |
| 0.3 | 1.7 | GO:0048248 | CXCR3 chemokine receptor binding(GO:0048248) |
| 0.3 | 1.5 | GO:0004656 | procollagen-proline 4-dioxygenase activity(GO:0004656) procollagen-proline dioxygenase activity(GO:0019798) |
| 0.2 | 0.9 | GO:0004963 | follicle-stimulating hormone receptor activity(GO:0004963) |
| 0.2 | 0.8 | GO:0008823 | cupric reductase activity(GO:0008823) ferric-chelate reductase (NADPH) activity(GO:0052851) |
| 0.2 | 0.6 | GO:0051139 | metal ion:proton antiporter activity(GO:0051139) |
| 0.2 | 16.2 | GO:0005201 | extracellular matrix structural constituent(GO:0005201) |
| 0.1 | 0.7 | GO:0004489 | methylenetetrahydrofolate reductase (NAD(P)H) activity(GO:0004489) |
| 0.1 | 0.9 | GO:0004322 | ferroxidase activity(GO:0004322) oxidoreductase activity, oxidizing metal ions, oxygen as acceptor(GO:0016724) |
| 0.1 | 4.5 | GO:0003785 | actin monomer binding(GO:0003785) |
| 0.1 | 0.6 | GO:0017077 | oxidative phosphorylation uncoupler activity(GO:0017077) |
| 0.1 | 1.3 | GO:0005542 | folic acid binding(GO:0005542) |
| 0.1 | 1.9 | GO:0019198 | transmembrane receptor protein tyrosine phosphatase activity(GO:0005001) transmembrane receptor protein phosphatase activity(GO:0019198) |
| 0.0 | 1.0 | GO:0016832 | aldehyde-lyase activity(GO:0016832) |
| 0.0 | 1.2 | GO:0004622 | lysophospholipase activity(GO:0004622) |
| 0.0 | 1.4 | GO:0005184 | neuropeptide hormone activity(GO:0005184) |
| 0.0 | 0.2 | GO:0043546 | molybdopterin cofactor binding(GO:0043546) |
| 0.0 | 0.9 | GO:0016628 | oxidoreductase activity, acting on the CH-CH group of donors, NAD or NADP as acceptor(GO:0016628) |
| 0.0 | 0.1 | GO:0004995 | tachykinin receptor activity(GO:0004995) |
| 0.0 | 0.5 | GO:0008510 | sodium:bicarbonate symporter activity(GO:0008510) |
| 0.0 | 0.3 | GO:0004300 | enoyl-CoA hydratase activity(GO:0004300) |
| 0.0 | 1.0 | GO:0000983 | transcription factor activity, RNA polymerase II core promoter sequence-specific(GO:0000983) |
| 0.0 | 0.5 | GO:0008266 | poly(U) RNA binding(GO:0008266) |
| 0.0 | 0.8 | GO:0030507 | spectrin binding(GO:0030507) |
| 0.0 | 1.1 | GO:0004867 | serine-type endopeptidase inhibitor activity(GO:0004867) |
Gene overrepresentation in C2:CP category:
| Log-likelihood per target | Total log-likelihood | Term | Description |
|---|---|---|---|
| 0.2 | 5.0 | PID INTEGRIN5 PATHWAY | Beta5 beta6 beta7 and beta8 integrin cell surface interactions |
| 0.2 | 7.4 | NABA COLLAGENS | Genes encoding collagen proteins |
| 0.1 | 7.7 | PID NOTCH PATHWAY | Notch signaling pathway |
| 0.1 | 4.5 | PID ECADHERIN STABILIZATION PATHWAY | Stabilization and expansion of the E-cadherin adherens junction |
| 0.1 | 6.2 | PID IL6 7 PATHWAY | IL6-mediated signaling events |
| 0.1 | 4.1 | PID ARF6 PATHWAY | Arf6 signaling events |
| 0.1 | 7.8 | PID MYC REPRESS PATHWAY | Validated targets of C-MYC transcriptional repression |
| 0.0 | 1.1 | NABA PROTEOGLYCANS | Genes encoding proteoglycans |
| 0.0 | 1.1 | ST GA13 PATHWAY | G alpha 13 Pathway |
| 0.0 | 2.6 | NABA ECM REGULATORS | Genes encoding enzymes and their regulators involved in the remodeling of the extracellular matrix |
Gene overrepresentation in C2:CP:REACTOME category:
| Log-likelihood per target | Total log-likelihood | Term | Description |
|---|---|---|---|
| 0.3 | 6.2 | REACTOME INTRINSIC PATHWAY | Genes involved in Intrinsic Pathway |
| 0.3 | 5.0 | REACTOME PECAM1 INTERACTIONS | Genes involved in PECAM1 interactions |
| 0.1 | 7.4 | REACTOME NCAM1 INTERACTIONS | Genes involved in NCAM1 interactions |
| 0.1 | 1.1 | REACTOME PROSTANOID LIGAND RECEPTORS | Genes involved in Prostanoid ligand receptors |
| 0.1 | 1.0 | REACTOME ANDROGEN BIOSYNTHESIS | Genes involved in Androgen biosynthesis |
| 0.1 | 0.9 | REACTOME HORMONE LIGAND BINDING RECEPTORS | Genes involved in Hormone ligand-binding receptors |
| 0.1 | 4.9 | REACTOME GOLGI ASSOCIATED VESICLE BIOGENESIS | Genes involved in Golgi Associated Vesicle Biogenesis |
| 0.1 | 1.4 | REACTOME METAL ION SLC TRANSPORTERS | Genes involved in Metal ion SLC transporters |
| 0.0 | 1.0 | REACTOME SYNTHESIS SECRETION AND INACTIVATION OF GLP1 | Genes involved in Synthesis, Secretion, and Inactivation of Glucagon-like Peptide-1 (GLP-1) |
| 0.0 | 0.3 | REACTOME BETA DEFENSINS | Genes involved in Beta defensins |
| 0.0 | 1.7 | REACTOME CHEMOKINE RECEPTORS BIND CHEMOKINES | Genes involved in Chemokine receptors bind chemokines |
| 0.0 | 3.3 | REACTOME PEPTIDE LIGAND BINDING RECEPTORS | Genes involved in Peptide ligand-binding receptors |
| 0.0 | 0.8 | REACTOME INTERACTION BETWEEN L1 AND ANKYRINS | Genes involved in Interaction between L1 and Ankyrins |
| 0.0 | 0.2 | REACTOME PURINE CATABOLISM | Genes involved in Purine catabolism |
| 0.0 | 0.3 | REACTOME MITOCHONDRIAL FATTY ACID BETA OXIDATION | Genes involved in Mitochondrial Fatty Acid Beta-Oxidation |
| 0.0 | 0.2 | REACTOME CD28 DEPENDENT VAV1 PATHWAY | Genes involved in CD28 dependent Vav1 pathway |