Project
GNF SymAtlas + NCI-60 cancer cell lines, comparison of cancers vs non-cancers, human (Su, 2004; Ross, 2000)
Navigation
Downloads
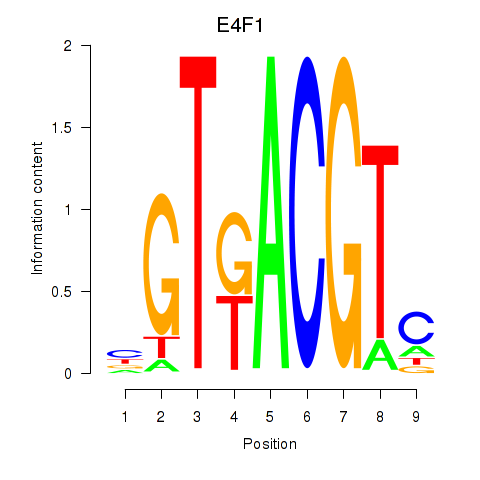
Results for E4F1
Z-value: 0.41
Motif logo
Transcription factors associated with E4F1
| Gene Symbol | Gene ID | Gene Info |
|---|---|---|
|
E4F1
|
ENSG00000167967.11 | E4F transcription factor 1 |
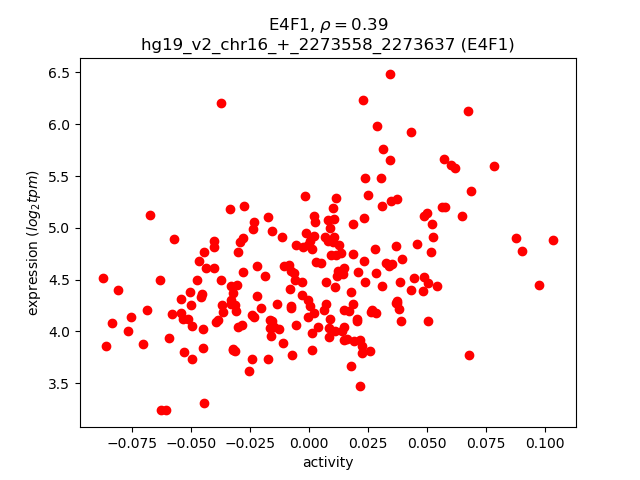
Activity-expression correlation:
| Gene | Promoter | Pearson corr. coef. | P-value | Plot |
|---|---|---|---|---|
| E4F1 | hg19_v2_chr16_+_2273558_2273637 | 0.39 | 2.9e-09 | Click! |
Activity profile of E4F1 motif
Sorted Z-values of E4F1 motif
| Promoter | Log-likelihood | Transcript | Gene | Gene Info |
|---|---|---|---|---|
| chr6_-_32812420 | 16.47 |
ENST00000374881.2
|
PSMB8
|
proteasome (prosome, macropain) subunit, beta type, 8 |
| chr6_+_32812568 | 12.62 |
ENST00000414474.1
|
PSMB9
|
proteasome (prosome, macropain) subunit, beta type, 9 |
| chr19_+_1941117 | 10.22 |
ENST00000255641.8
|
CSNK1G2
|
casein kinase 1, gamma 2 |
| chr2_-_62115725 | 9.24 |
ENST00000538252.1
ENST00000544079.1 ENST00000394440.3 |
CCT4
|
chaperonin containing TCP1, subunit 4 (delta) |
| chr2_-_62115659 | 9.23 |
ENST00000544185.1
|
CCT4
|
chaperonin containing TCP1, subunit 4 (delta) |
| chr6_+_47445467 | 8.98 |
ENST00000359314.5
|
CD2AP
|
CD2-associated protein |
| chr2_-_64881018 | 8.69 |
ENST00000313349.3
|
SERTAD2
|
SERTA domain containing 2 |
| chr7_-_86849883 | 8.09 |
ENST00000433078.1
|
TMEM243
|
transmembrane protein 243, mitochondrial |
| chr1_+_26496362 | 6.74 |
ENST00000374266.5
ENST00000270812.5 |
ZNF593
|
zinc finger protein 593 |
| chr11_-_6633799 | 6.33 |
ENST00000299424.4
|
TAF10
|
TAF10 RNA polymerase II, TATA box binding protein (TBP)-associated factor, 30kDa |
| chr6_+_139456226 | 6.30 |
ENST00000367658.2
|
HECA
|
headcase homolog (Drosophila) |
| chr17_-_80231300 | 6.14 |
ENST00000398519.5
ENST00000580446.1 |
CSNK1D
|
casein kinase 1, delta |
| chr14_+_105219437 | 6.11 |
ENST00000329967.6
ENST00000347067.5 ENST00000553810.1 |
SIVA1
|
SIVA1, apoptosis-inducing factor |
| chr6_-_53213780 | 6.01 |
ENST00000304434.6
ENST00000370918.4 |
ELOVL5
|
ELOVL fatty acid elongase 5 |
| chr4_-_122744998 | 5.93 |
ENST00000274026.5
|
CCNA2
|
cyclin A2 |
| chr3_-_156877997 | 5.92 |
ENST00000295926.3
|
CCNL1
|
cyclin L1 |
| chr11_+_4116054 | 5.85 |
ENST00000423050.2
|
RRM1
|
ribonucleotide reductase M1 |
| chr19_-_59066327 | 5.69 |
ENST00000596708.1
ENST00000601220.1 ENST00000597848.1 |
CHMP2A
|
charged multivesicular body protein 2A |
| chr11_+_4116005 | 5.62 |
ENST00000300738.5
|
RRM1
|
ribonucleotide reductase M1 |
| chr21_-_40720995 | 5.51 |
ENST00000380749.5
|
HMGN1
|
high mobility group nucleosome binding domain 1 |
| chr7_-_137686791 | 5.50 |
ENST00000452463.1
ENST00000330387.6 ENST00000456390.1 |
CREB3L2
|
cAMP responsive element binding protein 3-like 2 |
| chr14_-_50053081 | 5.43 |
ENST00000396020.3
ENST00000245458.6 |
RPS29
|
ribosomal protein S29 |
| chr19_-_59066452 | 5.30 |
ENST00000312547.2
|
CHMP2A
|
charged multivesicular body protein 2A |
| chr2_-_240964716 | 5.27 |
ENST00000404554.1
ENST00000407129.3 ENST00000307300.4 ENST00000443626.1 ENST00000252711.2 |
NDUFA10
|
NADH dehydrogenase (ubiquinone) 1 alpha subcomplex, 10, 42kDa |
| chr3_+_140660743 | 5.19 |
ENST00000453248.2
|
SLC25A36
|
solute carrier family 25 (pyrimidine nucleotide carrier ), member 36 |
| chr6_-_31774714 | 5.07 |
ENST00000375661.5
|
LSM2
|
LSM2 homolog, U6 small nuclear RNA associated (S. cerevisiae) |
| chr17_-_685559 | 4.99 |
ENST00000301329.6
|
GLOD4
|
glyoxalase domain containing 4 |
| chr21_-_40720974 | 4.91 |
ENST00000380748.1
|
HMGN1
|
high mobility group nucleosome binding domain 1 |
| chr17_-_685493 | 4.82 |
ENST00000536578.1
ENST00000301328.5 ENST00000576419.1 |
GLOD4
|
glyoxalase domain containing 4 |
| chr11_-_67276100 | 4.61 |
ENST00000301488.3
|
CDK2AP2
|
cyclin-dependent kinase 2 associated protein 2 |
| chr3_+_38206975 | 4.51 |
ENST00000446845.1
ENST00000311806.3 |
OXSR1
|
oxidative stress responsive 1 |
| chr22_-_38902300 | 4.44 |
ENST00000403230.1
|
DDX17
|
DEAD (Asp-Glu-Ala-Asp) box helicase 17 |
| chr17_+_7476136 | 4.32 |
ENST00000582169.1
ENST00000578754.1 ENST00000578495.1 ENST00000293831.8 ENST00000380512.5 ENST00000585024.1 ENST00000583802.1 ENST00000577269.1 ENST00000584784.1 ENST00000582746.1 |
EIF4A1
|
eukaryotic translation initiation factor 4A1 |
| chr6_-_144416737 | 4.13 |
ENST00000367569.2
|
SF3B5
|
splicing factor 3b, subunit 5, 10kDa |
| chr17_-_40540377 | 4.09 |
ENST00000404395.3
ENST00000389272.3 ENST00000585517.1 ENST00000588065.1 |
STAT3
|
signal transducer and activator of transcription 3 (acute-phase response factor) |
| chr10_+_95256356 | 3.97 |
ENST00000371485.3
|
CEP55
|
centrosomal protein 55kDa |
| chr1_-_32110467 | 3.95 |
ENST00000440872.2
ENST00000373703.4 |
PEF1
|
penta-EF-hand domain containing 1 |
| chrX_+_153672468 | 3.94 |
ENST00000393600.3
|
FAM50A
|
family with sequence similarity 50, member A |
| chr17_-_40540586 | 3.94 |
ENST00000264657.5
|
STAT3
|
signal transducer and activator of transcription 3 (acute-phase response factor) |
| chr19_+_54704610 | 3.88 |
ENST00000302907.4
|
RPS9
|
ribosomal protein S9 |
| chr3_-_185655795 | 3.79 |
ENST00000342294.4
ENST00000382191.4 ENST00000453386.2 |
TRA2B
|
transformer 2 beta homolog (Drosophila) |
| chr16_-_3767506 | 3.76 |
ENST00000538171.1
|
TRAP1
|
TNF receptor-associated protein 1 |
| chr19_+_54704990 | 3.70 |
ENST00000391753.2
|
RPS9
|
ribosomal protein S9 |
| chr17_-_80231557 | 3.66 |
ENST00000392334.2
ENST00000314028.6 |
CSNK1D
|
casein kinase 1, delta |
| chr1_+_39456895 | 3.55 |
ENST00000432648.3
ENST00000446189.2 ENST00000372984.4 |
AKIRIN1
|
akirin 1 |
| chr5_+_133707252 | 3.54 |
ENST00000506787.1
ENST00000507277.1 |
UBE2B
|
ubiquitin-conjugating enzyme E2B |
| chr1_-_16482554 | 3.47 |
ENST00000358432.5
|
EPHA2
|
EPH receptor A2 |
| chr16_-_3767551 | 3.45 |
ENST00000246957.5
|
TRAP1
|
TNF receptor-associated protein 1 |
| chr11_-_3818688 | 3.39 |
ENST00000355260.3
ENST00000397004.4 ENST00000397007.4 ENST00000532475.1 |
NUP98
|
nucleoporin 98kDa |
| chr4_-_104119528 | 3.14 |
ENST00000380026.3
ENST00000503705.1 ENST00000265148.3 |
CENPE
|
centromere protein E, 312kDa |
| chr22_-_38902325 | 2.97 |
ENST00000396821.3
ENST00000381633.3 |
DDX17
|
DEAD (Asp-Glu-Ala-Asp) box helicase 17 |
| chr4_+_47487285 | 2.92 |
ENST00000273859.3
ENST00000504445.1 |
ATP10D
|
ATPase, class V, type 10D |
| chr11_-_3818932 | 2.86 |
ENST00000324932.7
ENST00000359171.4 |
NUP98
|
nucleoporin 98kDa |
| chr4_-_54930790 | 2.83 |
ENST00000263921.3
|
CHIC2
|
cysteine-rich hydrophobic domain 2 |
| chr17_-_40540484 | 2.52 |
ENST00000588969.1
|
STAT3
|
signal transducer and activator of transcription 3 (acute-phase response factor) |
| chr4_-_76598544 | 2.50 |
ENST00000515457.1
ENST00000357854.3 |
G3BP2
|
GTPase activating protein (SH3 domain) binding protein 2 |
| chr22_-_41252962 | 2.44 |
ENST00000216218.3
|
ST13
|
suppression of tumorigenicity 13 (colon carcinoma) (Hsp70 interacting protein) |
| chr19_+_54704718 | 2.28 |
ENST00000391752.1
ENST00000402367.1 ENST00000391751.3 |
RPS9
|
ribosomal protein S9 |
| chr14_-_23388338 | 2.26 |
ENST00000555209.1
ENST00000554256.1 ENST00000557403.1 ENST00000557549.1 ENST00000555676.1 ENST00000557571.1 ENST00000557464.1 ENST00000554618.1 ENST00000556862.1 ENST00000555722.1 ENST00000346528.5 ENST00000542016.2 ENST00000399922.2 ENST00000557227.1 ENST00000359890.3 |
RBM23
|
RNA binding motif protein 23 |
| chr4_+_75311019 | 2.26 |
ENST00000502307.1
|
AREG
|
amphiregulin |
| chr6_+_64281906 | 2.18 |
ENST00000370651.3
|
PTP4A1
|
protein tyrosine phosphatase type IVA, member 1 |
| chr3_+_140660634 | 2.17 |
ENST00000446041.2
ENST00000507429.1 ENST00000324194.6 |
SLC25A36
|
solute carrier family 25 (pyrimidine nucleotide carrier ), member 36 |
| chr4_+_75310851 | 2.16 |
ENST00000395748.3
ENST00000264487.2 |
AREG
|
amphiregulin |
| chr4_+_1873100 | 2.06 |
ENST00000508803.1
|
WHSC1
|
Wolf-Hirschhorn syndrome candidate 1 |
| chr8_-_29208183 | 2.02 |
ENST00000240100.2
|
DUSP4
|
dual specificity phosphatase 4 |
| chr1_+_212208919 | 2.00 |
ENST00000366991.4
ENST00000542077.1 |
DTL
|
denticleless E3 ubiquitin protein ligase homolog (Drosophila) |
| chr11_-_8680383 | 1.85 |
ENST00000299550.6
|
TRIM66
|
tripartite motif containing 66 |
| chr15_+_50716576 | 1.83 |
ENST00000560297.1
ENST00000307179.4 ENST00000396444.3 ENST00000433963.1 ENST00000425032.3 |
USP8
|
ubiquitin specific peptidase 8 |
| chr3_+_101292939 | 1.82 |
ENST00000265260.3
ENST00000469941.1 ENST00000296024.5 |
PCNP
|
PEST proteolytic signal containing nuclear protein |
| chr11_-_33183006 | 1.78 |
ENST00000524827.1
ENST00000323959.4 ENST00000431742.2 |
CSTF3
|
cleavage stimulation factor, 3' pre-RNA, subunit 3, 77kDa |
| chr22_+_39101728 | 1.75 |
ENST00000216044.5
ENST00000484657.1 |
GTPBP1
|
GTP binding protein 1 |
| chr11_-_77185094 | 1.69 |
ENST00000278568.4
ENST00000356341.3 |
PAK1
|
p21 protein (Cdc42/Rac)-activated kinase 1 |
| chr1_+_110527308 | 1.68 |
ENST00000369799.5
|
AHCYL1
|
adenosylhomocysteinase-like 1 |
| chr7_-_129592471 | 1.62 |
ENST00000473814.2
ENST00000490974.1 |
UBE2H
|
ubiquitin-conjugating enzyme E2H |
| chr8_-_95274536 | 1.61 |
ENST00000297596.2
ENST00000396194.2 |
GEM
|
GTP binding protein overexpressed in skeletal muscle |
| chr11_+_3819049 | 1.59 |
ENST00000396986.2
ENST00000300730.6 ENST00000532535.1 ENST00000396993.4 ENST00000396991.2 ENST00000532523.1 ENST00000459679.1 ENST00000464261.1 ENST00000464906.2 ENST00000464441.1 |
PGAP2
|
post-GPI attachment to proteins 2 |
| chr19_+_54705025 | 1.57 |
ENST00000441429.1
|
RPS9
|
ribosomal protein S9 |
| chr7_-_129592700 | 1.39 |
ENST00000472396.1
ENST00000355621.3 |
UBE2H
|
ubiquitin-conjugating enzyme E2H |
| chr2_+_202899310 | 1.36 |
ENST00000286201.1
|
FZD7
|
frizzled family receptor 7 |
| chr17_+_685513 | 1.31 |
ENST00000304478.4
|
RNMTL1
|
RNA methyltransferase like 1 |
| chr6_-_29595779 | 1.28 |
ENST00000355973.3
ENST00000377012.4 |
GABBR1
|
gamma-aminobutyric acid (GABA) B receptor, 1 |
| chr17_-_7165662 | 1.24 |
ENST00000571881.2
ENST00000360325.7 |
CLDN7
|
claudin 7 |
| chr12_-_93836028 | 0.95 |
ENST00000318066.2
|
UBE2N
|
ubiquitin-conjugating enzyme E2N |
| chr12_+_122516626 | 0.93 |
ENST00000319080.7
|
MLXIP
|
MLX interacting protein |
| chr6_-_27440837 | 0.88 |
ENST00000211936.6
|
ZNF184
|
zinc finger protein 184 |
| chr6_+_64282447 | 0.85 |
ENST00000370650.2
ENST00000578299.1 |
PTP4A1
|
protein tyrosine phosphatase type IVA, member 1 |
| chr10_-_119134918 | 0.83 |
ENST00000334464.5
|
PDZD8
|
PDZ domain containing 8 |
| chr19_+_45504688 | 0.82 |
ENST00000221452.8
ENST00000540120.1 ENST00000505236.1 |
RELB
|
v-rel avian reticuloendotheliosis viral oncogene homolog B |
| chr6_-_53213587 | 0.75 |
ENST00000542638.1
ENST00000370913.5 ENST00000541407.1 |
ELOVL5
|
ELOVL fatty acid elongase 5 |
| chr3_+_150126101 | 0.66 |
ENST00000361875.3
ENST00000361136.2 |
TSC22D2
|
TSC22 domain family, member 2 |
| chr5_+_133706865 | 0.56 |
ENST00000265339.2
|
UBE2B
|
ubiquitin-conjugating enzyme E2B |
| chr1_-_47184745 | 0.53 |
ENST00000544071.1
|
EFCAB14
|
EF-hand calcium binding domain 14 |
| chr6_-_27440460 | 0.51 |
ENST00000377419.1
|
ZNF184
|
zinc finger protein 184 |
| chr6_+_33176265 | 0.44 |
ENST00000374656.4
|
RING1
|
ring finger protein 1 |
| chr17_+_7211656 | 0.37 |
ENST00000416016.2
|
EIF5A
|
eukaryotic translation initiation factor 5A |
| chr19_+_13858593 | 0.32 |
ENST00000221554.8
|
CCDC130
|
coiled-coil domain containing 130 |
| chr1_-_47184723 | 0.30 |
ENST00000371933.3
|
EFCAB14
|
EF-hand calcium binding domain 14 |
| chr12_-_93835665 | 0.25 |
ENST00000552442.1
ENST00000550657.1 |
UBE2N
|
ubiquitin-conjugating enzyme E2N |
| chr1_+_109289279 | 0.23 |
ENST00000370008.3
|
STXBP3
|
syntaxin binding protein 3 |
| chr3_-_107941230 | 0.22 |
ENST00000264538.3
|
IFT57
|
intraflagellar transport 57 homolog (Chlamydomonas) |
| chr4_-_186456652 | 0.13 |
ENST00000284767.5
ENST00000284770.5 |
PDLIM3
|
PDZ and LIM domain 3 |
| chr4_-_111558135 | 0.10 |
ENST00000394598.2
ENST00000394595.3 |
PITX2
|
paired-like homeodomain 2 |
| chr15_-_41047421 | 0.07 |
ENST00000560460.1
ENST00000338376.3 ENST00000560905.1 |
RMDN3
|
regulator of microtubule dynamics 3 |
| chr17_+_35294075 | 0.06 |
ENST00000254457.5
|
LHX1
|
LIM homeobox 1 |
| chr4_-_186456766 | 0.05 |
ENST00000284771.6
|
PDLIM3
|
PDZ and LIM domain 3 |
| chr10_-_64576105 | 0.04 |
ENST00000242480.3
ENST00000411732.1 |
EGR2
|
early growth response 2 |
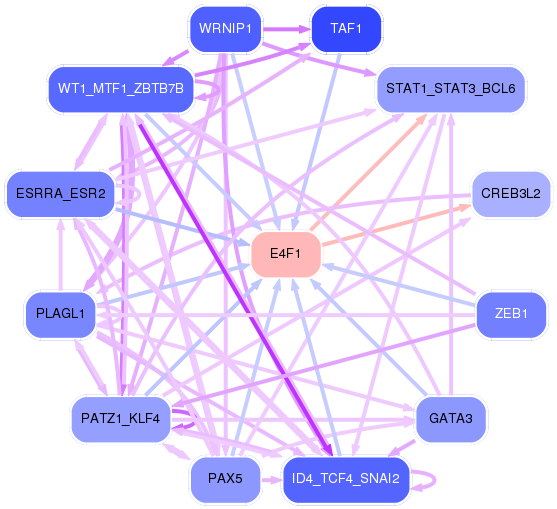
Network of associatons between targets according to the STRING database.

First level regulatory network of E4F1
Gene Ontology Analysis
Gene overrepresentation in biological_process category:
| Log-likelihood per target | Total log-likelihood | Term | Description |
|---|---|---|---|
| 3.7 | 11.0 | GO:1903722 | regulation of centriole elongation(GO:1903722) |
| 3.0 | 9.0 | GO:0032911 | negative regulation of transforming growth factor beta1 production(GO:0032911) |
| 2.6 | 10.5 | GO:0010730 | negative regulation of hydrogen peroxide biosynthetic process(GO:0010730) |
| 1.9 | 11.4 | GO:0045903 | positive regulation of translational fidelity(GO:0045903) |
| 1.8 | 18.5 | GO:0090666 | scaRNA localization to Cajal body(GO:0090666) |
| 1.8 | 7.2 | GO:0009386 | translational attenuation(GO:0009386) |
| 1.5 | 4.5 | GO:2000681 | negative regulation of rubidium ion transport(GO:2000681) negative regulation of rubidium ion transmembrane transporter activity(GO:2000687) |
| 1.5 | 5.9 | GO:0071373 | cellular response to cocaine(GO:0071314) cellular response to luteinizing hormone stimulus(GO:0071373) |
| 1.4 | 4.1 | GO:0010845 | positive regulation of reciprocal meiotic recombination(GO:0010845) |
| 1.2 | 6.2 | GO:0000973 | posttranscriptional tethering of RNA polymerase II gene DNA at nuclear periphery(GO:0000973) |
| 1.2 | 3.5 | GO:1901491 | negative regulation of lymphangiogenesis(GO:1901491) |
| 1.1 | 6.8 | GO:0019367 | fatty acid elongation, saturated fatty acid(GO:0019367) fatty acid elongation, unsaturated fatty acid(GO:0019368) fatty acid elongation, monounsaturated fatty acid(GO:0034625) fatty acid elongation, polyunsaturated fatty acid(GO:0034626) |
| 0.9 | 3.8 | GO:0021796 | cerebral cortex regionalization(GO:0021796) |
| 0.9 | 4.6 | GO:2000035 | regulation of stem cell division(GO:2000035) |
| 0.8 | 6.7 | GO:0000055 | ribosomal large subunit export from nucleus(GO:0000055) negative regulation of RNA polymerase II regulatory region sequence-specific DNA binding(GO:1903026) |
| 0.8 | 2.3 | GO:0006864 | pyrimidine nucleotide transport(GO:0006864) mitochondrial pyrimidine nucleotide import(GO:1990519) |
| 0.7 | 1.4 | GO:0009996 | negative regulation of cell fate specification(GO:0009996) |
| 0.6 | 5.9 | GO:1901409 | positive regulation of phosphorylation of RNA polymerase II C-terminal domain(GO:1901409) |
| 0.6 | 3.9 | GO:1902527 | positive regulation of protein monoubiquitination(GO:1902527) |
| 0.6 | 4.4 | GO:0042695 | thelarche(GO:0042695) mammary gland branching involved in thelarche(GO:0060744) |
| 0.5 | 9.8 | GO:2000052 | positive regulation of non-canonical Wnt signaling pathway(GO:2000052) |
| 0.5 | 1.6 | GO:1901842 | negative regulation of high voltage-gated calcium channel activity(GO:1901842) |
| 0.5 | 3.1 | GO:0007079 | mitotic chromosome movement towards spindle pole(GO:0007079) |
| 0.5 | 9.1 | GO:0033148 | positive regulation of intracellular estrogen receptor signaling pathway(GO:0033148) |
| 0.5 | 11.5 | GO:0009263 | deoxyribonucleotide biosynthetic process(GO:0009263) |
| 0.5 | 6.3 | GO:0070365 | hepatocyte differentiation(GO:0070365) |
| 0.4 | 2.4 | GO:0061084 | regulation of protein refolding(GO:0061083) negative regulation of protein refolding(GO:0061084) |
| 0.4 | 10.4 | GO:0032786 | positive regulation of DNA-templated transcription, elongation(GO:0032786) |
| 0.3 | 29.1 | GO:0006521 | regulation of cellular amino acid metabolic process(GO:0006521) |
| 0.3 | 4.0 | GO:0000920 | cell separation after cytokinesis(GO:0000920) |
| 0.2 | 1.7 | GO:0033353 | S-adenosylmethionine cycle(GO:0033353) |
| 0.1 | 5.1 | GO:0043928 | exonucleolytic nuclear-transcribed mRNA catabolic process involved in deadenylation-dependent decay(GO:0043928) |
| 0.1 | 1.7 | GO:0061014 | positive regulation of mRNA catabolic process(GO:0061014) |
| 0.1 | 2.9 | GO:0045332 | lipid translocation(GO:0034204) phospholipid translocation(GO:0045332) |
| 0.1 | 10.2 | GO:0030148 | sphingolipid biosynthetic process(GO:0030148) |
| 0.1 | 1.2 | GO:0033182 | regulation of histone ubiquitination(GO:0033182) |
| 0.1 | 4.3 | GO:0000289 | nuclear-transcribed mRNA poly(A) tail shortening(GO:0000289) |
| 0.1 | 5.3 | GO:0006120 | mitochondrial electron transport, NADH to ubiquinone(GO:0006120) |
| 0.1 | 3.0 | GO:0070979 | protein K11-linked ubiquitination(GO:0070979) |
| 0.1 | 0.1 | GO:0060067 | cervix development(GO:0060067) |
| 0.1 | 1.3 | GO:0071108 | protein K48-linked deubiquitination(GO:0071108) |
| 0.1 | 1.8 | GO:0006379 | mRNA cleavage(GO:0006379) |
| 0.1 | 2.8 | GO:0006893 | Golgi to plasma membrane transport(GO:0006893) |
| 0.0 | 0.8 | GO:0032688 | negative regulation of interferon-beta production(GO:0032688) |
| 0.0 | 0.4 | GO:0045905 | translational frameshifting(GO:0006452) positive regulation of translational termination(GO:0045905) |
| 0.0 | 1.6 | GO:0006506 | GPI anchor biosynthetic process(GO:0006506) |
| 0.0 | 1.2 | GO:0016338 | calcium-independent cell-cell adhesion via plasma membrane cell-adhesion molecules(GO:0016338) |
| 0.0 | 2.0 | GO:0019985 | translesion synthesis(GO:0019985) |
| 0.0 | 6.1 | GO:0046718 | viral entry into host cell(GO:0046718) |
| 0.0 | 5.5 | GO:0002062 | chondrocyte differentiation(GO:0002062) |
| 0.0 | 5.4 | GO:0006614 | SRP-dependent cotranslational protein targeting to membrane(GO:0006614) |
| 0.0 | 0.1 | GO:0035993 | subthalamic nucleus development(GO:0021763) deltoid tuberosity development(GO:0035993) prolactin secreting cell differentiation(GO:0060127) left lung morphogenesis(GO:0060460) pulmonary vein morphogenesis(GO:0060577) superior vena cava morphogenesis(GO:0060578) |
| 0.0 | 6.3 | GO:0030323 | respiratory tube development(GO:0030323) |
| 0.0 | 1.3 | GO:0007214 | gamma-aminobutyric acid signaling pathway(GO:0007214) |
| 0.0 | 0.4 | GO:0035518 | histone H2A monoubiquitination(GO:0035518) |
| 0.0 | 2.0 | GO:0070373 | negative regulation of ERK1 and ERK2 cascade(GO:0070373) |
| 0.0 | 0.2 | GO:0022615 | protein to membrane docking(GO:0022615) |
| 0.0 | 0.2 | GO:0060972 | left/right pattern formation(GO:0060972) |
| 0.0 | 0.0 | GO:0021571 | rhombomere 3 development(GO:0021569) rhombomere 5 development(GO:0021571) central nervous system segmentation(GO:0035283) brain segmentation(GO:0035284) |
| 0.0 | 0.8 | GO:0022604 | regulation of cell morphogenesis(GO:0022604) |
Gene overrepresentation in cellular_component category:
| Log-likelihood per target | Total log-likelihood | Term | Description |
|---|---|---|---|
| 3.6 | 29.1 | GO:1990111 | spermatoproteasome complex(GO:1990111) |
| 2.9 | 11.5 | GO:0005971 | ribonucleoside-diphosphate reductase complex(GO:0005971) |
| 2.3 | 6.8 | GO:0097447 | dendritic tree(GO:0097447) |
| 2.0 | 5.9 | GO:0097124 | cyclin A2-CDK2 complex(GO:0097124) |
| 1.4 | 18.5 | GO:0002199 | zona pellucida receptor complex(GO:0002199) |
| 1.0 | 6.2 | GO:0044614 | nuclear pore cytoplasmic filaments(GO:0044614) |
| 0.8 | 11.0 | GO:0000815 | ESCRT III complex(GO:0000815) |
| 0.8 | 4.1 | GO:0033503 | HULC complex(GO:0033503) |
| 0.7 | 5.1 | GO:1990726 | Lsm1-7-Pat1 complex(GO:1990726) |
| 0.7 | 6.3 | GO:0000125 | PCAF complex(GO:0000125) |
| 0.4 | 1.3 | GO:0038039 | G-protein coupled receptor heterodimeric complex(GO:0038039) |
| 0.4 | 1.2 | GO:0031372 | UBC13-MMS2 complex(GO:0031372) |
| 0.3 | 1.8 | GO:0031313 | extrinsic component of endosome membrane(GO:0031313) |
| 0.3 | 4.3 | GO:0016281 | eukaryotic translation initiation factor 4F complex(GO:0016281) |
| 0.3 | 4.0 | GO:0090543 | Flemming body(GO:0090543) |
| 0.3 | 3.1 | GO:0000940 | condensed chromosome outer kinetochore(GO:0000940) |
| 0.2 | 2.0 | GO:0031465 | Cul4B-RING E3 ubiquitin ligase complex(GO:0031465) |
| 0.2 | 16.9 | GO:0022627 | cytosolic small ribosomal subunit(GO:0022627) |
| 0.2 | 6.7 | GO:0030687 | preribosome, large subunit precursor(GO:0030687) |
| 0.2 | 4.1 | GO:0005686 | U2 snRNP(GO:0005686) |
| 0.2 | 3.9 | GO:0030127 | COPII vesicle coat(GO:0030127) |
| 0.2 | 14.2 | GO:0033116 | endoplasmic reticulum-Golgi intermediate compartment membrane(GO:0033116) |
| 0.1 | 5.9 | GO:0000307 | cyclin-dependent protein kinase holoenzyme complex(GO:0000307) |
| 0.1 | 1.7 | GO:0000177 | cytoplasmic exosome (RNase complex)(GO:0000177) |
| 0.1 | 3.5 | GO:0031258 | lamellipodium membrane(GO:0031258) |
| 0.1 | 7.2 | GO:0005811 | lipid particle(GO:0005811) |
| 0.1 | 5.3 | GO:0045271 | mitochondrial respiratory chain complex I(GO:0005747) NADH dehydrogenase complex(GO:0030964) respiratory chain complex I(GO:0045271) |
| 0.1 | 1.7 | GO:0071437 | invadopodium(GO:0071437) |
| 0.1 | 0.8 | GO:0033256 | I-kappaB/NF-kappaB complex(GO:0033256) |
| 0.1 | 1.6 | GO:0051233 | spindle midzone(GO:0051233) |
| 0.0 | 0.4 | GO:0005642 | annulate lamellae(GO:0005642) |
| 0.0 | 0.4 | GO:0001739 | sex chromatin(GO:0001739) |
| 0.0 | 1.2 | GO:0016327 | apicolateral plasma membrane(GO:0016327) |
| 0.0 | 1.8 | GO:0016235 | aggresome(GO:0016235) |
| 0.0 | 2.8 | GO:0005798 | Golgi-associated vesicle(GO:0005798) |
| 0.0 | 1.4 | GO:0055038 | recycling endosome membrane(GO:0055038) |
| 0.0 | 18.6 | GO:0000785 | chromatin(GO:0000785) |
| 0.0 | 9.0 | GO:0030139 | endocytic vesicle(GO:0030139) |
| 0.0 | 0.2 | GO:0044292 | dendrite terminus(GO:0044292) |
| 0.0 | 0.9 | GO:0019867 | mitochondrial outer membrane(GO:0005741) outer membrane(GO:0019867) organelle outer membrane(GO:0031968) |
| 0.0 | 3.0 | GO:0009898 | cytoplasmic side of plasma membrane(GO:0009898) |
| 0.0 | 11.4 | GO:0005789 | endoplasmic reticulum membrane(GO:0005789) |
| 0.0 | 4.7 | GO:0005874 | microtubule(GO:0005874) |
Gene overrepresentation in molecular_function category:
| Log-likelihood per target | Total log-likelihood | Term | Description |
|---|---|---|---|
| 2.9 | 11.5 | GO:0004748 | ribonucleoside-diphosphate reductase activity, thioredoxin disulfide as acceptor(GO:0004748) oxidoreductase activity, acting on CH or CH2 groups, disulfide as acceptor(GO:0016728) ribonucleoside-diphosphate reductase activity(GO:0061731) |
| 2.2 | 6.7 | GO:0031177 | acyl binding(GO:0000035) phosphopantetheine binding(GO:0031177) |
| 1.4 | 11.4 | GO:1990932 | 5.8S rRNA binding(GO:1990932) |
| 1.1 | 6.8 | GO:0102336 | fatty acid elongase activity(GO:0009922) 3-oxo-arachidoyl-CoA synthase activity(GO:0102336) 3-oxo-cerotoyl-CoA synthase activity(GO:0102337) 3-oxo-lignoceronyl-CoA synthase activity(GO:0102338) |
| 1.1 | 10.5 | GO:0031730 | CCR5 chemokine receptor binding(GO:0031730) |
| 1.0 | 29.1 | GO:0070003 | threonine-type endopeptidase activity(GO:0004298) threonine-type peptidase activity(GO:0070003) |
| 0.8 | 3.1 | GO:0043515 | kinetochore binding(GO:0043515) |
| 0.8 | 2.3 | GO:0015218 | pyrimidine nucleotide transmembrane transporter activity(GO:0015218) |
| 0.7 | 2.0 | GO:0008330 | protein tyrosine/threonine phosphatase activity(GO:0008330) |
| 0.6 | 9.0 | GO:0005172 | vascular endothelial growth factor receptor binding(GO:0005172) |
| 0.5 | 18.5 | GO:0044183 | protein binding involved in protein folding(GO:0044183) |
| 0.4 | 9.8 | GO:0050321 | tau-protein kinase activity(GO:0050321) |
| 0.4 | 1.3 | GO:0004965 | G-protein coupled GABA receptor activity(GO:0004965) |
| 0.4 | 2.4 | GO:0032564 | adenyl deoxyribonucleotide binding(GO:0032558) dATP binding(GO:0032564) |
| 0.4 | 11.0 | GO:0031210 | phosphatidylcholine binding(GO:0031210) |
| 0.3 | 5.1 | GO:0017160 | Ral GTPase binding(GO:0017160) |
| 0.3 | 1.7 | GO:0016802 | adenosylhomocysteinase activity(GO:0004013) trialkylsulfonium hydrolase activity(GO:0016802) |
| 0.3 | 13.3 | GO:0005164 | tumor necrosis factor receptor binding(GO:0005164) |
| 0.3 | 5.5 | GO:0035497 | cAMP response element binding(GO:0035497) |
| 0.2 | 10.4 | GO:0031492 | nucleosomal DNA binding(GO:0031492) |
| 0.2 | 6.2 | GO:0017056 | structural constituent of nuclear pore(GO:0017056) |
| 0.2 | 13.7 | GO:0030331 | estrogen receptor binding(GO:0030331) |
| 0.2 | 4.3 | GO:0000339 | RNA cap binding(GO:0000339) |
| 0.2 | 7.1 | GO:0061631 | ubiquitin conjugating enzyme activity(GO:0061631) |
| 0.1 | 5.9 | GO:0016538 | cyclin-dependent protein serine/threonine kinase regulator activity(GO:0016538) |
| 0.1 | 2.9 | GO:0004012 | phospholipid-translocating ATPase activity(GO:0004012) |
| 0.1 | 4.4 | GO:0005154 | epidermal growth factor receptor binding(GO:0005154) |
| 0.1 | 3.8 | GO:0070717 | poly-purine tract binding(GO:0070717) |
| 0.1 | 5.3 | GO:0008137 | NADH dehydrogenase (ubiquinone) activity(GO:0008137) NADH dehydrogenase (quinone) activity(GO:0050136) |
| 0.1 | 3.9 | GO:0004198 | calcium-dependent cysteine-type endopeptidase activity(GO:0004198) |
| 0.1 | 10.2 | GO:0051219 | phosphoprotein binding(GO:0051219) |
| 0.1 | 0.4 | GO:0097027 | ubiquitin-protein transferase activator activity(GO:0097027) |
| 0.1 | 3.4 | GO:0097472 | cyclin-dependent protein kinase activity(GO:0097472) |
| 0.1 | 1.4 | GO:0042813 | Wnt-activated receptor activity(GO:0042813) |
| 0.0 | 3.5 | GO:0001618 | virus receptor activity(GO:0001618) |
| 0.0 | 1.2 | GO:0050839 | cell adhesion molecule binding(GO:0050839) |
| 0.0 | 6.1 | GO:0000287 | magnesium ion binding(GO:0000287) |
| 0.0 | 5.4 | GO:0003735 | structural constituent of ribosome(GO:0003735) |
| 0.0 | 0.7 | GO:0003700 | nucleic acid binding transcription factor activity(GO:0001071) transcription factor activity, sequence-specific DNA binding(GO:0003700) |
| 0.0 | 1.7 | GO:0048365 | Rac GTPase binding(GO:0048365) |
| 0.0 | 0.4 | GO:0017070 | U6 snRNA binding(GO:0017070) |
| 0.0 | 1.3 | GO:0004843 | thiol-dependent ubiquitin-specific protease activity(GO:0004843) |
| 0.0 | 1.6 | GO:0008565 | protein transporter activity(GO:0008565) |
Gene overrepresentation in C2:CP category:
| Log-likelihood per target | Total log-likelihood | Term | Description |
|---|---|---|---|
| 0.6 | 10.5 | ST STAT3 PATHWAY | STAT3 Pathway |
| 0.3 | 9.8 | PID BETA CATENIN DEG PATHWAY | Degradation of beta catenin |
| 0.3 | 9.0 | PID PRL SIGNALING EVENTS PATHWAY | Signaling events mediated by PRL |
| 0.2 | 9.0 | PID VEGFR1 PATHWAY | VEGFR1 specific signals |
| 0.2 | 5.2 | PID EPHA2 FWD PATHWAY | EPHA2 forward signaling |
| 0.2 | 10.2 | PID HEDGEHOG GLI PATHWAY | Hedgehog signaling events mediated by Gli proteins |
| 0.1 | 4.4 | PID ERBB NETWORK PATHWAY | ErbB receptor signaling network |
| 0.1 | 6.3 | PID MYC PATHWAY | C-MYC pathway |
| 0.1 | 11.5 | PID E2F PATHWAY | E2F transcription factor network |
| 0.1 | 7.4 | PID ERA GENOMIC PATHWAY | Validated nuclear estrogen receptor alpha network |
| 0.0 | 1.4 | PID WNT SIGNALING PATHWAY | Wnt signaling network |
| 0.0 | 1.8 | PID ERBB2 ERBB3 PATHWAY | ErbB2/ErbB3 signaling events |
| 0.0 | 2.0 | ST JNK MAPK PATHWAY | JNK MAPK Pathway |
| 0.0 | 1.2 | PID ATM PATHWAY | ATM pathway |
Gene overrepresentation in C2:CP:REACTOME category:
| Log-likelihood per target | Total log-likelihood | Term | Description |
|---|---|---|---|
| 0.6 | 18.5 | REACTOME FORMATION OF TUBULIN FOLDING INTERMEDIATES BY CCT TRIC | Genes involved in Formation of tubulin folding intermediates by CCT/TriC |
| 0.6 | 10.5 | REACTOME IL 6 SIGNALING | Genes involved in Interleukin-6 signaling |
| 0.4 | 11.0 | REACTOME ENDOSOMAL SORTING COMPLEX REQUIRED FOR TRANSPORT ESCRT | Genes involved in Endosomal Sorting Complex Required For Transport (ESCRT) |
| 0.4 | 29.1 | REACTOME CDK MEDIATED PHOSPHORYLATION AND REMOVAL OF CDC6 | Genes involved in CDK-mediated phosphorylation and removal of Cdc6 |
| 0.4 | 6.8 | REACTOME ALPHA LINOLENIC ACID ALA METABOLISM | Genes involved in alpha-linolenic acid (ALA) metabolism |
| 0.3 | 5.1 | REACTOME MRNA DECAY BY 5 TO 3 EXORIBONUCLEASE | Genes involved in mRNA Decay by 5' to 3' Exoribonuclease |
| 0.3 | 11.5 | REACTOME SYNTHESIS AND INTERCONVERSION OF NUCLEOTIDE DI AND TRIPHOSPHATES | Genes involved in Synthesis and interconversion of nucleotide di- and triphosphates |
| 0.3 | 10.2 | REACTOME SPHINGOLIPID DE NOVO BIOSYNTHESIS | Genes involved in Sphingolipid de novo biosynthesis |
| 0.3 | 5.9 | REACTOME SCFSKP2 MEDIATED DEGRADATION OF P27 P21 | Genes involved in SCF(Skp2)-mediated degradation of p27/p21 |
| 0.3 | 9.0 | REACTOME NEPHRIN INTERACTIONS | Genes involved in Nephrin interactions |
| 0.2 | 16.9 | REACTOME FORMATION OF THE TERNARY COMPLEX AND SUBSEQUENTLY THE 43S COMPLEX | Genes involved in Formation of the ternary complex, and subsequently, the 43S complex |
| 0.2 | 4.3 | REACTOME ACTIVATION OF THE MRNA UPON BINDING OF THE CAP BINDING COMPLEX AND EIFS AND SUBSEQUENT BINDING TO 43S | Genes involved in Activation of the mRNA upon binding of the cap-binding complex and eIFs, and subsequent binding to 43S |
| 0.1 | 9.8 | REACTOME CIRCADIAN CLOCK | Genes involved in Circadian Clock |
| 0.1 | 1.2 | REACTOME IRAK1 RECRUITS IKK COMPLEX | Genes involved in IRAK1 recruits IKK complex |
| 0.1 | 1.8 | REACTOME PROCESSING OF INTRONLESS PRE MRNAS | Genes involved in Processing of Intronless Pre-mRNAs |
| 0.1 | 1.7 | REACTOME DSCAM INTERACTIONS | Genes involved in DSCAM interactions |
| 0.1 | 4.1 | REACTOME MRNA SPLICING MINOR PATHWAY | Genes involved in mRNA Splicing - Minor Pathway |
| 0.1 | 1.8 | REACTOME DOWNREGULATION OF ERBB2 ERBB3 SIGNALING | Genes involved in Downregulation of ERBB2:ERBB3 signaling |
| 0.1 | 1.3 | REACTOME CLASS C 3 METABOTROPIC GLUTAMATE PHEROMONE RECEPTORS | Genes involved in Class C/3 (Metabotropic glutamate/pheromone receptors) |
| 0.1 | 5.3 | REACTOME RESPIRATORY ELECTRON TRANSPORT | Genes involved in Respiratory electron transport |
| 0.1 | 2.9 | REACTOME ION TRANSPORT BY P TYPE ATPASES | Genes involved in Ion transport by P-type ATPases |
| 0.0 | 1.3 | REACTOME RNA POL II TRANSCRIPTION PRE INITIATION AND PROMOTER OPENING | Genes involved in RNA Polymerase II Transcription Pre-Initiation And Promoter Opening |
| 0.0 | 1.2 | REACTOME TIGHT JUNCTION INTERACTIONS | Genes involved in Tight junction interactions |
| 0.0 | 3.9 | REACTOME ANTIGEN PROCESSING UBIQUITINATION PROTEASOME DEGRADATION | Genes involved in Antigen processing: Ubiquitination & Proteasome degradation |
| 0.0 | 1.4 | REACTOME CLASS B 2 SECRETIN FAMILY RECEPTORS | Genes involved in Class B/2 (Secretin family receptors) |
| 0.0 | 0.4 | REACTOME PTM GAMMA CARBOXYLATION HYPUSINE FORMATION AND ARYLSULFATASE ACTIVATION | Genes involved in PTM: gamma carboxylation, hypusine formation and arylsulfatase activation |