Project
GNF SymAtlas + NCI-60 cancer cell lines, comparison of cancers vs non-cancers, human (Su, 2004; Ross, 2000)
Navigation
Downloads
Results for EN2_GBX2_LBX2
Z-value: 0.13
Motif logo
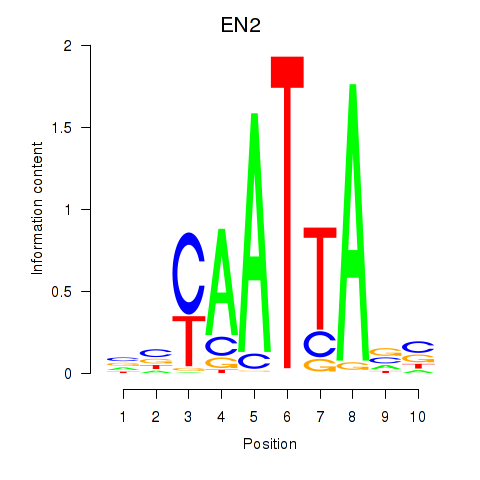
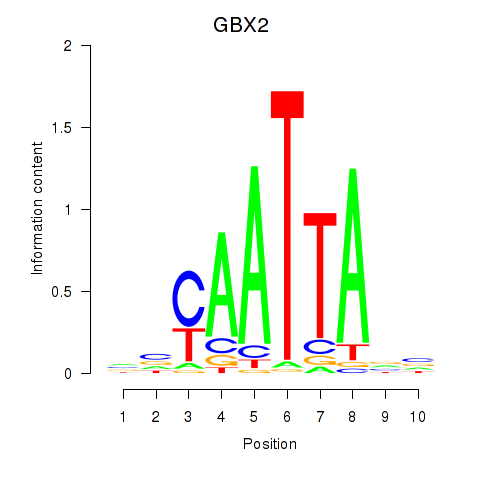
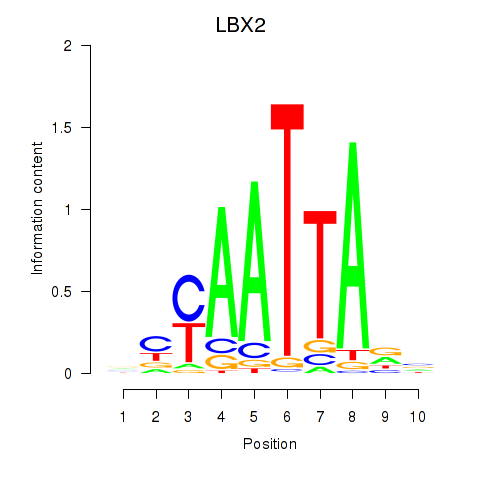
Transcription factors associated with EN2_GBX2_LBX2
| Gene Symbol | Gene ID | Gene Info |
|---|---|---|
|
EN2
|
ENSG00000164778.4 | engrailed homeobox 2 |
|
GBX2
|
ENSG00000168505.6 | gastrulation brain homeobox 2 |
|
LBX2
|
ENSG00000179528.11 | ladybird homeobox 2 |
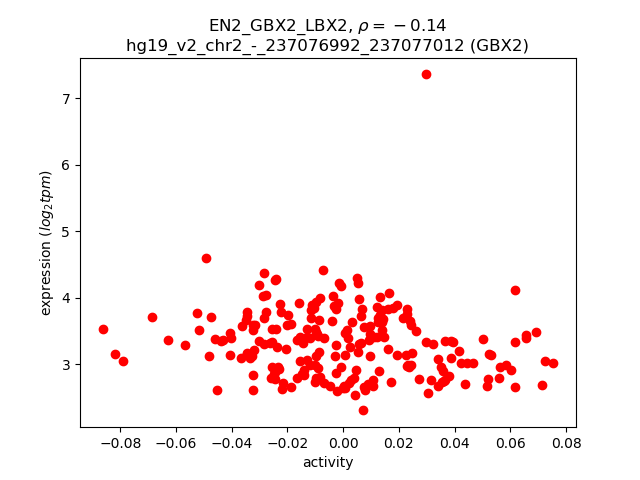
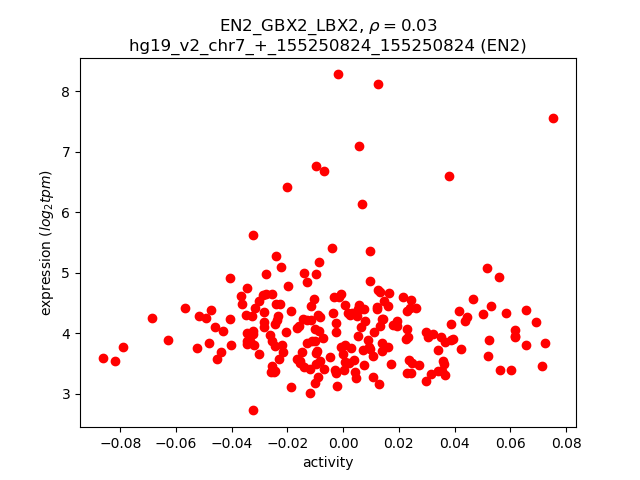
Activity-expression correlation:
| Gene | Promoter | Pearson corr. coef. | P-value | Plot |
|---|---|---|---|---|
| GBX2 | hg19_v2_chr2_-_237076992_237077012 | -0.14 | 3.5e-02 | Click! |
| EN2 | hg19_v2_chr7_+_155250824_155250824 | 0.03 | 7.1e-01 | Click! |
Activity profile of EN2_GBX2_LBX2 motif
Sorted Z-values of EN2_GBX2_LBX2 motif
| Promoter | Log-likelihood | Transcript | Gene | Gene Info |
|---|---|---|---|---|
| chr3_+_115342349 | 8.84 |
ENST00000393780.3
|
GAP43
|
growth associated protein 43 |
| chr2_-_224467093 | 8.34 |
ENST00000305409.2
|
SCG2
|
secretogranin II |
| chr16_-_29910853 | 7.65 |
ENST00000308713.5
|
SEZ6L2
|
seizure related 6 homolog (mouse)-like 2 |
| chr15_-_55563072 | 6.30 |
ENST00000567380.1
ENST00000565972.1 ENST00000569493.1 |
RAB27A
|
RAB27A, member RAS oncogene family |
| chr3_+_111718173 | 6.18 |
ENST00000494932.1
|
TAGLN3
|
transgelin 3 |
| chr15_-_55562479 | 6.06 |
ENST00000564609.1
|
RAB27A
|
RAB27A, member RAS oncogene family |
| chr15_-_37393406 | 5.88 |
ENST00000338564.5
ENST00000558313.1 ENST00000340545.5 |
MEIS2
|
Meis homeobox 2 |
| chrM_+_12331 | 5.48 |
ENST00000361567.2
|
MT-ND5
|
mitochondrially encoded NADH dehydrogenase 5 |
| chr3_+_111717600 | 5.36 |
ENST00000273368.4
|
TAGLN3
|
transgelin 3 |
| chr3_+_111718036 | 5.29 |
ENST00000455401.2
|
TAGLN3
|
transgelin 3 |
| chr3_+_111717511 | 5.21 |
ENST00000478951.1
ENST00000393917.2 |
TAGLN3
|
transgelin 3 |
| chr15_-_55562582 | 5.13 |
ENST00000396307.2
|
RAB27A
|
RAB27A, member RAS oncogene family |
| chr6_+_39760129 | 5.02 |
ENST00000274867.4
|
DAAM2
|
dishevelled associated activator of morphogenesis 2 |
| chr12_+_28410128 | 4.55 |
ENST00000381259.1
ENST00000381256.1 |
CCDC91
|
coiled-coil domain containing 91 |
| chr7_+_77428149 | 4.00 |
ENST00000415251.2
ENST00000275575.7 |
PHTF2
|
putative homeodomain transcription factor 2 |
| chr3_+_167453493 | 3.44 |
ENST00000295777.5
ENST00000472747.2 |
SERPINI1
|
serpin peptidase inhibitor, clade I (neuroserpin), member 1 |
| chr1_+_101003687 | 3.26 |
ENST00000315033.4
|
GPR88
|
G protein-coupled receptor 88 |
| chr6_-_111927062 | 3.15 |
ENST00000359831.4
|
TRAF3IP2
|
TRAF3 interacting protein 2 |
| chr8_+_105235572 | 3.13 |
ENST00000523362.1
|
RIMS2
|
regulating synaptic membrane exocytosis 2 |
| chr18_-_33709268 | 2.94 |
ENST00000269187.5
ENST00000590986.1 ENST00000440549.2 |
SLC39A6
|
solute carrier family 39 (zinc transporter), member 6 |
| chr7_+_77428066 | 2.90 |
ENST00000422959.2
ENST00000307305.8 ENST00000424760.1 |
PHTF2
|
putative homeodomain transcription factor 2 |
| chr12_-_89746173 | 2.68 |
ENST00000308385.6
|
DUSP6
|
dual specificity phosphatase 6 |
| chr3_+_130569429 | 2.50 |
ENST00000505330.1
ENST00000504381.1 ENST00000507488.2 ENST00000393221.4 |
ATP2C1
|
ATPase, Ca++ transporting, type 2C, member 1 |
| chr17_-_9929581 | 2.49 |
ENST00000437099.2
ENST00000396115.2 |
GAS7
|
growth arrest-specific 7 |
| chr12_-_56694142 | 2.47 |
ENST00000550655.1
ENST00000548567.1 ENST00000551430.2 ENST00000351328.3 |
CS
|
citrate synthase |
| chr17_-_10017864 | 2.46 |
ENST00000323816.4
|
GAS7
|
growth arrest-specific 7 |
| chr2_+_65216462 | 2.38 |
ENST00000234256.3
|
SLC1A4
|
solute carrier family 1 (glutamate/neutral amino acid transporter), member 4 |
| chr16_+_69345243 | 2.25 |
ENST00000254950.11
|
VPS4A
|
vacuolar protein sorting 4 homolog A (S. cerevisiae) |
| chr3_+_173116225 | 2.23 |
ENST00000457714.1
|
NLGN1
|
neuroligin 1 |
| chr1_-_156399184 | 2.09 |
ENST00000368243.1
ENST00000357975.4 ENST00000310027.5 ENST00000400991.2 |
C1orf61
|
chromosome 1 open reading frame 61 |
| chr9_+_12693336 | 2.04 |
ENST00000381137.2
ENST00000388918.5 |
TYRP1
|
tyrosinase-related protein 1 |
| chr20_+_18488137 | 2.00 |
ENST00000450074.1
ENST00000262544.2 ENST00000336714.3 ENST00000377475.3 |
SEC23B
|
Sec23 homolog B (S. cerevisiae) |
| chrX_+_154444643 | 1.99 |
ENST00000286428.5
|
VBP1
|
von Hippel-Lindau binding protein 1 |
| chr18_+_55888767 | 1.84 |
ENST00000431212.2
ENST00000586268.1 ENST00000587190.1 |
NEDD4L
|
neural precursor cell expressed, developmentally down-regulated 4-like, E3 ubiquitin protein ligase |
| chr9_+_2159850 | 1.83 |
ENST00000416751.1
|
SMARCA2
|
SWI/SNF related, matrix associated, actin dependent regulator of chromatin, subfamily a, member 2 |
| chr10_-_50970322 | 1.82 |
ENST00000374103.4
|
OGDHL
|
oxoglutarate dehydrogenase-like |
| chr15_+_58430567 | 1.78 |
ENST00000536493.1
|
AQP9
|
aquaporin 9 |
| chr7_-_137028498 | 1.72 |
ENST00000393083.2
|
PTN
|
pleiotrophin |
| chr1_+_153746683 | 1.70 |
ENST00000271857.2
|
SLC27A3
|
solute carrier family 27 (fatty acid transporter), member 3 |
| chr15_+_58430368 | 1.69 |
ENST00000558772.1
ENST00000219919.4 |
AQP9
|
aquaporin 9 |
| chr4_-_57547454 | 1.68 |
ENST00000556376.2
|
HOPX
|
HOP homeobox |
| chr10_-_50970382 | 1.66 |
ENST00000419399.1
ENST00000432695.1 |
OGDHL
|
oxoglutarate dehydrogenase-like |
| chr1_+_145507587 | 1.62 |
ENST00000330165.8
ENST00000369307.3 |
RBM8A
|
RNA binding motif protein 8A |
| chr4_-_57547870 | 1.55 |
ENST00000381260.3
ENST00000420433.1 ENST00000554144.1 ENST00000557328.1 |
HOPX
|
HOP homeobox |
| chr1_+_62901968 | 1.51 |
ENST00000452143.1
ENST00000442679.1 ENST00000371146.1 |
USP1
|
ubiquitin specific peptidase 1 |
| chr9_+_80912059 | 1.50 |
ENST00000347159.2
ENST00000376588.3 |
PSAT1
|
phosphoserine aminotransferase 1 |
| chr6_-_39693111 | 1.49 |
ENST00000373215.3
ENST00000538893.1 ENST00000287152.7 ENST00000373216.3 |
KIF6
|
kinesin family member 6 |
| chr5_+_125758865 | 1.45 |
ENST00000542322.1
ENST00000544396.1 |
GRAMD3
|
GRAM domain containing 3 |
| chr1_-_190446759 | 1.45 |
ENST00000367462.3
|
BRINP3
|
bone morphogenetic protein/retinoic acid inducible neural-specific 3 |
| chr16_+_103816 | 1.42 |
ENST00000383018.3
ENST00000417493.1 |
SNRNP25
|
small nuclear ribonucleoprotein 25kDa (U11/U12) |
| chr13_-_41593425 | 1.41 |
ENST00000239882.3
|
ELF1
|
E74-like factor 1 (ets domain transcription factor) |
| chr5_+_125758813 | 1.39 |
ENST00000285689.3
ENST00000515200.1 |
GRAMD3
|
GRAM domain containing 3 |
| chr12_-_16759711 | 1.39 |
ENST00000447609.1
|
LMO3
|
LIM domain only 3 (rhombotin-like 2) |
| chr3_+_35722487 | 1.38 |
ENST00000441454.1
|
ARPP21
|
cAMP-regulated phosphoprotein, 21kDa |
| chr7_-_137028534 | 1.29 |
ENST00000348225.2
|
PTN
|
pleiotrophin |
| chr5_+_145826867 | 1.27 |
ENST00000296702.5
ENST00000394421.2 |
TCERG1
|
transcription elongation regulator 1 |
| chr6_+_31783291 | 1.25 |
ENST00000375651.5
ENST00000608703.1 ENST00000458062.2 |
HSPA1A
|
heat shock 70kDa protein 1A |
| chr18_-_33702078 | 1.19 |
ENST00000586829.1
|
SLC39A6
|
solute carrier family 39 (zinc transporter), member 6 |
| chr1_+_179923873 | 1.16 |
ENST00000367607.3
ENST00000491495.2 |
CEP350
|
centrosomal protein 350kDa |
| chr8_-_18744528 | 1.16 |
ENST00000523619.1
|
PSD3
|
pleckstrin and Sec7 domain containing 3 |
| chr2_+_47630255 | 1.11 |
ENST00000406134.1
|
MSH2
|
mutS homolog 2 |
| chr2_+_47630108 | 1.11 |
ENST00000233146.2
ENST00000454849.1 ENST00000543555.1 |
MSH2
|
mutS homolog 2 |
| chr4_-_143227088 | 0.98 |
ENST00000511838.1
|
INPP4B
|
inositol polyphosphate-4-phosphatase, type II, 105kDa |
| chr4_+_71587669 | 0.96 |
ENST00000381006.3
ENST00000226328.4 |
RUFY3
|
RUN and FYVE domain containing 3 |
| chr6_-_111927449 | 0.96 |
ENST00000368761.5
ENST00000392556.4 ENST00000340026.6 |
TRAF3IP2
|
TRAF3 interacting protein 2 |
| chr7_+_138145076 | 0.95 |
ENST00000343526.4
|
TRIM24
|
tripartite motif containing 24 |
| chr5_-_82969405 | 0.90 |
ENST00000510978.1
|
HAPLN1
|
hyaluronan and proteoglycan link protein 1 |
| chr1_-_23670817 | 0.89 |
ENST00000478691.1
|
HNRNPR
|
heterogeneous nuclear ribonucleoprotein R |
| chr1_-_23670813 | 0.88 |
ENST00000374612.1
|
HNRNPR
|
heterogeneous nuclear ribonucleoprotein R |
| chrX_+_129473916 | 0.87 |
ENST00000545805.1
ENST00000543953.1 ENST00000218197.5 |
SLC25A14
|
solute carrier family 25 (mitochondrial carrier, brain), member 14 |
| chr1_+_153747746 | 0.84 |
ENST00000368661.3
|
SLC27A3
|
solute carrier family 27 (fatty acid transporter), member 3 |
| chr19_+_14640372 | 0.73 |
ENST00000215567.5
ENST00000598298.1 ENST00000596073.1 ENST00000600083.1 ENST00000436007.2 |
TECR
|
trans-2,3-enoyl-CoA reductase |
| chr11_-_33913708 | 0.69 |
ENST00000257818.2
|
LMO2
|
LIM domain only 2 (rhombotin-like 1) |
| chr6_+_26199737 | 0.69 |
ENST00000359985.1
|
HIST1H2BF
|
histone cluster 1, H2bf |
| chr1_-_23670752 | 0.68 |
ENST00000302271.6
ENST00000426846.2 ENST00000427764.2 ENST00000606561.1 ENST00000374616.3 |
HNRNPR
|
heterogeneous nuclear ribonucleoprotein R |
| chr2_+_86668464 | 0.67 |
ENST00000409064.1
|
KDM3A
|
lysine (K)-specific demethylase 3A |
| chr3_+_172468505 | 0.67 |
ENST00000427830.1
ENST00000417960.1 ENST00000428567.1 ENST00000366090.2 ENST00000426894.1 |
ECT2
|
epithelial cell transforming sequence 2 oncogene |
| chr17_+_7792101 | 0.66 |
ENST00000358181.4
ENST00000330494.7 |
CHD3
|
chromodomain helicase DNA binding protein 3 |
| chr14_-_74551096 | 0.65 |
ENST00000350259.4
|
ALDH6A1
|
aldehyde dehydrogenase 6 family, member A1 |
| chr18_-_31803435 | 0.63 |
ENST00000589544.1
ENST00000269185.4 ENST00000261592.5 |
NOL4
|
nucleolar protein 4 |
| chr19_+_34287751 | 0.63 |
ENST00000590771.1
ENST00000589786.1 ENST00000284006.6 ENST00000588881.1 |
KCTD15
|
potassium channel tetramerization domain containing 15 |
| chr17_+_47448102 | 0.62 |
ENST00000576461.1
|
RP11-81K2.1
|
Uncharacterized protein |
| chr4_-_143226979 | 0.62 |
ENST00000514525.1
|
INPP4B
|
inositol polyphosphate-4-phosphatase, type II, 105kDa |
| chr2_+_242089833 | 0.61 |
ENST00000404405.3
ENST00000439916.1 ENST00000406106.3 ENST00000401987.1 |
PPP1R7
|
protein phosphatase 1, regulatory subunit 7 |
| chr14_+_72052983 | 0.55 |
ENST00000358550.2
|
SIPA1L1
|
signal-induced proliferation-associated 1 like 1 |
| chr15_+_89631381 | 0.55 |
ENST00000352732.5
|
ABHD2
|
abhydrolase domain containing 2 |
| chr5_+_53751445 | 0.55 |
ENST00000302005.1
|
HSPB3
|
heat shock 27kDa protein 3 |
| chr3_+_172468472 | 0.53 |
ENST00000232458.5
ENST00000392692.3 |
ECT2
|
epithelial cell transforming sequence 2 oncogene |
| chr16_+_53164833 | 0.53 |
ENST00000564845.1
|
CHD9
|
chromodomain helicase DNA binding protein 9 |
| chr1_+_118472343 | 0.51 |
ENST00000369441.3
ENST00000349139.5 |
WDR3
|
WD repeat domain 3 |
| chr11_+_75526212 | 0.48 |
ENST00000356136.3
|
UVRAG
|
UV radiation resistance associated |
| chr7_-_99717463 | 0.47 |
ENST00000437822.2
|
TAF6
|
TAF6 RNA polymerase II, TATA box binding protein (TBP)-associated factor, 80kDa |
| chr5_+_148737562 | 0.43 |
ENST00000274569.4
|
PCYOX1L
|
prenylcysteine oxidase 1 like |
| chr9_+_136501478 | 0.43 |
ENST00000393056.2
ENST00000263611.2 |
DBH
|
dopamine beta-hydroxylase (dopamine beta-monooxygenase) |
| chr6_-_32145861 | 0.43 |
ENST00000336984.6
|
AGPAT1
|
1-acylglycerol-3-phosphate O-acyltransferase 1 |
| chr1_+_110881945 | 0.41 |
ENST00000602849.1
ENST00000487146.2 |
RBM15
|
RNA binding motif protein 15 |
| chr5_+_176811431 | 0.41 |
ENST00000512593.1
ENST00000324417.5 |
SLC34A1
|
solute carrier family 34 (type II sodium/phosphate contransporter), member 1 |
| chr11_+_67250490 | 0.40 |
ENST00000528641.2
ENST00000279146.3 |
AIP
|
aryl hydrocarbon receptor interacting protein |
| chr1_-_68698222 | 0.40 |
ENST00000370976.3
ENST00000354777.2 ENST00000262348.4 ENST00000540432.1 |
WLS
|
wntless Wnt ligand secretion mediator |
| chr3_-_52090461 | 0.39 |
ENST00000296483.6
ENST00000495880.1 |
DUSP7
|
dual specificity phosphatase 7 |
| chr7_-_99716952 | 0.39 |
ENST00000523306.1
ENST00000344095.4 ENST00000417349.1 ENST00000493322.1 ENST00000520135.1 ENST00000418432.2 ENST00000460673.2 ENST00000452041.1 ENST00000452438.2 ENST00000451699.1 ENST00000453269.2 |
TAF6
|
TAF6 RNA polymerase II, TATA box binding protein (TBP)-associated factor, 80kDa |
| chr19_-_14064114 | 0.38 |
ENST00000585607.1
ENST00000538517.2 ENST00000587458.1 ENST00000538371.2 |
PODNL1
|
podocan-like 1 |
| chr5_+_179159813 | 0.33 |
ENST00000292599.3
|
MAML1
|
mastermind-like 1 (Drosophila) |
| chr19_+_51728316 | 0.31 |
ENST00000436584.2
ENST00000421133.2 ENST00000391796.3 ENST00000262262.4 |
CD33
|
CD33 molecule |
| chr6_-_26199499 | 0.30 |
ENST00000377831.5
|
HIST1H3D
|
histone cluster 1, H3d |
| chr3_-_119813264 | 0.29 |
ENST00000264235.8
|
GSK3B
|
glycogen synthase kinase 3 beta |
| chrX_+_95939638 | 0.28 |
ENST00000373061.3
ENST00000373054.4 ENST00000355827.4 |
DIAPH2
|
diaphanous-related formin 2 |
| chr4_-_74486347 | 0.26 |
ENST00000342081.3
|
RASSF6
|
Ras association (RalGDS/AF-6) domain family member 6 |
| chr6_-_161695042 | 0.24 |
ENST00000366908.5
ENST00000366911.5 ENST00000366905.3 |
AGPAT4
|
1-acylglycerol-3-phosphate O-acyltransferase 4 |
| chr14_-_78083112 | 0.22 |
ENST00000216484.2
|
SPTLC2
|
serine palmitoyltransferase, long chain base subunit 2 |
| chr18_-_31803169 | 0.22 |
ENST00000590712.1
|
NOL4
|
nucleolar protein 4 |
| chr2_-_157189180 | 0.21 |
ENST00000539077.1
ENST00000424077.1 ENST00000426264.1 ENST00000339562.4 ENST00000421709.1 |
NR4A2
|
nuclear receptor subfamily 4, group A, member 2 |
| chr6_-_161695074 | 0.15 |
ENST00000457520.2
ENST00000366906.5 ENST00000320285.4 |
AGPAT4
|
1-acylglycerol-3-phosphate O-acyltransferase 4 |
| chr21_-_43816052 | 0.15 |
ENST00000398405.1
|
TMPRSS3
|
transmembrane protease, serine 3 |
| chr14_+_104182105 | 0.15 |
ENST00000311141.2
|
ZFYVE21
|
zinc finger, FYVE domain containing 21 |
| chr15_-_64673630 | 0.14 |
ENST00000558008.1
ENST00000559519.1 ENST00000380258.2 |
KIAA0101
|
KIAA0101 |
| chr1_+_171227069 | 0.13 |
ENST00000354841.4
|
FMO1
|
flavin containing monooxygenase 1 |
| chr2_-_242089677 | 0.13 |
ENST00000405260.1
|
PASK
|
PAS domain containing serine/threonine kinase |
| chr2_-_163008903 | 0.13 |
ENST00000418842.2
ENST00000375497.3 |
GCG
|
glucagon |
| chr4_-_74486217 | 0.13 |
ENST00000335049.5
ENST00000307439.5 |
RASSF6
|
Ras association (RalGDS/AF-6) domain family member 6 |
| chr6_-_167040731 | 0.13 |
ENST00000265678.4
|
RPS6KA2
|
ribosomal protein S6 kinase, 90kDa, polypeptide 2 |
| chr15_-_64673665 | 0.12 |
ENST00000300035.4
|
KIAA0101
|
KIAA0101 |
| chr17_-_74163159 | 0.10 |
ENST00000591615.1
|
RNF157
|
ring finger protein 157 |
| chrX_+_95939711 | 0.09 |
ENST00000373049.4
ENST00000324765.8 |
DIAPH2
|
diaphanous-related formin 2 |
| chr19_-_59084647 | 0.09 |
ENST00000594234.1
ENST00000596039.1 |
MZF1
|
myeloid zinc finger 1 |
| chr6_-_26032288 | 0.09 |
ENST00000244661.2
|
HIST1H3B
|
histone cluster 1, H3b |
| chr14_-_74551172 | 0.09 |
ENST00000553458.1
|
ALDH6A1
|
aldehyde dehydrogenase 6 family, member A1 |
| chr14_+_22739823 | 0.09 |
ENST00000390464.2
|
TRAV38-1
|
T cell receptor alpha variable 38-1 |
| chr4_-_120243545 | 0.08 |
ENST00000274024.3
|
FABP2
|
fatty acid binding protein 2, intestinal |
| chr2_+_196313239 | 0.06 |
ENST00000413290.1
|
AC064834.1
|
AC064834.1 |
| chr11_-_71823266 | 0.06 |
ENST00000538919.1
ENST00000539395.1 ENST00000542531.1 |
ANAPC15
|
anaphase promoting complex subunit 15 |
| chr6_-_26199471 | 0.05 |
ENST00000341023.1
|
HIST1H2AD
|
histone cluster 1, H2ad |
| chr14_+_104182061 | 0.04 |
ENST00000216602.6
|
ZFYVE21
|
zinc finger, FYVE domain containing 21 |
| chr12_-_14849470 | 0.04 |
ENST00000261170.3
|
GUCY2C
|
guanylate cyclase 2C (heat stable enterotoxin receptor) |
| chr8_+_24298531 | 0.04 |
ENST00000175238.6
|
ADAM7
|
ADAM metallopeptidase domain 7 |
| chr2_-_61697862 | 0.02 |
ENST00000398571.2
|
USP34
|
ubiquitin specific peptidase 34 |
| chr11_-_71823796 | 0.02 |
ENST00000545680.1
ENST00000543587.1 ENST00000538393.1 ENST00000535234.1 ENST00000227618.4 ENST00000535503.1 |
ANAPC15
|
anaphase promoting complex subunit 15 |
| chr8_+_24298597 | 0.01 |
ENST00000380789.1
|
ADAM7
|
ADAM metallopeptidase domain 7 |
| chr12_-_10955226 | 0.01 |
ENST00000240687.2
|
TAS2R7
|
taste receptor, type 2, member 7 |
| chr3_+_152879985 | 0.00 |
ENST00000323534.2
|
RAP2B
|
RAP2B, member of RAS oncogene family |
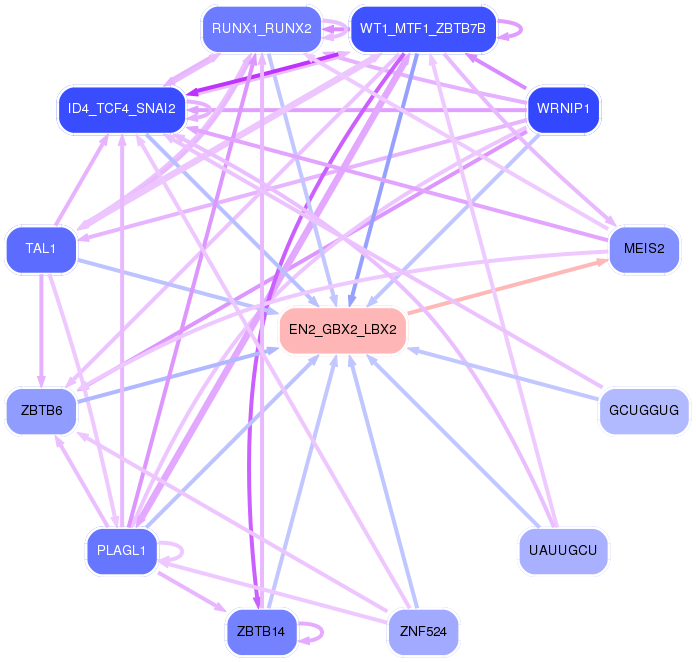
Network of associatons between targets according to the STRING database.

First level regulatory network of EN2_GBX2_LBX2
Gene Ontology Analysis
Gene overrepresentation in biological_process category:
| Log-likelihood per target | Total log-likelihood | Term | Description |
|---|---|---|---|
| 2.9 | 17.5 | GO:1903435 | positive regulation of constitutive secretory pathway(GO:1903435) |
| 1.0 | 3.0 | GO:1904395 | retinal rod cell differentiation(GO:0060221) positive regulation of skeletal muscle acetylcholine-gated channel clustering(GO:1904395) negative regulation of neuromuscular junction development(GO:1904397) |
| 0.9 | 2.7 | GO:1903224 | regulation of endodermal cell differentiation(GO:1903224) |
| 0.9 | 8.8 | GO:0016198 | axon choice point recognition(GO:0016198) |
| 0.8 | 3.3 | GO:0061743 | motor learning(GO:0061743) |
| 0.8 | 2.3 | GO:0090611 | mitotic cytokinesis checkpoint(GO:0044878) ubiquitin-independent protein catabolic process via the multivesicular body sorting pathway(GO:0090611) |
| 0.7 | 2.2 | GO:0099543 | retrograde trans-synaptic signaling by soluble gas(GO:0098923) trans-synaptic signaling by soluble gas(GO:0099543) trans-synaptic signaling by trans-synaptic complex(GO:0099545) |
| 0.7 | 3.5 | GO:0015722 | canalicular bile acid transport(GO:0015722) pyrimidine nucleobase transport(GO:0015855) urea transmembrane transport(GO:0071918) purine nucleobase transmembrane transport(GO:1904823) |
| 0.6 | 2.4 | GO:0015808 | L-alanine transport(GO:0015808) |
| 0.6 | 8.3 | GO:0048245 | eosinophil chemotaxis(GO:0048245) |
| 0.4 | 2.2 | GO:0010520 | meiotic gene conversion(GO:0006311) regulation of reciprocal meiotic recombination(GO:0010520) |
| 0.4 | 2.5 | GO:0032468 | Golgi calcium ion homeostasis(GO:0032468) |
| 0.4 | 4.1 | GO:0071578 | zinc II ion transmembrane import(GO:0071578) |
| 0.4 | 4.6 | GO:0090160 | Golgi to lysosome transport(GO:0090160) |
| 0.4 | 1.8 | GO:2001288 | positive regulation of caveolin-mediated endocytosis(GO:2001288) |
| 0.3 | 3.1 | GO:0098814 | spontaneous neurotransmitter secretion(GO:0061669) spontaneous synaptic transmission(GO:0098814) |
| 0.3 | 1.3 | GO:0070434 | positive regulation of nucleotide-binding oligomerization domain containing signaling pathway(GO:0070426) positive regulation of nucleotide-binding oligomerization domain containing 2 signaling pathway(GO:0070434) |
| 0.3 | 1.5 | GO:0042816 | vitamin B6 metabolic process(GO:0042816) |
| 0.2 | 1.4 | GO:2000324 | positive regulation of glucocorticoid receptor signaling pathway(GO:2000324) |
| 0.2 | 2.0 | GO:1900378 | positive regulation of melanin biosynthetic process(GO:0048023) positive regulation of secondary metabolite biosynthetic process(GO:1900378) |
| 0.2 | 0.7 | GO:0007290 | spermatid nucleus elongation(GO:0007290) |
| 0.2 | 4.1 | GO:0002230 | positive regulation of defense response to virus by host(GO:0002230) |
| 0.2 | 0.7 | GO:0006208 | pyrimidine nucleobase catabolic process(GO:0006208) thymine catabolic process(GO:0006210) thymine metabolic process(GO:0019859) |
| 0.2 | 0.5 | GO:0051684 | maintenance of Golgi location(GO:0051684) |
| 0.2 | 5.9 | GO:0006099 | tricarboxylic acid cycle(GO:0006099) |
| 0.1 | 0.4 | GO:0030327 | prenylated protein catabolic process(GO:0030327) |
| 0.1 | 3.2 | GO:0001829 | trophectodermal cell differentiation(GO:0001829) |
| 0.1 | 0.9 | GO:0070562 | regulation of vitamin D receptor signaling pathway(GO:0070562) |
| 0.1 | 0.4 | GO:2000118 | regulation of sodium-dependent phosphate transport(GO:2000118) |
| 0.1 | 1.5 | GO:0035520 | monoubiquitinated protein deubiquitination(GO:0035520) |
| 0.1 | 2.0 | GO:0007021 | tubulin complex assembly(GO:0007021) |
| 0.1 | 0.3 | GO:0060920 | atrioventricular node development(GO:0003162) cardiac pacemaker cell differentiation(GO:0060920) cardiac pacemaker cell development(GO:0060926) |
| 0.1 | 2.4 | GO:0061157 | mRNA destabilization(GO:0061157) |
| 0.1 | 0.3 | GO:0071109 | superior temporal gyrus development(GO:0071109) |
| 0.1 | 0.7 | GO:0030497 | fatty acid elongation(GO:0030497) very long-chain fatty acid biosynthetic process(GO:0042761) |
| 0.1 | 6.3 | GO:0008542 | visual learning(GO:0008542) |
| 0.1 | 0.4 | GO:0007221 | positive regulation of transcription of Notch receptor target(GO:0007221) |
| 0.1 | 5.5 | GO:0006120 | mitochondrial electron transport, NADH to ubiquinone(GO:0006120) |
| 0.1 | 1.2 | GO:0051988 | regulation of attachment of spindle microtubules to kinetochore(GO:0051988) |
| 0.1 | 0.2 | GO:0021538 | epithalamus development(GO:0021538) habenula development(GO:0021986) |
| 0.1 | 0.4 | GO:0051342 | regulation of cyclic-nucleotide phosphodiesterase activity(GO:0051342) negative regulation of cyclic-nucleotide phosphodiesterase activity(GO:0051344) |
| 0.1 | 1.2 | GO:0032012 | regulation of ARF protein signal transduction(GO:0032012) |
| 0.1 | 1.4 | GO:0050860 | negative regulation of T cell receptor signaling pathway(GO:0050860) |
| 0.1 | 0.2 | GO:1904504 | regulation of lipophagy(GO:1904502) positive regulation of lipophagy(GO:1904504) |
| 0.1 | 0.8 | GO:0016024 | CDP-diacylglycerol biosynthetic process(GO:0016024) |
| 0.0 | 5.0 | GO:0007368 | determination of left/right symmetry(GO:0007368) |
| 0.0 | 0.1 | GO:0035948 | positive regulation of gluconeogenesis by positive regulation of transcription from RNA polymerase II promoter(GO:0035948) |
| 0.0 | 1.2 | GO:0034453 | microtubule anchoring(GO:0034453) |
| 0.0 | 0.7 | GO:0097067 | cellular response to thyroid hormone stimulus(GO:0097067) |
| 0.0 | 3.4 | GO:0007422 | peripheral nervous system development(GO:0007422) |
| 0.0 | 1.0 | GO:2000114 | regulation of establishment of cell polarity(GO:2000114) |
| 0.0 | 1.6 | GO:0000381 | regulation of alternative mRNA splicing, via spliceosome(GO:0000381) |
| 0.0 | 0.9 | GO:0009060 | aerobic respiration(GO:0009060) |
| 0.0 | 6.0 | GO:0007050 | cell cycle arrest(GO:0007050) |
| 0.0 | 0.1 | GO:0061357 | positive regulation of Wnt protein secretion(GO:0061357) |
| 0.0 | 1.5 | GO:0036092 | phosphatidylinositol-3-phosphate biosynthetic process(GO:0036092) |
| 0.0 | 20.1 | GO:0000122 | negative regulation of transcription from RNA polymerase II promoter(GO:0000122) |
| 0.0 | 2.5 | GO:0001676 | long-chain fatty acid metabolic process(GO:0001676) |
| 0.0 | 0.1 | GO:0070995 | NADPH oxidation(GO:0070995) |
| 0.0 | 0.1 | GO:0045719 | negative regulation of glycogen biosynthetic process(GO:0045719) |
| 0.0 | 0.6 | GO:0061001 | regulation of dendritic spine morphogenesis(GO:0061001) |
| 0.0 | 0.7 | GO:0016575 | histone deacetylation(GO:0016575) |
| 0.0 | 0.5 | GO:0006986 | response to unfolded protein(GO:0006986) |
| 0.0 | 0.5 | GO:0030490 | maturation of SSU-rRNA(GO:0030490) |
Gene overrepresentation in cellular_component category:
| Log-likelihood per target | Total log-likelihood | Term | Description |
|---|---|---|---|
| 1.3 | 8.8 | GO:0032584 | growth cone membrane(GO:0032584) |
| 1.1 | 19.5 | GO:0045009 | melanosome membrane(GO:0033162) chitosome(GO:0045009) |
| 0.7 | 2.2 | GO:0032302 | MutSbeta complex(GO:0032302) |
| 0.5 | 3.5 | GO:0045252 | oxoglutarate dehydrogenase complex(GO:0045252) |
| 0.4 | 8.3 | GO:0031045 | dense core granule(GO:0031045) |
| 0.3 | 2.0 | GO:0016272 | prefoldin complex(GO:0016272) |
| 0.2 | 1.2 | GO:0097149 | centralspindlin complex(GO:0097149) |
| 0.2 | 0.9 | GO:0005726 | perichromatin fibrils(GO:0005726) |
| 0.2 | 2.3 | GO:0000815 | ESCRT III complex(GO:0000815) |
| 0.1 | 2.2 | GO:0032433 | filopodium tip(GO:0032433) |
| 0.1 | 1.5 | GO:0001673 | male germ cell nucleus(GO:0001673) |
| 0.1 | 4.1 | GO:0031258 | lamellipodium membrane(GO:0031258) |
| 0.1 | 0.5 | GO:0034388 | Pwp2p-containing subcomplex of 90S preribosome(GO:0034388) |
| 0.1 | 0.4 | GO:0034751 | aryl hydrocarbon receptor complex(GO:0034751) |
| 0.1 | 2.0 | GO:0030127 | COPII vesicle coat(GO:0030127) |
| 0.1 | 5.5 | GO:0005747 | mitochondrial respiratory chain complex I(GO:0005747) NADH dehydrogenase complex(GO:0030964) respiratory chain complex I(GO:0045271) |
| 0.1 | 22.0 | GO:0043209 | myelin sheath(GO:0043209) |
| 0.1 | 1.8 | GO:0071564 | npBAF complex(GO:0071564) |
| 0.1 | 3.1 | GO:0048786 | presynaptic active zone(GO:0048786) |
| 0.1 | 0.3 | GO:0002193 | MAML1-RBP-Jkappa- ICN1 complex(GO:0002193) |
| 0.1 | 0.4 | GO:0042584 | chromaffin granule membrane(GO:0042584) |
| 0.1 | 1.6 | GO:0035145 | exon-exon junction complex(GO:0035145) |
| 0.1 | 0.2 | GO:0017059 | serine C-palmitoyltransferase complex(GO:0017059) endoplasmic reticulum palmitoyltransferase complex(GO:0031211) |
| 0.1 | 1.4 | GO:0005689 | U12-type spliceosomal complex(GO:0005689) |
| 0.1 | 1.0 | GO:0071437 | invadopodium(GO:0071437) |
| 0.0 | 0.9 | GO:0033276 | transcription factor TFTC complex(GO:0033276) |
| 0.0 | 3.0 | GO:0031594 | neuromuscular junction(GO:0031594) |
| 0.0 | 0.5 | GO:0030897 | HOPS complex(GO:0030897) |
| 0.0 | 1.8 | GO:0005771 | multivesicular body(GO:0005771) |
| 0.0 | 7.1 | GO:0005802 | trans-Golgi network(GO:0005802) |
| 0.0 | 3.4 | GO:0043204 | perikaryon(GO:0043204) |
| 0.0 | 2.4 | GO:0043679 | axon terminus(GO:0043679) |
| 0.0 | 1.3 | GO:0016235 | aggresome(GO:0016235) |
| 0.0 | 0.3 | GO:1990909 | Wnt signalosome(GO:1990909) |
| 0.0 | 0.7 | GO:0090545 | NuRD complex(GO:0016581) CHD-type complex(GO:0090545) |
| 0.0 | 2.1 | GO:0048770 | melanosome(GO:0042470) pigment granule(GO:0048770) |
| 0.0 | 3.5 | GO:0016323 | basolateral plasma membrane(GO:0016323) |
Gene overrepresentation in molecular_function category:
| Log-likelihood per target | Total log-likelihood | Term | Description |
|---|---|---|---|
| 0.9 | 8.8 | GO:0035727 | lysophosphatidic acid binding(GO:0035727) |
| 0.9 | 3.5 | GO:0015265 | glycerol channel activity(GO:0015254) urea channel activity(GO:0015265) |
| 0.8 | 3.0 | GO:0035373 | chondroitin sulfate proteoglycan binding(GO:0035373) |
| 0.7 | 2.2 | GO:0000406 | heteroduplex DNA loop binding(GO:0000404) double-strand/single-strand DNA junction binding(GO:0000406) dinucleotide repeat insertion binding(GO:0032181) |
| 0.7 | 3.5 | GO:0004591 | oxoglutarate dehydrogenase (succinyl-transferring) activity(GO:0004591) |
| 0.7 | 17.5 | GO:0031489 | myosin V binding(GO:0031489) |
| 0.6 | 2.4 | GO:0015180 | L-alanine transmembrane transporter activity(GO:0015180) alanine transmembrane transporter activity(GO:0022858) |
| 0.5 | 2.5 | GO:0046912 | transferase activity, transferring acyl groups, acyl groups converted into alkyl on transfer(GO:0046912) |
| 0.3 | 1.6 | GO:0017161 | phosphatidylinositol-3,4-bisphosphate 4-phosphatase activity(GO:0016316) inositol-1,3,4-trisphosphate 4-phosphatase activity(GO:0017161) phosphatidylinositol-4,5-bisphosphate 4-phosphatase activity(GO:0034597) inositol-3,4-bisphosphate 4-phosphatase activity(GO:0052828) |
| 0.2 | 1.8 | GO:0019871 | sodium channel inhibitor activity(GO:0019871) |
| 0.2 | 4.1 | GO:0005385 | zinc ion transmembrane transporter activity(GO:0005385) |
| 0.2 | 3.1 | GO:0017017 | MAP kinase tyrosine/serine/threonine phosphatase activity(GO:0017017) |
| 0.2 | 0.7 | GO:0004466 | long-chain-acyl-CoA dehydrogenase activity(GO:0004466) |
| 0.2 | 2.5 | GO:0031957 | very long-chain fatty acid-CoA ligase activity(GO:0031957) |
| 0.2 | 7.8 | GO:0042056 | chemoattractant activity(GO:0042056) |
| 0.2 | 2.2 | GO:0042043 | neurexin family protein binding(GO:0042043) |
| 0.1 | 4.9 | GO:0001071 | nucleic acid binding transcription factor activity(GO:0001071) transcription factor activity, sequence-specific DNA binding(GO:0003700) |
| 0.1 | 1.3 | GO:0055131 | C3HC4-type RING finger domain binding(GO:0055131) |
| 0.1 | 5.5 | GO:0008137 | NADH dehydrogenase (ubiquinone) activity(GO:0008137) NADH dehydrogenase (quinone) activity(GO:0050136) |
| 0.1 | 1.3 | GO:0017162 | aryl hydrocarbon receptor binding(GO:0017162) |
| 0.1 | 2.5 | GO:0005388 | calcium-transporting ATPase activity(GO:0005388) |
| 0.1 | 0.9 | GO:0034056 | estrogen response element binding(GO:0034056) |
| 0.1 | 21.1 | GO:0051015 | actin filament binding(GO:0051015) |
| 0.1 | 0.2 | GO:0016454 | serine C-palmitoyltransferase activity(GO:0004758) C-palmitoyltransferase activity(GO:0016454) |
| 0.1 | 0.4 | GO:0016715 | oxidoreductase activity, acting on paired donors, with incorporation or reduction of molecular oxygen, reduced ascorbate as one donor, and incorporation of one atom of oxygen(GO:0016715) |
| 0.1 | 1.5 | GO:0008483 | transaminase activity(GO:0008483) |
| 0.1 | 0.4 | GO:0016670 | oxidoreductase activity, acting on a sulfur group of donors, oxygen as acceptor(GO:0016670) |
| 0.1 | 6.6 | GO:0017048 | Rho GTPase binding(GO:0017048) |
| 0.1 | 1.3 | GO:0070064 | proline-rich region binding(GO:0070064) |
| 0.1 | 0.4 | GO:0015321 | sodium-dependent phosphate transmembrane transporter activity(GO:0015321) |
| 0.0 | 1.2 | GO:0005086 | ARF guanyl-nucleotide exchange factor activity(GO:0005086) |
| 0.0 | 0.8 | GO:0071617 | 1-acylglycerol-3-phosphate O-acyltransferase activity(GO:0003841) lysophosphatidic acid acyltransferase activity(GO:0042171) lysophospholipid acyltransferase activity(GO:0071617) |
| 0.0 | 0.7 | GO:0032454 | histone demethylase activity (H3-K9 specific)(GO:0032454) |
| 0.0 | 0.7 | GO:0000062 | fatty-acyl-CoA binding(GO:0000062) |
| 0.0 | 0.2 | GO:0000285 | 1-phosphatidylinositol-3-phosphate 5-kinase activity(GO:0000285) |
| 0.0 | 0.9 | GO:0005540 | hyaluronic acid binding(GO:0005540) |
| 0.0 | 1.8 | GO:0001105 | RNA polymerase II transcription coactivator activity(GO:0001105) |
| 0.0 | 3.9 | GO:0003774 | motor activity(GO:0003774) |
| 0.0 | 2.0 | GO:0005507 | copper ion binding(GO:0005507) |
| 0.0 | 0.7 | GO:0001190 | transcriptional activator activity, RNA polymerase II transcription factor binding(GO:0001190) transcriptional repressor activity, RNA polymerase II activating transcription factor binding(GO:0098811) |
| 0.0 | 2.4 | GO:0003730 | mRNA 3'-UTR binding(GO:0003730) |
| 0.0 | 2.6 | GO:0004867 | serine-type endopeptidase inhibitor activity(GO:0004867) |
| 0.0 | 1.5 | GO:0004843 | thiol-dependent ubiquitin-specific protease activity(GO:0004843) |
| 0.0 | 0.7 | GO:0004407 | histone deacetylase activity(GO:0004407) |
| 0.0 | 3.1 | GO:0017137 | Rab GTPase binding(GO:0017137) |
| 0.0 | 0.5 | GO:0030515 | snoRNA binding(GO:0030515) |
| 0.0 | 4.5 | GO:0003714 | transcription corepressor activity(GO:0003714) |
| 0.0 | 0.1 | GO:0004499 | N,N-dimethylaniline monooxygenase activity(GO:0004499) |
| 0.0 | 0.3 | GO:0034236 | protein kinase A catalytic subunit binding(GO:0034236) |
| 0.0 | 0.5 | GO:0004386 | helicase activity(GO:0004386) |
| 0.0 | 0.6 | GO:0046875 | ephrin receptor binding(GO:0046875) |
Gene overrepresentation in C2:CP category:
| Log-likelihood per target | Total log-likelihood | Term | Description |
|---|---|---|---|
| 0.2 | 8.8 | PID NCADHERIN PATHWAY | N-cadherin signaling events |
| 0.1 | 3.0 | PID SYNDECAN 3 PATHWAY | Syndecan-3-mediated signaling events |
| 0.0 | 2.8 | ST ERK1 ERK2 MAPK PATHWAY | ERK1/ERK2 MAPK Pathway |
| 0.0 | 3.1 | PID AR TF PATHWAY | Regulation of Androgen receptor activity |
| 0.0 | 1.4 | PID IL2 STAT5 PATHWAY | IL2 signaling events mediated by STAT5 |
| 0.0 | 3.3 | PID MYC ACTIV PATHWAY | Validated targets of C-MYC transcriptional activation |
| 0.0 | 1.8 | PID TGFBR PATHWAY | TGF-beta receptor signaling |
| 0.0 | 4.3 | PID P53 DOWNSTREAM PATHWAY | Direct p53 effectors |
| 0.0 | 1.3 | NABA PROTEOGLYCANS | Genes encoding proteoglycans |
| 0.0 | 1.2 | PID PLK1 PATHWAY | PLK1 signaling events |
| 0.0 | 2.3 | PID CXCR4 PATHWAY | CXCR4-mediated signaling events |
| 0.0 | 0.8 | PID FANCONI PATHWAY | Fanconi anemia pathway |
Gene overrepresentation in C2:CP:REACTOME category:
| Log-likelihood per target | Total log-likelihood | Term | Description |
|---|---|---|---|
| 0.7 | 17.5 | REACTOME INSULIN SYNTHESIS AND PROCESSING | Genes involved in Insulin Synthesis and Processing |
| 0.3 | 4.1 | REACTOME ZINC TRANSPORTERS | Genes involved in Zinc transporters |
| 0.2 | 3.5 | REACTOME PASSIVE TRANSPORT BY AQUAPORINS | Genes involved in Passive Transport by Aquaporins |
| 0.2 | 3.1 | REACTOME ERKS ARE INACTIVATED | Genes involved in ERKs are inactivated |
| 0.1 | 1.5 | REACTOME REGULATION OF THE FANCONI ANEMIA PATHWAY | Genes involved in Regulation of the Fanconi anemia pathway |
| 0.1 | 2.3 | REACTOME ENDOSOMAL SORTING COMPLEX REQUIRED FOR TRANSPORT ESCRT | Genes involved in Endosomal Sorting Complex Required For Transport (ESCRT) |
| 0.1 | 1.6 | REACTOME SYNTHESIS OF PIPS AT THE EARLY ENDOSOME MEMBRANE | Genes involved in Synthesis of PIPs at the early endosome membrane |
| 0.1 | 2.5 | REACTOME CITRIC ACID CYCLE TCA CYCLE | Genes involved in Citric acid cycle (TCA cycle) |
| 0.1 | 2.4 | REACTOME AMINO ACID TRANSPORT ACROSS THE PLASMA MEMBRANE | Genes involved in Amino acid transport across the plasma membrane |
| 0.1 | 1.5 | REACTOME AMINO ACID SYNTHESIS AND INTERCONVERSION TRANSAMINATION | Genes involved in Amino acid synthesis and interconversion (transamination) |
| 0.1 | 2.0 | REACTOME PREFOLDIN MEDIATED TRANSFER OF SUBSTRATE TO CCT TRIC | Genes involved in Prefoldin mediated transfer of substrate to CCT/TriC |
| 0.0 | 2.5 | REACTOME ION TRANSPORT BY P TYPE ATPASES | Genes involved in Ion transport by P-type ATPases |
| 0.0 | 1.6 | REACTOME MRNA 3 END PROCESSING | Genes involved in mRNA 3'-end processing |
| 0.0 | 0.7 | REACTOME SYNTHESIS OF VERY LONG CHAIN FATTY ACYL COAS | Genes involved in Synthesis of very long-chain fatty acyl-CoAs |
| 0.0 | 0.8 | REACTOME TRIGLYCERIDE BIOSYNTHESIS | Genes involved in Triglyceride Biosynthesis |
| 0.0 | 0.3 | REACTOME NOTCH HLH TRANSCRIPTION PATHWAY | Genes involved in Notch-HLH transcription pathway |
| 0.0 | 0.9 | REACTOME SIGNALING BY FGFR1 FUSION MUTANTS | Genes involved in Signaling by FGFR1 fusion mutants |
| 0.0 | 0.9 | REACTOME RNA POL II TRANSCRIPTION PRE INITIATION AND PROMOTER OPENING | Genes involved in RNA Polymerase II Transcription Pre-Initiation And Promoter Opening |
| 0.0 | 2.4 | REACTOME MRNA SPLICING | Genes involved in mRNA Splicing |
| 0.0 | 1.2 | REACTOME NRAGE SIGNALS DEATH THROUGH JNK | Genes involved in NRAGE signals death through JNK |
| 0.0 | 0.4 | REACTOME AMINE DERIVED HORMONES | Genes involved in Amine-derived hormones |
| 0.0 | 0.7 | REACTOME PACKAGING OF TELOMERE ENDS | Genes involved in Packaging Of Telomere Ends |
| 0.0 | 0.3 | REACTOME BRANCHED CHAIN AMINO ACID CATABOLISM | Genes involved in Branched-chain amino acid catabolism |