Project
GNF SymAtlas + NCI-60 cancer cell lines, comparison of cancers vs non-cancers, human (Su, 2004; Ross, 2000)
Navigation
Downloads
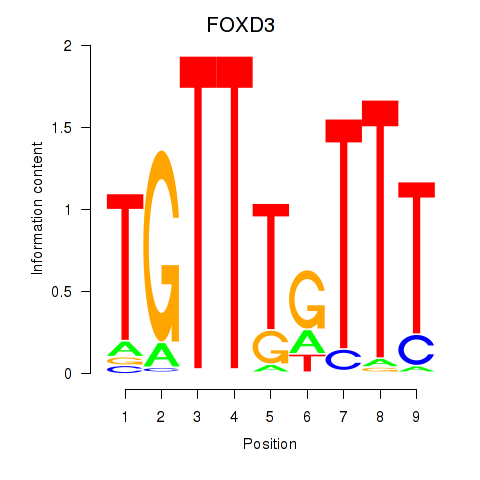
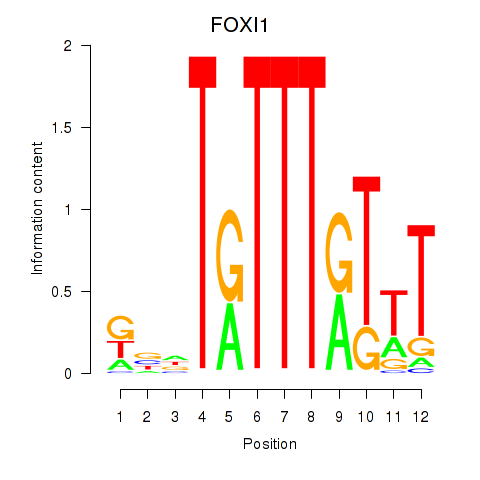
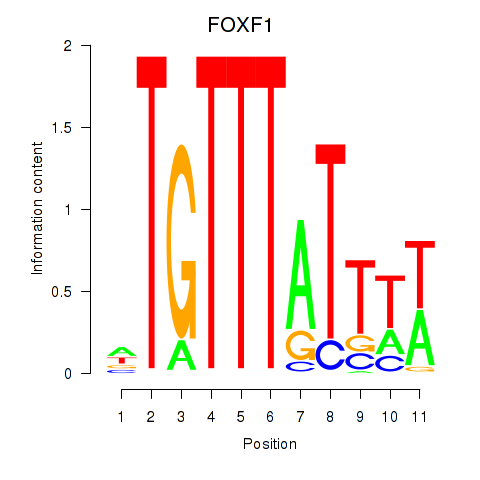
Results for FOXD3_FOXI1_FOXF1
Z-value: 0.56
Motif logo
Transcription factors associated with FOXD3_FOXI1_FOXF1
| Gene Symbol | Gene ID | Gene Info |
|---|---|---|
|
FOXD3
|
ENSG00000187140.4 | forkhead box D3 |
|
FOXI1
|
ENSG00000168269.7 | forkhead box I1 |
|
FOXF1
|
ENSG00000103241.5 | forkhead box F1 |
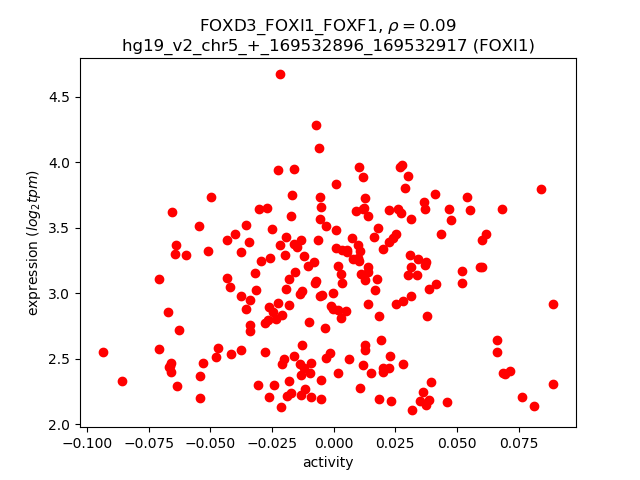
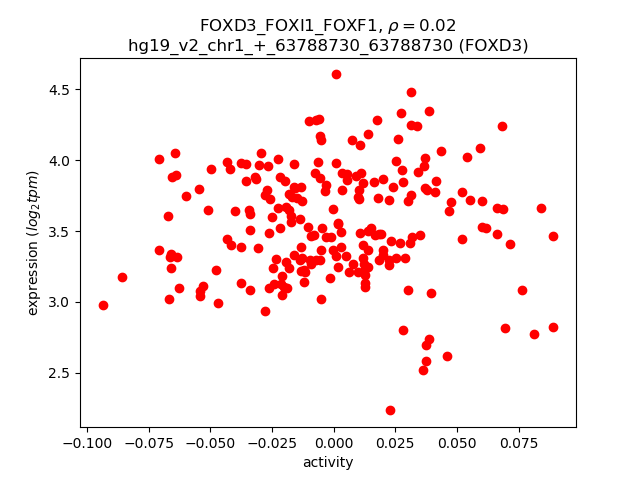
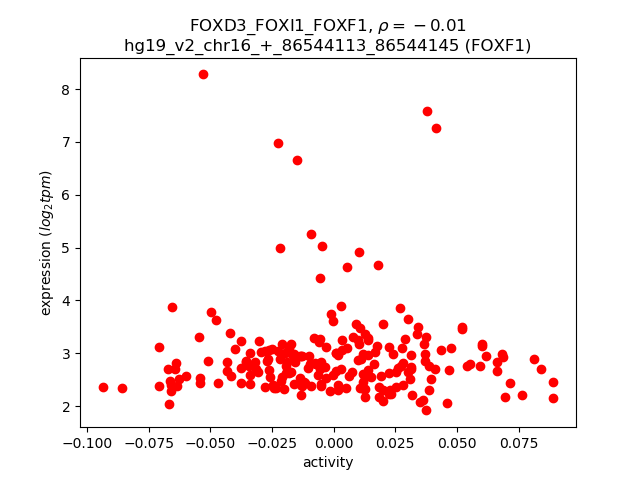
Activity-expression correlation:
| Gene | Promoter | Pearson corr. coef. | P-value | Plot |
|---|---|---|---|---|
| FOXI1 | hg19_v2_chr5_+_169532896_169532917 | 0.09 | 2.0e-01 | Click! |
| FOXD3 | hg19_v2_chr1_+_63788730_63788730 | 0.02 | 7.7e-01 | Click! |
| FOXF1 | hg19_v2_chr16_+_86544113_86544145 | -0.01 | 8.9e-01 | Click! |
Activity profile of FOXD3_FOXI1_FOXF1 motif
Sorted Z-values of FOXD3_FOXI1_FOXF1 motif
| Promoter | Log-likelihood | Transcript | Gene | Gene Info |
|---|---|---|---|---|
| chr4_-_153303658 | 21.82 |
ENST00000296555.5
|
FBXW7
|
F-box and WD repeat domain containing 7, E3 ubiquitin protein ligase |
| chr4_+_158142750 | 18.95 |
ENST00000505888.1
ENST00000449365.1 |
GRIA2
|
glutamate receptor, ionotropic, AMPA 2 |
| chr11_-_111781610 | 14.57 |
ENST00000525823.1
|
CRYAB
|
crystallin, alpha B |
| chr5_-_88179302 | 14.25 |
ENST00000504921.2
|
MEF2C
|
myocyte enhancer factor 2C |
| chr4_+_71587669 | 12.23 |
ENST00000381006.3
ENST00000226328.4 |
RUFY3
|
RUN and FYVE domain containing 3 |
| chr3_+_50712672 | 12.18 |
ENST00000266037.9
|
DOCK3
|
dedicator of cytokinesis 3 |
| chr11_-_111781454 | 12.08 |
ENST00000533280.1
|
CRYAB
|
crystallin, alpha B |
| chr11_-_111781554 | 11.78 |
ENST00000526167.1
ENST00000528961.1 |
CRYAB
|
crystallin, alpha B |
| chr5_-_146302078 | 11.06 |
ENST00000508545.2
|
PPP2R2B
|
protein phosphatase 2, regulatory subunit B, beta |
| chr17_-_29641084 | 10.89 |
ENST00000544462.1
|
EVI2B
|
ecotropic viral integration site 2B |
| chr5_+_173472607 | 10.84 |
ENST00000303177.3
ENST00000519867.1 |
NSG2
|
Neuron-specific protein family member 2 |
| chr7_+_86273218 | 10.54 |
ENST00000361669.2
|
GRM3
|
glutamate receptor, metabotropic 3 |
| chr16_+_6069586 | 10.31 |
ENST00000547372.1
|
RBFOX1
|
RNA binding protein, fox-1 homolog (C. elegans) 1 |
| chr12_+_79439405 | 10.02 |
ENST00000552744.1
|
SYT1
|
synaptotagmin I |
| chr2_-_2334888 | 9.96 |
ENST00000428368.2
ENST00000399161.2 |
MYT1L
|
myelin transcription factor 1-like |
| chr1_+_10292308 | 9.89 |
ENST00000377081.1
|
KIF1B
|
kinesin family member 1B |
| chr6_-_152639479 | 9.80 |
ENST00000356820.4
|
SYNE1
|
spectrin repeat containing, nuclear envelope 1 |
| chr4_-_84035905 | 9.20 |
ENST00000311507.4
|
PLAC8
|
placenta-specific 8 |
| chr5_-_176057365 | 9.17 |
ENST00000310112.3
|
SNCB
|
synuclein, beta |
| chr4_-_84035868 | 9.08 |
ENST00000426923.2
ENST00000509973.1 |
PLAC8
|
placenta-specific 8 |
| chr6_+_31582961 | 9.05 |
ENST00000376059.3
ENST00000337917.7 |
AIF1
|
allograft inflammatory factor 1 |
| chr3_-_195310802 | 9.04 |
ENST00000421243.1
ENST00000453131.1 |
APOD
|
apolipoprotein D |
| chr7_-_37026108 | 8.80 |
ENST00000396045.3
|
ELMO1
|
engulfment and cell motility 1 |
| chr5_-_176056974 | 8.79 |
ENST00000510387.1
ENST00000506696.1 |
SNCB
|
synuclein, beta |
| chr12_+_10365404 | 8.77 |
ENST00000266458.5
ENST00000421801.2 ENST00000544284.1 ENST00000545047.1 ENST00000543602.1 ENST00000545887.1 |
GABARAPL1
|
GABA(A) receptor-associated protein like 1 |
| chr18_-_53070913 | 8.55 |
ENST00000568186.1
ENST00000564228.1 |
TCF4
|
transcription factor 4 |
| chr17_-_29641104 | 8.46 |
ENST00000577894.1
ENST00000330927.4 |
EVI2B
|
ecotropic viral integration site 2B |
| chr3_+_35721106 | 8.42 |
ENST00000474696.1
ENST00000412048.1 ENST00000396482.2 ENST00000432682.1 |
ARPP21
|
cAMP-regulated phosphoprotein, 21kDa |
| chr1_-_27952741 | 7.81 |
ENST00000399173.1
|
FGR
|
feline Gardner-Rasheed sarcoma viral oncogene homolog |
| chr6_-_133084580 | 7.66 |
ENST00000525270.1
ENST00000530536.1 ENST00000524919.1 |
VNN2
|
vanin 2 |
| chr2_-_175711133 | 7.42 |
ENST00000409597.1
ENST00000413882.1 |
CHN1
|
chimerin 1 |
| chr10_+_95517660 | 7.34 |
ENST00000371413.3
|
LGI1
|
leucine-rich, glioma inactivated 1 |
| chr5_+_156712372 | 7.31 |
ENST00000541131.1
|
CYFIP2
|
cytoplasmic FMR1 interacting protein 2 |
| chr5_-_172198190 | 7.28 |
ENST00000239223.3
|
DUSP1
|
dual specificity phosphatase 1 |
| chr5_-_24645078 | 7.12 |
ENST00000264463.4
|
CDH10
|
cadherin 10, type 2 (T2-cadherin) |
| chr3_-_127455200 | 6.78 |
ENST00000398101.3
|
MGLL
|
monoglyceride lipase |
| chr2_+_166095898 | 6.73 |
ENST00000424833.1
ENST00000375437.2 ENST00000357398.3 |
SCN2A
|
sodium channel, voltage-gated, type II, alpha subunit |
| chr7_-_37488834 | 6.68 |
ENST00000310758.4
|
ELMO1
|
engulfment and cell motility 1 |
| chr14_+_23299088 | 6.51 |
ENST00000355151.5
ENST00000397496.3 ENST00000555345.1 ENST00000432849.3 ENST00000553711.1 ENST00000556465.1 ENST00000397505.2 ENST00000557221.1 ENST00000311892.6 ENST00000556840.1 ENST00000555536.1 |
MRPL52
|
mitochondrial ribosomal protein L52 |
| chr3_-_16524357 | 6.50 |
ENST00000432519.1
|
RFTN1
|
raftlin, lipid raft linker 1 |
| chr6_-_152489484 | 6.48 |
ENST00000354674.4
ENST00000539504.1 |
SYNE1
|
spectrin repeat containing, nuclear envelope 1 |
| chr16_+_6069072 | 6.27 |
ENST00000547605.1
ENST00000550418.1 ENST00000553186.1 |
RBFOX1
|
RNA binding protein, fox-1 homolog (C. elegans) 1 |
| chr3_+_39509163 | 6.13 |
ENST00000436143.2
ENST00000441980.2 ENST00000311042.6 |
MOBP
|
myelin-associated oligodendrocyte basic protein |
| chr3_+_39509070 | 5.72 |
ENST00000354668.4
ENST00000428261.1 ENST00000420739.1 ENST00000415443.1 ENST00000447324.1 ENST00000383754.3 |
MOBP
|
myelin-associated oligodendrocyte basic protein |
| chr13_+_50070077 | 5.70 |
ENST00000378319.3
ENST00000426879.1 |
PHF11
|
PHD finger protein 11 |
| chr4_+_71588372 | 5.63 |
ENST00000536664.1
|
RUFY3
|
RUN and FYVE domain containing 3 |
| chr9_-_100000957 | 5.57 |
ENST00000366109.2
ENST00000607322.1 |
RP11-498P14.5
|
RP11-498P14.5 |
| chr10_+_95517616 | 5.56 |
ENST00000371418.4
|
LGI1
|
leucine-rich, glioma inactivated 1 |
| chr7_+_139529040 | 5.42 |
ENST00000455353.1
ENST00000458722.1 ENST00000411653.1 |
TBXAS1
|
thromboxane A synthase 1 (platelet) |
| chr1_-_57045228 | 5.39 |
ENST00000371250.3
|
PPAP2B
|
phosphatidic acid phosphatase type 2B |
| chr3_-_121379739 | 5.33 |
ENST00000428394.2
ENST00000314583.3 |
HCLS1
|
hematopoietic cell-specific Lyn substrate 1 |
| chr4_-_99578789 | 5.26 |
ENST00000511651.1
ENST00000505184.1 |
TSPAN5
|
tetraspanin 5 |
| chr8_+_79428539 | 5.16 |
ENST00000352966.5
|
PKIA
|
protein kinase (cAMP-dependent, catalytic) inhibitor alpha |
| chr12_+_101988627 | 5.12 |
ENST00000547405.1
ENST00000452455.2 ENST00000441232.1 ENST00000360610.2 ENST00000392934.3 ENST00000547509.1 ENST00000361685.2 ENST00000549145.1 ENST00000553190.1 |
MYBPC1
|
myosin binding protein C, slow type |
| chr12_+_51318513 | 5.11 |
ENST00000332160.4
|
METTL7A
|
methyltransferase like 7A |
| chr4_+_79567362 | 5.07 |
ENST00000512322.1
|
RP11-792D21.2
|
long intergenic non-protein coding RNA 1094 |
| chr4_-_102268484 | 5.01 |
ENST00000394853.4
|
PPP3CA
|
protein phosphatase 3, catalytic subunit, alpha isozyme |
| chr12_-_99038732 | 4.90 |
ENST00000393042.3
ENST00000420861.1 ENST00000299157.4 ENST00000342502.2 |
IKBIP
|
IKBKB interacting protein |
| chr22_-_17680472 | 4.86 |
ENST00000330232.4
|
CECR1
|
cat eye syndrome chromosome region, candidate 1 |
| chr7_+_139528952 | 4.85 |
ENST00000416849.2
ENST00000436047.2 ENST00000414508.2 ENST00000448866.1 |
TBXAS1
|
thromboxane A synthase 1 (platelet) |
| chr20_+_9494987 | 4.85 |
ENST00000427562.2
ENST00000246070.2 |
LAMP5
|
lysosomal-associated membrane protein family, member 5 |
| chr2_-_158345462 | 4.83 |
ENST00000439355.1
ENST00000540637.1 |
CYTIP
|
cytohesin 1 interacting protein |
| chr12_-_21487829 | 4.78 |
ENST00000445053.1
ENST00000452078.1 ENST00000458504.1 ENST00000422327.1 ENST00000421294.1 |
SLCO1A2
|
solute carrier organic anion transporter family, member 1A2 |
| chr4_-_87028478 | 4.77 |
ENST00000515400.1
ENST00000395157.3 |
MAPK10
|
mitogen-activated protein kinase 10 |
| chr5_+_161495038 | 4.71 |
ENST00000393933.4
|
GABRG2
|
gamma-aminobutyric acid (GABA) A receptor, gamma 2 |
| chr4_-_102268628 | 4.71 |
ENST00000323055.6
ENST00000512215.1 ENST00000394854.3 |
PPP3CA
|
protein phosphatase 3, catalytic subunit, alpha isozyme |
| chr15_+_58430368 | 4.70 |
ENST00000558772.1
ENST00000219919.4 |
AQP9
|
aquaporin 9 |
| chr1_-_150669604 | 4.69 |
ENST00000427665.1
ENST00000540514.1 |
GOLPH3L
|
golgi phosphoprotein 3-like |
| chr10_+_95517566 | 4.66 |
ENST00000542308.1
|
LGI1
|
leucine-rich, glioma inactivated 1 |
| chr4_-_176733897 | 4.51 |
ENST00000393658.2
|
GPM6A
|
glycoprotein M6A |
| chr4_+_79567314 | 4.49 |
ENST00000503539.1
ENST00000504675.1 |
RP11-792D21.2
|
long intergenic non-protein coding RNA 1094 |
| chr14_-_21492113 | 4.42 |
ENST00000554094.1
|
NDRG2
|
NDRG family member 2 |
| chr1_+_244214577 | 4.42 |
ENST00000358704.4
|
ZBTB18
|
zinc finger and BTB domain containing 18 |
| chrX_-_13835147 | 4.40 |
ENST00000493677.1
ENST00000355135.2 |
GPM6B
|
glycoprotein M6B |
| chr13_-_67802549 | 4.39 |
ENST00000328454.5
ENST00000377865.2 |
PCDH9
|
protocadherin 9 |
| chr12_+_59989791 | 4.38 |
ENST00000552432.1
|
SLC16A7
|
solute carrier family 16 (monocarboxylate transporter), member 7 |
| chr15_+_58430567 | 4.36 |
ENST00000536493.1
|
AQP9
|
aquaporin 9 |
| chr11_-_104480019 | 4.34 |
ENST00000536529.1
ENST00000545630.1 ENST00000538641.1 |
RP11-886D15.1
|
RP11-886D15.1 |
| chrX_-_13835461 | 4.33 |
ENST00000316715.4
ENST00000356942.5 |
GPM6B
|
glycoprotein M6B |
| chr5_+_140220769 | 4.30 |
ENST00000531613.1
ENST00000378123.3 |
PCDHA8
|
protocadherin alpha 8 |
| chr19_+_45971246 | 4.16 |
ENST00000585836.1
ENST00000417353.2 ENST00000353609.3 ENST00000591858.1 ENST00000443841.2 ENST00000590335.1 |
FOSB
|
FBJ murine osteosarcoma viral oncogene homolog B |
| chr19_-_40919271 | 4.12 |
ENST00000291825.7
ENST00000324001.7 |
PRX
|
periaxin |
| chr14_+_91580732 | 4.08 |
ENST00000519019.1
ENST00000523816.1 ENST00000517518.1 |
C14orf159
|
chromosome 14 open reading frame 159 |
| chr11_+_63304273 | 4.04 |
ENST00000439013.2
ENST00000255688.3 |
RARRES3
|
retinoic acid receptor responder (tazarotene induced) 3 |
| chr14_+_90863327 | 4.00 |
ENST00000356978.4
|
CALM1
|
calmodulin 1 (phosphorylase kinase, delta) |
| chr14_+_91580777 | 3.99 |
ENST00000525393.2
ENST00000428926.2 ENST00000517362.1 |
C14orf159
|
chromosome 14 open reading frame 159 |
| chr14_+_91580357 | 3.99 |
ENST00000298858.4
ENST00000521081.1 ENST00000520328.1 ENST00000256324.10 ENST00000524232.1 ENST00000522170.1 ENST00000519950.1 ENST00000523879.1 ENST00000521077.2 ENST00000518665.2 |
C14orf159
|
chromosome 14 open reading frame 159 |
| chr2_-_145275228 | 3.94 |
ENST00000427902.1
ENST00000409487.3 ENST00000470879.1 ENST00000435831.1 |
ZEB2
|
zinc finger E-box binding homeobox 2 |
| chr1_-_182360918 | 3.93 |
ENST00000339526.4
|
GLUL
|
glutamate-ammonia ligase |
| chr7_+_121513143 | 3.93 |
ENST00000393386.2
|
PTPRZ1
|
protein tyrosine phosphatase, receptor-type, Z polypeptide 1 |
| chr11_+_5710919 | 3.90 |
ENST00000379965.3
ENST00000425490.1 |
TRIM22
|
tripartite motif containing 22 |
| chr16_+_15528332 | 3.90 |
ENST00000566490.1
|
C16orf45
|
chromosome 16 open reading frame 45 |
| chr11_+_108535849 | 3.90 |
ENST00000526794.1
|
DDX10
|
DEAD (Asp-Glu-Ala-Asp) box polypeptide 10 |
| chr14_+_91580708 | 3.89 |
ENST00000518868.1
|
C14orf159
|
chromosome 14 open reading frame 159 |
| chr2_+_166150541 | 3.83 |
ENST00000283256.6
|
SCN2A
|
sodium channel, voltage-gated, type II, alpha subunit |
| chr14_-_21492251 | 3.82 |
ENST00000554398.1
|
NDRG2
|
NDRG family member 2 |
| chr9_-_122131696 | 3.77 |
ENST00000373964.2
ENST00000265922.3 |
BRINP1
|
bone morphogenetic protein/retinoic acid inducible neural-specific 1 |
| chr7_-_115670792 | 3.77 |
ENST00000265440.7
ENST00000393485.1 |
TFEC
|
transcription factor EC |
| chr15_+_89182156 | 3.76 |
ENST00000379224.5
|
ISG20
|
interferon stimulated exonuclease gene 20kDa |
| chr12_+_101988774 | 3.75 |
ENST00000545503.2
ENST00000536007.1 ENST00000541119.1 ENST00000361466.2 ENST00000551300.1 ENST00000550270.1 |
MYBPC1
|
myosin binding protein C, slow type |
| chr1_+_111415757 | 3.74 |
ENST00000429072.2
ENST00000271324.5 |
CD53
|
CD53 molecule |
| chr15_+_89181974 | 3.70 |
ENST00000306072.5
|
ISG20
|
interferon stimulated exonuclease gene 20kDa |
| chr14_+_91581011 | 3.64 |
ENST00000523894.1
ENST00000522322.1 ENST00000523771.1 |
C14orf159
|
chromosome 14 open reading frame 159 |
| chr5_+_36608422 | 3.63 |
ENST00000381918.3
|
SLC1A3
|
solute carrier family 1 (glial high affinity glutamate transporter), member 3 |
| chr2_+_173686303 | 3.63 |
ENST00000397087.3
|
RAPGEF4
|
Rap guanine nucleotide exchange factor (GEF) 4 |
| chr6_+_89790490 | 3.63 |
ENST00000336032.3
|
PNRC1
|
proline-rich nuclear receptor coactivator 1 |
| chr1_-_152332480 | 3.61 |
ENST00000388718.5
|
FLG2
|
filaggrin family member 2 |
| chr16_-_28621312 | 3.61 |
ENST00000314752.7
|
SULT1A1
|
sulfotransferase family, cytosolic, 1A, phenol-preferring, member 1 |
| chr1_+_50571949 | 3.58 |
ENST00000357083.4
|
ELAVL4
|
ELAV like neuron-specific RNA binding protein 4 |
| chr8_-_120685608 | 3.56 |
ENST00000427067.2
|
ENPP2
|
ectonucleotide pyrophosphatase/phosphodiesterase 2 |
| chr11_-_78052923 | 3.55 |
ENST00000340149.2
|
GAB2
|
GRB2-associated binding protein 2 |
| chr3_-_127541194 | 3.55 |
ENST00000453507.2
|
MGLL
|
monoglyceride lipase |
| chr1_+_25664408 | 3.54 |
ENST00000374358.4
|
TMEM50A
|
transmembrane protein 50A |
| chr11_-_5255861 | 3.52 |
ENST00000380299.3
|
HBD
|
hemoglobin, delta |
| chr3_-_10547333 | 3.47 |
ENST00000383800.4
|
ATP2B2
|
ATPase, Ca++ transporting, plasma membrane 2 |
| chr22_+_37678424 | 3.46 |
ENST00000248901.6
|
CYTH4
|
cytohesin 4 |
| chr15_+_89182178 | 3.40 |
ENST00000559876.1
|
ISG20
|
interferon stimulated exonuclease gene 20kDa |
| chr17_-_73844722 | 3.39 |
ENST00000586257.1
|
WBP2
|
WW domain binding protein 2 |
| chr18_+_77160282 | 3.27 |
ENST00000318065.5
ENST00000545796.1 ENST00000592223.1 ENST00000329101.4 ENST00000586434.1 |
NFATC1
|
nuclear factor of activated T-cells, cytoplasmic, calcineurin-dependent 1 |
| chr8_-_18871159 | 3.26 |
ENST00000327040.8
ENST00000440756.2 |
PSD3
|
pleckstrin and Sec7 domain containing 3 |
| chr17_+_4613918 | 3.26 |
ENST00000574954.1
ENST00000346341.2 ENST00000572457.1 ENST00000381488.6 ENST00000412477.3 ENST00000571428.1 ENST00000575877.1 |
ARRB2
|
arrestin, beta 2 |
| chr2_-_85839146 | 3.24 |
ENST00000306336.5
ENST00000409734.3 |
C2orf68
|
chromosome 2 open reading frame 68 |
| chr18_-_53253323 | 3.21 |
ENST00000540999.1
ENST00000563888.2 |
TCF4
|
transcription factor 4 |
| chr4_+_165675269 | 3.19 |
ENST00000507311.1
|
RP11-294O2.2
|
RP11-294O2.2 |
| chr2_+_233497931 | 3.17 |
ENST00000264059.3
|
EFHD1
|
EF-hand domain family, member D1 |
| chr16_-_4852915 | 3.14 |
ENST00000322048.7
|
ROGDI
|
rogdi homolog (Drosophila) |
| chr5_-_127674883 | 3.14 |
ENST00000507835.1
|
FBN2
|
fibrillin 2 |
| chr1_-_160681593 | 3.10 |
ENST00000368045.3
ENST00000368046.3 |
CD48
|
CD48 molecule |
| chr6_+_150690133 | 3.09 |
ENST00000392255.3
ENST00000500320.3 |
IYD
|
iodotyrosine deiodinase |
| chr1_-_182360498 | 3.08 |
ENST00000417584.2
|
GLUL
|
glutamate-ammonia ligase |
| chr3_-_10547192 | 3.04 |
ENST00000360273.2
ENST00000343816.4 |
ATP2B2
|
ATPase, Ca++ transporting, plasma membrane 2 |
| chr6_+_101846664 | 3.03 |
ENST00000421544.1
ENST00000413795.1 ENST00000369138.1 ENST00000358361.3 |
GRIK2
|
glutamate receptor, ionotropic, kainate 2 |
| chrM_+_4431 | 3.03 |
ENST00000361453.3
|
MT-ND2
|
mitochondrially encoded NADH dehydrogenase 2 |
| chr18_-_53089723 | 3.02 |
ENST00000561992.1
ENST00000562512.2 |
TCF4
|
transcription factor 4 |
| chr1_-_9811600 | 3.02 |
ENST00000435891.1
|
CLSTN1
|
calsyntenin 1 |
| chr18_-_53253112 | 3.00 |
ENST00000568673.1
ENST00000562847.1 ENST00000568147.1 |
TCF4
|
transcription factor 4 |
| chr1_-_177134024 | 2.99 |
ENST00000367654.3
|
ASTN1
|
astrotactin 1 |
| chr1_+_226411319 | 2.97 |
ENST00000542034.1
ENST00000366810.5 |
MIXL1
|
Mix paired-like homeobox |
| chr2_-_211341411 | 2.95 |
ENST00000233714.4
ENST00000443314.1 ENST00000441020.3 ENST00000450366.2 ENST00000431941.2 |
LANCL1
|
LanC lantibiotic synthetase component C-like 1 (bacterial) |
| chr8_+_85095497 | 2.95 |
ENST00000522455.1
ENST00000521695.1 |
RALYL
|
RALY RNA binding protein-like |
| chr19_+_782755 | 2.95 |
ENST00000606242.1
ENST00000586061.1 |
AC006273.5
|
AC006273.5 |
| chr13_+_113633620 | 2.93 |
ENST00000421756.1
ENST00000375601.3 |
MCF2L
|
MCF.2 cell line derived transforming sequence-like |
| chr3_+_115342159 | 2.91 |
ENST00000305124.6
|
GAP43
|
growth associated protein 43 |
| chr1_-_226926864 | 2.90 |
ENST00000429204.1
ENST00000366784.1 |
ITPKB
|
inositol-trisphosphate 3-kinase B |
| chr4_-_90756769 | 2.89 |
ENST00000345009.4
ENST00000505199.1 ENST00000502987.1 |
SNCA
|
synuclein, alpha (non A4 component of amyloid precursor) |
| chr11_+_46368956 | 2.87 |
ENST00000543978.1
|
DGKZ
|
diacylglycerol kinase, zeta |
| chr4_-_102267953 | 2.87 |
ENST00000523694.2
ENST00000507176.1 |
PPP3CA
|
protein phosphatase 3, catalytic subunit, alpha isozyme |
| chr2_+_29204161 | 2.86 |
ENST00000379558.4
ENST00000403861.2 |
FAM179A
|
family with sequence similarity 179, member A |
| chr11_+_65657875 | 2.85 |
ENST00000312579.2
|
CCDC85B
|
coiled-coil domain containing 85B |
| chr1_+_202995611 | 2.83 |
ENST00000367240.2
|
PPFIA4
|
protein tyrosine phosphatase, receptor type, f polypeptide (PTPRF), interacting protein (liprin), alpha 4 |
| chr11_-_107582775 | 2.81 |
ENST00000305991.2
|
SLN
|
sarcolipin |
| chr16_-_28621298 | 2.79 |
ENST00000566189.1
|
SULT1A1
|
sulfotransferase family, cytosolic, 1A, phenol-preferring, member 1 |
| chr11_-_59950622 | 2.78 |
ENST00000323961.3
ENST00000412309.2 |
MS4A6A
|
membrane-spanning 4-domains, subfamily A, member 6A |
| chr1_-_182361327 | 2.76 |
ENST00000331872.6
ENST00000311223.5 |
GLUL
|
glutamate-ammonia ligase |
| chr14_-_94854926 | 2.72 |
ENST00000402629.1
ENST00000556091.1 ENST00000554720.1 |
SERPINA1
|
serpin peptidase inhibitor, clade A (alpha-1 antiproteinase, antitrypsin), member 1 |
| chr15_+_78730622 | 2.72 |
ENST00000560440.1
|
IREB2
|
iron-responsive element binding protein 2 |
| chr3_+_158991025 | 2.71 |
ENST00000337808.6
|
IQCJ-SCHIP1
|
IQCJ-SCHIP1 readthrough |
| chr8_+_85095553 | 2.70 |
ENST00000521268.1
|
RALYL
|
RALY RNA binding protein-like |
| chr1_+_2005425 | 2.68 |
ENST00000461106.2
|
PRKCZ
|
protein kinase C, zeta |
| chr1_-_170043709 | 2.67 |
ENST00000367767.1
ENST00000361580.2 ENST00000538366.1 |
KIFAP3
|
kinesin-associated protein 3 |
| chr1_+_198608146 | 2.65 |
ENST00000367376.2
ENST00000352140.3 ENST00000594404.1 ENST00000598951.1 ENST00000530727.1 ENST00000442510.2 ENST00000367367.4 ENST00000348564.6 ENST00000367364.1 ENST00000413409.2 |
PTPRC
|
protein tyrosine phosphatase, receptor type, C |
| chr18_-_53177984 | 2.61 |
ENST00000543082.1
|
TCF4
|
transcription factor 4 |
| chr1_-_15911510 | 2.57 |
ENST00000375826.3
|
AGMAT
|
agmatine ureohydrolase (agmatinase) |
| chr4_-_99578776 | 2.54 |
ENST00000515287.1
|
TSPAN5
|
tetraspanin 5 |
| chr3_+_158787041 | 2.53 |
ENST00000471575.1
ENST00000476809.1 ENST00000485419.1 |
IQCJ-SCHIP1
|
IQCJ-SCHIP1 readthrough |
| chr19_+_8483272 | 2.52 |
ENST00000602117.1
|
MARCH2
|
membrane-associated ring finger (C3HC4) 2, E3 ubiquitin protein ligase |
| chr8_-_120651020 | 2.51 |
ENST00000522826.1
ENST00000520066.1 ENST00000259486.6 ENST00000075322.6 |
ENPP2
|
ectonucleotide pyrophosphatase/phosphodiesterase 2 |
| chr3_-_49131788 | 2.51 |
ENST00000395443.2
ENST00000411682.1 |
QRICH1
|
glutamine-rich 1 |
| chr1_+_150122034 | 2.48 |
ENST00000025469.6
ENST00000369124.4 |
PLEKHO1
|
pleckstrin homology domain containing, family O member 1 |
| chr12_-_15114603 | 2.47 |
ENST00000228945.4
|
ARHGDIB
|
Rho GDP dissociation inhibitor (GDI) beta |
| chr11_-_790060 | 2.45 |
ENST00000330106.4
|
CEND1
|
cell cycle exit and neuronal differentiation 1 |
| chr7_+_80231466 | 2.45 |
ENST00000309881.7
ENST00000534394.1 |
CD36
|
CD36 molecule (thrombospondin receptor) |
| chr18_+_32556892 | 2.43 |
ENST00000591734.1
ENST00000413393.1 ENST00000589180.1 ENST00000587359.1 |
MAPRE2
|
microtubule-associated protein, RP/EB family, member 2 |
| chr17_-_73851285 | 2.42 |
ENST00000589642.1
ENST00000593002.1 ENST00000590221.1 ENST00000344296.4 ENST00000587374.1 ENST00000585462.1 ENST00000433525.2 ENST00000254806.3 |
WBP2
|
WW domain binding protein 2 |
| chr4_-_74486347 | 2.42 |
ENST00000342081.3
|
RASSF6
|
Ras association (RalGDS/AF-6) domain family member 6 |
| chr16_+_2588012 | 2.41 |
ENST00000354836.5
ENST00000389224.3 |
PDPK1
|
3-phosphoinositide dependent protein kinase-1 |
| chrX_-_70331298 | 2.41 |
ENST00000456850.2
ENST00000473378.1 ENST00000487883.1 ENST00000374202.2 |
IL2RG
|
interleukin 2 receptor, gamma |
| chr13_-_33002151 | 2.40 |
ENST00000495479.1
ENST00000343281.4 ENST00000464470.1 ENST00000380139.4 ENST00000380133.2 |
N4BP2L1
|
NEDD4 binding protein 2-like 1 |
| chr4_-_153274078 | 2.40 |
ENST00000263981.5
|
FBXW7
|
F-box and WD repeat domain containing 7, E3 ubiquitin protein ligase |
| chr1_+_229440129 | 2.39 |
ENST00000366688.3
|
SPHAR
|
S-phase response (cyclin related) |
| chrX_+_9431324 | 2.39 |
ENST00000407597.2
ENST00000424279.1 ENST00000536365.1 ENST00000441088.1 ENST00000380961.1 ENST00000415293.1 |
TBL1X
|
transducin (beta)-like 1X-linked |
| chr7_+_151771377 | 2.37 |
ENST00000434507.1
|
GALNT11
|
UDP-N-acetyl-alpha-D-galactosamine:polypeptide N-acetylgalactosaminyltransferase 11 (GalNAc-T11) |
| chr19_+_3880581 | 2.36 |
ENST00000450849.2
ENST00000301260.6 ENST00000398448.3 |
ATCAY
|
ataxia, cerebellar, Cayman type |
| chr1_+_66797687 | 2.35 |
ENST00000371045.5
ENST00000531025.1 ENST00000526197.1 |
PDE4B
|
phosphodiesterase 4B, cAMP-specific |
| chr12_+_54892550 | 2.34 |
ENST00000545638.2
|
NCKAP1L
|
NCK-associated protein 1-like |
| chr12_-_51718436 | 2.34 |
ENST00000544402.1
|
BIN2
|
bridging integrator 2 |
| chr7_+_29237354 | 2.33 |
ENST00000546235.1
|
CHN2
|
chimerin 2 |
| chr2_-_224467093 | 2.32 |
ENST00000305409.2
|
SCG2
|
secretogranin II |
| chr1_-_177133818 | 2.31 |
ENST00000424564.2
ENST00000361833.2 |
ASTN1
|
astrotactin 1 |
| chr6_+_31553978 | 2.30 |
ENST00000376096.1
ENST00000376099.1 ENST00000376110.3 |
LST1
|
leukocyte specific transcript 1 |
| chr8_+_85618155 | 2.29 |
ENST00000523850.1
ENST00000521376.1 |
RALYL
|
RALY RNA binding protein-like |
| chr2_+_163175394 | 2.26 |
ENST00000446271.1
ENST00000429691.2 |
GCA
|
grancalcin, EF-hand calcium binding protein |
| chr12_-_26278030 | 2.26 |
ENST00000242728.4
|
BHLHE41
|
basic helix-loop-helix family, member e41 |
| chr11_+_108093559 | 2.25 |
ENST00000278616.4
|
ATM
|
ataxia telangiectasia mutated |
| chr19_-_37701386 | 2.25 |
ENST00000527838.1
ENST00000591492.1 ENST00000532828.2 |
ZNF585B
|
zinc finger protein 585B |
| chr4_-_90759440 | 2.25 |
ENST00000336904.3
|
SNCA
|
synuclein, alpha (non A4 component of amyloid precursor) |
| chr7_+_80275752 | 2.25 |
ENST00000419819.2
|
CD36
|
CD36 molecule (thrombospondin receptor) |
| chr10_+_111967345 | 2.24 |
ENST00000332674.5
ENST00000453116.1 |
MXI1
|
MAX interactor 1, dimerization protein |
| chr7_+_80267973 | 2.24 |
ENST00000394788.3
ENST00000447544.2 |
CD36
|
CD36 molecule (thrombospondin receptor) |
| chr11_+_27076764 | 2.22 |
ENST00000525090.1
|
BBOX1
|
butyrobetaine (gamma), 2-oxoglutarate dioxygenase (gamma-butyrobetaine hydroxylase) 1 |
Network of associatons between targets according to the STRING database.

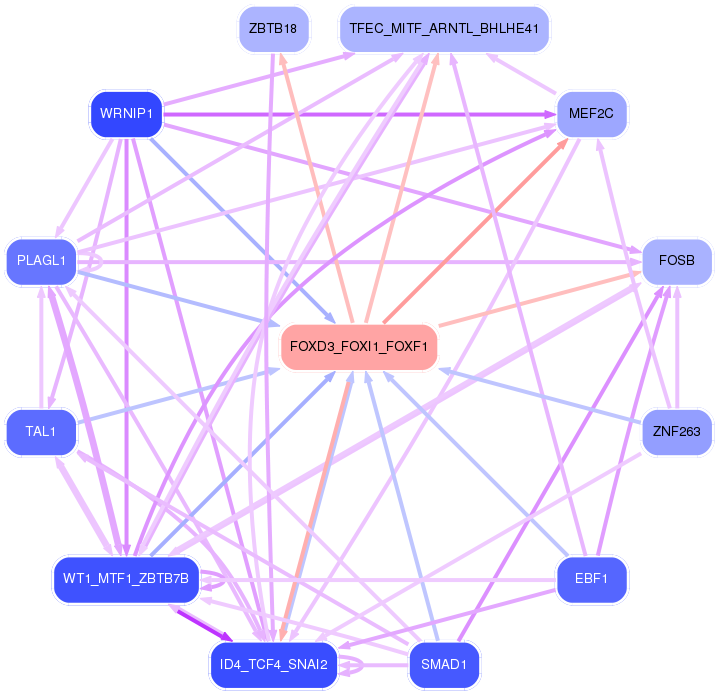
First level regulatory network of FOXD3_FOXI1_FOXF1
Gene Ontology Analysis
Gene overrepresentation in biological_process category:
| Log-likelihood per target | Total log-likelihood | Term | Description |
|---|---|---|---|
| 4.8 | 24.2 | GO:2000638 | regulation of SREBP signaling pathway(GO:2000638) negative regulation of SREBP signaling pathway(GO:2000639) |
| 4.2 | 12.6 | GO:1905205 | positive regulation of connective tissue replacement(GO:1905205) |
| 3.8 | 15.1 | GO:0003172 | primary heart field specification(GO:0003138) sinoatrial valve development(GO:0003172) sinoatrial valve morphogenesis(GO:0003185) |
| 3.6 | 10.9 | GO:0000738 | DNA catabolic process, exonucleolytic(GO:0000738) |
| 3.3 | 10.0 | GO:0098746 | fast, calcium ion-dependent exocytosis of neurotransmitter(GO:0098746) |
| 3.3 | 9.9 | GO:1904647 | response to rotenone(GO:1904647) |
| 3.0 | 9.0 | GO:2000097 | regulation of smooth muscle cell-matrix adhesion(GO:2000097) |
| 2.4 | 9.6 | GO:0006542 | glutamine biosynthetic process(GO:0006542) |
| 2.4 | 2.4 | GO:0045763 | negative regulation of cellular amino acid metabolic process(GO:0045763) |
| 2.2 | 11.0 | GO:0014738 | regulation of muscle hyperplasia(GO:0014738) |
| 2.1 | 38.4 | GO:0007021 | tubulin complex assembly(GO:0007021) |
| 1.8 | 9.1 | GO:0015722 | canalicular bile acid transport(GO:0015722) pyrimidine nucleobase transport(GO:0015855) urea transmembrane transport(GO:0071918) purine nucleobase transmembrane transport(GO:1904823) |
| 1.8 | 12.6 | GO:2000334 | lipoprotein particle mediated signaling(GO:0055095) low-density lipoprotein particle mediated signaling(GO:0055096) blood microparticle formation(GO:0072564) regulation of blood microparticle formation(GO:2000332) positive regulation of blood microparticle formation(GO:2000334) |
| 1.6 | 16.3 | GO:0090292 | nuclear matrix anchoring at nuclear membrane(GO:0090292) |
| 1.6 | 15.7 | GO:0051581 | negative regulation of neurotransmitter uptake(GO:0051581) serotonin uptake(GO:0051610) regulation of serotonin uptake(GO:0051611) negative regulation of serotonin uptake(GO:0051612) |
| 1.5 | 10.3 | GO:2000124 | regulation of endocannabinoid signaling pathway(GO:2000124) |
| 1.2 | 1.2 | GO:0038180 | nerve growth factor signaling pathway(GO:0038180) |
| 1.1 | 18.3 | GO:0040015 | negative regulation of multicellular organism growth(GO:0040015) |
| 1.1 | 3.4 | GO:1903526 | negative regulation of membrane tubulation(GO:1903526) |
| 1.1 | 5.4 | GO:0002032 | desensitization of G-protein coupled receptor protein signaling pathway by arrestin(GO:0002032) |
| 1.1 | 4.3 | GO:0071461 | cellular response to redox state(GO:0071461) |
| 1.0 | 2.0 | GO:0071168 | protein localization to chromatin(GO:0071168) |
| 1.0 | 2.0 | GO:0045900 | negative regulation of translational elongation(GO:0045900) |
| 1.0 | 3.9 | GO:1902748 | positive regulation of lens fiber cell differentiation(GO:1902748) |
| 1.0 | 7.7 | GO:0007258 | JUN phosphorylation(GO:0007258) |
| 0.9 | 2.8 | GO:1901877 | regulation of calcium ion binding(GO:1901876) negative regulation of calcium ion binding(GO:1901877) |
| 0.9 | 6.5 | GO:0032596 | protein transport within lipid bilayer(GO:0032594) protein transport into membrane raft(GO:0032596) |
| 0.9 | 7.3 | GO:0051388 | positive regulation of neurotrophin TRK receptor signaling pathway(GO:0051388) |
| 0.9 | 5.5 | GO:0000821 | regulation of arginine metabolic process(GO:0000821) basic amino acid transmembrane transport(GO:1990822) |
| 0.9 | 2.7 | GO:0046586 | regulation of calcium-dependent cell-cell adhesion(GO:0046586) |
| 0.9 | 4.4 | GO:0045586 | regulation of gamma-delta T cell differentiation(GO:0045586) |
| 0.9 | 2.6 | GO:0042494 | detection of bacterial lipoprotein(GO:0042494) detection of triacyl bacterial lipopeptide(GO:0042495) detection of bacterial lipopeptide(GO:0070340) |
| 0.8 | 11.9 | GO:0030050 | vesicle transport along actin filament(GO:0030050) |
| 0.8 | 0.8 | GO:0032481 | positive regulation of type I interferon production(GO:0032481) |
| 0.8 | 5.8 | GO:0071442 | positive regulation of histone H3-K14 acetylation(GO:0071442) |
| 0.8 | 10.6 | GO:0008627 | intrinsic apoptotic signaling pathway in response to osmotic stress(GO:0008627) |
| 0.8 | 0.8 | GO:0002522 | leukocyte migration involved in immune response(GO:0002522) |
| 0.8 | 7.7 | GO:0015939 | pantothenate metabolic process(GO:0015939) |
| 0.8 | 2.3 | GO:0090526 | regulation of gluconeogenesis involved in cellular glucose homeostasis(GO:0090526) |
| 0.8 | 11.3 | GO:0007196 | adenylate cyclase-inhibiting G-protein coupled glutamate receptor signaling pathway(GO:0007196) |
| 0.8 | 2.3 | GO:1904882 | signal transduction involved in G2 DNA damage checkpoint(GO:0072425) signal transduction involved in mitotic G2 DNA damage checkpoint(GO:0072434) telomerase catalytic core complex assembly(GO:1904868) regulation of telomerase catalytic core complex assembly(GO:1904882) positive regulation of telomerase catalytic core complex assembly(GO:1904884) |
| 0.7 | 3.7 | GO:1903976 | negative regulation of glial cell migration(GO:1903976) |
| 0.7 | 1.5 | GO:0032687 | negative regulation of interferon-alpha production(GO:0032687) |
| 0.7 | 2.9 | GO:0042357 | thiamine diphosphate metabolic process(GO:0042357) |
| 0.7 | 9.4 | GO:0071688 | striated muscle myosin thick filament assembly(GO:0071688) |
| 0.7 | 5.3 | GO:1901475 | pyruvate transport(GO:0006848) pyruvate transmembrane transport(GO:1901475) |
| 0.7 | 5.3 | GO:1990416 | cellular response to brain-derived neurotrophic factor stimulus(GO:1990416) |
| 0.7 | 5.3 | GO:0031087 | deadenylation-independent decapping of nuclear-transcribed mRNA(GO:0031087) |
| 0.6 | 3.2 | GO:0032455 | nerve growth factor processing(GO:0032455) |
| 0.6 | 2.6 | GO:1901162 | primary amino compound biosynthetic process(GO:1901162) |
| 0.6 | 1.9 | GO:0032782 | bile acid secretion(GO:0032782) |
| 0.6 | 1.8 | GO:0021764 | amygdala development(GO:0021764) |
| 0.6 | 2.4 | GO:0038171 | cannabinoid signaling pathway(GO:0038171) |
| 0.6 | 10.2 | GO:0019371 | cyclooxygenase pathway(GO:0019371) |
| 0.6 | 11.4 | GO:0033008 | positive regulation of mast cell activation involved in immune response(GO:0033008) positive regulation of mast cell degranulation(GO:0043306) |
| 0.6 | 3.0 | GO:2000382 | positive regulation of mesoderm development(GO:2000382) |
| 0.6 | 4.7 | GO:0071352 | cellular response to interleukin-2(GO:0071352) |
| 0.6 | 2.3 | GO:0072402 | response to cell cycle checkpoint signaling(GO:0072396) response to DNA integrity checkpoint signaling(GO:0072402) response to DNA damage checkpoint signaling(GO:0072423) |
| 0.6 | 18.6 | GO:2000114 | regulation of establishment of cell polarity(GO:2000114) |
| 0.6 | 1.7 | GO:1901189 | arterial endothelial cell fate commitment(GO:0060844) blood vessel lumenization(GO:0072554) positive regulation of ephrin receptor signaling pathway(GO:1901189) positive regulation of canonical Wnt signaling pathway involved in cardiac muscle cell fate commitment(GO:1901297) positive regulation of canonical Wnt signaling pathway involved in heart development(GO:1905068) |
| 0.6 | 4.0 | GO:0033029 | regulation of neutrophil apoptotic process(GO:0033029) |
| 0.6 | 23.2 | GO:0006536 | glutamate metabolic process(GO:0006536) |
| 0.6 | 1.7 | GO:0045423 | regulation of granulocyte macrophage colony-stimulating factor biosynthetic process(GO:0045423) positive regulation of granulocyte macrophage colony-stimulating factor biosynthetic process(GO:0045425) |
| 0.6 | 3.4 | GO:1904381 | Golgi apparatus mannose trimming(GO:1904381) |
| 0.6 | 1.1 | GO:0034113 | heterotypic cell-cell adhesion(GO:0034113) |
| 0.6 | 3.9 | GO:0035701 | hematopoietic stem cell migration(GO:0035701) |
| 0.5 | 8.2 | GO:0090361 | platelet-derived growth factor production(GO:0090360) regulation of platelet-derived growth factor production(GO:0090361) |
| 0.5 | 8.7 | GO:0035970 | peptidyl-threonine dephosphorylation(GO:0035970) |
| 0.5 | 2.1 | GO:0002904 | positive regulation of B cell apoptotic process(GO:0002904) |
| 0.5 | 1.0 | GO:0007632 | visual behavior(GO:0007632) |
| 0.5 | 10.4 | GO:0071420 | cellular response to histamine(GO:0071420) |
| 0.5 | 2.0 | GO:0014816 | skeletal muscle satellite cell differentiation(GO:0014816) |
| 0.5 | 1.5 | GO:0001694 | histamine biosynthetic process(GO:0001694) |
| 0.5 | 1.5 | GO:0019417 | sulfur oxidation(GO:0019417) |
| 0.5 | 21.3 | GO:0035235 | ionotropic glutamate receptor signaling pathway(GO:0035235) |
| 0.5 | 9.4 | GO:0006068 | ethanol catabolic process(GO:0006068) |
| 0.5 | 2.4 | GO:0021699 | cerebellum maturation(GO:0021590) cerebellar cortex maturation(GO:0021699) |
| 0.5 | 2.0 | GO:0050717 | positive regulation of interleukin-1 alpha secretion(GO:0050717) |
| 0.5 | 15.6 | GO:0016601 | Rac protein signal transduction(GO:0016601) |
| 0.5 | 2.9 | GO:0016198 | axon choice point recognition(GO:0016198) |
| 0.5 | 1.4 | GO:0099643 | neurotransmitter secretion(GO:0007269) signal release from synapse(GO:0099643) |
| 0.4 | 7.6 | GO:0043562 | cellular response to nitrogen starvation(GO:0006995) cellular response to nitrogen levels(GO:0043562) |
| 0.4 | 2.7 | GO:2000664 | positive regulation of interleukin-5 secretion(GO:2000664) positive regulation of interleukin-10 secretion(GO:2001181) |
| 0.4 | 0.4 | GO:0071347 | cellular response to interleukin-1(GO:0071347) |
| 0.4 | 6.0 | GO:0034638 | phosphatidylcholine catabolic process(GO:0034638) |
| 0.4 | 1.2 | GO:0019477 | L-lysine catabolic process to acetyl-CoA(GO:0019474) L-lysine catabolic process(GO:0019477) L-lysine metabolic process(GO:0046440) |
| 0.4 | 4.3 | GO:0006570 | tyrosine metabolic process(GO:0006570) |
| 0.4 | 1.2 | GO:0032290 | peripheral nervous system myelin formation(GO:0032290) |
| 0.4 | 1.1 | GO:0021542 | dentate gyrus development(GO:0021542) |
| 0.4 | 1.1 | GO:0035915 | pore formation in membrane of other organism(GO:0035915) |
| 0.4 | 6.7 | GO:0032012 | regulation of ARF protein signal transduction(GO:0032012) |
| 0.4 | 3.9 | GO:0032287 | peripheral nervous system myelin maintenance(GO:0032287) |
| 0.3 | 5.9 | GO:2000251 | positive regulation of actin cytoskeleton reorganization(GO:2000251) |
| 0.3 | 15.5 | GO:0042417 | dopamine metabolic process(GO:0042417) |
| 0.3 | 3.4 | GO:2001224 | positive regulation of neuron migration(GO:2001224) |
| 0.3 | 5.3 | GO:0051639 | actin filament network formation(GO:0051639) |
| 0.3 | 1.3 | GO:0032049 | cardiolipin biosynthetic process(GO:0032049) |
| 0.3 | 1.3 | GO:0051835 | positive regulation of synapse structural plasticity(GO:0051835) |
| 0.3 | 2.6 | GO:0098532 | histone H3-K27 trimethylation(GO:0098532) |
| 0.3 | 5.0 | GO:0007614 | short-term memory(GO:0007614) |
| 0.3 | 0.9 | GO:0072709 | cellular response to sorbitol(GO:0072709) |
| 0.3 | 3.7 | GO:0046475 | glycerophospholipid catabolic process(GO:0046475) |
| 0.3 | 0.9 | GO:0061470 | T follicular helper cell differentiation(GO:0061470) |
| 0.3 | 2.1 | GO:0048241 | epinephrine transport(GO:0048241) |
| 0.3 | 2.1 | GO:0002175 | protein localization to paranode region of axon(GO:0002175) |
| 0.3 | 1.8 | GO:0035609 | C-terminal protein deglutamylation(GO:0035609) |
| 0.3 | 1.2 | GO:0006808 | regulation of nitrogen utilization(GO:0006808) nitrogen utilization(GO:0019740) negative regulation of cellular pH reduction(GO:0032848) CD8-positive, alpha-beta T cell lineage commitment(GO:0043375) negative regulation of retinal cell programmed cell death(GO:0046671) |
| 0.3 | 0.9 | GO:0048294 | negative regulation of isotype switching to IgE isotypes(GO:0048294) |
| 0.3 | 1.5 | GO:0010793 | regulation of mRNA export from nucleus(GO:0010793) |
| 0.3 | 2.1 | GO:0031647 | regulation of protein stability(GO:0031647) |
| 0.3 | 2.4 | GO:0061314 | Notch signaling involved in heart development(GO:0061314) |
| 0.3 | 0.9 | GO:0043315 | positive regulation of neutrophil degranulation(GO:0043315) cellular response to gravity(GO:0071258) positive regulation of neutrophil activation(GO:1902565) regulation of transcytosis(GO:1904298) positive regulation of transcytosis(GO:1904300) regulation of maternal process involved in parturition(GO:1904301) positive regulation of maternal process involved in parturition(GO:1904303) response to 2-O-acetyl-1-O-hexadecyl-sn-glycero-3-phosphocholine(GO:1904316) cellular response to 2-O-acetyl-1-O-hexadecyl-sn-glycero-3-phosphocholine(GO:1904317) |
| 0.3 | 0.8 | GO:0098937 | dendritic transport(GO:0098935) anterograde dendritic transport(GO:0098937) |
| 0.3 | 1.1 | GO:0042796 | snRNA transcription from RNA polymerase III promoter(GO:0042796) |
| 0.3 | 1.4 | GO:0048388 | endosomal lumen acidification(GO:0048388) |
| 0.3 | 2.5 | GO:0051451 | myoblast migration(GO:0051451) |
| 0.3 | 2.7 | GO:1903943 | regulation of hepatocyte apoptotic process(GO:1903943) negative regulation of hepatocyte apoptotic process(GO:1903944) |
| 0.3 | 2.7 | GO:1903546 | protein localization to photoreceptor outer segment(GO:1903546) |
| 0.3 | 1.9 | GO:0003096 | renal sodium ion transport(GO:0003096) renal sodium ion absorption(GO:0070294) |
| 0.3 | 2.2 | GO:0017062 | respiratory chain complex III assembly(GO:0017062) mitochondrial respiratory chain complex III assembly(GO:0034551) mitochondrial respiratory chain complex III biogenesis(GO:0097033) |
| 0.3 | 8.1 | GO:0048268 | clathrin coat assembly(GO:0048268) |
| 0.3 | 4.9 | GO:1901841 | regulation of high voltage-gated calcium channel activity(GO:1901841) |
| 0.3 | 1.0 | GO:0048749 | compound eye development(GO:0048749) |
| 0.3 | 1.3 | GO:2001106 | regulation of Rho guanyl-nucleotide exchange factor activity(GO:2001106) |
| 0.3 | 0.3 | GO:0006779 | porphyrin-containing compound metabolic process(GO:0006778) porphyrin-containing compound biosynthetic process(GO:0006779) |
| 0.2 | 15.7 | GO:0000381 | regulation of alternative mRNA splicing, via spliceosome(GO:0000381) |
| 0.2 | 6.6 | GO:0048665 | neuron fate specification(GO:0048665) |
| 0.2 | 3.5 | GO:0015671 | oxygen transport(GO:0015671) |
| 0.2 | 1.4 | GO:0048280 | vesicle fusion with Golgi apparatus(GO:0048280) |
| 0.2 | 1.6 | GO:0045599 | negative regulation of fat cell differentiation(GO:0045599) |
| 0.2 | 0.2 | GO:2000143 | negative regulation of DNA-templated transcription, initiation(GO:2000143) |
| 0.2 | 1.3 | GO:0090073 | positive regulation of protein homodimerization activity(GO:0090073) |
| 0.2 | 1.8 | GO:0019375 | galactosylceramide biosynthetic process(GO:0006682) galactolipid biosynthetic process(GO:0019375) |
| 0.2 | 0.7 | GO:0030037 | actin filament reorganization involved in cell cycle(GO:0030037) |
| 0.2 | 1.5 | GO:0021513 | spinal cord dorsal/ventral patterning(GO:0021513) |
| 0.2 | 1.3 | GO:0000290 | deadenylation-dependent decapping of nuclear-transcribed mRNA(GO:0000290) |
| 0.2 | 1.1 | GO:0000079 | regulation of cyclin-dependent protein serine/threonine kinase activity(GO:0000079) |
| 0.2 | 1.5 | GO:0042426 | choline catabolic process(GO:0042426) |
| 0.2 | 0.9 | GO:1904327 | protein localization to cytosolic proteasome complex(GO:1904327) protein localization to cytosolic proteasome complex involved in ERAD pathway(GO:1904379) |
| 0.2 | 3.4 | GO:2000480 | negative regulation of cAMP-dependent protein kinase activity(GO:2000480) |
| 0.2 | 0.8 | GO:0007525 | somatic muscle development(GO:0007525) |
| 0.2 | 1.2 | GO:0051902 | negative regulation of mitochondrial depolarization(GO:0051902) |
| 0.2 | 4.1 | GO:0035855 | megakaryocyte development(GO:0035855) |
| 0.2 | 0.8 | GO:0046502 | uroporphyrinogen III biosynthetic process(GO:0006780) uroporphyrinogen III metabolic process(GO:0046502) |
| 0.2 | 0.6 | GO:0060370 | susceptibility to T cell mediated cytotoxicity(GO:0060370) |
| 0.2 | 0.6 | GO:0001544 | initiation of primordial ovarian follicle growth(GO:0001544) |
| 0.2 | 3.3 | GO:0051412 | response to corticosterone(GO:0051412) |
| 0.2 | 2.3 | GO:0048245 | eosinophil chemotaxis(GO:0048245) |
| 0.2 | 1.4 | GO:0010756 | positive regulation of plasminogen activation(GO:0010756) |
| 0.2 | 0.4 | GO:1902523 | positive regulation of protein K63-linked ubiquitination(GO:1902523) |
| 0.2 | 4.0 | GO:0070262 | peptidyl-serine dephosphorylation(GO:0070262) |
| 0.2 | 0.6 | GO:0044537 | regulation of circulating fibrinogen levels(GO:0044537) |
| 0.2 | 5.1 | GO:0007158 | neuron cell-cell adhesion(GO:0007158) |
| 0.2 | 0.7 | GO:1990418 | response to insulin-like growth factor stimulus(GO:1990418) |
| 0.2 | 3.7 | GO:1901741 | positive regulation of myoblast fusion(GO:1901741) |
| 0.2 | 6.2 | GO:0045747 | positive regulation of Notch signaling pathway(GO:0045747) |
| 0.2 | 1.1 | GO:0035881 | amacrine cell differentiation(GO:0035881) |
| 0.2 | 0.5 | GO:0051088 | PMA-inducible membrane protein ectodomain proteolysis(GO:0051088) |
| 0.2 | 0.9 | GO:0042713 | sperm ejaculation(GO:0042713) |
| 0.2 | 1.4 | GO:0070444 | oligodendrocyte progenitor proliferation(GO:0070444) regulation of oligodendrocyte progenitor proliferation(GO:0070445) |
| 0.2 | 0.7 | GO:2001176 | mediator complex assembly(GO:0036034) regulation of mediator complex assembly(GO:2001176) positive regulation of mediator complex assembly(GO:2001178) |
| 0.2 | 1.4 | GO:1903690 | negative regulation of wound healing, spreading of epidermal cells(GO:1903690) |
| 0.2 | 0.7 | GO:0032058 | positive regulation of translational initiation in response to stress(GO:0032058) |
| 0.2 | 0.4 | GO:0042492 | gamma-delta T cell differentiation(GO:0042492) |
| 0.2 | 2.1 | GO:0002091 | negative regulation of receptor internalization(GO:0002091) |
| 0.2 | 0.7 | GO:1990167 | protein K27-linked deubiquitination(GO:1990167) |
| 0.2 | 3.1 | GO:0030277 | maintenance of gastrointestinal epithelium(GO:0030277) |
| 0.2 | 0.7 | GO:1903691 | positive regulation of wound healing, spreading of epidermal cells(GO:1903691) |
| 0.2 | 0.5 | GO:0051409 | response to nitrosative stress(GO:0051409) |
| 0.2 | 2.0 | GO:0000463 | maturation of LSU-rRNA from tricistronic rRNA transcript (SSU-rRNA, 5.8S rRNA, LSU-rRNA)(GO:0000463) |
| 0.2 | 0.7 | GO:0032571 | response to vitamin K(GO:0032571) |
| 0.2 | 0.7 | GO:0002913 | positive regulation of T cell anergy(GO:0002669) positive regulation of lymphocyte anergy(GO:0002913) |
| 0.2 | 1.6 | GO:0046078 | dUMP metabolic process(GO:0046078) |
| 0.2 | 3.5 | GO:0046339 | diacylglycerol metabolic process(GO:0046339) |
| 0.2 | 1.0 | GO:0061302 | smooth muscle cell-matrix adhesion(GO:0061302) |
| 0.2 | 0.5 | GO:1900042 | positive regulation of interleukin-2 secretion(GO:1900042) |
| 0.2 | 1.3 | GO:0042908 | xenobiotic transport(GO:0042908) |
| 0.2 | 0.2 | GO:0032878 | regulation of establishment or maintenance of cell polarity(GO:0032878) |
| 0.2 | 2.3 | GO:0097320 | membrane tubulation(GO:0097320) |
| 0.2 | 0.8 | GO:0010626 | regulation of Schwann cell proliferation(GO:0010624) negative regulation of Schwann cell proliferation(GO:0010626) |
| 0.2 | 2.5 | GO:0050862 | positive regulation of T cell receptor signaling pathway(GO:0050862) |
| 0.2 | 0.9 | GO:0018095 | protein polyglutamylation(GO:0018095) |
| 0.2 | 4.7 | GO:0008045 | motor neuron axon guidance(GO:0008045) |
| 0.2 | 0.2 | GO:0019276 | UDP-N-acetylgalactosamine metabolic process(GO:0019276) |
| 0.2 | 2.3 | GO:0010832 | negative regulation of myotube differentiation(GO:0010832) |
| 0.1 | 0.4 | GO:1904328 | regulation of myofibroblast contraction(GO:1904328) myofibroblast contraction(GO:1990764) |
| 0.1 | 20.4 | GO:0050806 | positive regulation of synaptic transmission(GO:0050806) |
| 0.1 | 1.1 | GO:1905097 | regulation of guanyl-nucleotide exchange factor activity(GO:1905097) |
| 0.1 | 0.4 | GO:0030195 | negative regulation of blood coagulation(GO:0030195) negative regulation of hemostasis(GO:1900047) |
| 0.1 | 1.3 | GO:0061179 | negative regulation of insulin secretion involved in cellular response to glucose stimulus(GO:0061179) |
| 0.1 | 1.4 | GO:0006578 | amino-acid betaine biosynthetic process(GO:0006578) carnitine biosynthetic process(GO:0045329) |
| 0.1 | 0.3 | GO:0002314 | germinal center B cell differentiation(GO:0002314) |
| 0.1 | 0.7 | GO:1903750 | regulation of intrinsic apoptotic signaling pathway in response to hydrogen peroxide(GO:1903750) negative regulation of intrinsic apoptotic signaling pathway in response to hydrogen peroxide(GO:1903751) |
| 0.1 | 1.4 | GO:0040033 | miRNA mediated inhibition of translation(GO:0035278) negative regulation of translation, ncRNA-mediated(GO:0040033) regulation of translation, ncRNA-mediated(GO:0045974) |
| 0.1 | 1.0 | GO:0061469 | regulation of type B pancreatic cell proliferation(GO:0061469) |
| 0.1 | 0.1 | GO:0035425 | autocrine signaling(GO:0035425) |
| 0.1 | 1.3 | GO:0051026 | chiasma assembly(GO:0051026) |
| 0.1 | 1.4 | GO:0071550 | death-inducing signaling complex assembly(GO:0071550) |
| 0.1 | 3.7 | GO:0098780 | response to mitochondrial depolarisation(GO:0098780) |
| 0.1 | 0.8 | GO:0034983 | peptidyl-lysine deacetylation(GO:0034983) |
| 0.1 | 0.8 | GO:1904251 | regulation of bile acid biosynthetic process(GO:0070857) regulation of bile acid metabolic process(GO:1904251) |
| 0.1 | 0.7 | GO:0090245 | axis elongation involved in somitogenesis(GO:0090245) |
| 0.1 | 1.4 | GO:0021794 | thalamus development(GO:0021794) |
| 0.1 | 1.2 | GO:0050709 | negative regulation of protein secretion(GO:0050709) |
| 0.1 | 3.7 | GO:0043968 | histone H2A acetylation(GO:0043968) |
| 0.1 | 0.8 | GO:0006196 | AMP catabolic process(GO:0006196) |
| 0.1 | 3.6 | GO:0042994 | cytoplasmic sequestering of transcription factor(GO:0042994) |
| 0.1 | 1.0 | GO:0045662 | negative regulation of myoblast differentiation(GO:0045662) |
| 0.1 | 0.9 | GO:0097411 | hypoxia-inducible factor-1alpha signaling pathway(GO:0097411) |
| 0.1 | 0.7 | GO:0045852 | pH elevation(GO:0045852) intracellular pH elevation(GO:0051454) |
| 0.1 | 0.7 | GO:0044211 | CTP salvage(GO:0044211) |
| 0.1 | 17.3 | GO:0007156 | homophilic cell adhesion via plasma membrane adhesion molecules(GO:0007156) |
| 0.1 | 2.5 | GO:0036152 | phosphatidylethanolamine acyl-chain remodeling(GO:0036152) |
| 0.1 | 0.5 | GO:0097368 | histone H4-K20 trimethylation(GO:0034773) establishment of Sertoli cell barrier(GO:0097368) |
| 0.1 | 3.6 | GO:0050869 | negative regulation of B cell activation(GO:0050869) |
| 0.1 | 1.4 | GO:0032703 | negative regulation of interleukin-2 production(GO:0032703) |
| 0.1 | 0.9 | GO:0035690 | cellular response to drug(GO:0035690) |
| 0.1 | 0.5 | GO:0050861 | positive regulation of B cell receptor signaling pathway(GO:0050861) |
| 0.1 | 1.4 | GO:0030321 | transepithelial chloride transport(GO:0030321) |
| 0.1 | 0.3 | GO:0021937 | cerebellar Purkinje cell-granule cell precursor cell signaling involved in regulation of granule cell precursor cell proliferation(GO:0021937) |
| 0.1 | 0.4 | GO:0070141 | creatinine metabolic process(GO:0046449) response to UV-A(GO:0070141) cellular response to UV-A(GO:0071492) |
| 0.1 | 1.6 | GO:0036010 | protein localization to endosome(GO:0036010) |
| 0.1 | 0.3 | GO:0035521 | monoubiquitinated histone deubiquitination(GO:0035521) monoubiquitinated histone H2A deubiquitination(GO:0035522) |
| 0.1 | 0.7 | GO:0043149 | contractile actin filament bundle assembly(GO:0030038) stress fiber assembly(GO:0043149) |
| 0.1 | 0.3 | GO:0051725 | protein de-ADP-ribosylation(GO:0051725) |
| 0.1 | 1.1 | GO:0036500 | ATF6-mediated unfolded protein response(GO:0036500) |
| 0.1 | 1.4 | GO:0008038 | neuron recognition(GO:0008038) |
| 0.1 | 0.3 | GO:0060332 | positive regulation of response to interferon-gamma(GO:0060332) positive regulation of interferon-gamma-mediated signaling pathway(GO:0060335) |
| 0.1 | 0.9 | GO:0007379 | segment specification(GO:0007379) |
| 0.1 | 0.4 | GO:1902774 | late endosome to lysosome transport(GO:1902774) |
| 0.1 | 1.4 | GO:0016540 | protein autoprocessing(GO:0016540) |
| 0.1 | 0.8 | GO:0098870 | neuronal action potential propagation(GO:0019227) action potential propagation(GO:0098870) |
| 0.1 | 0.3 | GO:0052055 | modulation by symbiont of host molecular function(GO:0052055) modulation of catalytic activity in other organism involved in symbiotic interaction(GO:0052203) modulation by host of symbiont catalytic activity(GO:0052422) |
| 0.1 | 0.5 | GO:0019255 | glucose 1-phosphate metabolic process(GO:0019255) |
| 0.1 | 0.1 | GO:1903487 | regulation of lactation(GO:1903487) |
| 0.1 | 0.6 | GO:0009597 | detection of virus(GO:0009597) |
| 0.1 | 0.5 | GO:0001554 | luteolysis(GO:0001554) |
| 0.1 | 0.9 | GO:0015014 | heparan sulfate proteoglycan biosynthetic process, polysaccharide chain biosynthetic process(GO:0015014) |
| 0.1 | 2.7 | GO:1903959 | regulation of anion transmembrane transport(GO:1903959) |
| 0.1 | 1.2 | GO:0060346 | bone trabecula formation(GO:0060346) |
| 0.1 | 1.2 | GO:0042769 | DNA damage response, detection of DNA damage(GO:0042769) |
| 0.1 | 0.2 | GO:0048631 | regulation of skeletal muscle tissue growth(GO:0048631) |
| 0.1 | 1.9 | GO:0034389 | lipid particle organization(GO:0034389) |
| 0.1 | 0.4 | GO:1901374 | acetate ester transport(GO:1901374) |
| 0.1 | 1.9 | GO:0042462 | eye photoreceptor cell differentiation(GO:0001754) eye photoreceptor cell development(GO:0042462) |
| 0.1 | 3.6 | GO:0003407 | neural retina development(GO:0003407) |
| 0.1 | 3.7 | GO:0010165 | response to X-ray(GO:0010165) |
| 0.1 | 0.8 | GO:0032074 | negative regulation of nuclease activity(GO:0032074) |
| 0.1 | 0.2 | GO:0071288 | cellular response to mercury ion(GO:0071288) |
| 0.1 | 1.7 | GO:0034204 | lipid translocation(GO:0034204) phospholipid translocation(GO:0045332) |
| 0.1 | 0.7 | GO:0031274 | positive regulation of pseudopodium assembly(GO:0031274) |
| 0.1 | 0.9 | GO:0007205 | protein kinase C-activating G-protein coupled receptor signaling pathway(GO:0007205) |
| 0.1 | 0.3 | GO:1902902 | negative regulation of autophagosome assembly(GO:1902902) |
| 0.1 | 2.4 | GO:0045022 | early endosome to late endosome transport(GO:0045022) |
| 0.1 | 1.4 | GO:1904886 | beta-catenin destruction complex disassembly(GO:1904886) |
| 0.1 | 0.2 | GO:2000253 | positive regulation of feeding behavior(GO:2000253) |
| 0.1 | 1.1 | GO:0071786 | endoplasmic reticulum tubular network organization(GO:0071786) |
| 0.1 | 0.5 | GO:0016559 | peroxisome fission(GO:0016559) |
| 0.1 | 0.3 | GO:1904016 | response to Thyroglobulin triiodothyronine(GO:1904016) |
| 0.1 | 0.7 | GO:0042118 | endothelial cell activation(GO:0042118) |
| 0.1 | 0.2 | GO:0043095 | regulation of GTP cyclohydrolase I activity(GO:0043095) negative regulation of GTP cyclohydrolase I activity(GO:0043105) |
| 0.1 | 0.8 | GO:1903608 | protein localization to cytoplasmic stress granule(GO:1903608) |
| 0.1 | 2.3 | GO:0014047 | glutamate secretion(GO:0014047) |
| 0.1 | 1.6 | GO:0061099 | negative regulation of protein tyrosine kinase activity(GO:0061099) |
| 0.1 | 3.1 | GO:0019228 | neuronal action potential(GO:0019228) |
| 0.1 | 0.8 | GO:0048820 | hair follicle maturation(GO:0048820) |
| 0.1 | 1.0 | GO:0035878 | nail development(GO:0035878) |
| 0.1 | 0.9 | GO:0046600 | negative regulation of centriole replication(GO:0046600) |
| 0.1 | 2.0 | GO:0035428 | hexose transmembrane transport(GO:0035428) glucose transmembrane transport(GO:1904659) |
| 0.1 | 0.3 | GO:0010966 | regulation of phosphate transport(GO:0010966) |
| 0.1 | 0.8 | GO:1903025 | regulation of RNA polymerase II regulatory region sequence-specific DNA binding(GO:1903025) |
| 0.1 | 1.0 | GO:0000083 | regulation of transcription involved in G1/S transition of mitotic cell cycle(GO:0000083) |
| 0.1 | 0.8 | GO:0060484 | lung-associated mesenchyme development(GO:0060484) |
| 0.1 | 0.5 | GO:0014809 | regulation of skeletal muscle contraction by regulation of release of sequestered calcium ion(GO:0014809) |
| 0.1 | 0.5 | GO:1901407 | regulation of phosphorylation of RNA polymerase II C-terminal domain(GO:1901407) |
| 0.1 | 0.4 | GO:0071907 | determination of pancreatic left/right asymmetry(GO:0035469) determination of digestive tract left/right asymmetry(GO:0071907) determination of liver left/right asymmetry(GO:0071910) |
| 0.1 | 0.5 | GO:0060315 | negative regulation of ryanodine-sensitive calcium-release channel activity(GO:0060315) |
| 0.1 | 0.5 | GO:0008343 | adult feeding behavior(GO:0008343) |
| 0.1 | 0.3 | GO:1902731 | ovarian cumulus expansion(GO:0001550) fused antrum stage(GO:0048165) negative regulation of chondrocyte proliferation(GO:1902731) |
| 0.1 | 1.7 | GO:0060334 | regulation of interferon-gamma-mediated signaling pathway(GO:0060334) |
| 0.1 | 1.1 | GO:0033141 | regulation of peptidyl-serine phosphorylation of STAT protein(GO:0033139) positive regulation of peptidyl-serine phosphorylation of STAT protein(GO:0033141) |
| 0.1 | 0.9 | GO:1903861 | positive regulation of dendrite extension(GO:1903861) |
| 0.1 | 0.4 | GO:0048015 | phosphatidylinositol-mediated signaling(GO:0048015) inositol lipid-mediated signaling(GO:0048017) |
| 0.1 | 0.2 | GO:1901993 | meiotic cell cycle phase transition(GO:0044771) establishment of meiotic spindle localization(GO:0051295) regulation of meiotic cell cycle phase transition(GO:1901993) negative regulation of meiotic cell cycle phase transition(GO:1901994) |
| 0.1 | 1.8 | GO:1904380 | endoplasmic reticulum mannose trimming(GO:1904380) |
| 0.1 | 0.4 | GO:0019262 | N-acetylneuraminate catabolic process(GO:0019262) |
| 0.1 | 1.9 | GO:0007040 | lysosome organization(GO:0007040) lytic vacuole organization(GO:0080171) |
| 0.1 | 0.5 | GO:0031284 | positive regulation of guanylate cyclase activity(GO:0031284) |
| 0.1 | 0.3 | GO:2000345 | regulation of hepatocyte proliferation(GO:2000345) |
| 0.1 | 2.6 | GO:0070206 | protein trimerization(GO:0070206) |
| 0.1 | 0.2 | GO:0006556 | S-adenosylmethionine biosynthetic process(GO:0006556) |
| 0.1 | 0.5 | GO:0015812 | gamma-aminobutyric acid transport(GO:0015812) |
| 0.1 | 1.0 | GO:0007095 | mitotic G2 DNA damage checkpoint(GO:0007095) |
| 0.1 | 0.6 | GO:0071847 | TNFSF11-mediated signaling pathway(GO:0071847) |
| 0.1 | 0.3 | GO:0061737 | leukotriene signaling pathway(GO:0061737) |
| 0.1 | 0.3 | GO:0046952 | ketone body catabolic process(GO:0046952) |
| 0.1 | 0.6 | GO:0007200 | phospholipase C-activating G-protein coupled receptor signaling pathway(GO:0007200) |
| 0.1 | 0.7 | GO:0001867 | complement activation, lectin pathway(GO:0001867) |
| 0.1 | 0.4 | GO:0032790 | ribosome disassembly(GO:0032790) |
| 0.1 | 0.4 | GO:0006777 | Mo-molybdopterin cofactor biosynthetic process(GO:0006777) Mo-molybdopterin cofactor metabolic process(GO:0019720) |
| 0.1 | 2.8 | GO:0051865 | protein autoubiquitination(GO:0051865) |
| 0.1 | 0.7 | GO:0033561 | regulation of water loss via skin(GO:0033561) establishment of skin barrier(GO:0061436) |
| 0.1 | 3.2 | GO:0019933 | cAMP-mediated signaling(GO:0019933) |
| 0.1 | 1.5 | GO:0050690 | regulation of defense response to virus by virus(GO:0050690) |
| 0.1 | 0.5 | GO:1990845 | adaptive thermogenesis(GO:1990845) |
| 0.1 | 1.2 | GO:0090314 | positive regulation of protein targeting to membrane(GO:0090314) |
| 0.1 | 0.2 | GO:0010025 | wax biosynthetic process(GO:0010025) wax metabolic process(GO:0010166) |
| 0.1 | 1.5 | GO:0022400 | regulation of rhodopsin mediated signaling pathway(GO:0022400) |
| 0.1 | 0.2 | GO:0007181 | transforming growth factor beta receptor complex assembly(GO:0007181) |
| 0.1 | 1.0 | GO:0050982 | detection of mechanical stimulus(GO:0050982) |
| 0.1 | 0.3 | GO:1990253 | cellular response to leucine starvation(GO:1990253) |
| 0.0 | 0.4 | GO:1903392 | negative regulation of focal adhesion assembly(GO:0051895) negative regulation of adherens junction organization(GO:1903392) |
| 0.0 | 0.5 | GO:0001696 | gastric acid secretion(GO:0001696) |
| 0.0 | 0.5 | GO:0035589 | G-protein coupled purinergic nucleotide receptor signaling pathway(GO:0035589) |
| 0.0 | 11.6 | GO:0006367 | transcription initiation from RNA polymerase II promoter(GO:0006367) |
| 0.0 | 1.1 | GO:0035338 | long-chain fatty-acyl-CoA biosynthetic process(GO:0035338) |
| 0.0 | 0.2 | GO:0060372 | regulation of atrial cardiac muscle cell membrane repolarization(GO:0060372) |
| 0.0 | 0.2 | GO:0006069 | ethanol oxidation(GO:0006069) |
| 0.0 | 0.1 | GO:0043031 | negative regulation of macrophage activation(GO:0043031) |
| 0.0 | 1.0 | GO:0019373 | epoxygenase P450 pathway(GO:0019373) |
| 0.0 | 0.4 | GO:0016576 | histone dephosphorylation(GO:0016576) |
| 0.0 | 1.5 | GO:0032259 | methylation(GO:0032259) |
| 0.0 | 0.5 | GO:0014029 | neural crest formation(GO:0014029) |
| 0.0 | 0.0 | GO:0050955 | thermoception(GO:0050955) |
| 0.0 | 0.3 | GO:0005513 | detection of calcium ion(GO:0005513) |
| 0.0 | 2.7 | GO:0006826 | iron ion transport(GO:0006826) |
| 0.0 | 0.1 | GO:0036071 | N-glycan fucosylation(GO:0036071) |
| 0.0 | 1.0 | GO:0001701 | in utero embryonic development(GO:0001701) |
| 0.0 | 1.9 | GO:0050911 | detection of chemical stimulus involved in sensory perception of smell(GO:0050911) |
| 0.0 | 0.1 | GO:0093001 | glycolysis from storage polysaccharide through glucose-1-phosphate(GO:0093001) |
| 0.0 | 1.6 | GO:0010107 | potassium ion import(GO:0010107) |
| 0.0 | 0.5 | GO:0035728 | response to hepatocyte growth factor(GO:0035728) |
| 0.0 | 2.9 | GO:1903779 | regulation of cardiac conduction(GO:1903779) |
| 0.0 | 1.8 | GO:0021510 | spinal cord development(GO:0021510) |
| 0.0 | 0.2 | GO:0090037 | positive regulation of protein kinase C signaling(GO:0090037) |
| 0.0 | 0.2 | GO:0046784 | viral mRNA export from host cell nucleus(GO:0046784) |
| 0.0 | 0.6 | GO:0070301 | cellular response to hydrogen peroxide(GO:0070301) |
| 0.0 | 0.7 | GO:0016338 | calcium-independent cell-cell adhesion via plasma membrane cell-adhesion molecules(GO:0016338) |
| 0.0 | 0.9 | GO:0060964 | regulation of gene silencing by miRNA(GO:0060964) |
| 0.0 | 0.8 | GO:0061512 | protein localization to cilium(GO:0061512) |
| 0.0 | 0.7 | GO:0030155 | regulation of cell adhesion(GO:0030155) |
| 0.0 | 0.9 | GO:0034080 | CENP-A containing nucleosome assembly(GO:0034080) CENP-A containing chromatin organization(GO:0061641) |
| 0.0 | 1.1 | GO:1901998 | toxin transport(GO:1901998) |
| 0.0 | 0.5 | GO:0035303 | regulation of dephosphorylation(GO:0035303) |
| 0.0 | 0.1 | GO:0033386 | geranylgeranyl diphosphate metabolic process(GO:0033385) geranylgeranyl diphosphate biosynthetic process(GO:0033386) |
| 0.0 | 0.1 | GO:0034196 | acylglycerol transport(GO:0034196) triglyceride transport(GO:0034197) |
| 0.0 | 0.4 | GO:0072643 | interferon-gamma secretion(GO:0072643) |
| 0.0 | 0.3 | GO:0016048 | detection of temperature stimulus(GO:0016048) |
| 0.0 | 0.3 | GO:0032607 | interferon-alpha production(GO:0032607) |
| 0.0 | 0.5 | GO:0006590 | thyroid hormone generation(GO:0006590) |
| 0.0 | 0.7 | GO:0050913 | sensory perception of bitter taste(GO:0050913) |
| 0.0 | 0.1 | GO:1901991 | negative regulation of cell cycle phase transition(GO:1901988) negative regulation of mitotic cell cycle phase transition(GO:1901991) |
| 0.0 | 0.9 | GO:0000413 | protein peptidyl-prolyl isomerization(GO:0000413) |
| 0.0 | 0.3 | GO:0060856 | establishment of blood-brain barrier(GO:0060856) |
| 0.0 | 0.9 | GO:0010501 | RNA secondary structure unwinding(GO:0010501) |
| 0.0 | 0.1 | GO:1901524 | regulation of macromitophagy(GO:1901524) negative regulation of macromitophagy(GO:1901525) |
| 0.0 | 0.0 | GO:0070172 | positive regulation of tooth mineralization(GO:0070172) |
| 0.0 | 1.2 | GO:0090502 | RNA phosphodiester bond hydrolysis, endonucleolytic(GO:0090502) |
| 0.0 | 0.2 | GO:2000353 | positive regulation of endothelial cell apoptotic process(GO:2000353) |
| 0.0 | 2.2 | GO:0034605 | cellular response to heat(GO:0034605) |
| 0.0 | 0.0 | GO:0031999 | negative regulation of fatty acid beta-oxidation(GO:0031999) |
| 0.0 | 0.1 | GO:2000427 | positive regulation of apoptotic cell clearance(GO:2000427) |
| 0.0 | 0.1 | GO:0048755 | branching morphogenesis of a nerve(GO:0048755) |
| 0.0 | 1.5 | GO:0090630 | activation of GTPase activity(GO:0090630) |
| 0.0 | 0.3 | GO:0033169 | histone H3-K9 demethylation(GO:0033169) |
| 0.0 | 0.5 | GO:0061024 | membrane organization(GO:0061024) |
| 0.0 | 1.2 | GO:0008366 | ensheathment of neurons(GO:0007272) axon ensheathment(GO:0008366) |
| 0.0 | 0.2 | GO:0048745 | smooth muscle tissue development(GO:0048745) |
| 0.0 | 0.6 | GO:0007173 | epidermal growth factor receptor signaling pathway(GO:0007173) |
| 0.0 | 0.2 | GO:0014059 | dopamine secretion(GO:0014046) regulation of dopamine secretion(GO:0014059) |
| 0.0 | 0.5 | GO:0006656 | phosphatidylcholine biosynthetic process(GO:0006656) |
| 0.0 | 0.1 | GO:0070314 | G1 to G0 transition(GO:0070314) G1 to G0 transition involved in cell differentiation(GO:0070315) negative regulation of skeletal muscle cell differentiation(GO:2001015) |
| 0.0 | 0.4 | GO:0061178 | regulation of insulin secretion involved in cellular response to glucose stimulus(GO:0061178) |
| 0.0 | 0.5 | GO:0007585 | respiratory gaseous exchange(GO:0007585) |
| 0.0 | 0.9 | GO:0006911 | phagocytosis, engulfment(GO:0006911) |
| 0.0 | 0.5 | GO:0033173 | calcineurin-NFAT signaling cascade(GO:0033173) |
| 0.0 | 0.6 | GO:0001578 | microtubule bundle formation(GO:0001578) |
| 0.0 | 0.3 | GO:0032414 | positive regulation of ion transmembrane transporter activity(GO:0032414) |
| 0.0 | 0.8 | GO:0030183 | B cell differentiation(GO:0030183) |
| 0.0 | 0.1 | GO:0017121 | phospholipid scrambling(GO:0017121) |
Gene overrepresentation in cellular_component category:
| Log-likelihood per target | Total log-likelihood | Term | Description |
|---|---|---|---|
| 3.8 | 18.9 | GO:0098843 | postsynaptic endocytic zone(GO:0098843) |
| 3.5 | 24.2 | GO:1990452 | Parkin-FBXW7-Cul1 ubiquitin ligase complex(GO:1990452) |
| 2.4 | 38.4 | GO:0097512 | cardiac myofibril(GO:0097512) |
| 2.0 | 10.0 | GO:0060201 | clathrin-sculpted acetylcholine transport vesicle(GO:0060200) clathrin-sculpted acetylcholine transport vesicle membrane(GO:0060201) |
| 1.4 | 12.6 | GO:0005955 | calcineurin complex(GO:0005955) |
| 1.3 | 3.9 | GO:0072534 | perineuronal net(GO:0072534) |
| 1.3 | 15.5 | GO:0032045 | guanyl-nucleotide exchange factor complex(GO:0032045) |
| 1.3 | 16.3 | GO:0034992 | microtubule organizing center attachment site(GO:0034992) LINC complex(GO:0034993) |
| 1.1 | 7.8 | GO:0032584 | growth cone membrane(GO:0032584) |
| 0.9 | 3.7 | GO:0032777 | Piccolo NuA4 histone acetyltransferase complex(GO:0032777) |
| 0.9 | 18.5 | GO:0001891 | phagocytic cup(GO:0001891) |
| 0.9 | 3.5 | GO:1990075 | periciliary membrane compartment(GO:1990075) |
| 0.9 | 2.6 | GO:0035354 | Toll-like receptor 1-Toll-like receptor 2 protein complex(GO:0035354) |
| 0.8 | 2.5 | GO:0036195 | muscle cell projection(GO:0036194) muscle cell projection membrane(GO:0036195) |
| 0.8 | 3.2 | GO:1990316 | ATG1/ULK1 kinase complex(GO:1990316) |
| 0.7 | 12.7 | GO:0033270 | paranode region of axon(GO:0033270) |
| 0.7 | 3.4 | GO:0001652 | granular component(GO:0001652) |
| 0.6 | 19.6 | GO:0031092 | platelet alpha granule membrane(GO:0031092) |
| 0.6 | 2.3 | GO:0043293 | apoptosome(GO:0043293) |
| 0.6 | 15.6 | GO:0071437 | invadopodium(GO:0071437) |
| 0.5 | 8.5 | GO:0097386 | glial cell projection(GO:0097386) |
| 0.5 | 2.0 | GO:0070695 | FHF complex(GO:0070695) |
| 0.4 | 1.3 | GO:0036398 | TCR signalosome(GO:0036398) |
| 0.4 | 17.8 | GO:0032590 | dendrite membrane(GO:0032590) |
| 0.4 | 2.0 | GO:0097179 | protease inhibitor complex(GO:0097179) |
| 0.3 | 9.1 | GO:0032982 | myosin filament(GO:0032982) |
| 0.3 | 1.7 | GO:0002193 | MAML1-RBP-Jkappa- ICN1 complex(GO:0002193) |
| 0.3 | 1.0 | GO:0031251 | PAN complex(GO:0031251) |
| 0.3 | 2.7 | GO:0045179 | apical cortex(GO:0045179) |
| 0.3 | 1.0 | GO:0071062 | alphav-beta3 integrin-vitronectin complex(GO:0071062) |
| 0.3 | 10.1 | GO:0000159 | protein phosphatase type 2A complex(GO:0000159) |
| 0.3 | 1.4 | GO:0016012 | sarcoglycan complex(GO:0016012) |
| 0.3 | 1.1 | GO:0038038 | G-protein coupled receptor homodimeric complex(GO:0038038) |
| 0.3 | 1.1 | GO:0034673 | inhibin-betaglycan-ActRII complex(GO:0034673) |
| 0.3 | 3.5 | GO:0005833 | hemoglobin complex(GO:0005833) |
| 0.2 | 1.6 | GO:0044326 | dendritic spine neck(GO:0044326) |
| 0.2 | 9.9 | GO:1904115 | axon cytoplasm(GO:1904115) |
| 0.2 | 24.2 | GO:0016234 | inclusion body(GO:0016234) |
| 0.2 | 4.3 | GO:0044295 | axonal growth cone(GO:0044295) |
| 0.2 | 1.7 | GO:0030134 | ER to Golgi transport vesicle(GO:0030134) |
| 0.2 | 2.0 | GO:0031464 | Cul4A-RING E3 ubiquitin ligase complex(GO:0031464) |
| 0.2 | 2.6 | GO:0000788 | nuclear nucleosome(GO:0000788) |
| 0.2 | 2.3 | GO:0031209 | SCAR complex(GO:0031209) |
| 0.2 | 2.6 | GO:0031045 | dense core granule(GO:0031045) |
| 0.2 | 0.8 | GO:0036128 | CatSper complex(GO:0036128) |
| 0.2 | 4.0 | GO:0031264 | death-inducing signaling complex(GO:0031264) |
| 0.2 | 1.3 | GO:1990111 | spermatoproteasome complex(GO:1990111) |
| 0.2 | 1.3 | GO:0000322 | storage vacuole(GO:0000322) |
| 0.2 | 10.1 | GO:0015030 | Cajal body(GO:0015030) |
| 0.2 | 2.0 | GO:0043679 | axon terminus(GO:0043679) |
| 0.2 | 0.8 | GO:0097165 | nuclear stress granule(GO:0097165) |
| 0.1 | 0.4 | GO:0019008 | molybdopterin synthase complex(GO:0019008) |
| 0.1 | 5.7 | GO:0005762 | organellar large ribosomal subunit(GO:0000315) mitochondrial large ribosomal subunit(GO:0005762) |
| 0.1 | 1.4 | GO:0045180 | basal cortex(GO:0045180) |
| 0.1 | 2.0 | GO:0097440 | apical dendrite(GO:0097440) |
| 0.1 | 0.3 | GO:0098576 | lumenal side of membrane(GO:0098576) |
| 0.1 | 17.2 | GO:0043204 | perikaryon(GO:0043204) |
| 0.1 | 2.9 | GO:0000242 | pericentriolar material(GO:0000242) |
| 0.1 | 1.7 | GO:0016600 | flotillin complex(GO:0016600) |
| 0.1 | 1.0 | GO:0036157 | outer dynein arm(GO:0036157) |
| 0.1 | 0.5 | GO:0097442 | CA3 pyramidal cell dendrite(GO:0097442) |
| 0.1 | 0.7 | GO:0034464 | BBSome(GO:0034464) |
| 0.1 | 6.6 | GO:0045171 | intercellular bridge(GO:0045171) |
| 0.1 | 0.5 | GO:0000801 | central element(GO:0000801) |
| 0.1 | 17.3 | GO:0043197 | dendritic spine(GO:0043197) |
| 0.1 | 2.0 | GO:0010369 | chromocenter(GO:0010369) |
| 0.1 | 1.3 | GO:0097433 | dense body(GO:0097433) |
| 0.1 | 1.9 | GO:0031528 | microvillus membrane(GO:0031528) |
| 0.1 | 1.1 | GO:0071782 | endoplasmic reticulum tubular network(GO:0071782) |
| 0.1 | 4.6 | GO:0031463 | Cul3-RING ubiquitin ligase complex(GO:0031463) |
| 0.1 | 1.5 | GO:0042622 | photoreceptor outer segment membrane(GO:0042622) |
| 0.1 | 1.1 | GO:0072559 | NLRP3 inflammasome complex(GO:0072559) |
| 0.1 | 4.5 | GO:0048786 | presynaptic active zone(GO:0048786) |
| 0.1 | 0.5 | GO:0031466 | Cul5-RING ubiquitin ligase complex(GO:0031466) |
| 0.1 | 0.6 | GO:0002177 | manchette(GO:0002177) |
| 0.1 | 0.6 | GO:0042406 | extrinsic component of endoplasmic reticulum membrane(GO:0042406) |
| 0.1 | 0.7 | GO:0005672 | transcription factor TFIIA complex(GO:0005672) |
| 0.1 | 8.7 | GO:0035578 | azurophil granule lumen(GO:0035578) |
| 0.1 | 1.1 | GO:1990454 | L-type voltage-gated calcium channel complex(GO:1990454) |
| 0.1 | 1.2 | GO:0070578 | RISC-loading complex(GO:0070578) |
| 0.1 | 7.7 | GO:0032580 | Golgi cisterna membrane(GO:0032580) |
| 0.1 | 2.5 | GO:0055038 | recycling endosome membrane(GO:0055038) |
| 0.1 | 1.0 | GO:0005657 | replication fork(GO:0005657) |
| 0.1 | 6.2 | GO:1904724 | tertiary granule lumen(GO:1904724) |
| 0.1 | 0.5 | GO:0097197 | tetraspanin-enriched microdomain(GO:0097197) |
| 0.1 | 3.5 | GO:0098636 | protein complex involved in cell adhesion(GO:0098636) |
| 0.1 | 0.2 | GO:0048269 | methionine adenosyltransferase complex(GO:0048269) |
| 0.1 | 1.2 | GO:0032300 | mismatch repair complex(GO:0032300) |
| 0.1 | 8.8 | GO:0030426 | growth cone(GO:0030426) |
| 0.1 | 0.4 | GO:0030123 | AP-3 adaptor complex(GO:0030123) |
| 0.1 | 0.5 | GO:0002199 | zona pellucida receptor complex(GO:0002199) |
| 0.1 | 0.7 | GO:0071682 | endocytic vesicle lumen(GO:0071682) |
| 0.1 | 2.8 | GO:0030119 | AP-type membrane coat adaptor complex(GO:0030119) |
| 0.1 | 0.5 | GO:0032437 | cuticular plate(GO:0032437) |
| 0.1 | 0.6 | GO:0016013 | syntrophin complex(GO:0016013) |
| 0.1 | 1.6 | GO:0071564 | npBAF complex(GO:0071564) |
| 0.1 | 0.4 | GO:0098559 | cytoplasmic side of early endosome membrane(GO:0098559) |
| 0.1 | 2.8 | GO:0001772 | immunological synapse(GO:0001772) |
| 0.1 | 2.7 | GO:0000776 | kinetochore(GO:0000776) |
| 0.1 | 1.0 | GO:0030669 | clathrin-coated endocytic vesicle membrane(GO:0030669) |
| 0.1 | 1.8 | GO:0044322 | endoplasmic reticulum quality control compartment(GO:0044322) |
| 0.1 | 0.8 | GO:0001518 | voltage-gated sodium channel complex(GO:0001518) |
| 0.1 | 0.5 | GO:0097486 | multivesicular body lumen(GO:0097486) |
| 0.1 | 0.4 | GO:0097136 | Bcl-2 family protein complex(GO:0097136) |
| 0.1 | 0.6 | GO:0090544 | BAF-type complex(GO:0090544) |
| 0.1 | 10.4 | GO:0043025 | neuronal cell body(GO:0043025) |
| 0.0 | 1.5 | GO:0030173 | integral component of Golgi membrane(GO:0030173) |
| 0.0 | 0.7 | GO:0005662 | DNA replication factor A complex(GO:0005662) |
| 0.0 | 0.7 | GO:0016327 | apicolateral plasma membrane(GO:0016327) |
| 0.0 | 0.9 | GO:0033202 | Ino80 complex(GO:0031011) DNA helicase complex(GO:0033202) |
| 0.0 | 1.4 | GO:0005719 | nuclear euchromatin(GO:0005719) |
| 0.0 | 3.6 | GO:0033116 | endoplasmic reticulum-Golgi intermediate compartment membrane(GO:0033116) |
| 0.0 | 0.3 | GO:0036056 | filtration diaphragm(GO:0036056) slit diaphragm(GO:0036057) |
| 0.0 | 1.4 | GO:1902711 | GABA-A receptor complex(GO:1902711) |
| 0.0 | 0.5 | GO:0005697 | telomerase holoenzyme complex(GO:0005697) |
| 0.0 | 2.0 | GO:0034707 | chloride channel complex(GO:0034707) |
| 0.0 | 0.3 | GO:1990131 | EGO complex(GO:0034448) Gtr1-Gtr2 GTPase complex(GO:1990131) |
| 0.0 | 0.4 | GO:0000506 | glycosylphosphatidylinositol-N-acetylglucosaminyltransferase (GPI-GnT) complex(GO:0000506) |
| 0.0 | 29.1 | GO:0045202 | synapse(GO:0045202) |
| 0.0 | 7.1 | GO:0032993 | protein-DNA complex(GO:0032993) |
| 0.0 | 8.2 | GO:0005802 | trans-Golgi network(GO:0005802) |
| 0.0 | 1.6 | GO:0033017 | sarcoplasmic reticulum membrane(GO:0033017) |
| 0.0 | 0.7 | GO:0042101 | T cell receptor complex(GO:0042101) |
| 0.0 | 0.2 | GO:0000347 | THO complex(GO:0000347) THO complex part of transcription export complex(GO:0000445) |
| 0.0 | 0.4 | GO:0000243 | commitment complex(GO:0000243) |
| 0.0 | 0.8 | GO:0001669 | acrosomal vesicle(GO:0001669) |
| 0.0 | 0.1 | GO:0033596 | TSC1-TSC2 complex(GO:0033596) |
| 0.0 | 0.3 | GO:0008385 | IkappaB kinase complex(GO:0008385) |
| 0.0 | 1.6 | GO:0055037 | recycling endosome(GO:0055037) |
| 0.0 | 2.0 | GO:0070821 | tertiary granule membrane(GO:0070821) |
| 0.0 | 4.0 | GO:0005741 | mitochondrial outer membrane(GO:0005741) |
| 0.0 | 4.1 | GO:0005769 | early endosome(GO:0005769) |
| 0.0 | 0.4 | GO:0005859 | muscle myosin complex(GO:0005859) |
| 0.0 | 0.3 | GO:0031235 | intrinsic component of the cytoplasmic side of the plasma membrane(GO:0031235) |
| 0.0 | 1.4 | GO:0030424 | axon(GO:0030424) |
| 0.0 | 0.1 | GO:0005945 | 6-phosphofructokinase complex(GO:0005945) |
| 0.0 | 0.9 | GO:0042641 | actomyosin(GO:0042641) |
| 0.0 | 0.3 | GO:0031526 | brush border membrane(GO:0031526) |
| 0.0 | 1.4 | GO:0005929 | cilium(GO:0005929) |
| 0.0 | 29.2 | GO:0005887 | integral component of plasma membrane(GO:0005887) |
| 0.0 | 14.3 | GO:0005789 | endoplasmic reticulum membrane(GO:0005789) |
| 0.0 | 1.2 | GO:0000784 | nuclear chromosome, telomeric region(GO:0000784) |
| 0.0 | 0.7 | GO:0005844 | polysome(GO:0005844) |
| 0.0 | 0.4 | GO:0005801 | cis-Golgi network(GO:0005801) |
| 0.0 | 2.4 | GO:0043005 | neuron projection(GO:0043005) |
| 0.0 | 27.4 | GO:0016021 | integral component of membrane(GO:0016021) |
| 0.0 | 1.3 | GO:0030659 | cytoplasmic vesicle membrane(GO:0030659) |
| 0.0 | 0.1 | GO:0030315 | T-tubule(GO:0030315) |
| 0.0 | 0.2 | GO:0032391 | photoreceptor connecting cilium(GO:0032391) |
Gene overrepresentation in molecular_function category:
| Log-likelihood per target | Total log-likelihood | Term | Description |
|---|---|---|---|
| 3.9 | 19.6 | GO:0047820 | D-glutamate cyclase activity(GO:0047820) |
| 3.6 | 10.9 | GO:0008859 | exoribonuclease II activity(GO:0008859) |
| 3.4 | 10.3 | GO:0036134 | thromboxane-A synthase activity(GO:0004796) 12-hydroxyheptadecatrienoic acid synthase activity(GO:0036134) |
| 3.0 | 24.2 | GO:0050816 | phosphothreonine binding(GO:0050816) |
| 2.4 | 7.3 | GO:0008330 | protein tyrosine/threonine phosphatase activity(GO:0008330) |
| 2.4 | 9.6 | GO:0004356 | glutamate-ammonia ligase activity(GO:0004356) ammonia ligase activity(GO:0016211) acid-ammonia (or amide) ligase activity(GO:0016880) |
| 2.3 | 9.1 | GO:0015254 | glycerol channel activity(GO:0015254) urea channel activity(GO:0015265) |
| 2.1 | 10.5 | GO:0001641 | group II metabotropic glutamate receptor activity(GO:0001641) |
| 2.1 | 12.6 | GO:0070892 | lipoteichoic acid receptor activity(GO:0070892) |
| 2.0 | 10.0 | GO:0030348 | syntaxin-3 binding(GO:0030348) |
| 2.0 | 7.8 | GO:0034988 | Fc-gamma receptor I complex binding(GO:0034988) |
| 1.9 | 24.5 | GO:0001087 | transcription factor activity, sequence-specific DNA binding, RNA polymerase recruiting(GO:0001011) transcription factor activity, TFIIB-class binding(GO:0001087) |
| 1.8 | 5.4 | GO:0031859 | platelet activating factor receptor binding(GO:0031859) |
| 1.8 | 5.3 | GO:0004676 | 3-phosphoinositide-dependent protein kinase activity(GO:0004676) |
| 1.7 | 24.4 | GO:1903136 | cuprous ion binding(GO:1903136) |
| 1.6 | 18.9 | GO:0004971 | AMPA glutamate receptor activity(GO:0004971) |
| 1.5 | 7.7 | GO:0017159 | pantetheine hydrolase activity(GO:0017159) |
| 1.5 | 6.1 | GO:0047391 | alkylglycerophosphoethanolamine phosphodiesterase activity(GO:0047391) |
| 1.4 | 14.0 | GO:0033192 | calmodulin-dependent protein phosphatase activity(GO:0033192) |
| 1.3 | 4.0 | GO:0004913 | interleukin-4 receptor activity(GO:0004913) interleukin-7 receptor activity(GO:0004917) |
| 1.3 | 5.3 | GO:0005477 | pyruvate secondary active transmembrane transporter activity(GO:0005477) |
| 1.3 | 7.7 | GO:0016909 | JUN kinase activity(GO:0004705) SAP kinase activity(GO:0016909) |
| 1.2 | 38.3 | GO:0005212 | structural constituent of eye lens(GO:0005212) |
| 1.2 | 10.8 | GO:0032051 | clathrin light chain binding(GO:0032051) |
| 1.2 | 8.3 | GO:0047894 | flavonol 3-sulfotransferase activity(GO:0047894) steroid sulfotransferase activity(GO:0050294) |
| 1.0 | 11.9 | GO:0019911 | structural constituent of myelin sheath(GO:0019911) |
| 0.9 | 2.7 | GO:0030350 | iron-responsive element binding(GO:0030350) |
| 0.9 | 2.6 | GO:0035663 | Toll-like receptor 2 binding(GO:0035663) |
| 0.8 | 2.4 | GO:0004949 | cannabinoid receptor activity(GO:0004949) |
| 0.8 | 10.3 | GO:0047372 | acylglycerol lipase activity(GO:0047372) |
| 0.8 | 2.3 | GO:0016262 | protein N-acetylglucosaminyltransferase activity(GO:0016262) |
| 0.7 | 4.3 | GO:0004447 | iodide peroxidase activity(GO:0004447) |
| 0.7 | 0.7 | GO:0001034 | RNA polymerase III transcription factor activity, sequence-specific DNA binding(GO:0001034) |
| 0.7 | 15.1 | GO:0035198 | miRNA binding(GO:0035198) |
| 0.7 | 17.9 | GO:0005521 | lamin binding(GO:0005521) |
| 0.6 | 2.6 | GO:1901375 | acetylcholine transmembrane transporter activity(GO:0005277) secondary active organic cation transmembrane transporter activity(GO:0008513) acetate ester transmembrane transporter activity(GO:1901375) |
| 0.6 | 9.0 | GO:0031432 | titin binding(GO:0031432) |
| 0.6 | 1.9 | GO:0016434 | rRNA (cytosine) methyltransferase activity(GO:0016434) |
| 0.6 | 8.8 | GO:0030957 | Tat protein binding(GO:0030957) |
| 0.6 | 3.0 | GO:0004906 | interferon-gamma receptor activity(GO:0004906) |
| 0.6 | 7.6 | GO:0008503 | benzodiazepine receptor activity(GO:0008503) |
| 0.6 | 2.8 | GO:0004468 | lysine N-acetyltransferase activity, acting on acetyl phosphate as donor(GO:0004468) |
| 0.5 | 1.6 | GO:0047275 | glucosaminylgalactosylglucosylceramide beta-galactosyltransferase activity(GO:0047275) |
| 0.5 | 3.6 | GO:0015501 | glutamate:sodium symporter activity(GO:0015501) |
| 0.5 | 1.6 | GO:0102008 | cytosolic dipeptidase activity(GO:0102008) |
| 0.5 | 12.2 | GO:0005248 | voltage-gated sodium channel activity(GO:0005248) voltage-gated ion channel activity involved in regulation of postsynaptic membrane potential(GO:1905030) |
| 0.5 | 5.5 | GO:0015174 | basic amino acid transmembrane transporter activity(GO:0015174) |
| 0.5 | 2.9 | GO:0008440 | inositol-1,4,5-trisphosphate 3-kinase activity(GO:0008440) |
| 0.5 | 1.8 | GO:1904493 | Ac-Asp-Glu binding(GO:1904492) tetrahydrofolyl-poly(glutamate) polymer binding(GO:1904493) |
| 0.4 | 3.0 | GO:0015277 | kainate selective glutamate receptor activity(GO:0015277) |
| 0.4 | 4.3 | GO:0005094 | Rho GDP-dissociation inhibitor activity(GO:0005094) |
| 0.4 | 1.3 | GO:0032427 | GBD domain binding(GO:0032427) |
| 0.4 | 1.7 | GO:0042030 | ATPase inhibitor activity(GO:0042030) |
| 0.4 | 3.1 | GO:0030023 | extracellular matrix constituent conferring elasticity(GO:0030023) |
| 0.4 | 1.6 | GO:0016841 | ammonia-lyase activity(GO:0016841) |
| 0.4 | 1.9 | GO:0001010 | transcription factor activity, sequence-specific DNA binding transcription factor recruiting(GO:0001010) |
| 0.4 | 1.5 | GO:0015220 | choline transmembrane transporter activity(GO:0015220) |
| 0.4 | 1.9 | GO:1904315 | neurotransmitter receptor activity involved in regulation of postsynaptic membrane potential(GO:0099529) transmitter-gated ion channel activity involved in regulation of postsynaptic membrane potential(GO:1904315) |
| 0.4 | 2.3 | GO:0004677 | DNA-dependent protein kinase activity(GO:0004677) |
| 0.4 | 3.3 | GO:0001225 | RNA polymerase II transcription coactivator binding(GO:0001225) |
| 0.4 | 2.9 | GO:0016778 | diphosphotransferase activity(GO:0016778) |
| 0.4 | 1.4 | GO:0008336 | gamma-butyrobetaine dioxygenase activity(GO:0008336) |
| 0.3 | 3.4 | GO:0036312 | phosphatidylinositol 3-kinase regulatory subunit binding(GO:0036312) |
| 0.3 | 0.7 | GO:0034046 | poly(G) binding(GO:0034046) |
| 0.3 | 5.8 | GO:0004143 | diacylglycerol kinase activity(GO:0004143) |
| 0.3 | 4.7 | GO:0005068 | transmembrane receptor protein tyrosine kinase adaptor activity(GO:0005068) |
| 0.3 | 3.4 | GO:0004571 | mannosyl-oligosaccharide 1,2-alpha-mannosidase activity(GO:0004571) |
| 0.3 | 1.2 | GO:0004657 | proline dehydrogenase activity(GO:0004657) |
| 0.3 | 1.8 | GO:0042610 | CD8 receptor binding(GO:0042610) |
| 0.3 | 14.9 | GO:0019894 | kinesin binding(GO:0019894) |
| 0.3 | 2.0 | GO:0001515 | opioid peptide activity(GO:0001515) |
| 0.3 | 2.9 | GO:0035727 | lysophosphatidic acid binding(GO:0035727) |
| 0.3 | 2.3 | GO:0008559 | xenobiotic-transporting ATPase activity(GO:0008559) |
| 0.3 | 1.6 | GO:0032564 | adenyl deoxyribonucleotide binding(GO:0032558) dATP binding(GO:0032564) |
| 0.3 | 3.5 | GO:0005344 | oxygen transporter activity(GO:0005344) |
| 0.3 | 6.7 | GO:0005086 | ARF guanyl-nucleotide exchange factor activity(GO:0005086) |
| 0.3 | 2.3 | GO:0043426 | MRF binding(GO:0043426) |
| 0.2 | 1.7 | GO:0017077 | oxidative phosphorylation uncoupler activity(GO:0017077) |
| 0.2 | 0.2 | GO:0015168 | glycerol transmembrane transporter activity(GO:0015168) |
| 0.2 | 0.7 | GO:0046965 | retinoid X receptor binding(GO:0046965) |
| 0.2 | 1.2 | GO:0032296 | ribonuclease III activity(GO:0004525) double-stranded RNA-specific ribonuclease activity(GO:0032296) |
| 0.2 | 1.4 | GO:0072320 | volume-sensitive chloride channel activity(GO:0072320) |
| 0.2 | 0.7 | GO:0008502 | melatonin receptor activity(GO:0008502) |
| 0.2 | 5.3 | GO:0005001 | transmembrane receptor protein tyrosine phosphatase activity(GO:0005001) transmembrane receptor protein phosphatase activity(GO:0019198) |
| 0.2 | 1.1 | GO:0099583 | postsynaptic neurotransmitter receptor activity(GO:0098960) neurotransmitter receptor activity involved in regulation of postsynaptic cytosolic calcium ion concentration(GO:0099583) |
| 0.2 | 0.9 | GO:0004740 | pyruvate dehydrogenase (acetyl-transferring) kinase activity(GO:0004740) |
| 0.2 | 37.3 | GO:0017124 | SH3 domain binding(GO:0017124) |
| 0.2 | 4.3 | GO:0008656 | cysteine-type endopeptidase activator activity involved in apoptotic process(GO:0008656) |
| 0.2 | 0.8 | GO:0003726 | double-stranded RNA adenosine deaminase activity(GO:0003726) |
| 0.2 | 4.1 | GO:0000900 | translation repressor activity, nucleic acid binding(GO:0000900) |
| 0.2 | 3.7 | GO:0004622 | lysophospholipase activity(GO:0004622) |
| 0.2 | 1.7 | GO:0000150 | recombinase activity(GO:0000150) |
| 0.2 | 0.9 | GO:0070740 | tubulin-glutamic acid ligase activity(GO:0070740) |
| 0.2 | 2.6 | GO:0016813 | hydrolase activity, acting on carbon-nitrogen (but not peptide) bonds, in linear amidines(GO:0016813) |
| 0.2 | 3.0 | GO:0070513 | death domain binding(GO:0070513) |
| 0.2 | 2.3 | GO:0043274 | phospholipase binding(GO:0043274) |
| 0.2 | 0.9 | GO:0004992 | platelet activating factor receptor activity(GO:0004992) |
| 0.2 | 1.9 | GO:0043855 | intracellular cyclic nucleotide activated cation channel activity(GO:0005221) cyclic nucleotide-gated ion channel activity(GO:0043855) |
| 0.2 | 3.4 | GO:0004862 | cAMP-dependent protein kinase inhibitor activity(GO:0004862) |
| 0.2 | 4.9 | GO:0043015 | gamma-tubulin binding(GO:0043015) |
| 0.2 | 1.2 | GO:0005087 | Ran guanyl-nucleotide exchange factor activity(GO:0005087) |
| 0.2 | 0.7 | GO:0071987 | WD40-repeat domain binding(GO:0071987) |
| 0.2 | 1.9 | GO:0045159 | myosin II binding(GO:0045159) |
| 0.2 | 0.5 | GO:0051748 | UTP:glucose-1-phosphate uridylyltransferase activity(GO:0003983) UTP-monosaccharide-1-phosphate uridylyltransferase activity(GO:0051748) |
| 0.2 | 0.9 | GO:0098821 | BMP receptor activity(GO:0098821) |
| 0.2 | 0.9 | GO:0015016 | [heparan sulfate]-glucosamine N-sulfotransferase activity(GO:0015016) |
| 0.2 | 2.7 | GO:0005247 | voltage-gated chloride channel activity(GO:0005247) |
| 0.1 | 1.6 | GO:0008253 | 5'-nucleotidase activity(GO:0008253) |
| 0.1 | 0.4 | GO:0050429 | calcium-dependent phospholipase C activity(GO:0050429) |
| 0.1 | 1.1 | GO:1901612 | cardiolipin binding(GO:1901612) |
| 0.1 | 2.0 | GO:0055056 | D-glucose transmembrane transporter activity(GO:0055056) |
| 0.1 | 7.5 | GO:0001105 | RNA polymerase II transcription coactivator activity(GO:0001105) |
| 0.1 | 1.0 | GO:0000403 | Y-form DNA binding(GO:0000403) |
| 0.1 | 1.1 | GO:0005250 | A-type (transient outward) potassium channel activity(GO:0005250) |
| 0.1 | 1.7 | GO:1904264 | ubiquitin protein ligase activity involved in ERAD pathway(GO:1904264) |
| 0.1 | 3.0 | GO:0098811 | transcriptional activator activity, RNA polymerase II transcription factor binding(GO:0001190) transcriptional repressor activity, RNA polymerase II activating transcription factor binding(GO:0098811) |
| 0.1 | 0.9 | GO:0086056 | voltage-gated calcium channel activity involved in AV node cell action potential(GO:0086056) |
| 0.1 | 0.9 | GO:0008142 | oxysterol binding(GO:0008142) |
| 0.1 | 5.2 | GO:0070412 | R-SMAD binding(GO:0070412) |
| 0.1 | 0.6 | GO:0015194 | L-serine transmembrane transporter activity(GO:0015194) serine transmembrane transporter activity(GO:0022889) |
| 0.1 | 0.5 | GO:0008420 | CTD phosphatase activity(GO:0008420) |
| 0.1 | 6.4 | GO:0015485 | cholesterol binding(GO:0015485) sterol binding(GO:0032934) |
| 0.1 | 0.4 | GO:0005174 | CD40 receptor binding(GO:0005174) |
| 0.1 | 3.9 | GO:0004198 | calcium-dependent cysteine-type endopeptidase activity(GO:0004198) |
| 0.1 | 3.7 | GO:0003950 | NAD+ ADP-ribosyltransferase activity(GO:0003950) |
| 0.1 | 3.2 | GO:0004623 | phospholipase A2 activity(GO:0004623) |
| 0.1 | 0.7 | GO:0019531 | oxalate transmembrane transporter activity(GO:0019531) |
| 0.1 | 2.0 | GO:0000983 | transcription factor activity, RNA polymerase II core promoter sequence-specific(GO:0000983) |
| 0.1 | 1.4 | GO:0032393 | MHC class I receptor activity(GO:0032393) |
| 0.1 | 2.9 | GO:0097200 | cysteine-type endopeptidase activity involved in apoptotic process(GO:0097153) cysteine-type endopeptidase activity involved in execution phase of apoptosis(GO:0097200) |
| 0.1 | 0.5 | GO:0004699 | calcium-independent protein kinase C activity(GO:0004699) |
| 0.1 | 3.1 | GO:0005388 | calcium-transporting ATPase activity(GO:0005388) |
| 0.1 | 0.3 | GO:0035276 | ethanol binding(GO:0035276) |
| 0.1 | 0.6 | GO:0008467 | [heparan sulfate]-glucosamine 3-sulfotransferase 1 activity(GO:0008467) |
| 0.1 | 0.3 | GO:0010861 | thyroid hormone receptor activator activity(GO:0010861) thyroid hormone receptor coactivator activity(GO:0030375) |
| 0.1 | 2.5 | GO:0002162 | dystroglycan binding(GO:0002162) |
| 0.1 | 0.5 | GO:0023024 | MHC class I protein complex binding(GO:0023024) |
| 0.1 | 0.7 | GO:0004849 | uridine kinase activity(GO:0004849) |
| 0.1 | 1.1 | GO:0035497 | cAMP response element binding(GO:0035497) |
| 0.1 | 1.3 | GO:0042056 | chemoattractant activity(GO:0042056) |
| 0.1 | 0.3 | GO:0017082 | mineralocorticoid receptor activity(GO:0017082) |
| 0.1 | 0.8 | GO:0046920 | alpha-(1->3)-fucosyltransferase activity(GO:0046920) |
| 0.1 | 0.9 | GO:0004321 | fatty-acyl-CoA synthase activity(GO:0004321) |
| 0.1 | 0.9 | GO:0003777 | microtubule motor activity(GO:0003777) |
| 0.1 | 7.1 | GO:0004722 | protein serine/threonine phosphatase activity(GO:0004722) |
| 0.1 | 0.5 | GO:0008048 | calcium sensitive guanylate cyclase activator activity(GO:0008048) |
| 0.1 | 1.0 | GO:0001042 | RNA polymerase I core binding(GO:0001042) |
| 0.1 | 0.3 | GO:0003858 | 3-hydroxybutyrate dehydrogenase activity(GO:0003858) |
| 0.1 | 0.9 | GO:0016018 | cyclosporin A binding(GO:0016018) |
| 0.1 | 1.3 | GO:0005132 | type I interferon receptor binding(GO:0005132) |
| 0.1 | 2.5 | GO:0017091 | AU-rich element binding(GO:0017091) |
| 0.1 | 0.8 | GO:0047623 | AMP deaminase activity(GO:0003876) adenosine-phosphate deaminase activity(GO:0047623) |
| 0.1 | 0.5 | GO:0045029 | UDP-activated nucleotide receptor activity(GO:0045029) |
| 0.1 | 0.9 | GO:0061578 | Lys63-specific deubiquitinase activity(GO:0061578) |
| 0.1 | 1.7 | GO:0050321 | tau-protein kinase activity(GO:0050321) |
| 0.1 | 1.4 | GO:0005109 | frizzled binding(GO:0005109) |
| 0.1 | 1.7 | GO:0004012 | phospholipid-translocating ATPase activity(GO:0004012) |
| 0.1 | 1.1 | GO:0005004 | GPI-linked ephrin receptor activity(GO:0005004) |
| 0.1 | 1.6 | GO:0004806 | triglyceride lipase activity(GO:0004806) |
| 0.1 | 1.2 | GO:0004653 | polypeptide N-acetylgalactosaminyltransferase activity(GO:0004653) |
| 0.1 | 0.5 | GO:0004800 | thyroxine 5'-deiodinase activity(GO:0004800) |
| 0.1 | 0.2 | GO:0044549 | GTP cyclohydrolase binding(GO:0044549) |
| 0.1 | 0.5 | GO:0005332 | gamma-aminobutyric acid:sodium symporter activity(GO:0005332) gamma-aminobutyric acid transmembrane transporter activity(GO:0015185) |
| 0.1 | 1.4 | GO:0015467 | G-protein activated inward rectifier potassium channel activity(GO:0015467) |
| 0.1 | 8.9 | GO:0005262 | calcium channel activity(GO:0005262) |
| 0.1 | 1.7 | GO:0016891 | endoribonuclease activity, producing 5'-phosphomonoesters(GO:0016891) |
| 0.1 | 0.3 | GO:0004000 | adenosine deaminase activity(GO:0004000) |
| 0.1 | 1.0 | GO:0045505 | dynein intermediate chain binding(GO:0045505) |
| 0.1 | 1.7 | GO:0030676 | Rac guanyl-nucleotide exchange factor activity(GO:0030676) |
| 0.1 | 0.5 | GO:0022851 | GABA-gated chloride ion channel activity(GO:0022851) |
| 0.1 | 1.9 | GO:0030552 | cAMP binding(GO:0030552) |
| 0.1 | 1.5 | GO:0071949 | FAD binding(GO:0071949) |
| 0.1 | 0.5 | GO:0004407 | histone deacetylase activity(GO:0004407) protein deacetylase activity(GO:0033558) |
| 0.1 | 0.4 | GO:0019213 | deacetylase activity(GO:0019213) |
| 0.1 | 0.2 | GO:0004024 | alcohol dehydrogenase activity, zinc-dependent(GO:0004024) |
| 0.1 | 0.8 | GO:0031078 | histone deacetylase activity (H3-K14 specific)(GO:0031078) NAD-dependent histone deacetylase activity (H3-K14 specific)(GO:0032041) |
| 0.1 | 0.7 | GO:0000774 | adenyl-nucleotide exchange factor activity(GO:0000774) |
| 0.1 | 1.6 | GO:0004602 | glutathione peroxidase activity(GO:0004602) |
| 0.1 | 4.1 | GO:0005089 | Rho guanyl-nucleotide exchange factor activity(GO:0005089) |
| 0.1 | 1.2 | GO:0071889 | 14-3-3 protein binding(GO:0071889) |
| 0.1 | 0.2 | GO:1990430 | extracellular matrix protein binding(GO:1990430) |
| 0.1 | 1.0 | GO:0008392 | arachidonic acid monooxygenase activity(GO:0008391) arachidonic acid epoxygenase activity(GO:0008392) |
| 0.1 | 1.4 | GO:0015106 | bicarbonate transmembrane transporter activity(GO:0015106) |
| 0.1 | 1.0 | GO:0019864 | IgG binding(GO:0019864) |
| 0.1 | 0.6 | GO:0002161 | aminoacyl-tRNA editing activity(GO:0002161) |
| 0.1 | 0.8 | GO:0004062 | aryl sulfotransferase activity(GO:0004062) |
| 0.1 | 0.2 | GO:0080019 | fatty-acyl-CoA reductase (alcohol-forming) activity(GO:0080019) |
| 0.1 | 0.7 | GO:0031702 | type 1 angiotensin receptor binding(GO:0031702) |
| 0.1 | 6.4 | GO:0044325 | ion channel binding(GO:0044325) |
| 0.1 | 0.7 | GO:0008157 | protein phosphatase 1 binding(GO:0008157) |
| 0.0 | 1.1 | GO:0001784 | phosphotyrosine binding(GO:0001784) |
| 0.0 | 12.8 | GO:0008022 | protein C-terminus binding(GO:0008022) |
| 0.0 | 0.4 | GO:0005372 | water transmembrane transporter activity(GO:0005372) water channel activity(GO:0015250) |
| 0.0 | 0.3 | GO:0005025 | transforming growth factor beta receptor activity, type I(GO:0005025) |
| 0.0 | 1.0 | GO:0005044 | scavenger receptor activity(GO:0005044) |
| 0.0 | 1.1 | GO:0051393 | alpha-actinin binding(GO:0051393) |
| 0.0 | 1.0 | GO:0015269 | calcium-activated potassium channel activity(GO:0015269) |
| 0.0 | 0.5 | GO:0016290 | palmitoyl-CoA hydrolase activity(GO:0016290) |
| 0.0 | 0.9 | GO:0004708 | MAP kinase kinase activity(GO:0004708) |
| 0.0 | 0.5 | GO:0017017 | MAP kinase tyrosine/serine/threonine phosphatase activity(GO:0017017) |
| 0.0 | 0.4 | GO:0017176 | phosphatidylinositol N-acetylglucosaminyltransferase activity(GO:0017176) |
| 0.0 | 1.9 | GO:0004984 | olfactory receptor activity(GO:0004984) |
| 0.0 | 0.9 | GO:0016646 | oxidoreductase activity, acting on the CH-NH group of donors, NAD or NADP as acceptor(GO:0016646) |
| 0.0 | 0.0 | GO:1904455 | ubiquitin-specific protease activity involved in negative regulation of ERAD pathway(GO:1904455) |
| 0.0 | 0.3 | GO:0016634 | oxidoreductase activity, acting on the CH-CH group of donors, oxygen as acceptor(GO:0016634) |
| 0.0 | 3.1 | GO:0003725 | double-stranded RNA binding(GO:0003725) |
| 0.0 | 0.4 | GO:0019957 | C-C chemokine binding(GO:0019957) |
| 0.0 | 0.2 | GO:0004090 | carbonyl reductase (NADPH) activity(GO:0004090) |
| 0.0 | 0.3 | GO:0050072 | m7G(5')pppN diphosphatase activity(GO:0050072) |
| 0.0 | 2.0 | GO:0004004 | ATP-dependent RNA helicase activity(GO:0004004) |
| 0.0 | 0.2 | GO:0019958 | C-X-C chemokine binding(GO:0019958) |
| 0.0 | 9.2 | GO:0005096 | GTPase activator activity(GO:0005096) |
| 0.0 | 1.4 | GO:0005484 | SNAP receptor activity(GO:0005484) |
| 0.0 | 0.5 | GO:0030306 | ADP-ribosylation factor binding(GO:0030306) |
| 0.0 | 0.3 | GO:0017169 | CDP-alcohol phosphatidyltransferase activity(GO:0017169) |
| 0.0 | 0.2 | GO:0060175 | brain-derived neurotrophic factor-activated receptor activity(GO:0060175) |
| 0.0 | 0.2 | GO:0047237 | glucuronylgalactosylproteoglycan 4-beta-N-acetylgalactosaminyltransferase activity(GO:0047237) |
| 0.0 | 0.6 | GO:0008395 | steroid hydroxylase activity(GO:0008395) |
| 0.0 | 1.4 | GO:0016782 | transferase activity, transferring sulfur-containing groups(GO:0016782) |
| 0.0 | 2.4 | GO:0002020 | protease binding(GO:0002020) |
| 0.0 | 0.3 | GO:0008266 | poly(U) RNA binding(GO:0008266) |
| 0.0 | 0.3 | GO:0034450 | ubiquitin-ubiquitin ligase activity(GO:0034450) |
| 0.0 | 0.2 | GO:0048495 | Roundabout binding(GO:0048495) |
| 0.0 | 0.3 | GO:0004435 | phosphatidylinositol phospholipase C activity(GO:0004435) |
| 0.0 | 0.2 | GO:0005242 | inward rectifier potassium channel activity(GO:0005242) |
| 0.0 | 0.6 | GO:0004467 | long-chain fatty acid-CoA ligase activity(GO:0004467) fatty acid ligase activity(GO:0015645) |
| 0.0 | 0.2 | GO:0050682 | AF-2 domain binding(GO:0050682) |
| 0.0 | 0.2 | GO:0005114 | type II transforming growth factor beta receptor binding(GO:0005114) |
| 0.0 | 0.9 | GO:0043022 | ribosome binding(GO:0043022) |
| 0.0 | 0.3 | GO:0032454 | histone demethylase activity (H3-K9 specific)(GO:0032454) |
| 0.0 | 0.2 | GO:0005021 | vascular endothelial growth factor-activated receptor activity(GO:0005021) |
| 0.0 | 0.1 | GO:0036317 | tyrosyl-RNA phosphodiesterase activity(GO:0036317) 5'-tyrosyl-DNA phosphodiesterase activity(GO:0070260) |
| 0.0 | 0.1 | GO:0004337 | dimethylallyltranstransferase activity(GO:0004161) geranyltranstransferase activity(GO:0004337) |
| 0.0 | 0.1 | GO:0017128 | phospholipid scramblase activity(GO:0017128) |
| 0.0 | 4.7 | GO:0004252 | serine-type endopeptidase activity(GO:0004252) |
| 0.0 | 0.9 | GO:0016831 | carboxy-lyase activity(GO:0016831) |
| 0.0 | 0.5 | GO:0042162 | telomeric DNA binding(GO:0042162) |
| 0.0 | 1.2 | GO:0031490 | chromatin DNA binding(GO:0031490) |
| 0.0 | 0.0 | GO:0046848 | hydroxyapatite binding(GO:0046848) |
| 0.0 | 0.5 | GO:0008188 | neuropeptide receptor activity(GO:0008188) |
| 0.0 | 0.8 | GO:0004843 | thiol-dependent ubiquitin-specific protease activity(GO:0004843) |
| 0.0 | 0.5 | GO:0002039 | p53 binding(GO:0002039) |
| 0.0 | 0.1 | GO:0005499 | vitamin D binding(GO:0005499) |
| 0.0 | 0.1 | GO:0005548 | phospholipid transporter activity(GO:0005548) |
| 0.0 | 0.1 | GO:0004887 | thyroid hormone receptor activity(GO:0004887) |
| 0.0 | 0.2 | GO:0030898 | actin-dependent ATPase activity(GO:0030898) |
Gene overrepresentation in C2:CP category:
| Log-likelihood per target | Total log-likelihood | Term | Description |
|---|---|---|---|
| 0.6 | 1.2 | SA G2 AND M PHASES | Cdc25 activates the cdc2/cyclin B complex to induce the G2/M transition. |
| 0.6 | 32.2 | PID IL8 CXCR2 PATHWAY | IL8- and CXCR2-mediated signaling events |
| 0.4 | 21.3 | PID NCADHERIN PATHWAY | N-cadherin signaling events |
| 0.4 | 22.8 | SIG CD40PATHWAYMAP | Genes related to CD40 signaling |
| 0.4 | 21.8 | SIG BCR SIGNALING PATHWAY | Members of the BCR signaling pathway |
| 0.4 | 28.4 | ST T CELL SIGNAL TRANSDUCTION | T Cell Signal Transduction |
| 0.3 | 2.1 | ST DIFFERENTIATION PATHWAY IN PC12 CELLS | Differentiation Pathway in PC12 Cells; this is a specific case of PAC1 Receptor Pathway. |
| 0.3 | 14.4 | PID MAPK TRK PATHWAY | Trk receptor signaling mediated by the MAPK pathway |
| 0.2 | 4.0 | ST INTERLEUKIN 4 PATHWAY | Interleukin 4 (IL-4) Pathway |
| 0.2 | 2.7 | ST INTERFERON GAMMA PATHWAY | Interferon gamma pathway. |
| 0.2 | 10.7 | PID RAC1 REG PATHWAY | Regulation of RAC1 activity |
| 0.2 | 7.7 | PID TCR PATHWAY | TCR signaling in naïve CD4+ T cells |
| 0.2 | 6.5 | PID ALPHA SYNUCLEIN PATHWAY | Alpha-synuclein signaling |
| 0.2 | 2.8 | SA PROGRAMMED CELL DEATH | Programmed cell death, or apoptosis, eliminates damaged or unneeded cells. |
| 0.2 | 4.3 | PID P38 MKK3 6PATHWAY | p38 MAPK signaling pathway |
| 0.1 | 2.2 | PID CD40 PATHWAY | CD40/CD40L signaling |
| 0.1 | 8.3 | PID RHOA REG PATHWAY | Regulation of RhoA activity |
| 0.1 | 1.7 | ST GRANULE CELL SURVIVAL PATHWAY | Granule Cell Survival Pathway is a specific case of more general PAC1 Receptor Pathway. |
| 0.1 | 4.1 | ST TUMOR NECROSIS FACTOR PATHWAY | Tumor Necrosis Factor Pathway. |
| 0.1 | 7.3 | PID RAC1 PATHWAY | RAC1 signaling pathway |
| 0.1 | 4.6 | PID IL1 PATHWAY | IL1-mediated signaling events |
| 0.1 | 3.7 | PID THROMBIN PAR1 PATHWAY | PAR1-mediated thrombin signaling events |
| 0.1 | 3.3 | PID MTOR 4PATHWAY | mTOR signaling pathway |
| 0.1 | 12.1 | PID MYC REPRESS PATHWAY | Validated targets of C-MYC transcriptional repression |
| 0.1 | 1.5 | PID INTEGRIN A9B1 PATHWAY | Alpha9 beta1 integrin signaling events |
| 0.1 | 1.3 | PID BCR 5PATHWAY | BCR signaling pathway |
| 0.1 | 0.9 | PID ALK1 PATHWAY | ALK1 signaling events |
| 0.1 | 2.3 | PID PS1 PATHWAY | Presenilin action in Notch and Wnt signaling |
| 0.1 | 5.2 | PID BETA CATENIN NUC PATHWAY | Regulation of nuclear beta catenin signaling and target gene transcription |
| 0.1 | 0.4 | PID CONE PATHWAY | Visual signal transduction: Cones |
| 0.1 | 1.0 | PID INTEGRIN5 PATHWAY | Beta5 beta6 beta7 and beta8 integrin cell surface interactions |
| 0.0 | 0.3 | PID ECADHERIN KERATINOCYTE PATHWAY | E-cadherin signaling in keratinocytes |
| 0.0 | 0.5 | ST WNT CA2 CYCLIC GMP PATHWAY | Wnt/Ca2+/cyclic GMP signaling. |
| 0.0 | 1.5 | PID RHODOPSIN PATHWAY | Visual signal transduction: Rods |
| 0.0 | 0.2 | PID LYMPH ANGIOGENESIS PATHWAY | VEGFR3 signaling in lymphatic endothelium |
| 0.0 | 0.5 | PID EPO PATHWAY | EPO signaling pathway |
| 0.0 | 0.9 | PID TXA2PATHWAY | Thromboxane A2 receptor signaling |
| 0.0 | 0.9 | PID INTEGRIN CS PATHWAY | Integrin family cell surface interactions |
| 0.0 | 0.7 | PID FGF PATHWAY | FGF signaling pathway |
| 0.0 | 1.6 | PID ATR PATHWAY | ATR signaling pathway |
| 0.0 | 0.6 | PID INTEGRIN2 PATHWAY | Beta2 integrin cell surface interactions |
| 0.0 | 0.8 | PID CD8 TCR DOWNSTREAM PATHWAY | Downstream signaling in naïve CD8+ T cells |
| 0.0 | 1.1 | PID TRKR PATHWAY | Neurotrophic factor-mediated Trk receptor signaling |
| 0.0 | 0.5 | PID ARF 3PATHWAY | Arf1 pathway |
| 0.0 | 1.8 | PID HIF1 TFPATHWAY | HIF-1-alpha transcription factor network |
| 0.0 | 0.3 | PID HIV NEF PATHWAY | HIV-1 Nef: Negative effector of Fas and TNF-alpha |
| 0.0 | 0.2 | ST ERK1 ERK2 MAPK PATHWAY | ERK1/ERK2 MAPK Pathway |
| 0.0 | 1.5 | PID P73PATHWAY | p73 transcription factor network |
| 0.0 | 0.4 | PID CDC42 PATHWAY | CDC42 signaling events |
Gene overrepresentation in C2:CP:REACTOME category:
| Log-likelihood per target | Total log-likelihood | Term | Description |
|---|---|---|---|
| 0.8 | 18.9 | REACTOME UNBLOCKING OF NMDA RECEPTOR GLUTAMATE BINDING AND ACTIVATION | Genes involved in Unblocking of NMDA receptor, glutamate binding and activation |
| 0.7 | 39.3 | REACTOME MYOGENESIS | Genes involved in Myogenesis |
| 0.7 | 6.1 | REACTOME RAS ACTIVATION UOPN CA2 INFUX THROUGH NMDA RECEPTOR | Genes involved in Ras activation uopn Ca2+ infux through NMDA receptor |
| 0.7 | 9.3 | REACTOME PASSIVE TRANSPORT BY AQUAPORINS | Genes involved in Passive Transport by Aquaporins |
| 0.6 | 11.6 | REACTOME CLASS C 3 METABOTROPIC GLUTAMATE PHEROMONE RECEPTORS | Genes involved in Class C/3 (Metabotropic glutamate/pheromone receptors) |
| 0.6 | 11.0 | REACTOME NOREPINEPHRINE NEUROTRANSMITTER RELEASE CYCLE | Genes involved in Norepinephrine Neurotransmitter Release Cycle |
| 0.6 | 19.7 | REACTOME ASSOCIATION OF TRIC CCT WITH TARGET PROTEINS DURING BIOSYNTHESIS | Genes involved in Association of TriC/CCT with target proteins during biosynthesis |
| 0.5 | 7.7 | REACTOME ACTIVATION OF THE AP1 FAMILY OF TRANSCRIPTION FACTORS | Genes involved in Activation of the AP-1 family of transcription factors |
| 0.4 | 10.2 | REACTOME ADHERENS JUNCTIONS INTERACTIONS | Genes involved in Adherens junctions interactions |
| 0.4 | 18.8 | REACTOME THE ROLE OF NEF IN HIV1 REPLICATION AND DISEASE PATHOGENESIS | Genes involved in The role of Nef in HIV-1 replication and disease pathogenesis |
| 0.4 | 8.4 | REACTOME PLATELET SENSITIZATION BY LDL | Genes involved in Platelet sensitization by LDL |
| 0.4 | 11.8 | REACTOME DARPP 32 EVENTS | Genes involved in DARPP-32 events |
| 0.4 | 5.3 | REACTOME BILE SALT AND ORGANIC ANION SLC TRANSPORTERS | Genes involved in Bile salt and organic anion SLC transporters |
| 0.4 | 8.1 | REACTOME CTLA4 INHIBITORY SIGNALING | Genes involved in CTLA4 inhibitory signaling |
| 0.3 | 9.8 | REACTOME AMINO ACID SYNTHESIS AND INTERCONVERSION TRANSAMINATION | Genes involved in Amino acid synthesis and interconversion (transamination) |
| 0.3 | 10.4 | REACTOME GABA A RECEPTOR ACTIVATION | Genes involved in GABA A receptor activation |
| 0.3 | 9.5 | REACTOME HORMONE SENSITIVE LIPASE HSL MEDIATED TRIACYLGLYCEROL HYDROLYSIS | Genes involved in Hormone-sensitive lipase (HSL)-mediated triacylglycerol hydrolysis |
| 0.3 | 11.0 | REACTOME INTERACTION BETWEEN L1 AND ANKYRINS | Genes involved in Interaction between L1 and Ankyrins |
| 0.3 | 9.0 | REACTOME CYTOSOLIC SULFONATION OF SMALL MOLECULES | Genes involved in Cytosolic sulfonation of small molecules |
| 0.3 | 3.4 | REACTOME RETROGRADE NEUROTROPHIN SIGNALLING | Genes involved in Retrograde neurotrophin signalling |
| 0.3 | 2.6 | REACTOME BETA DEFENSINS | Genes involved in Beta defensins |
| 0.2 | 6.7 | REACTOME PLATELET CALCIUM HOMEOSTASIS | Genes involved in Platelet calcium homeostasis |
| 0.2 | 3.0 | REACTOME REGULATION OF SIGNALING BY CBL | Genes involved in Regulation of signaling by CBL |
| 0.2 | 4.8 | REACTOME AMINE DERIVED HORMONES | Genes involved in Amine-derived hormones |
| 0.2 | 4.0 | REACTOME IL 7 SIGNALING | Genes involved in Interleukin-7 signaling |
| 0.2 | 3.9 | REACTOME PRE NOTCH TRANSCRIPTION AND TRANSLATION | Genes involved in Pre-NOTCH Transcription and Translation |
| 0.2 | 2.3 | REACTOME REGULATION OF THE FANCONI ANEMIA PATHWAY | Genes involved in Regulation of the Fanconi anemia pathway |
| 0.2 | 3.0 | REACTOME IONOTROPIC ACTIVITY OF KAINATE RECEPTORS | Genes involved in Ionotropic activity of Kainate Receptors |
| 0.2 | 10.6 | REACTOME CYTOCHROME P450 ARRANGED BY SUBSTRATE TYPE | Genes involved in Cytochrome P450 - arranged by substrate type |
| 0.2 | 6.9 | REACTOME INTERFERON GAMMA SIGNALING | Genes involved in Interferon gamma signaling |
| 0.2 | 1.3 | REACTOME GPVI MEDIATED ACTIVATION CASCADE | Genes involved in GPVI-mediated activation cascade |
| 0.2 | 0.6 | REACTOME ACTIVATION OF KAINATE RECEPTORS UPON GLUTAMATE BINDING | Genes involved in Activation of Kainate Receptors upon glutamate binding |
| 0.2 | 3.3 | REACTOME PHOSPHORYLATION OF CD3 AND TCR ZETA CHAINS | Genes involved in Phosphorylation of CD3 and TCR zeta chains |
| 0.2 | 14.1 | REACTOME MEIOTIC SYNAPSIS | Genes involved in Meiotic Synapsis |
| 0.2 | 13.1 | REACTOME INTERFERON ALPHA BETA SIGNALING | Genes involved in Interferon alpha/beta signaling |
| 0.1 | 4.9 | REACTOME BASIGIN INTERACTIONS | Genes involved in Basigin interactions |
| 0.1 | 5.4 | REACTOME THROMBIN SIGNALLING THROUGH PROTEINASE ACTIVATED RECEPTORS PARS | Genes involved in Thrombin signalling through proteinase activated receptors (PARs) |
| 0.1 | 3.1 | REACTOME OTHER SEMAPHORIN INTERACTIONS | Genes involved in Other semaphorin interactions |
| 0.1 | 1.7 | REACTOME ABACAVIR TRANSPORT AND METABOLISM | Genes involved in Abacavir transport and metabolism |
| 0.1 | 3.6 | REACTOME REGULATION OF INSULIN SECRETION BY GLUCAGON LIKE PEPTIDE1 | Genes involved in Regulation of Insulin Secretion by Glucagon-like Peptide-1 |
| 0.1 | 4.0 | REACTOME EXTRINSIC PATHWAY FOR APOPTOSIS | Genes involved in Extrinsic Pathway for Apoptosis |
| 0.1 | 0.5 | REACTOME RECEPTOR LIGAND BINDING INITIATES THE SECOND PROTEOLYTIC CLEAVAGE OF NOTCH RECEPTOR | Genes involved in Receptor-ligand binding initiates the second proteolytic cleavage of Notch receptor |
| 0.1 | 2.0 | REACTOME G PROTEIN ACTIVATION | Genes involved in G-protein activation |
| 0.1 | 0.9 | REACTOME INHIBITION OF INSULIN SECRETION BY ADRENALINE NORADRENALINE | Genes involved in Inhibition of Insulin Secretion by Adrenaline/Noradrenaline |
| 0.1 | 2.7 | REACTOME TGF BETA RECEPTOR SIGNALING IN EMT EPITHELIAL TO MESENCHYMAL TRANSITION | Genes involved in TGF-beta receptor signaling in EMT (epithelial to mesenchymal transition) |
| 0.1 | 4.1 | REACTOME SPHINGOLIPID DE NOVO BIOSYNTHESIS | Genes involved in Sphingolipid de novo biosynthesis |
| 0.1 | 2.0 | REACTOME THE NLRP3 INFLAMMASOME | Genes involved in The NLRP3 inflammasome |
| 0.1 | 11.1 | REACTOME TRANSCRIPTIONAL REGULATION OF WHITE ADIPOCYTE DIFFERENTIATION | Genes involved in Transcriptional Regulation of White Adipocyte Differentiation |
| 0.1 | 1.6 | REACTOME PYRIMIDINE CATABOLISM | Genes involved in Pyrimidine catabolism |
| 0.1 | 0.5 | REACTOME ERKS ARE INACTIVATED | Genes involved in ERKs are inactivated |
| 0.1 | 1.2 | REACTOME INFLAMMASOMES | Genes involved in Inflammasomes |
| 0.1 | 4.9 | REACTOME AMYLOIDS | Genes involved in Amyloids |
| 0.1 | 15.5 | REACTOME SIGNALING BY RHO GTPASES | Genes involved in Signaling by Rho GTPases |
| 0.1 | 9.2 | REACTOME FACTORS INVOLVED IN MEGAKARYOCYTE DEVELOPMENT AND PLATELET PRODUCTION | Genes involved in Factors involved in megakaryocyte development and platelet production |
| 0.1 | 3.1 | REACTOME ABC FAMILY PROTEINS MEDIATED TRANSPORT | Genes involved in ABC-family proteins mediated transport |
| 0.1 | 1.9 | REACTOME METABOLISM OF POLYAMINES | Genes involved in Metabolism of polyamines |
| 0.1 | 1.4 | REACTOME INHIBITION OF VOLTAGE GATED CA2 CHANNELS VIA GBETA GAMMA SUBUNITS | Genes involved in Inhibition of voltage gated Ca2+ channels via Gbeta/gamma subunits |
| 0.1 | 2.5 | REACTOME INTRINSIC PATHWAY FOR APOPTOSIS | Genes involved in Intrinsic Pathway for Apoptosis |
| 0.1 | 0.5 | REACTOME ETHANOL OXIDATION | Genes involved in Ethanol oxidation |
| 0.1 | 1.4 | REACTOME PROTEOLYTIC CLEAVAGE OF SNARE COMPLEX PROTEINS | Genes involved in Proteolytic cleavage of SNARE complex proteins |
| 0.1 | 4.9 | REACTOME CLASS B 2 SECRETIN FAMILY RECEPTORS | Genes involved in Class B/2 (Secretin family receptors) |
| 0.1 | 3.8 | REACTOME STRIATED MUSCLE CONTRACTION | Genes involved in Striated Muscle Contraction |
| 0.1 | 0.9 | REACTOME REGULATION OF PYRUVATE DEHYDROGENASE PDH COMPLEX | Genes involved in Regulation of pyruvate dehydrogenase (PDH) complex |
| 0.1 | 1.1 | REACTOME SYNTHESIS OF VERY LONG CHAIN FATTY ACYL COAS | Genes involved in Synthesis of very long-chain fatty acyl-CoAs |
| 0.1 | 1.4 | REACTOME EFFECTS OF PIP2 HYDROLYSIS | Genes involved in Effects of PIP2 hydrolysis |
| 0.0 | 1.3 | REACTOME SIGNALING BY FGFR1 FUSION MUTANTS | Genes involved in Signaling by FGFR1 fusion mutants |
| 0.0 | 1.1 | REACTOME SIGNAL REGULATORY PROTEIN SIRP FAMILY INTERACTIONS | Genes involved in Signal regulatory protein (SIRP) family interactions |
| 0.0 | 1.2 | REACTOME MEIOTIC RECOMBINATION | Genes involved in Meiotic Recombination |
| 0.0 | 1.1 | REACTOME SIGNALLING BY NGF | Genes involved in Signalling by NGF |
| 0.0 | 1.2 | REACTOME MICRORNA MIRNA BIOGENESIS | Genes involved in MicroRNA (miRNA) Biogenesis |
| 0.0 | 0.6 | REACTOME GAMMA CARBOXYLATION TRANSPORT AND AMINO TERMINAL CLEAVAGE OF PROTEINS | Genes involved in Gamma-carboxylation, transport, and amino-terminal cleavage of proteins |
| 0.0 | 1.9 | REACTOME OLFACTORY SIGNALING PATHWAY | Genes involved in Olfactory Signaling Pathway |
| 0.0 | 1.1 | REACTOME AMINE COMPOUND SLC TRANSPORTERS | Genes involved in Amine compound SLC transporters |
| 0.0 | 0.9 | REACTOME DEPOSITION OF NEW CENPA CONTAINING NUCLEOSOMES AT THE CENTROMERE | Genes involved in Deposition of New CENPA-containing Nucleosomes at the Centromere |
| 0.0 | 0.5 | REACTOME ALPHA LINOLENIC ACID ALA METABOLISM | Genes involved in alpha-linolenic acid (ALA) metabolism |
| 0.0 | 0.7 | REACTOME DOWNSTREAM TCR SIGNALING | Genes involved in Downstream TCR signaling |
| 0.0 | 2.3 | REACTOME POTASSIUM CHANNELS | Genes involved in Potassium Channels |
| 0.0 | 0.8 | REACTOME PURINE SALVAGE | Genes involved in Purine salvage |
| 0.0 | 0.8 | REACTOME NOTCH1 INTRACELLULAR DOMAIN REGULATES TRANSCRIPTION | Genes involved in NOTCH1 Intracellular Domain Regulates Transcription |
| 0.0 | 0.7 | REACTOME RNA POL III TRANSCRIPTION INITIATION FROM TYPE 3 PROMOTER | Genes involved in RNA Polymerase III Transcription Initiation From Type 3 Promoter |
| 0.0 | 0.5 | REACTOME P2Y RECEPTORS | Genes involved in P2Y receptors |
| 0.0 | 0.2 | REACTOME TETRAHYDROBIOPTERIN BH4 SYNTHESIS RECYCLING SALVAGE AND REGULATION | Genes involved in Tetrahydrobiopterin (BH4) synthesis, recycling, salvage and regulation |
| 0.0 | 0.1 | REACTOME SIGNALING BY ERBB4 | Genes involved in Signaling by ERBB4 |
| 0.0 | 0.3 | REACTOME DESTABILIZATION OF MRNA BY BRF1 | Genes involved in Destabilization of mRNA by Butyrate Response Factor 1 (BRF1) |
| 0.0 | 0.9 | REACTOME O LINKED GLYCOSYLATION OF MUCINS | Genes involved in O-linked glycosylation of mucins |
| 0.0 | 1.2 | REACTOME METABOLISM OF VITAMINS AND COFACTORS | Genes involved in Metabolism of vitamins and cofactors |
| 0.0 | 0.3 | REACTOME CELL DEATH SIGNALLING VIA NRAGE NRIF AND NADE | Genes involved in Cell death signalling via NRAGE, NRIF and NADE |
| 0.0 | 0.5 | REACTOME SIGNALING BY FGFR MUTANTS | Genes involved in Signaling by FGFR mutants |
| 0.0 | 0.9 | REACTOME IMMUNOREGULATORY INTERACTIONS BETWEEN A LYMPHOID AND A NON LYMPHOID CELL | Genes involved in Immunoregulatory interactions between a Lymphoid and a non-Lymphoid cell |
| 0.0 | 0.2 | REACTOME HIGHLY CALCIUM PERMEABLE POSTSYNAPTIC NICOTINIC ACETYLCHOLINE RECEPTORS | Genes involved in Highly calcium permeable postsynaptic nicotinic acetylcholine receptors |
| 0.0 | 0.2 | REACTOME VEGF LIGAND RECEPTOR INTERACTIONS | Genes involved in VEGF ligand-receptor interactions |
| 0.0 | 0.1 | REACTOME AKT PHOSPHORYLATES TARGETS IN THE CYTOSOL | Genes involved in AKT phosphorylates targets in the cytosol |