Project
GNF SymAtlas + NCI-60 cancer cell lines, comparison of cancers vs non-cancers, human (Su, 2004; Ross, 2000)
Navigation
Downloads
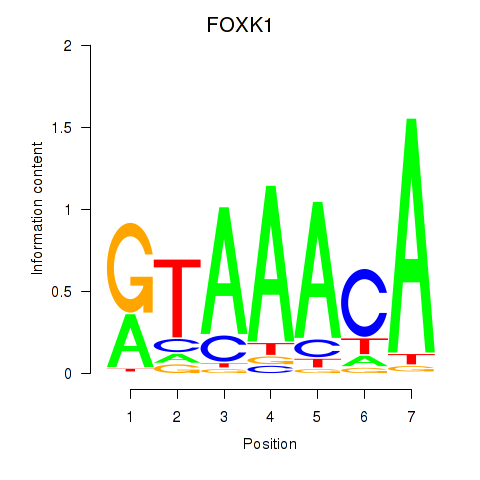
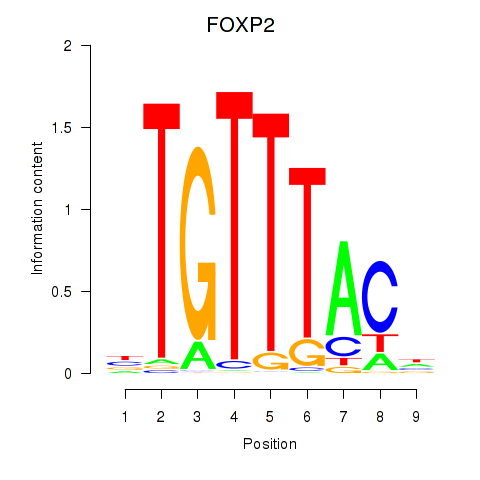
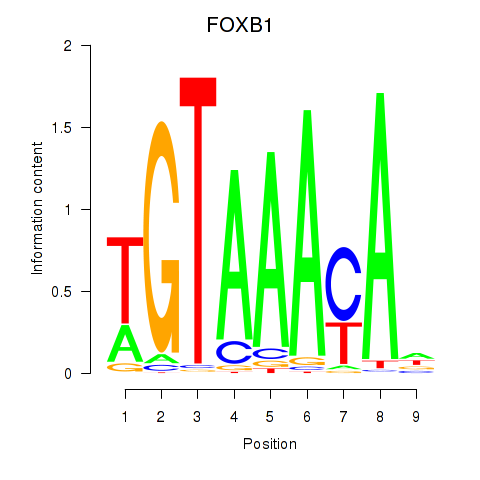
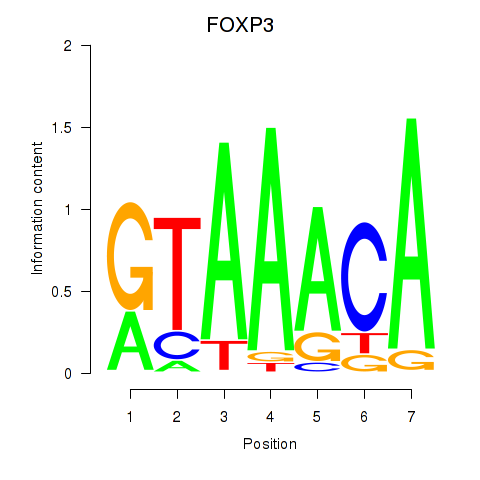
Results for FOXK1_FOXP2_FOXB1_FOXP3
Z-value: 1.04
Motif logo
Transcription factors associated with FOXK1_FOXP2_FOXB1_FOXP3
| Gene Symbol | Gene ID | Gene Info |
|---|---|---|
|
FOXK1
|
ENSG00000164916.9 | forkhead box K1 |
|
FOXP2
|
ENSG00000128573.18 | forkhead box P2 |
|
FOXB1
|
ENSG00000171956.5 | forkhead box B1 |
|
FOXP3
|
ENSG00000049768.10 | forkhead box P3 |
Activity-expression correlation:
| Gene | Promoter | Pearson corr. coef. | P-value | Plot |
|---|---|---|---|---|
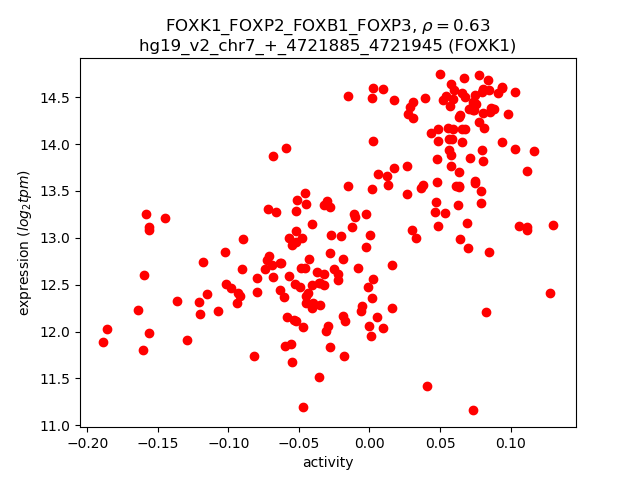
| FOXK1 | hg19_v2_chr7_+_4721885_4721945 | 0.63 | 8.6e-26 | Click! |
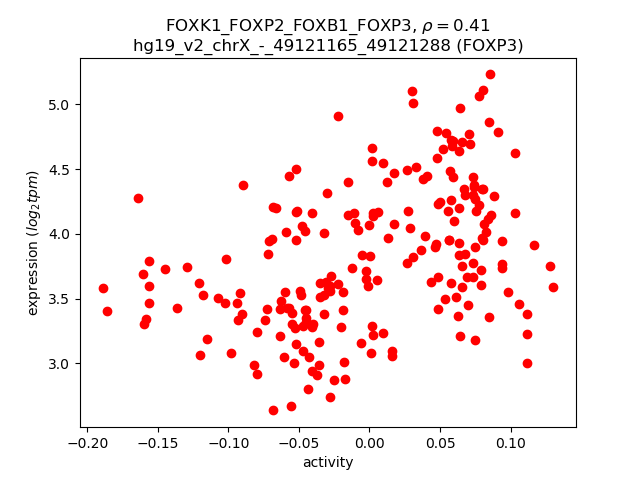
| FOXP3 | hg19_v2_chrX_-_49121165_49121288 | 0.41 | 1.7e-10 | Click! |
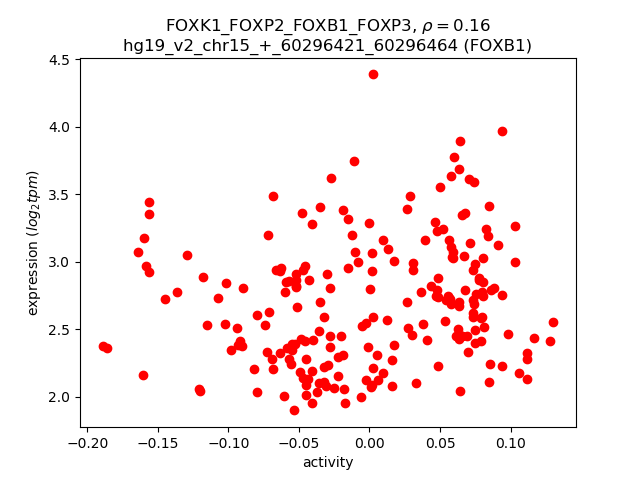
| FOXB1 | hg19_v2_chr15_+_60296421_60296464 | 0.16 | 2.2e-02 | Click! |
Activity profile of FOXK1_FOXP2_FOXB1_FOXP3 motif
Sorted Z-values of FOXK1_FOXP2_FOXB1_FOXP3 motif
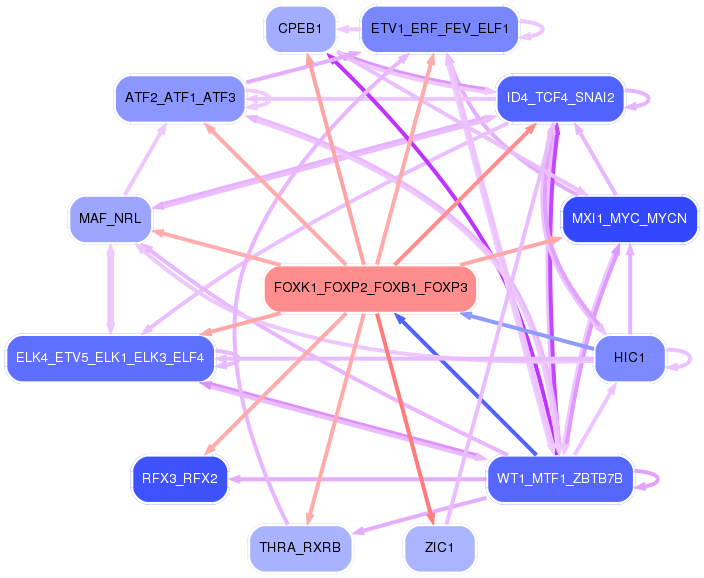
Network of associatons between targets according to the STRING database.

First level regulatory network of FOXK1_FOXP2_FOXB1_FOXP3
Gene Ontology Analysis
Gene overrepresentation in biological_process category:
| Log-likelihood per target | Total log-likelihood | Term | Description |
|---|---|---|---|
| 14.4 | 43.2 | GO:0030718 | germ-line stem cell population maintenance(GO:0030718) |
| 14.3 | 57.2 | GO:0019859 | pyrimidine nucleobase catabolic process(GO:0006208) thymine catabolic process(GO:0006210) thymine metabolic process(GO:0019859) |
| 13.7 | 164.0 | GO:1900747 | negative regulation of vascular endothelial growth factor signaling pathway(GO:1900747) |
| 12.4 | 222.7 | GO:0007021 | tubulin complex assembly(GO:0007021) |
| 11.2 | 66.9 | GO:0090131 | mesenchyme migration(GO:0090131) |
| 10.4 | 31.3 | GO:0098746 | fast, calcium ion-dependent exocytosis of neurotransmitter(GO:0098746) |
| 10.1 | 162.3 | GO:0090361 | platelet-derived growth factor production(GO:0090360) regulation of platelet-derived growth factor production(GO:0090361) |
| 9.8 | 48.9 | GO:0099590 | neurotransmitter receptor internalization(GO:0099590) |
| 8.9 | 26.8 | GO:0099552 | trans-synaptic signaling by lipid, modulating synaptic transmission(GO:0099552) trans-synaptic signaling by endocannabinoid, modulating synaptic transmission(GO:0099553) |
| 8.3 | 49.6 | GO:0016554 | cytidine to uridine editing(GO:0016554) |
| 7.9 | 39.7 | GO:0030070 | insulin processing(GO:0030070) |
| 7.9 | 7.9 | GO:0046113 | nucleobase catabolic process(GO:0046113) |
| 7.7 | 38.6 | GO:0071477 | hypotonic salinity response(GO:0042539) cellular hypotonic salinity response(GO:0071477) |
| 7.1 | 28.2 | GO:0042271 | susceptibility to natural killer cell mediated cytotoxicity(GO:0042271) |
| 7.0 | 20.9 | GO:1990764 | regulation of myofibroblast contraction(GO:1904328) myofibroblast contraction(GO:1990764) |
| 6.7 | 26.7 | GO:0010157 | response to chlorate(GO:0010157) |
| 6.4 | 83.6 | GO:0001867 | complement activation, lectin pathway(GO:0001867) |
| 6.4 | 63.7 | GO:0051611 | negative regulation of neurotransmitter uptake(GO:0051581) serotonin uptake(GO:0051610) regulation of serotonin uptake(GO:0051611) negative regulation of serotonin uptake(GO:0051612) |
| 5.2 | 20.6 | GO:0002904 | positive regulation of B cell apoptotic process(GO:0002904) |
| 5.1 | 15.2 | GO:0045957 | regulation of complement activation, alternative pathway(GO:0030451) negative regulation of complement activation, alternative pathway(GO:0045957) |
| 4.9 | 24.7 | GO:0006651 | diacylglycerol biosynthetic process(GO:0006651) |
| 4.8 | 19.3 | GO:0086097 | phospholipase C-activating angiotensin-activated signaling pathway(GO:0086097) |
| 4.7 | 14.1 | GO:2000097 | regulation of smooth muscle cell-matrix adhesion(GO:2000097) |
| 4.6 | 22.8 | GO:0051029 | rRNA transport(GO:0051029) |
| 4.5 | 36.2 | GO:0007258 | JUN phosphorylation(GO:0007258) |
| 4.5 | 13.6 | GO:0071301 | cellular response to vitamin B1(GO:0071301) response to formaldehyde(GO:1904404) |
| 4.5 | 22.3 | GO:0044858 | plasma membrane raft distribution(GO:0044855) plasma membrane raft localization(GO:0044856) plasma membrane raft polarization(GO:0044858) regulation of plasma membrane raft polarization(GO:1903906) |
| 4.4 | 4.4 | GO:0090218 | positive regulation of phosphatidylinositol 3-kinase activity(GO:0043552) positive regulation of lipid kinase activity(GO:0090218) |
| 4.4 | 17.5 | GO:1904565 | response to 1-oleoyl-sn-glycerol 3-phosphate(GO:1904565) cellular response to 1-oleoyl-sn-glycerol 3-phosphate(GO:1904566) |
| 4.2 | 21.2 | GO:0043988 | histone H3-S28 phosphorylation(GO:0043988) |
| 4.1 | 12.3 | GO:0006533 | aspartate catabolic process(GO:0006533) |
| 4.1 | 12.2 | GO:0019557 | histidine catabolic process to glutamate and formamide(GO:0019556) histidine catabolic process to glutamate and formate(GO:0019557) formamide metabolic process(GO:0043606) |
| 4.0 | 19.9 | GO:0030382 | sperm mitochondrion organization(GO:0030382) |
| 3.9 | 30.9 | GO:2000766 | negative regulation of cytoplasmic translation(GO:2000766) |
| 3.7 | 3.7 | GO:0034380 | high-density lipoprotein particle assembly(GO:0034380) |
| 3.7 | 14.8 | GO:0030644 | cellular chloride ion homeostasis(GO:0030644) |
| 3.7 | 11.0 | GO:0072560 | glandular epithelial cell maturation(GO:0002071) type B pancreatic cell maturation(GO:0072560) |
| 3.5 | 14.1 | GO:0090301 | fibroblast growth factor receptor signaling pathway involved in neural plate anterior/posterior pattern formation(GO:0060825) regulation of neural crest formation(GO:0090299) negative regulation of neural crest formation(GO:0090301) regulation of fibroblast growth factor receptor signaling pathway involved in neural plate anterior/posterior pattern formation(GO:2000313) negative regulation of fibroblast growth factor receptor signaling pathway involved in neural plate anterior/posterior pattern formation(GO:2000314) |
| 3.5 | 17.4 | GO:0071442 | positive regulation of histone H3-K14 acetylation(GO:0071442) |
| 3.4 | 10.1 | GO:0036118 | hyaluranon cable assembly(GO:0036118) regulation of hyaluranon cable assembly(GO:1900104) positive regulation of hyaluranon cable assembly(GO:1900106) |
| 3.4 | 23.6 | GO:0046604 | positive regulation of mitotic centrosome separation(GO:0046604) |
| 3.3 | 23.2 | GO:0048014 | Tie signaling pathway(GO:0048014) |
| 3.3 | 19.8 | GO:0030421 | defecation(GO:0030421) |
| 3.3 | 9.8 | GO:2000296 | regulation of hydrogen peroxide catabolic process(GO:2000295) negative regulation of hydrogen peroxide catabolic process(GO:2000296) |
| 3.2 | 9.7 | GO:1901350 | cell-cell signaling involved in cell-cell junction organization(GO:1901350) |
| 3.2 | 9.7 | GO:0019836 | hemolysis by symbiont of host erythrocytes(GO:0019836) hemolysis in other organism(GO:0044179) hemolysis in other organism involved in symbiotic interaction(GO:0052331) |
| 3.1 | 12.5 | GO:0071494 | cellular response to UV-C(GO:0071494) |
| 3.1 | 9.4 | GO:0002276 | basophil activation involved in immune response(GO:0002276) |
| 3.1 | 12.4 | GO:0010645 | regulation of cell communication by chemical coupling(GO:0010645) positive regulation of cell communication by chemical coupling(GO:0010652) |
| 3.0 | 9.0 | GO:0093001 | glycolysis from storage polysaccharide through glucose-1-phosphate(GO:0093001) |
| 3.0 | 9.0 | GO:0061188 | negative regulation of chromatin silencing at rDNA(GO:0061188) histone H3-K27 demethylation(GO:0071557) |
| 3.0 | 35.6 | GO:0070327 | thyroid hormone transport(GO:0070327) |
| 2.9 | 23.4 | GO:0060414 | aorta smooth muscle tissue morphogenesis(GO:0060414) |
| 2.8 | 11.4 | GO:1903288 | protein transport into plasma membrane raft(GO:0044861) positive regulation of potassium ion import(GO:1903288) |
| 2.8 | 8.4 | GO:0038060 | nitric oxide-cGMP-mediated signaling pathway(GO:0038060) |
| 2.8 | 11.1 | GO:1902261 | positive regulation of delayed rectifier potassium channel activity(GO:1902261) |
| 2.7 | 24.5 | GO:0008090 | retrograde axonal transport(GO:0008090) |
| 2.7 | 8.1 | GO:0006421 | asparaginyl-tRNA aminoacylation(GO:0006421) |
| 2.7 | 10.7 | GO:0007525 | somatic muscle development(GO:0007525) |
| 2.6 | 15.7 | GO:0003350 | pulmonary myocardium development(GO:0003350) |
| 2.6 | 2.6 | GO:0007089 | traversing start control point of mitotic cell cycle(GO:0007089) |
| 2.6 | 12.9 | GO:0070778 | L-aspartate transport(GO:0070778) L-aspartate transmembrane transport(GO:0089712) |
| 2.6 | 7.7 | GO:0008355 | olfactory learning(GO:0008355) |
| 2.6 | 10.3 | GO:0045872 | positive regulation of rhodopsin gene expression(GO:0045872) |
| 2.6 | 20.4 | GO:0098734 | macromolecule depalmitoylation(GO:0098734) |
| 2.5 | 17.8 | GO:0002175 | protein localization to paranode region of axon(GO:0002175) |
| 2.5 | 5.1 | GO:0007231 | osmosensory signaling pathway(GO:0007231) |
| 2.5 | 7.5 | GO:2000301 | negative regulation of synaptic vesicle exocytosis(GO:2000301) |
| 2.5 | 7.5 | GO:1904647 | response to rotenone(GO:1904647) |
| 2.5 | 12.4 | GO:0098728 | germ-line stem cell division(GO:0042078) male germ-line stem cell asymmetric division(GO:0048133) germline stem cell asymmetric division(GO:0098728) |
| 2.5 | 14.8 | GO:1902847 | macrophage proliferation(GO:0061517) microglial cell proliferation(GO:0061518) regulation of neuronal signal transduction(GO:1902847) positive regulation of neurofibrillary tangle assembly(GO:1902998) |
| 2.4 | 4.8 | GO:0045214 | sarcomere organization(GO:0045214) |
| 2.4 | 21.3 | GO:0051918 | negative regulation of fibrinolysis(GO:0051918) |
| 2.3 | 2.3 | GO:0035910 | ascending aorta development(GO:0035905) ascending aorta morphogenesis(GO:0035910) |
| 2.3 | 7.0 | GO:0097156 | fasciculation of motor neuron axon(GO:0097156) |
| 2.3 | 13.8 | GO:1903385 | regulation of homophilic cell adhesion(GO:1903385) |
| 2.3 | 2.3 | GO:0002514 | B cell tolerance induction(GO:0002514) regulation of B cell tolerance induction(GO:0002661) positive regulation of B cell tolerance induction(GO:0002663) |
| 2.2 | 8.9 | GO:1903644 | regulation of chaperone-mediated protein folding(GO:1903644) |
| 2.2 | 26.4 | GO:2001224 | positive regulation of neuron migration(GO:2001224) |
| 2.2 | 6.6 | GO:1901877 | regulation of calcium ion binding(GO:1901876) negative regulation of calcium ion binding(GO:1901877) |
| 2.2 | 10.9 | GO:0003430 | growth plate cartilage chondrocyte growth(GO:0003430) growth plate cartilage chondrocyte development(GO:0003431) Harderian gland development(GO:0070384) |
| 2.1 | 12.8 | GO:0098707 | ferrous iron import into cell(GO:0097460) ferrous iron import across plasma membrane(GO:0098707) |
| 2.1 | 8.5 | GO:0009822 | alkaloid catabolic process(GO:0009822) |
| 2.1 | 10.4 | GO:0099538 | synaptic signaling via neuropeptide(GO:0099538) trans-synaptic signaling by neuropeptide(GO:0099540) trans-synaptic signaling by neuropeptide, modulating synaptic transmission(GO:0099551) |
| 2.1 | 6.2 | GO:1902938 | regulation of intracellular calcium activated chloride channel activity(GO:1902938) |
| 2.1 | 12.5 | GO:0010897 | negative regulation of triglyceride catabolic process(GO:0010897) secretory granule localization(GO:0032252) |
| 2.1 | 4.1 | GO:1902263 | apoptotic process involved in embryonic digit morphogenesis(GO:1902263) |
| 2.1 | 43.1 | GO:0006957 | complement activation, alternative pathway(GO:0006957) |
| 2.0 | 8.1 | GO:0036023 | limb joint morphogenesis(GO:0036022) embryonic skeletal limb joint morphogenesis(GO:0036023) |
| 2.0 | 35.9 | GO:0097151 | positive regulation of inhibitory postsynaptic potential(GO:0097151) modulation of inhibitory postsynaptic potential(GO:0098828) |
| 2.0 | 9.8 | GO:0071918 | urea transmembrane transport(GO:0071918) |
| 2.0 | 19.7 | GO:0032287 | peripheral nervous system myelin maintenance(GO:0032287) |
| 2.0 | 5.9 | GO:2000393 | negative regulation of lamellipodium morphogenesis(GO:2000393) |
| 2.0 | 7.8 | GO:0018352 | protein-pyridoxal-5-phosphate linkage(GO:0018352) |
| 1.9 | 7.7 | GO:0018032 | peptide amidation(GO:0001519) protein amidation(GO:0018032) peptide modification(GO:0031179) |
| 1.9 | 13.4 | GO:2000124 | regulation of endocannabinoid signaling pathway(GO:2000124) |
| 1.9 | 5.6 | GO:0019442 | tryptophan catabolic process to acetyl-CoA(GO:0019442) |
| 1.9 | 5.6 | GO:1900169 | regulation of glucocorticoid mediated signaling pathway(GO:1900169) |
| 1.8 | 5.5 | GO:0072092 | ureteric bud invasion(GO:0072092) |
| 1.8 | 1.8 | GO:0033059 | cellular pigmentation(GO:0033059) |
| 1.8 | 7.2 | GO:0050758 | thymidylate synthase biosynthetic process(GO:0050757) regulation of thymidylate synthase biosynthetic process(GO:0050758) |
| 1.8 | 3.5 | GO:0010749 | regulation of nitric oxide mediated signal transduction(GO:0010749) |
| 1.7 | 1.7 | GO:0015942 | formate metabolic process(GO:0015942) |
| 1.7 | 34.7 | GO:0006450 | regulation of translational fidelity(GO:0006450) |
| 1.7 | 5.2 | GO:0006001 | fructose catabolic process(GO:0006001) fructose catabolic process to hydroxyacetone phosphate and glyceraldehyde-3-phosphate(GO:0061624) |
| 1.7 | 6.9 | GO:0003174 | mitral valve development(GO:0003174) mitral valve morphogenesis(GO:0003183) |
| 1.7 | 6.9 | GO:0042377 | menaquinone catabolic process(GO:0042361) vitamin K catabolic process(GO:0042377) |
| 1.7 | 3.4 | GO:0060298 | positive regulation of sarcomere organization(GO:0060298) |
| 1.7 | 8.3 | GO:2001034 | positive regulation of double-strand break repair via nonhomologous end joining(GO:2001034) |
| 1.7 | 6.6 | GO:0097325 | melanocyte proliferation(GO:0097325) |
| 1.6 | 4.9 | GO:0060940 | epithelial to mesenchymal transition involved in cardiac fibroblast development(GO:0060940) |
| 1.6 | 4.9 | GO:0000966 | endonucleolytic cleavage to generate mature 5'-end of SSU-rRNA from (SSU-rRNA, 5.8S rRNA, LSU-rRNA)(GO:0000472) RNA 5'-end processing(GO:0000966) rRNA 5'-end processing(GO:0000967) ncRNA 5'-end processing(GO:0034471) |
| 1.6 | 8.1 | GO:0035947 | regulation of gluconeogenesis by regulation of transcription from RNA polymerase II promoter(GO:0035947) |
| 1.6 | 11.3 | GO:0042126 | nitrate metabolic process(GO:0042126) |
| 1.6 | 12.9 | GO:0070995 | NADPH oxidation(GO:0070995) |
| 1.6 | 11.1 | GO:0070777 | D-aspartate transport(GO:0070777) D-aspartate import(GO:0070779) |
| 1.6 | 4.7 | GO:0006711 | estrogen catabolic process(GO:0006711) |
| 1.6 | 3.1 | GO:0001970 | positive regulation of activation of membrane attack complex(GO:0001970) |
| 1.5 | 18.6 | GO:0000463 | maturation of LSU-rRNA from tricistronic rRNA transcript (SSU-rRNA, 5.8S rRNA, LSU-rRNA)(GO:0000463) |
| 1.5 | 23.2 | GO:0034638 | phosphatidylcholine catabolic process(GO:0034638) |
| 1.5 | 41.6 | GO:0098743 | cell aggregation(GO:0098743) |
| 1.5 | 13.7 | GO:0090091 | positive regulation of extracellular matrix disassembly(GO:0090091) |
| 1.5 | 4.5 | GO:0070940 | dephosphorylation of RNA polymerase II C-terminal domain(GO:0070940) |
| 1.5 | 4.5 | GO:0019417 | sulfur oxidation(GO:0019417) |
| 1.5 | 4.5 | GO:0060915 | fibroblast growth factor receptor signaling pathway involved in negative regulation of apoptotic process in bone marrow(GO:0035602) fibroblast growth factor receptor signaling pathway involved in hemopoiesis(GO:0035603) fibroblast growth factor receptor signaling pathway involved in positive regulation of cell proliferation in bone marrow(GO:0035604) fibroblast growth factor receptor signaling pathway involved in mammary gland specification(GO:0060595) mammary gland bud formation(GO:0060615) branch elongation involved in salivary gland morphogenesis(GO:0060667) mesenchymal cell differentiation involved in lung development(GO:0060915) |
| 1.5 | 1.5 | GO:0061365 | positive regulation of triglyceride lipase activity(GO:0061365) |
| 1.5 | 4.4 | GO:1903487 | regulation of lactation(GO:1903487) |
| 1.5 | 2.9 | GO:0006883 | cellular sodium ion homeostasis(GO:0006883) |
| 1.5 | 13.2 | GO:0006552 | leucine catabolic process(GO:0006552) |
| 1.5 | 4.4 | GO:0000480 | endonucleolytic cleavage in 5'-ETS of tricistronic rRNA transcript (SSU-rRNA, 5.8S rRNA, LSU-rRNA)(GO:0000480) |
| 1.5 | 29.2 | GO:0003215 | cardiac right ventricle morphogenesis(GO:0003215) |
| 1.5 | 11.7 | GO:0015693 | magnesium ion transport(GO:0015693) |
| 1.5 | 2.9 | GO:0010903 | negative regulation of very-low-density lipoprotein particle remodeling(GO:0010903) |
| 1.5 | 18.9 | GO:0048842 | positive regulation of axon extension involved in axon guidance(GO:0048842) |
| 1.4 | 8.7 | GO:0052422 | modulation by symbiont of host molecular function(GO:0052055) modulation of catalytic activity in other organism involved in symbiotic interaction(GO:0052203) modulation by host of symbiont catalytic activity(GO:0052422) |
| 1.4 | 21.6 | GO:0097264 | self proteolysis(GO:0097264) |
| 1.4 | 2.9 | GO:0015722 | canalicular bile acid transport(GO:0015722) |
| 1.4 | 4.3 | GO:0046440 | L-lysine catabolic process to acetyl-CoA(GO:0019474) L-lysine catabolic process(GO:0019477) L-lysine metabolic process(GO:0046440) |
| 1.4 | 5.5 | GO:0048698 | negative regulation of collateral sprouting in absence of injury(GO:0048698) |
| 1.3 | 18.9 | GO:0071688 | striated muscle myosin thick filament assembly(GO:0071688) |
| 1.3 | 6.7 | GO:0033133 | positive regulation of glucokinase activity(GO:0033133) positive regulation of hexokinase activity(GO:1903301) |
| 1.3 | 5.4 | GO:0035720 | intraciliary anterograde transport(GO:0035720) |
| 1.3 | 13.2 | GO:0045329 | carnitine biosynthetic process(GO:0045329) |
| 1.3 | 5.3 | GO:0044240 | multicellular organism lipid catabolic process(GO:0044240) |
| 1.3 | 7.8 | GO:1902514 | regulation of calcium ion transmembrane transport via high voltage-gated calcium channel(GO:1902514) |
| 1.3 | 3.9 | GO:0060364 | frontal suture morphogenesis(GO:0060364) |
| 1.3 | 20.6 | GO:0098719 | sodium ion import across plasma membrane(GO:0098719) sodium ion import into cell(GO:1990118) |
| 1.3 | 5.1 | GO:0071896 | protein localization to adherens junction(GO:0071896) |
| 1.3 | 5.1 | GO:0010650 | positive regulation of cell communication by electrical coupling(GO:0010650) maintenance of protein location in membrane(GO:0072658) maintenance of protein location in plasma membrane(GO:0072660) positive regulation of membrane depolarization during cardiac muscle cell action potential(GO:1900827) |
| 1.3 | 8.8 | GO:0033353 | S-adenosylmethionine cycle(GO:0033353) |
| 1.2 | 11.2 | GO:0016191 | synaptic vesicle uncoating(GO:0016191) |
| 1.2 | 3.7 | GO:0032474 | otolith morphogenesis(GO:0032474) |
| 1.2 | 4.9 | GO:0045763 | negative regulation of cellular amino acid metabolic process(GO:0045763) |
| 1.2 | 7.2 | GO:0018095 | protein polyglutamylation(GO:0018095) |
| 1.2 | 3.6 | GO:0061534 | gamma-aminobutyric acid secretion, neurotransmission(GO:0061534) |
| 1.2 | 13.1 | GO:0045919 | positive regulation of cytolysis(GO:0045919) |
| 1.2 | 2.4 | GO:0071431 | tRNA export from nucleus(GO:0006409) tRNA-containing ribonucleoprotein complex export from nucleus(GO:0071431) |
| 1.2 | 3.5 | GO:0060244 | negative regulation of cell proliferation involved in contact inhibition(GO:0060244) |
| 1.2 | 4.7 | GO:0030010 | establishment of cell polarity(GO:0030010) |
| 1.2 | 8.2 | GO:0035799 | ureter maturation(GO:0035799) |
| 1.2 | 3.5 | GO:0070781 | response to biotin(GO:0070781) |
| 1.2 | 5.8 | GO:0021590 | cerebellum maturation(GO:0021590) cerebellar cortex maturation(GO:0021699) |
| 1.2 | 5.8 | GO:2000809 | positive regulation of synaptic vesicle clustering(GO:2000809) |
| 1.2 | 1.2 | GO:0002074 | extraocular skeletal muscle development(GO:0002074) |
| 1.2 | 9.3 | GO:0006682 | galactosylceramide biosynthetic process(GO:0006682) galactolipid biosynthetic process(GO:0019375) |
| 1.2 | 1.2 | GO:0034374 | low-density lipoprotein particle remodeling(GO:0034374) |
| 1.2 | 4.6 | GO:0045085 | negative regulation of interleukin-2 biosynthetic process(GO:0045085) |
| 1.1 | 11.4 | GO:0045995 | regulation of embryonic development(GO:0045995) |
| 1.1 | 7.7 | GO:0034465 | response to carbon monoxide(GO:0034465) |
| 1.1 | 2.2 | GO:0061312 | BMP signaling pathway involved in heart development(GO:0061312) |
| 1.1 | 4.3 | GO:0002933 | lipid hydroxylation(GO:0002933) |
| 1.1 | 5.4 | GO:0036102 | leukotriene catabolic process(GO:0036100) leukotriene B4 catabolic process(GO:0036101) leukotriene B4 metabolic process(GO:0036102) icosanoid catabolic process(GO:1901523) fatty acid derivative catabolic process(GO:1901569) |
| 1.1 | 5.4 | GO:0003199 | endocardial cushion to mesenchymal transition involved in heart valve formation(GO:0003199) |
| 1.1 | 4.3 | GO:0006391 | transcription initiation from mitochondrial promoter(GO:0006391) |
| 1.1 | 11.8 | GO:0008627 | intrinsic apoptotic signaling pathway in response to osmotic stress(GO:0008627) |
| 1.1 | 7.5 | GO:0060294 | cilium movement involved in cell motility(GO:0060294) |
| 1.1 | 5.4 | GO:0001714 | endodermal cell fate specification(GO:0001714) |
| 1.1 | 1.1 | GO:0060300 | regulation of cytokine activity(GO:0060300) |
| 1.1 | 19.2 | GO:0019373 | epoxygenase P450 pathway(GO:0019373) |
| 1.0 | 4.2 | GO:0008063 | Toll signaling pathway(GO:0008063) |
| 1.0 | 3.1 | GO:0071934 | thiamine transport(GO:0015888) thiamine transmembrane transport(GO:0071934) |
| 1.0 | 6.2 | GO:0038172 | interleukin-33-mediated signaling pathway(GO:0038172) |
| 1.0 | 4.1 | GO:2000660 | negative regulation of interleukin-1-mediated signaling pathway(GO:2000660) |
| 1.0 | 9.2 | GO:0050703 | interleukin-1 alpha secretion(GO:0050703) |
| 1.0 | 3.1 | GO:0051725 | protein de-ADP-ribosylation(GO:0051725) |
| 1.0 | 7.1 | GO:0000290 | deadenylation-dependent decapping of nuclear-transcribed mRNA(GO:0000290) |
| 1.0 | 10.2 | GO:0032060 | bleb assembly(GO:0032060) |
| 1.0 | 2.0 | GO:0042938 | dipeptide transport(GO:0042938) |
| 1.0 | 10.1 | GO:0006768 | biotin metabolic process(GO:0006768) |
| 1.0 | 149.7 | GO:0007156 | homophilic cell adhesion via plasma membrane adhesion molecules(GO:0007156) |
| 1.0 | 3.0 | GO:1902161 | positive regulation of cyclic nucleotide-gated ion channel activity(GO:1902161) |
| 1.0 | 45.7 | GO:0043268 | positive regulation of potassium ion transport(GO:0043268) |
| 1.0 | 4.0 | GO:0046013 | T cell homeostatic proliferation(GO:0001777) regulation of T cell homeostatic proliferation(GO:0046013) |
| 1.0 | 10.9 | GO:0009414 | response to water deprivation(GO:0009414) |
| 1.0 | 3.9 | GO:0006627 | protein processing involved in protein targeting to mitochondrion(GO:0006627) |
| 1.0 | 8.8 | GO:0019732 | antifungal humoral response(GO:0019732) |
| 1.0 | 7.8 | GO:0036066 | protein O-linked fucosylation(GO:0036066) |
| 1.0 | 3.9 | GO:0035021 | negative regulation of Rac protein signal transduction(GO:0035021) |
| 1.0 | 7.8 | GO:1904262 | negative regulation of TORC1 signaling(GO:1904262) |
| 1.0 | 10.7 | GO:0001829 | trophectodermal cell differentiation(GO:0001829) |
| 1.0 | 15.5 | GO:2000251 | positive regulation of actin cytoskeleton reorganization(GO:2000251) |
| 1.0 | 4.8 | GO:0033088 | negative regulation of immature T cell proliferation in thymus(GO:0033088) |
| 0.9 | 1.9 | GO:1990535 | neuron projection maintenance(GO:1990535) |
| 0.9 | 2.8 | GO:0072709 | cellular response to sorbitol(GO:0072709) |
| 0.9 | 2.8 | GO:0060214 | endocardium formation(GO:0060214) |
| 0.9 | 2.8 | GO:0060535 | trachea cartilage morphogenesis(GO:0060535) |
| 0.9 | 8.4 | GO:1900028 | negative regulation of ruffle assembly(GO:1900028) |
| 0.9 | 3.7 | GO:0010735 | positive regulation of transcription via serum response element binding(GO:0010735) |
| 0.9 | 3.7 | GO:0097368 | establishment of Sertoli cell barrier(GO:0097368) |
| 0.9 | 2.8 | GO:0043983 | histone H4-K12 acetylation(GO:0043983) |
| 0.9 | 6.4 | GO:0021740 | trigeminal sensory nucleus development(GO:0021730) principal sensory nucleus of trigeminal nerve development(GO:0021740) negative regulation of epithelial cell proliferation involved in lung morphogenesis(GO:2000795) |
| 0.9 | 2.7 | GO:0032914 | positive regulation of transforming growth factor beta1 production(GO:0032914) |
| 0.9 | 4.5 | GO:0010966 | regulation of phosphate transport(GO:0010966) |
| 0.9 | 3.6 | GO:0090403 | oxidative stress-induced premature senescence(GO:0090403) |
| 0.9 | 3.6 | GO:1902172 | keratinocyte apoptotic process(GO:0097283) regulation of keratinocyte apoptotic process(GO:1902172) |
| 0.9 | 2.7 | GO:2001015 | negative regulation of skeletal muscle cell differentiation(GO:2001015) |
| 0.9 | 10.7 | GO:0035372 | protein localization to microtubule(GO:0035372) |
| 0.9 | 24.0 | GO:0034204 | lipid translocation(GO:0034204) phospholipid translocation(GO:0045332) |
| 0.9 | 6.2 | GO:0002318 | myeloid progenitor cell differentiation(GO:0002318) |
| 0.9 | 3.5 | GO:0003419 | growth plate cartilage chondrocyte proliferation(GO:0003419) |
| 0.9 | 9.6 | GO:0097094 | craniofacial suture morphogenesis(GO:0097094) |
| 0.9 | 3.5 | GO:1900738 | psychomotor behavior(GO:0036343) positive regulation of phospholipase C-activating G-protein coupled receptor signaling pathway(GO:1900738) |
| 0.9 | 28.7 | GO:0032755 | positive regulation of interleukin-6 production(GO:0032755) |
| 0.9 | 5.2 | GO:0051597 | response to methylmercury(GO:0051597) |
| 0.9 | 6.1 | GO:0034551 | respiratory chain complex III assembly(GO:0017062) mitochondrial respiratory chain complex III assembly(GO:0034551) mitochondrial respiratory chain complex III biogenesis(GO:0097033) |
| 0.9 | 12.1 | GO:0021513 | spinal cord dorsal/ventral patterning(GO:0021513) |
| 0.9 | 2.6 | GO:0061053 | somite development(GO:0061053) |
| 0.9 | 3.4 | GO:0070131 | positive regulation of mitochondrial translation(GO:0070131) |
| 0.9 | 9.4 | GO:0015825 | L-serine transport(GO:0015825) |
| 0.9 | 6.0 | GO:0032534 | regulation of microvillus assembly(GO:0032534) |
| 0.8 | 13.5 | GO:0050995 | negative regulation of lipid catabolic process(GO:0050995) |
| 0.8 | 2.5 | GO:0034201 | response to oleic acid(GO:0034201) |
| 0.8 | 4.2 | GO:0060353 | regulation of cell adhesion molecule production(GO:0060353) |
| 0.8 | 5.0 | GO:0061302 | smooth muscle cell-matrix adhesion(GO:0061302) |
| 0.8 | 4.1 | GO:0009624 | response to nematode(GO:0009624) |
| 0.8 | 8.1 | GO:0051967 | negative regulation of synaptic transmission, glutamatergic(GO:0051967) |
| 0.8 | 3.2 | GO:2000253 | positive regulation of feeding behavior(GO:2000253) |
| 0.8 | 4.0 | GO:0050968 | thermoception(GO:0050955) detection of chemical stimulus involved in sensory perception of pain(GO:0050968) |
| 0.8 | 8.8 | GO:0003417 | growth plate cartilage development(GO:0003417) |
| 0.8 | 7.9 | GO:0006685 | sphingomyelin catabolic process(GO:0006685) |
| 0.8 | 4.7 | GO:0045964 | positive regulation of catecholamine metabolic process(GO:0045915) positive regulation of dopamine metabolic process(GO:0045964) |
| 0.8 | 1.6 | GO:0060018 | astrocyte fate commitment(GO:0060018) |
| 0.8 | 4.7 | GO:0038044 | transforming growth factor-beta secretion(GO:0038044) |
| 0.8 | 2.3 | GO:0044314 | protein K27-linked ubiquitination(GO:0044314) |
| 0.8 | 5.4 | GO:0098915 | membrane repolarization during ventricular cardiac muscle cell action potential(GO:0098915) |
| 0.8 | 6.9 | GO:0043152 | induction of bacterial agglutination(GO:0043152) |
| 0.8 | 19.8 | GO:0061049 | physiological muscle hypertrophy(GO:0003298) physiological cardiac muscle hypertrophy(GO:0003301) cell growth involved in cardiac muscle cell development(GO:0061049) |
| 0.8 | 9.1 | GO:1903358 | regulation of Golgi organization(GO:1903358) |
| 0.8 | 7.5 | GO:0097034 | mitochondrial respiratory chain complex IV assembly(GO:0033617) mitochondrial respiratory chain complex IV biogenesis(GO:0097034) |
| 0.8 | 3.0 | GO:0070317 | negative regulation of G0 to G1 transition(GO:0070317) |
| 0.7 | 9.7 | GO:0061339 | establishment of monopolar cell polarity(GO:0061162) establishment or maintenance of monopolar cell polarity(GO:0061339) |
| 0.7 | 2.2 | GO:0042270 | protection from natural killer cell mediated cytotoxicity(GO:0042270) |
| 0.7 | 4.4 | GO:1903546 | protein localization to photoreceptor outer segment(GO:1903546) |
| 0.7 | 8.0 | GO:0071394 | cellular response to testosterone stimulus(GO:0071394) |
| 0.7 | 5.1 | GO:0051414 | response to cortisol(GO:0051414) |
| 0.7 | 5.8 | GO:2000427 | positive regulation of apoptotic cell clearance(GO:2000427) |
| 0.7 | 50.2 | GO:0042472 | inner ear morphogenesis(GO:0042472) |
| 0.7 | 1.4 | GO:1900115 | extracellular regulation of signal transduction(GO:1900115) extracellular negative regulation of signal transduction(GO:1900116) |
| 0.7 | 5.0 | GO:0070166 | enamel mineralization(GO:0070166) |
| 0.7 | 2.1 | GO:1990414 | replication-born double-strand break repair via sister chromatid exchange(GO:1990414) |
| 0.7 | 7.7 | GO:0015871 | choline transport(GO:0015871) |
| 0.7 | 2.1 | GO:0036071 | N-glycan fucosylation(GO:0036071) |
| 0.7 | 8.3 | GO:0008272 | sulfate transport(GO:0008272) |
| 0.7 | 4.8 | GO:0007598 | blood coagulation, extrinsic pathway(GO:0007598) |
| 0.7 | 6.9 | GO:0007413 | axonal fasciculation(GO:0007413) |
| 0.7 | 17.8 | GO:0097503 | sialylation(GO:0097503) |
| 0.7 | 5.5 | GO:0032696 | negative regulation of interleukin-13 production(GO:0032696) negative regulation of interleukin-4 production(GO:0032713) negative regulation of interleukin-5 production(GO:0032714) |
| 0.7 | 32.0 | GO:0015701 | bicarbonate transport(GO:0015701) |
| 0.7 | 2.7 | GO:0072180 | mesonephric duct morphogenesis(GO:0072180) |
| 0.7 | 6.8 | GO:0048665 | neuron fate specification(GO:0048665) |
| 0.7 | 2.0 | GO:0071030 | nuclear mRNA surveillance of spliceosomal pre-mRNA splicing(GO:0071030) nuclear retention of unspliced pre-mRNA at the site of transcription(GO:0071048) |
| 0.7 | 2.0 | GO:0005988 | lactose metabolic process(GO:0005988) lactose biosynthetic process(GO:0005989) dehydroascorbic acid transport(GO:0070837) |
| 0.7 | 0.7 | GO:0043922 | negative regulation by host of viral transcription(GO:0043922) |
| 0.7 | 3.3 | GO:2000382 | positive regulation of mesoderm development(GO:2000382) |
| 0.7 | 1.3 | GO:0021986 | epithalamus development(GO:0021538) habenula development(GO:0021986) |
| 0.7 | 3.3 | GO:0010793 | regulation of mRNA export from nucleus(GO:0010793) |
| 0.6 | 13.0 | GO:0045947 | negative regulation of translational initiation(GO:0045947) |
| 0.6 | 3.2 | GO:0046689 | response to mercury ion(GO:0046689) |
| 0.6 | 1.9 | GO:0036079 | GDP-fucose transport(GO:0015783) purine nucleotide-sugar transport(GO:0036079) |
| 0.6 | 2.6 | GO:0038155 | interleukin-23-mediated signaling pathway(GO:0038155) |
| 0.6 | 17.9 | GO:2000811 | negative regulation of anoikis(GO:2000811) |
| 0.6 | 1.9 | GO:0032808 | lacrimal gland development(GO:0032808) |
| 0.6 | 2.5 | GO:0051136 | regulation of NK T cell differentiation(GO:0051136) |
| 0.6 | 3.1 | GO:0032571 | response to vitamin K(GO:0032571) |
| 0.6 | 1.9 | GO:0042268 | regulation of cytolysis(GO:0042268) |
| 0.6 | 3.7 | GO:1902035 | positive regulation of hematopoietic stem cell proliferation(GO:1902035) |
| 0.6 | 3.7 | GO:1903817 | negative regulation of delayed rectifier potassium channel activity(GO:1902260) negative regulation of voltage-gated potassium channel activity(GO:1903817) |
| 0.6 | 5.5 | GO:0045078 | positive regulation of interferon-gamma biosynthetic process(GO:0045078) |
| 0.6 | 2.4 | GO:0010816 | substance P catabolic process(GO:0010814) calcitonin catabolic process(GO:0010816) endothelin maturation(GO:0034959) |
| 0.6 | 0.6 | GO:0042264 | peptidyl-aspartic acid hydroxylation(GO:0042264) |
| 0.6 | 1.8 | GO:0051902 | negative regulation of mitochondrial depolarization(GO:0051902) negative regulation of membrane depolarization(GO:1904180) |
| 0.6 | 24.6 | GO:0007214 | gamma-aminobutyric acid signaling pathway(GO:0007214) |
| 0.6 | 1.7 | GO:0010880 | regulation of release of sequestered calcium ion into cytosol by sarcoplasmic reticulum(GO:0010880) |
| 0.6 | 4.6 | GO:0035871 | protein K11-linked deubiquitination(GO:0035871) |
| 0.6 | 1.7 | GO:0019401 | glycerol biosynthetic process(GO:0006114) alditol biosynthetic process(GO:0019401) |
| 0.6 | 1.1 | GO:0046618 | drug export(GO:0046618) |
| 0.6 | 2.8 | GO:0035234 | connective tissue replacement involved in inflammatory response wound healing(GO:0002248) ectopic germ cell programmed cell death(GO:0035234) |
| 0.6 | 10.6 | GO:0070168 | negative regulation of biomineral tissue development(GO:0070168) |
| 0.6 | 1.7 | GO:0002934 | desmosome organization(GO:0002934) |
| 0.6 | 3.3 | GO:0090435 | protein localization to nuclear envelope(GO:0090435) |
| 0.6 | 2.2 | GO:0046485 | ether lipid metabolic process(GO:0046485) |
| 0.6 | 1.7 | GO:0043324 | eye pigment biosynthetic process(GO:0006726) eye pigment metabolic process(GO:0042441) pigment metabolic process involved in developmental pigmentation(GO:0043324) pigment metabolic process involved in pigmentation(GO:0043474) |
| 0.6 | 12.7 | GO:0003334 | keratinocyte development(GO:0003334) |
| 0.6 | 2.8 | GO:0001880 | Mullerian duct regression(GO:0001880) |
| 0.6 | 4.4 | GO:0043001 | Golgi to plasma membrane protein transport(GO:0043001) |
| 0.5 | 1.6 | GO:0034136 | negative regulation of toll-like receptor 2 signaling pathway(GO:0034136) |
| 0.5 | 4.9 | GO:2001205 | negative regulation of osteoclast development(GO:2001205) |
| 0.5 | 2.7 | GO:0019722 | calcium-mediated signaling(GO:0019722) |
| 0.5 | 11.8 | GO:0035635 | entry of bacterium into host cell(GO:0035635) |
| 0.5 | 3.2 | GO:0051121 | hepoxilin metabolic process(GO:0051121) hepoxilin biosynthetic process(GO:0051122) |
| 0.5 | 1.1 | GO:0060686 | regulation of prostatic bud formation(GO:0060685) negative regulation of prostatic bud formation(GO:0060686) |
| 0.5 | 1.0 | GO:2000543 | positive regulation of gastrulation(GO:2000543) |
| 0.5 | 2.6 | GO:0032747 | positive regulation of interleukin-23 production(GO:0032747) |
| 0.5 | 6.7 | GO:0048387 | negative regulation of retinoic acid receptor signaling pathway(GO:0048387) |
| 0.5 | 14.9 | GO:0015695 | organic cation transport(GO:0015695) |
| 0.5 | 7.7 | GO:0031115 | negative regulation of microtubule polymerization(GO:0031115) |
| 0.5 | 4.1 | GO:0034983 | peptidyl-lysine deacetylation(GO:0034983) |
| 0.5 | 5.6 | GO:0019800 | peptide cross-linking via chondroitin 4-sulfate glycosaminoglycan(GO:0019800) |
| 0.5 | 6.5 | GO:0061436 | establishment of skin barrier(GO:0061436) |
| 0.5 | 3.0 | GO:1904352 | positive regulation of protein catabolic process in the vacuole(GO:1904352) |
| 0.5 | 5.0 | GO:0007144 | female meiosis I(GO:0007144) |
| 0.5 | 5.0 | GO:0010603 | regulation of cytoplasmic mRNA processing body assembly(GO:0010603) |
| 0.5 | 14.3 | GO:0010107 | potassium ion import(GO:0010107) |
| 0.5 | 16.2 | GO:0022400 | regulation of rhodopsin mediated signaling pathway(GO:0022400) |
| 0.5 | 5.9 | GO:0008038 | neuron recognition(GO:0008038) |
| 0.5 | 2.4 | GO:0042048 | olfactory behavior(GO:0042048) |
| 0.5 | 1.4 | GO:0010025 | wax biosynthetic process(GO:0010025) wax metabolic process(GO:0010166) |
| 0.5 | 10.0 | GO:0036150 | phosphatidylserine acyl-chain remodeling(GO:0036150) |
| 0.5 | 6.1 | GO:0005513 | detection of calcium ion(GO:0005513) |
| 0.5 | 4.7 | GO:0015889 | cobalamin transport(GO:0015889) |
| 0.5 | 16.7 | GO:0016486 | peptide hormone processing(GO:0016486) |
| 0.5 | 7.9 | GO:0018210 | peptidyl-threonine phosphorylation(GO:0018107) peptidyl-threonine modification(GO:0018210) |
| 0.5 | 6.4 | GO:0008045 | motor neuron axon guidance(GO:0008045) |
| 0.5 | 7.7 | GO:0048935 | peripheral nervous system neuron differentiation(GO:0048934) peripheral nervous system neuron development(GO:0048935) |
| 0.5 | 0.9 | GO:0007206 | phospholipase C-activating G-protein coupled glutamate receptor signaling pathway(GO:0007206) |
| 0.4 | 8.1 | GO:0042462 | eye photoreceptor cell development(GO:0042462) |
| 0.4 | 33.5 | GO:1903779 | regulation of cardiac conduction(GO:1903779) |
| 0.4 | 2.2 | GO:0006127 | glycerophosphate shuttle(GO:0006127) |
| 0.4 | 2.2 | GO:0042501 | serine phosphorylation of STAT protein(GO:0042501) |
| 0.4 | 7.5 | GO:0033141 | positive regulation of peptidyl-serine phosphorylation of STAT protein(GO:0033141) |
| 0.4 | 15.3 | GO:1901385 | regulation of voltage-gated calcium channel activity(GO:1901385) |
| 0.4 | 1.7 | GO:0031635 | adenylate cyclase-inhibiting opioid receptor signaling pathway(GO:0031635) negative regulation of Wnt protein secretion(GO:0061358) |
| 0.4 | 44.6 | GO:0021987 | cerebral cortex development(GO:0021987) |
| 0.4 | 0.4 | GO:2000538 | negative regulation of T cell cytokine production(GO:0002725) regulation of B cell chemotaxis(GO:2000537) positive regulation of B cell chemotaxis(GO:2000538) |
| 0.4 | 4.3 | GO:0000183 | chromatin silencing at rDNA(GO:0000183) |
| 0.4 | 12.9 | GO:0072661 | protein targeting to plasma membrane(GO:0072661) |
| 0.4 | 3.0 | GO:0010499 | proteasomal ubiquitin-independent protein catabolic process(GO:0010499) |
| 0.4 | 0.9 | GO:0014016 | neuroblast differentiation(GO:0014016) |
| 0.4 | 1.7 | GO:1904327 | protein localization to cytosolic proteasome complex(GO:1904327) protein localization to cytosolic proteasome complex involved in ERAD pathway(GO:1904379) |
| 0.4 | 4.3 | GO:0046149 | porphyrin-containing compound catabolic process(GO:0006787) tetrapyrrole catabolic process(GO:0033015) heme catabolic process(GO:0042167) pigment catabolic process(GO:0046149) |
| 0.4 | 1.7 | GO:0035426 | extracellular matrix-cell signaling(GO:0035426) |
| 0.4 | 14.4 | GO:1901687 | glutathione derivative metabolic process(GO:1901685) glutathione derivative biosynthetic process(GO:1901687) |
| 0.4 | 3.0 | GO:1902856 | negative regulation of nonmotile primary cilium assembly(GO:1902856) |
| 0.4 | 0.8 | GO:0060054 | positive regulation of epithelial cell proliferation involved in wound healing(GO:0060054) |
| 0.4 | 8.7 | GO:0071168 | protein localization to chromatin(GO:0071168) |
| 0.4 | 2.9 | GO:0048010 | vascular endothelial growth factor receptor signaling pathway(GO:0048010) |
| 0.4 | 1.2 | GO:0034372 | very-low-density lipoprotein particle remodeling(GO:0034372) |
| 0.4 | 20.5 | GO:0050911 | detection of chemical stimulus involved in sensory perception of smell(GO:0050911) |
| 0.4 | 0.4 | GO:0070125 | mitochondrial translational elongation(GO:0070125) |
| 0.4 | 2.4 | GO:0060272 | embryonic skeletal joint morphogenesis(GO:0060272) |
| 0.4 | 3.2 | GO:0017156 | calcium ion regulated exocytosis(GO:0017156) |
| 0.4 | 2.0 | GO:0008343 | adult feeding behavior(GO:0008343) |
| 0.4 | 2.7 | GO:0008218 | bioluminescence(GO:0008218) |
| 0.4 | 1.9 | GO:0042905 | 9-cis-retinoic acid biosynthetic process(GO:0042904) 9-cis-retinoic acid metabolic process(GO:0042905) |
| 0.4 | 3.1 | GO:2000346 | negative regulation of hepatocyte proliferation(GO:2000346) |
| 0.4 | 0.8 | GO:0035726 | common myeloid progenitor cell proliferation(GO:0035726) |
| 0.4 | 0.8 | GO:0070309 | lens fiber cell morphogenesis(GO:0070309) |
| 0.4 | 9.8 | GO:0042994 | cytoplasmic sequestering of transcription factor(GO:0042994) |
| 0.4 | 1.5 | GO:0044026 | DNA hypermethylation(GO:0044026) |
| 0.4 | 1.1 | GO:0033564 | anterior/posterior axon guidance(GO:0033564) |
| 0.4 | 2.2 | GO:0098535 | de novo centriole assembly(GO:0098535) |
| 0.4 | 2.9 | GO:0018214 | peptidyl-glutamic acid carboxylation(GO:0017187) protein carboxylation(GO:0018214) |
| 0.4 | 4.4 | GO:1902221 | L-phenylalanine metabolic process(GO:0006558) L-phenylalanine catabolic process(GO:0006559) erythrose 4-phosphate/phosphoenolpyruvate family amino acid metabolic process(GO:1902221) erythrose 4-phosphate/phosphoenolpyruvate family amino acid catabolic process(GO:1902222) |
| 0.4 | 0.7 | GO:0060447 | bud outgrowth involved in lung branching(GO:0060447) |
| 0.4 | 1.1 | GO:0060729 | intestinal epithelial structure maintenance(GO:0060729) |
| 0.4 | 6.1 | GO:0017144 | drug metabolic process(GO:0017144) |
| 0.4 | 8.2 | GO:0071526 | semaphorin-plexin signaling pathway(GO:0071526) |
| 0.4 | 1.4 | GO:0046351 | sucrose biosynthetic process(GO:0005986) disaccharide biosynthetic process(GO:0046351) |
| 0.4 | 2.1 | GO:0010896 | regulation of triglyceride catabolic process(GO:0010896) positive regulation of triglyceride catabolic process(GO:0010898) |
| 0.4 | 3.5 | GO:0033234 | negative regulation of protein sumoylation(GO:0033234) |
| 0.3 | 5.2 | GO:0051004 | regulation of lipoprotein lipase activity(GO:0051004) |
| 0.3 | 0.3 | GO:1902075 | cellular response to salt(GO:1902075) response to sodium arsenite(GO:1903935) cellular response to sodium arsenite(GO:1903936) |
| 0.3 | 3.8 | GO:0001514 | selenocysteine incorporation(GO:0001514) translational readthrough(GO:0006451) |
| 0.3 | 20.2 | GO:0030282 | bone mineralization(GO:0030282) |
| 0.3 | 1.0 | GO:0072386 | plus-end-directed vesicle transport along microtubule(GO:0072383) plus-end-directed organelle transport along microtubule(GO:0072386) |
| 0.3 | 1.7 | GO:0071107 | response to parathyroid hormone(GO:0071107) |
| 0.3 | 2.7 | GO:0032482 | Rab protein signal transduction(GO:0032482) |
| 0.3 | 3.1 | GO:1900119 | positive regulation of execution phase of apoptosis(GO:1900119) |
| 0.3 | 2.0 | GO:1902412 | regulation of mitotic cytokinesis(GO:1902412) |
| 0.3 | 1.7 | GO:0038161 | prolactin signaling pathway(GO:0038161) |
| 0.3 | 2.0 | GO:0002760 | positive regulation of antimicrobial peptide production(GO:0002225) positive regulation of antimicrobial humoral response(GO:0002760) positive regulation of antibacterial peptide production(GO:0002803) |
| 0.3 | 3.0 | GO:0000395 | mRNA 5'-splice site recognition(GO:0000395) |
| 0.3 | 5.0 | GO:0046688 | response to copper ion(GO:0046688) |
| 0.3 | 7.2 | GO:2001269 | positive regulation of cysteine-type endopeptidase activity involved in apoptotic signaling pathway(GO:2001269) |
| 0.3 | 2.6 | GO:0038065 | collagen-activated tyrosine kinase receptor signaling pathway(GO:0038063) collagen-activated signaling pathway(GO:0038065) |
| 0.3 | 2.9 | GO:0019509 | L-methionine biosynthetic process from methylthioadenosine(GO:0019509) |
| 0.3 | 2.6 | GO:0015747 | urate transport(GO:0015747) |
| 0.3 | 10.6 | GO:0051353 | positive regulation of oxidoreductase activity(GO:0051353) |
| 0.3 | 4.2 | GO:0060046 | regulation of acrosome reaction(GO:0060046) |
| 0.3 | 6.0 | GO:0042417 | dopamine metabolic process(GO:0042417) |
| 0.3 | 1.0 | GO:0090080 | positive regulation of MAPKKK cascade by fibroblast growth factor receptor signaling pathway(GO:0090080) |
| 0.3 | 1.9 | GO:0006707 | cholesterol catabolic process(GO:0006707) sterol catabolic process(GO:0016127) |
| 0.3 | 3.8 | GO:0010457 | centriole-centriole cohesion(GO:0010457) |
| 0.3 | 1.6 | GO:0015842 | aminergic neurotransmitter loading into synaptic vesicle(GO:0015842) |
| 0.3 | 1.9 | GO:1903242 | regulation of cardiac muscle adaptation(GO:0010612) positive regulation of cardiac muscle adaptation(GO:0010615) regulation of cardiac muscle hypertrophy in response to stress(GO:1903242) positive regulation of cardiac muscle hypertrophy in response to stress(GO:1903244) |
| 0.3 | 9.0 | GO:0007205 | protein kinase C-activating G-protein coupled receptor signaling pathway(GO:0007205) |
| 0.3 | 3.4 | GO:0060394 | negative regulation of pathway-restricted SMAD protein phosphorylation(GO:0060394) |
| 0.3 | 4.6 | GO:0002693 | positive regulation of cellular extravasation(GO:0002693) |
| 0.3 | 9.8 | GO:0035235 | ionotropic glutamate receptor signaling pathway(GO:0035235) |
| 0.3 | 22.1 | GO:0042147 | retrograde transport, endosome to Golgi(GO:0042147) |
| 0.3 | 0.9 | GO:0048588 | developmental cell growth(GO:0048588) |
| 0.3 | 6.2 | GO:0007608 | sensory perception of smell(GO:0007608) |
| 0.3 | 6.2 | GO:0015872 | dopamine transport(GO:0015872) |
| 0.3 | 3.8 | GO:0052695 | cellular glucuronidation(GO:0052695) |
| 0.3 | 2.3 | GO:0042711 | maternal behavior(GO:0042711) parental behavior(GO:0060746) |
| 0.3 | 0.9 | GO:0006701 | progesterone biosynthetic process(GO:0006701) |
| 0.3 | 2.6 | GO:0033327 | Leydig cell differentiation(GO:0033327) |
| 0.3 | 1.1 | GO:0035026 | leading edge cell differentiation(GO:0035026) |
| 0.3 | 2.2 | GO:0048312 | intracellular distribution of mitochondria(GO:0048312) |
| 0.3 | 4.2 | GO:0010039 | response to iron ion(GO:0010039) |
| 0.3 | 0.6 | GO:1904479 | negative regulation of intestinal absorption(GO:1904479) |
| 0.3 | 1.7 | GO:0051694 | pointed-end actin filament capping(GO:0051694) |
| 0.3 | 2.5 | GO:0090331 | negative regulation of platelet aggregation(GO:0090331) |
| 0.3 | 2.5 | GO:0007100 | mitotic centrosome separation(GO:0007100) centrosome separation(GO:0051299) |
| 0.3 | 1.3 | GO:0040023 | nuclear migration(GO:0007097) establishment of nucleus localization(GO:0040023) |
| 0.3 | 20.7 | GO:0006890 | retrograde vesicle-mediated transport, Golgi to ER(GO:0006890) |
| 0.3 | 5.6 | GO:0009083 | branched-chain amino acid catabolic process(GO:0009083) |
| 0.3 | 78.0 | GO:0006936 | muscle contraction(GO:0006936) |
| 0.3 | 0.5 | GO:0035095 | behavioral response to nicotine(GO:0035095) |
| 0.3 | 7.2 | GO:0021954 | central nervous system neuron development(GO:0021954) |
| 0.3 | 3.1 | GO:0090036 | regulation of protein kinase C signaling(GO:0090036) |
| 0.3 | 1.0 | GO:0000019 | regulation of mitotic recombination(GO:0000019) |
| 0.3 | 4.6 | GO:0045744 | negative regulation of G-protein coupled receptor protein signaling pathway(GO:0045744) |
| 0.2 | 1.7 | GO:0031284 | positive regulation of guanylate cyclase activity(GO:0031284) |
| 0.2 | 1.7 | GO:0006600 | creatine metabolic process(GO:0006600) |
| 0.2 | 0.5 | GO:0061113 | pancreas morphogenesis(GO:0061113) |
| 0.2 | 1.9 | GO:0070475 | rRNA base methylation(GO:0070475) |
| 0.2 | 1.2 | GO:2000270 | negative regulation of fibroblast apoptotic process(GO:2000270) |
| 0.2 | 1.2 | GO:0032000 | positive regulation of fatty acid beta-oxidation(GO:0032000) |
| 0.2 | 8.3 | GO:0060997 | dendritic spine morphogenesis(GO:0060997) |
| 0.2 | 3.5 | GO:0003351 | epithelial cilium movement(GO:0003351) |
| 0.2 | 5.6 | GO:0033173 | calcineurin-NFAT signaling cascade(GO:0033173) |
| 0.2 | 0.9 | GO:1904781 | positive regulation of protein localization to centrosome(GO:1904781) |
| 0.2 | 5.1 | GO:0046710 | GDP metabolic process(GO:0046710) |
| 0.2 | 3.5 | GO:0016024 | CDP-diacylglycerol biosynthetic process(GO:0016024) |
| 0.2 | 3.7 | GO:0042359 | vitamin D metabolic process(GO:0042359) |
| 0.2 | 0.7 | GO:0098759 | response to interleukin-8(GO:0098758) cellular response to interleukin-8(GO:0098759) |
| 0.2 | 6.6 | GO:0034080 | chromatin remodeling at centromere(GO:0031055) CENP-A containing nucleosome assembly(GO:0034080) CENP-A containing chromatin organization(GO:0061641) |
| 0.2 | 2.5 | GO:0030202 | heparin metabolic process(GO:0030202) heparin biosynthetic process(GO:0030210) |
| 0.2 | 0.4 | GO:1902961 | positive regulation of aspartic-type endopeptidase activity involved in amyloid precursor protein catabolic process(GO:1902961) positive regulation of aspartic-type peptidase activity(GO:1905247) |
| 0.2 | 0.9 | GO:0032754 | positive regulation of interleukin-5 production(GO:0032754) |
| 0.2 | 2.4 | GO:0035563 | positive regulation of chromatin binding(GO:0035563) |
| 0.2 | 4.0 | GO:0035640 | exploration behavior(GO:0035640) |
| 0.2 | 0.9 | GO:0001555 | oocyte growth(GO:0001555) |
| 0.2 | 0.9 | GO:0045425 | regulation of granulocyte macrophage colony-stimulating factor biosynthetic process(GO:0045423) positive regulation of granulocyte macrophage colony-stimulating factor biosynthetic process(GO:0045425) |
| 0.2 | 3.3 | GO:0046320 | regulation of fatty acid oxidation(GO:0046320) |
| 0.2 | 1.9 | GO:0000733 | DNA strand renaturation(GO:0000733) |
| 0.2 | 3.4 | GO:0007340 | acrosome reaction(GO:0007340) |
| 0.2 | 1.7 | GO:0036152 | phosphatidylethanolamine acyl-chain remodeling(GO:0036152) |
| 0.2 | 1.1 | GO:0035810 | positive regulation of urine volume(GO:0035810) |
| 0.2 | 0.4 | GO:0048867 | stem cell fate commitment(GO:0048865) stem cell fate determination(GO:0048867) |
| 0.2 | 0.6 | GO:0016561 | protein import into peroxisome matrix, translocation(GO:0016561) |
| 0.2 | 7.5 | GO:0048384 | retinoic acid receptor signaling pathway(GO:0048384) |
| 0.2 | 2.3 | GO:0044849 | estrous cycle(GO:0044849) |
| 0.2 | 1.6 | GO:1901998 | toxin transport(GO:1901998) |
| 0.2 | 9.8 | GO:0007586 | digestion(GO:0007586) |
| 0.2 | 1.2 | GO:0006537 | glutamate biosynthetic process(GO:0006537) |
| 0.2 | 1.2 | GO:0007039 | protein catabolic process in the vacuole(GO:0007039) |
| 0.2 | 0.4 | GO:0032674 | regulation of interleukin-5 production(GO:0032674) |
| 0.2 | 2.0 | GO:0060081 | membrane hyperpolarization(GO:0060081) |
| 0.2 | 0.4 | GO:0060290 | transdifferentiation(GO:0060290) |
| 0.2 | 7.9 | GO:0007585 | respiratory gaseous exchange(GO:0007585) |
| 0.2 | 9.2 | GO:0007218 | neuropeptide signaling pathway(GO:0007218) |
| 0.2 | 0.4 | GO:0035812 | renal sodium excretion(GO:0035812) regulation of renal sodium excretion(GO:0035813) |
| 0.2 | 4.1 | GO:0007339 | binding of sperm to zona pellucida(GO:0007339) |
| 0.2 | 1.3 | GO:0036344 | platelet formation(GO:0030220) platelet morphogenesis(GO:0036344) |
| 0.2 | 8.8 | GO:0009247 | glycolipid biosynthetic process(GO:0009247) |
| 0.2 | 3.8 | GO:0090200 | positive regulation of release of cytochrome c from mitochondria(GO:0090200) |
| 0.2 | 0.9 | GO:0030047 | actin modification(GO:0030047) |
| 0.2 | 0.9 | GO:2000042 | negative regulation of double-strand break repair via homologous recombination(GO:2000042) |
| 0.2 | 0.5 | GO:0021871 | forebrain regionalization(GO:0021871) |
| 0.2 | 0.8 | GO:0007567 | parturition(GO:0007567) |
| 0.2 | 0.5 | GO:0003105 | negative regulation of glomerular filtration(GO:0003105) filtration diaphragm assembly(GO:0036058) slit diaphragm assembly(GO:0036060) negative regulation of retinal ganglion cell axon guidance(GO:0090260) |
| 0.2 | 0.7 | GO:0038018 | Wnt receptor catabolic process(GO:0038018) |
| 0.2 | 1.8 | GO:0097435 | fibril organization(GO:0097435) |
| 0.2 | 6.8 | GO:0051965 | positive regulation of synapse assembly(GO:0051965) |
| 0.2 | 3.4 | GO:0018146 | keratan sulfate biosynthetic process(GO:0018146) |
| 0.2 | 0.3 | GO:0033364 | mast cell secretory granule organization(GO:0033364) |
| 0.2 | 1.1 | GO:0003096 | renal sodium ion transport(GO:0003096) renal sodium ion absorption(GO:0070294) |
| 0.2 | 3.0 | GO:0030818 | negative regulation of cAMP biosynthetic process(GO:0030818) |
| 0.2 | 0.6 | GO:0090309 | positive regulation of methylation-dependent chromatin silencing(GO:0090309) |
| 0.2 | 1.1 | GO:0043950 | positive regulation of cAMP-mediated signaling(GO:0043950) |
| 0.2 | 0.5 | GO:0090335 | regulation of brown fat cell differentiation(GO:0090335) |
| 0.2 | 0.6 | GO:0034310 | ethanol catabolic process(GO:0006068) primary alcohol catabolic process(GO:0034310) |
| 0.2 | 5.3 | GO:0071260 | cellular response to mechanical stimulus(GO:0071260) |
| 0.2 | 0.9 | GO:0002051 | osteoblast fate commitment(GO:0002051) |
| 0.1 | 1.2 | GO:0045778 | positive regulation of ossification(GO:0045778) |
| 0.1 | 2.7 | GO:0030195 | negative regulation of blood coagulation(GO:0030195) negative regulation of hemostasis(GO:1900047) |
| 0.1 | 0.3 | GO:0051835 | positive regulation of synapse structural plasticity(GO:0051835) |
| 0.1 | 1.5 | GO:0015886 | heme transport(GO:0015886) |
| 0.1 | 1.8 | GO:0033622 | integrin activation(GO:0033622) |
| 0.1 | 1.0 | GO:0030199 | collagen fibril organization(GO:0030199) |
| 0.1 | 2.0 | GO:0045109 | intermediate filament organization(GO:0045109) |
| 0.1 | 0.7 | GO:0010724 | regulation of definitive erythrocyte differentiation(GO:0010724) |
| 0.1 | 2.3 | GO:0045746 | negative regulation of Notch signaling pathway(GO:0045746) |
| 0.1 | 0.4 | GO:0060474 | positive regulation of sperm motility involved in capacitation(GO:0060474) |
| 0.1 | 1.0 | GO:0042723 | thiamine-containing compound metabolic process(GO:0042723) |
| 0.1 | 1.5 | GO:0070286 | axonemal dynein complex assembly(GO:0070286) |
| 0.1 | 2.9 | GO:0043567 | regulation of insulin-like growth factor receptor signaling pathway(GO:0043567) |
| 0.1 | 8.4 | GO:0048706 | embryonic skeletal system development(GO:0048706) |
| 0.1 | 0.5 | GO:0070127 | tRNA aminoacylation for mitochondrial protein translation(GO:0070127) |
| 0.1 | 1.8 | GO:0051895 | negative regulation of focal adhesion assembly(GO:0051895) negative regulation of cell junction assembly(GO:1901889) |
| 0.1 | 1.4 | GO:0016576 | histone dephosphorylation(GO:0016576) |
| 0.1 | 1.3 | GO:0031915 | positive regulation of synaptic plasticity(GO:0031915) |
| 0.1 | 1.5 | GO:0019228 | neuronal action potential(GO:0019228) |
| 0.1 | 0.5 | GO:0060964 | regulation of gene silencing by miRNA(GO:0060964) |
| 0.1 | 11.0 | GO:0006415 | translational termination(GO:0006415) |
| 0.1 | 0.8 | GO:0043691 | reverse cholesterol transport(GO:0043691) |
| 0.1 | 1.0 | GO:0035116 | embryonic hindlimb morphogenesis(GO:0035116) |
| 0.1 | 1.1 | GO:0002523 | leukocyte migration involved in inflammatory response(GO:0002523) |
| 0.1 | 2.6 | GO:0010667 | negative regulation of cardiac muscle cell apoptotic process(GO:0010667) |
| 0.1 | 1.3 | GO:0006108 | malate metabolic process(GO:0006108) |
| 0.1 | 1.5 | GO:0036297 | interstrand cross-link repair(GO:0036297) |
| 0.1 | 4.1 | GO:0016266 | O-glycan processing(GO:0016266) |
| 0.1 | 1.4 | GO:0034497 | protein localization to pre-autophagosomal structure(GO:0034497) |
| 0.1 | 2.5 | GO:0021766 | hippocampus development(GO:0021766) |
| 0.1 | 2.8 | GO:0048025 | negative regulation of mRNA splicing, via spliceosome(GO:0048025) |
| 0.1 | 2.0 | GO:0000717 | nucleotide-excision repair, DNA duplex unwinding(GO:0000717) |
| 0.1 | 1.6 | GO:0006825 | copper ion transport(GO:0006825) |
| 0.1 | 0.9 | GO:2000114 | regulation of establishment of cell polarity(GO:2000114) |
| 0.1 | 2.6 | GO:0048268 | clathrin coat assembly(GO:0048268) |
| 0.1 | 0.7 | GO:2001214 | regulation of vasculogenesis(GO:2001212) positive regulation of vasculogenesis(GO:2001214) |
| 0.1 | 0.6 | GO:2000169 | regulation of peptidyl-cysteine S-nitrosylation(GO:2000169) |
| 0.1 | 0.3 | GO:2000400 | positive regulation of T cell differentiation in thymus(GO:0033089) positive regulation of thymocyte aggregation(GO:2000400) |
| 0.1 | 0.3 | GO:0015860 | purine nucleoside transmembrane transport(GO:0015860) |
| 0.1 | 3.7 | GO:0001895 | retina homeostasis(GO:0001895) |
| 0.1 | 0.9 | GO:0007212 | dopamine receptor signaling pathway(GO:0007212) |
| 0.1 | 2.6 | GO:0000381 | regulation of alternative mRNA splicing, via spliceosome(GO:0000381) |
| 0.1 | 1.5 | GO:0006836 | neurotransmitter transport(GO:0006836) |
| 0.1 | 1.2 | GO:0019372 | lipoxygenase pathway(GO:0019372) |
| 0.1 | 0.6 | GO:0042448 | progesterone metabolic process(GO:0042448) |
| 0.1 | 6.3 | GO:0006805 | xenobiotic metabolic process(GO:0006805) |
| 0.1 | 0.9 | GO:0033539 | fatty acid beta-oxidation using acyl-CoA dehydrogenase(GO:0033539) |
| 0.1 | 1.9 | GO:0097484 | dendrite extension(GO:0097484) |
| 0.1 | 0.4 | GO:0070572 | positive regulation of neuron projection regeneration(GO:0070572) |
| 0.1 | 2.1 | GO:0051693 | actin filament capping(GO:0051693) |
| 0.1 | 0.2 | GO:0044550 | secondary metabolite biosynthetic process(GO:0044550) |
| 0.1 | 0.8 | GO:0045974 | miRNA mediated inhibition of translation(GO:0035278) negative regulation of translation, ncRNA-mediated(GO:0040033) regulation of translation, ncRNA-mediated(GO:0045974) |
| 0.1 | 1.2 | GO:0008211 | glucocorticoid metabolic process(GO:0008211) |
| 0.1 | 2.5 | GO:0042982 | amyloid precursor protein metabolic process(GO:0042982) |
| 0.1 | 1.0 | GO:0007184 | SMAD protein import into nucleus(GO:0007184) |
| 0.1 | 0.2 | GO:0048539 | bone marrow development(GO:0048539) |
| 0.1 | 0.1 | GO:0061394 | regulation of transcription from RNA polymerase II promoter in response to arsenic-containing substance(GO:0061394) |
| 0.1 | 0.3 | GO:0035721 | intraciliary retrograde transport(GO:0035721) |
| 0.1 | 2.5 | GO:0005978 | glycogen biosynthetic process(GO:0005978) glucan biosynthetic process(GO:0009250) |
| 0.1 | 0.4 | GO:0043651 | linoleic acid metabolic process(GO:0043651) |
| 0.1 | 0.5 | GO:0046051 | UTP biosynthetic process(GO:0006228) UTP metabolic process(GO:0046051) |
| 0.1 | 0.5 | GO:0035878 | nail development(GO:0035878) |
| 0.1 | 2.2 | GO:0048678 | response to axon injury(GO:0048678) |
| 0.1 | 0.6 | GO:0001701 | in utero embryonic development(GO:0001701) |
| 0.1 | 1.2 | GO:0006471 | protein ADP-ribosylation(GO:0006471) |
| 0.0 | 0.6 | GO:0006703 | estrogen biosynthetic process(GO:0006703) |
| 0.0 | 0.2 | GO:0019918 | peptidyl-arginine methylation, to symmetrical-dimethyl arginine(GO:0019918) |
| 0.0 | 2.4 | GO:0090502 | RNA phosphodiester bond hydrolysis, endonucleolytic(GO:0090502) |
| 0.0 | 0.9 | GO:0007368 | determination of left/right symmetry(GO:0007368) |
| 0.0 | 0.5 | GO:0007130 | synaptonemal complex assembly(GO:0007130) |
| 0.0 | 0.7 | GO:0031532 | actin cytoskeleton reorganization(GO:0031532) |
| 0.0 | 0.7 | GO:0060976 | coronary vasculature development(GO:0060976) |
| 0.0 | 0.5 | GO:0060292 | long term synaptic depression(GO:0060292) |
| 0.0 | 1.0 | GO:0051646 | mitochondrion localization(GO:0051646) |
| 0.0 | 0.1 | GO:2000048 | negative regulation of cell-cell adhesion mediated by cadherin(GO:2000048) |
| 0.0 | 2.0 | GO:1902476 | chloride transmembrane transport(GO:1902476) |
| 0.0 | 4.1 | GO:0045666 | positive regulation of neuron differentiation(GO:0045666) |
| 0.0 | 0.5 | GO:0000725 | double-strand break repair via homologous recombination(GO:0000724) recombinational repair(GO:0000725) |
| 0.0 | 1.8 | GO:0006094 | gluconeogenesis(GO:0006094) |
| 0.0 | 1.6 | GO:0046849 | bone remodeling(GO:0046849) |
| 0.0 | 0.4 | GO:0045577 | regulation of B cell differentiation(GO:0045577) |
| 0.0 | 0.3 | GO:0036295 | cellular response to increased oxygen levels(GO:0036295) |
| 0.0 | 0.4 | GO:0032330 | regulation of chondrocyte differentiation(GO:0032330) |
| 0.0 | 0.5 | GO:0070935 | 3'-UTR-mediated mRNA stabilization(GO:0070935) |
| 0.0 | 0.6 | GO:0006414 | translational elongation(GO:0006414) |
| 0.0 | 6.9 | GO:0043687 | post-translational protein modification(GO:0043687) |
| 0.0 | 0.1 | GO:0048840 | otolith development(GO:0048840) |
| 0.0 | 0.8 | GO:0034219 | carbohydrate transmembrane transport(GO:0034219) |
| 0.0 | 0.9 | GO:0006904 | vesicle docking involved in exocytosis(GO:0006904) |
| 0.0 | 1.4 | GO:0071804 | cellular potassium ion transport(GO:0071804) potassium ion transmembrane transport(GO:0071805) |
| 0.0 | 0.2 | GO:0046069 | cGMP catabolic process(GO:0046069) |
| 0.0 | 1.0 | GO:0006501 | C-terminal protein lipidation(GO:0006501) |
| 0.0 | 0.1 | GO:0070235 | regulation of activation-induced cell death of T cells(GO:0070235) negative regulation of activation-induced cell death of T cells(GO:0070236) |
| 0.0 | 0.2 | GO:0010801 | negative regulation of peptidyl-threonine phosphorylation(GO:0010801) |
| 0.0 | 0.4 | GO:0018149 | peptide cross-linking(GO:0018149) |
| 0.0 | 0.0 | GO:0048250 | mitochondrial iron ion transport(GO:0048250) |
| 0.0 | 0.8 | GO:0007565 | female pregnancy(GO:0007565) |
| 0.0 | 0.1 | GO:0045793 | positive regulation of cell size(GO:0045793) |
Gene overrepresentation in cellular_component category:
| Log-likelihood per target | Total log-likelihood | Term | Description |
|---|---|---|---|
| 16.5 | 49.6 | GO:0030895 | apolipoprotein B mRNA editing enzyme complex(GO:0030895) |
| 13.9 | 222.7 | GO:0097512 | cardiac myofibril(GO:0097512) |
| 12.2 | 48.9 | GO:0070032 | synaptobrevin 2-SNAP-25-syntaxin-1a-complexin I complex(GO:0070032) |
| 11.8 | 47.3 | GO:0030485 | smooth muscle contractile fiber(GO:0030485) |
| 11.7 | 164.0 | GO:0098647 | collagen type VI trimer(GO:0005589) collagen beaded filament(GO:0098647) |
| 8.6 | 43.2 | GO:0071546 | perinucleolar chromocenter(GO:0010370) pi-body(GO:0071546) |
| 7.3 | 109.0 | GO:0030478 | actin cap(GO:0030478) |
| 6.3 | 31.3 | GO:0060200 | clathrin-sculpted acetylcholine transport vesicle(GO:0060200) clathrin-sculpted acetylcholine transport vesicle membrane(GO:0060201) |
| 6.1 | 24.5 | GO:0031673 | H zone(GO:0031673) |
| 4.5 | 17.9 | GO:0033596 | TSC1-TSC2 complex(GO:0033596) |
| 4.2 | 12.5 | GO:0005944 | phosphatidylinositol 3-kinase complex, class IB(GO:0005944) |
| 3.6 | 29.0 | GO:0044294 | dendritic growth cone(GO:0044294) |
| 3.3 | 10.0 | GO:0031251 | PAN complex(GO:0031251) |
| 3.2 | 3.2 | GO:0036398 | TCR signalosome(GO:0036398) |
| 3.1 | 18.9 | GO:0031232 | extrinsic component of external side of plasma membrane(GO:0031232) |
| 3.0 | 27.0 | GO:0005579 | membrane attack complex(GO:0005579) |
| 2.8 | 8.5 | GO:0016938 | kinesin I complex(GO:0016938) |
| 2.7 | 10.8 | GO:0097454 | Schwann cell microvillus(GO:0097454) |
| 2.5 | 2.5 | GO:0031314 | extrinsic component of mitochondrial inner membrane(GO:0031314) |
| 2.5 | 9.8 | GO:0031838 | haptoglobin-hemoglobin complex(GO:0031838) |
| 2.4 | 28.5 | GO:0005833 | hemoglobin complex(GO:0005833) |
| 2.4 | 42.5 | GO:0031089 | platelet dense granule lumen(GO:0031089) |
| 2.3 | 9.4 | GO:0035838 | growing cell tip(GO:0035838) |
| 2.2 | 26.6 | GO:0032045 | guanyl-nucleotide exchange factor complex(GO:0032045) |
| 2.0 | 2.0 | GO:0090498 | extrinsic component of Golgi membrane(GO:0090498) |
| 2.0 | 5.9 | GO:0044306 | neuron projection terminus(GO:0044306) |
| 1.9 | 5.8 | GO:0019034 | viral replication complex(GO:0019034) |
| 1.9 | 30.2 | GO:0042622 | photoreceptor outer segment membrane(GO:0042622) |
| 1.8 | 18.4 | GO:0033270 | paranode region of axon(GO:0033270) |
| 1.8 | 9.0 | GO:0005945 | 6-phosphofructokinase complex(GO:0005945) |
| 1.7 | 22.6 | GO:0033180 | proton-transporting V-type ATPase, V1 domain(GO:0033180) |
| 1.7 | 34.3 | GO:0071437 | invadopodium(GO:0071437) |
| 1.7 | 32.0 | GO:0043220 | Schmidt-Lanterman incisure(GO:0043220) |
| 1.7 | 36.8 | GO:0032982 | myosin filament(GO:0032982) |
| 1.6 | 4.7 | GO:0034685 | integrin alphav-beta6 complex(GO:0034685) |
| 1.5 | 304.4 | GO:0030426 | growth cone(GO:0030426) |
| 1.4 | 8.5 | GO:0097442 | CA3 pyramidal cell dendrite(GO:0097442) |
| 1.4 | 19.9 | GO:0097227 | sperm annulus(GO:0097227) |
| 1.4 | 6.9 | GO:0098843 | postsynaptic endocytic zone(GO:0098843) |
| 1.3 | 7.7 | GO:0033269 | internode region of axon(GO:0033269) |
| 1.3 | 3.8 | GO:0008282 | ATP-sensitive potassium channel complex(GO:0008282) |
| 1.3 | 5.0 | GO:0071062 | alphav-beta3 integrin-vitronectin complex(GO:0071062) |
| 1.2 | 5.0 | GO:0005712 | chiasma(GO:0005712) |
| 1.2 | 20.5 | GO:0097440 | apical dendrite(GO:0097440) |
| 1.1 | 8.0 | GO:0014701 | junctional sarcoplasmic reticulum membrane(GO:0014701) |
| 1.1 | 8.0 | GO:0014802 | terminal cisterna(GO:0014802) |
| 1.1 | 3.4 | GO:0033011 | perinuclear theca(GO:0033011) cytoskeletal calyx(GO:0033150) |
| 1.1 | 3.3 | GO:0000308 | cytoplasmic cyclin-dependent protein kinase holoenzyme complex(GO:0000308) |
| 1.1 | 11.1 | GO:0016942 | insulin-like growth factor binding protein complex(GO:0016942) growth factor complex(GO:0036454) |
| 1.1 | 13.0 | GO:0098643 | fibrillar collagen trimer(GO:0005583) banded collagen fibril(GO:0098643) |
| 1.1 | 12.9 | GO:0005847 | mRNA cleavage and polyadenylation specificity factor complex(GO:0005847) |
| 1.0 | 6.8 | GO:0001939 | female pronucleus(GO:0001939) |
| 1.0 | 6.7 | GO:0005791 | rough endoplasmic reticulum(GO:0005791) |
| 0.9 | 37.8 | GO:0009925 | basal plasma membrane(GO:0009925) |
| 0.9 | 12.6 | GO:0005916 | fascia adherens(GO:0005916) |
| 0.9 | 5.1 | GO:0097025 | MPP7-DLG1-LIN7 complex(GO:0097025) |
| 0.8 | 4.2 | GO:0005602 | complement component C1 complex(GO:0005602) |
| 0.8 | 10.9 | GO:1990454 | L-type voltage-gated calcium channel complex(GO:1990454) |
| 0.8 | 20.7 | GO:0005581 | collagen trimer(GO:0005581) |
| 0.8 | 20.7 | GO:0045171 | intercellular bridge(GO:0045171) |
| 0.8 | 4.6 | GO:1990130 | Iml1 complex(GO:1990130) |
| 0.8 | 35.8 | GO:0048786 | presynaptic active zone(GO:0048786) |
| 0.8 | 26.4 | GO:1902711 | GABA-A receptor complex(GO:1902711) |
| 0.7 | 2.2 | GO:0034365 | discoidal high-density lipoprotein particle(GO:0034365) |
| 0.7 | 2.2 | GO:0098536 | deuterosome(GO:0098536) |
| 0.7 | 9.6 | GO:0005577 | fibrinogen complex(GO:0005577) |
| 0.7 | 10.5 | GO:0031362 | anchored component of external side of plasma membrane(GO:0031362) |
| 0.7 | 20.2 | GO:0035861 | site of double-strand break(GO:0035861) |
| 0.7 | 2.1 | GO:0032437 | cuticular plate(GO:0032437) |
| 0.7 | 3.4 | GO:0089701 | U2AF(GO:0089701) |
| 0.7 | 2.0 | GO:0071020 | post-spliceosomal complex(GO:0071020) |
| 0.7 | 2.0 | GO:0000438 | core TFIIH complex portion of holo TFIIH complex(GO:0000438) |
| 0.7 | 56.3 | GO:0031093 | platelet alpha granule lumen(GO:0031093) |
| 0.7 | 2.6 | GO:0005952 | cAMP-dependent protein kinase complex(GO:0005952) |
| 0.6 | 2.6 | GO:0043083 | synaptic cleft(GO:0043083) |
| 0.6 | 6.4 | GO:0044300 | cerebellar mossy fiber(GO:0044300) |
| 0.6 | 2.6 | GO:0072536 | interleukin-23 receptor complex(GO:0072536) |
| 0.6 | 2.4 | GO:0031302 | intrinsic component of endosome membrane(GO:0031302) |
| 0.6 | 3.0 | GO:0005594 | collagen type IX trimer(GO:0005594) |
| 0.6 | 15.0 | GO:0008074 | guanylate cyclase complex, soluble(GO:0008074) |
| 0.6 | 3.0 | GO:0031205 | endoplasmic reticulum Sec complex(GO:0031205) |
| 0.6 | 228.1 | GO:0005578 | proteinaceous extracellular matrix(GO:0005578) |
| 0.6 | 2.3 | GO:0005968 | Rab-protein geranylgeranyltransferase complex(GO:0005968) |
| 0.6 | 11.4 | GO:0005890 | sodium:potassium-exchanging ATPase complex(GO:0005890) |
| 0.6 | 2.8 | GO:0005947 | mitochondrial alpha-ketoglutarate dehydrogenase complex(GO:0005947) |
| 0.6 | 5.0 | GO:0042788 | polysomal ribosome(GO:0042788) |
| 0.5 | 7.6 | GO:0036038 | MKS complex(GO:0036038) |
| 0.5 | 5.3 | GO:0042589 | zymogen granule membrane(GO:0042589) |
| 0.5 | 3.7 | GO:1990635 | proximal dendrite(GO:1990635) |
| 0.5 | 2.1 | GO:0032937 | SREBP-SCAP-Insig complex(GO:0032937) |
| 0.5 | 10.0 | GO:0005862 | muscle thin filament tropomyosin(GO:0005862) |
| 0.5 | 14.6 | GO:0035327 | transcriptionally active chromatin(GO:0035327) |
| 0.5 | 4.1 | GO:0097136 | Bcl-2 family protein complex(GO:0097136) |
| 0.5 | 84.1 | GO:0055037 | recycling endosome(GO:0055037) |
| 0.5 | 4.0 | GO:0016011 | dystroglycan complex(GO:0016011) sarcoglycan complex(GO:0016012) |
| 0.5 | 32.9 | GO:0005796 | Golgi lumen(GO:0005796) |
| 0.5 | 4.8 | GO:0097433 | dense body(GO:0097433) |
| 0.5 | 17.5 | GO:0005891 | voltage-gated calcium channel complex(GO:0005891) |
| 0.5 | 3.6 | GO:0033391 | chromatoid body(GO:0033391) |
| 0.4 | 17.2 | GO:0001917 | photoreceptor inner segment(GO:0001917) |
| 0.4 | 3.7 | GO:0033268 | node of Ranvier(GO:0033268) |
| 0.4 | 5.6 | GO:0034451 | centriolar satellite(GO:0034451) |
| 0.4 | 1.2 | GO:0070081 | clathrin-sculpted monoamine transport vesicle(GO:0070081) clathrin-sculpted monoamine transport vesicle membrane(GO:0070083) |
| 0.4 | 25.6 | GO:0030672 | synaptic vesicle membrane(GO:0030672) exocytic vesicle membrane(GO:0099501) |
| 0.4 | 1.5 | GO:0000333 | telomerase catalytic core complex(GO:0000333) |
| 0.4 | 6.5 | GO:0044224 | juxtaparanode region of axon(GO:0044224) |
| 0.4 | 3.4 | GO:0016013 | syntrophin complex(GO:0016013) |
| 0.4 | 1.9 | GO:0005899 | insulin receptor complex(GO:0005899) |
| 0.4 | 15.0 | GO:0005762 | organellar large ribosomal subunit(GO:0000315) mitochondrial large ribosomal subunit(GO:0005762) |
| 0.4 | 6.4 | GO:0030666 | endocytic vesicle membrane(GO:0030666) |
| 0.4 | 2.2 | GO:0009331 | glycerol-3-phosphate dehydrogenase complex(GO:0009331) |
| 0.4 | 2.6 | GO:0097427 | microtubule bundle(GO:0097427) |
| 0.4 | 45.2 | GO:0030018 | Z disc(GO:0030018) |
| 0.4 | 4.3 | GO:0000788 | nuclear nucleosome(GO:0000788) |
| 0.3 | 7.9 | GO:0032839 | dendrite cytoplasm(GO:0032839) |
| 0.3 | 6.8 | GO:0002080 | acrosomal membrane(GO:0002080) |
| 0.3 | 2.0 | GO:0005818 | astral microtubule(GO:0000235) aster(GO:0005818) |
| 0.3 | 8.6 | GO:0005921 | gap junction(GO:0005921) |
| 0.3 | 5.9 | GO:0097225 | sperm midpiece(GO:0097225) |
| 0.3 | 25.3 | GO:0008076 | voltage-gated potassium channel complex(GO:0008076) potassium channel complex(GO:0034705) |
| 0.3 | 3.5 | GO:0005776 | autophagosome(GO:0005776) |
| 0.3 | 9.9 | GO:0042629 | mast cell granule(GO:0042629) |
| 0.3 | 5.1 | GO:0005671 | Ada2/Gcn5/Ada3 transcription activator complex(GO:0005671) |
| 0.3 | 10.1 | GO:0043198 | dendritic shaft(GO:0043198) |
| 0.3 | 3.7 | GO:0071141 | SMAD protein complex(GO:0071141) |
| 0.3 | 3.7 | GO:0008385 | IkappaB kinase complex(GO:0008385) |
| 0.3 | 2.1 | GO:1990712 | HFE-transferrin receptor complex(GO:1990712) |
| 0.3 | 3.5 | GO:0005652 | nuclear lamina(GO:0005652) |
| 0.3 | 25.0 | GO:0005913 | cell-cell adherens junction(GO:0005913) |
| 0.3 | 1.9 | GO:0016589 | NURF complex(GO:0016589) |
| 0.3 | 1.7 | GO:0033162 | melanosome membrane(GO:0033162) chitosome(GO:0045009) |
| 0.3 | 66.8 | GO:0097060 | synaptic membrane(GO:0097060) |
| 0.3 | 13.8 | GO:0036126 | sperm flagellum(GO:0036126) |
| 0.3 | 13.5 | GO:0005871 | kinesin complex(GO:0005871) |
| 0.3 | 3.2 | GO:0031906 | late endosome lumen(GO:0031906) |
| 0.3 | 1.6 | GO:0031466 | Cul5-RING ubiquitin ligase complex(GO:0031466) |
| 0.3 | 3.1 | GO:0031588 | nucleotide-activated protein kinase complex(GO:0031588) |
| 0.3 | 8.3 | GO:0001533 | cornified envelope(GO:0001533) |
| 0.3 | 6.4 | GO:0071565 | nBAF complex(GO:0071565) |
| 0.2 | 7.9 | GO:0034364 | high-density lipoprotein particle(GO:0034364) |
| 0.2 | 6.6 | GO:0033017 | sarcoplasmic reticulum membrane(GO:0033017) |
| 0.2 | 20.0 | GO:0043204 | perikaryon(GO:0043204) |
| 0.2 | 19.1 | GO:0060076 | excitatory synapse(GO:0060076) |
| 0.2 | 1.6 | GO:1990452 | Parkin-FBXW7-Cul1 ubiquitin ligase complex(GO:1990452) |
| 0.2 | 20.7 | GO:0030016 | myofibril(GO:0030016) |
| 0.2 | 3.5 | GO:0031235 | intrinsic component of the cytoplasmic side of the plasma membrane(GO:0031235) |
| 0.2 | 38.1 | GO:0005741 | mitochondrial outer membrane(GO:0005741) |
| 0.2 | 2.0 | GO:0005751 | mitochondrial respiratory chain complex IV(GO:0005751) |
| 0.2 | 9.5 | GO:0043202 | lysosomal lumen(GO:0043202) |
| 0.2 | 1.2 | GO:0030991 | intraciliary transport particle A(GO:0030991) |
| 0.2 | 6.4 | GO:0032040 | small-subunit processome(GO:0032040) |
| 0.2 | 4.5 | GO:0005682 | U5 snRNP(GO:0005682) |
| 0.2 | 4.6 | GO:0080008 | Cul4-RING E3 ubiquitin ligase complex(GO:0080008) |
| 0.2 | 2.4 | GO:0032585 | multivesicular body membrane(GO:0032585) |
| 0.2 | 0.9 | GO:0002116 | semaphorin receptor complex(GO:0002116) |
| 0.2 | 19.9 | GO:0045121 | membrane raft(GO:0045121) membrane microdomain(GO:0098857) |
| 0.1 | 1.2 | GO:0045179 | apical cortex(GO:0045179) |
| 0.1 | 66.9 | GO:0005759 | mitochondrial matrix(GO:0005759) |
| 0.1 | 4.7 | GO:0034707 | chloride channel complex(GO:0034707) |
| 0.1 | 26.2 | GO:0032993 | protein-DNA complex(GO:0032993) |
| 0.1 | 4.1 | GO:0045177 | apical part of cell(GO:0045177) |
| 0.1 | 0.6 | GO:0043194 | axon initial segment(GO:0043194) |
| 0.1 | 3.6 | GO:0090545 | NuRD complex(GO:0016581) CHD-type complex(GO:0090545) |
| 0.1 | 22.5 | GO:0043235 | receptor complex(GO:0043235) |
| 0.1 | 5.2 | GO:0001669 | acrosomal vesicle(GO:0001669) |
| 0.1 | 6.7 | GO:0008021 | synaptic vesicle(GO:0008021) |
| 0.1 | 1.1 | GO:0070022 | transforming growth factor beta receptor homodimeric complex(GO:0070022) |
| 0.1 | 0.9 | GO:0098636 | protein complex involved in cell adhesion(GO:0098636) |
| 0.1 | 15.9 | GO:0005788 | endoplasmic reticulum lumen(GO:0005788) |
| 0.1 | 0.9 | GO:0044232 | organelle membrane contact site(GO:0044232) |
| 0.1 | 2.8 | GO:0000123 | histone acetyltransferase complex(GO:0000123) |
| 0.1 | 9.9 | GO:0022625 | cytosolic large ribosomal subunit(GO:0022625) |
| 0.1 | 18.7 | GO:0030424 | axon(GO:0030424) |
| 0.1 | 8.7 | GO:0101003 | ficolin-1-rich granule membrane(GO:0101003) |
| 0.1 | 2.1 | GO:0034045 | pre-autophagosomal structure membrane(GO:0034045) |
| 0.1 | 0.9 | GO:0005641 | nuclear envelope lumen(GO:0005641) |
| 0.1 | 3.6 | GO:0005901 | caveola(GO:0005901) |
| 0.1 | 1.3 | GO:0005869 | dynactin complex(GO:0005869) |
| 0.1 | 0.9 | GO:0033588 | Elongator holoenzyme complex(GO:0033588) |
| 0.1 | 12.7 | GO:0031012 | extracellular matrix(GO:0031012) |
| 0.1 | 14.4 | GO:0016323 | basolateral plasma membrane(GO:0016323) |
| 0.1 | 5.2 | GO:0033116 | endoplasmic reticulum-Golgi intermediate compartment membrane(GO:0033116) |
| 0.1 | 16.4 | GO:0016324 | apical plasma membrane(GO:0016324) |
| 0.1 | 1.2 | GO:0034358 | plasma lipoprotein particle(GO:0034358) lipoprotein particle(GO:1990777) |
| 0.1 | 3.5 | GO:0005834 | heterotrimeric G-protein complex(GO:0005834) |
| 0.1 | 0.6 | GO:0016461 | unconventional myosin complex(GO:0016461) |
| 0.1 | 3.0 | GO:0005903 | brush border(GO:0005903) |
| 0.1 | 6.8 | GO:0005802 | trans-Golgi network(GO:0005802) |
| 0.1 | 2.1 | GO:0098793 | presynapse(GO:0098793) |
| 0.1 | 5.1 | GO:0005875 | microtubule associated complex(GO:0005875) |
| 0.1 | 1.4 | GO:0005779 | integral component of peroxisomal membrane(GO:0005779) intrinsic component of peroxisomal membrane(GO:0031231) |
| 0.1 | 6.0 | GO:0045111 | intermediate filament cytoskeleton(GO:0045111) |
| 0.1 | 0.1 | GO:1990622 | CHOP-ATF3 complex(GO:1990622) |
| 0.1 | 0.3 | GO:0005943 | phosphatidylinositol 3-kinase complex, class IA(GO:0005943) |
| 0.1 | 0.8 | GO:0030140 | trans-Golgi network transport vesicle(GO:0030140) |
| 0.0 | 5.1 | GO:0031227 | intrinsic component of endoplasmic reticulum membrane(GO:0031227) |
| 0.0 | 1.7 | GO:0043209 | myelin sheath(GO:0043209) |
| 0.0 | 0.6 | GO:0001750 | photoreceptor outer segment(GO:0001750) |
| 0.0 | 1.2 | GO:0030173 | integral component of Golgi membrane(GO:0030173) |
| 0.0 | 0.2 | GO:0072357 | PTW/PP1 phosphatase complex(GO:0072357) |
| 0.0 | 0.8 | GO:0005665 | DNA-directed RNA polymerase II, core complex(GO:0005665) |
| 0.0 | 5.9 | GO:0005789 | endoplasmic reticulum membrane(GO:0005789) |
| 0.0 | 1.5 | GO:0045202 | synapse(GO:0045202) |
| 0.0 | 1.9 | GO:0016234 | inclusion body(GO:0016234) |
| 0.0 | 0.6 | GO:0030118 | clathrin coat(GO:0030118) |
| 0.0 | 0.9 | GO:1904724 | tertiary granule lumen(GO:1904724) |
Gene overrepresentation in molecular_function category:
| Log-likelihood per target | Total log-likelihood | Term | Description |
|---|---|---|---|
| 21.2 | 63.6 | GO:0019959 | interleukin-8 binding(GO:0019959) |
| 14.4 | 43.2 | GO:0034584 | piRNA binding(GO:0034584) |
| 8.9 | 26.8 | GO:0004949 | cannabinoid receptor activity(GO:0004949) |
| 7.2 | 223.0 | GO:0005212 | structural constituent of eye lens(GO:0005212) |
| 6.6 | 85.9 | GO:0001011 | transcription factor activity, sequence-specific DNA binding, RNA polymerase recruiting(GO:0001011) transcription factor activity, TFIIB-class binding(GO:0001087) |
| 6.4 | 19.3 | GO:0001596 | angiotensin type I receptor activity(GO:0001596) |
| 6.3 | 31.3 | GO:0030348 | syntaxin-3 binding(GO:0030348) |
| 5.3 | 21.3 | GO:0047391 | alkylglycerophosphoethanolamine phosphodiesterase activity(GO:0047391) |
| 5.2 | 15.5 | GO:0010698 | acetyltransferase activator activity(GO:0010698) |
| 5.2 | 20.6 | GO:0042030 | ATPase inhibitor activity(GO:0042030) |
| 5.1 | 30.7 | GO:0004705 | JUN kinase activity(GO:0004705) SAP kinase activity(GO:0016909) |
| 5.1 | 15.2 | GO:0001861 | complement component C4b receptor activity(GO:0001861) complement component C3b receptor activity(GO:0004877) |
| 4.7 | 23.5 | GO:0097108 | hedgehog family protein binding(GO:0097108) |
| 4.5 | 13.6 | GO:0061663 | NEDD8 ligase activity(GO:0061663) |
| 4.3 | 12.9 | GO:0052810 | 1-phosphatidylinositol-5-kinase activity(GO:0052810) |
| 4.3 | 12.8 | GO:0015091 | ferric iron transmembrane transporter activity(GO:0015091) trivalent inorganic cation transmembrane transporter activity(GO:0072510) |
| 3.9 | 15.5 | GO:0052798 | beta-galactoside alpha-2,3-sialyltransferase activity(GO:0052798) |
| 3.9 | 285.5 | GO:0050840 | extracellular matrix binding(GO:0050840) |
| 3.8 | 15.3 | GO:0047708 | biotinidase activity(GO:0047708) |
| 3.7 | 14.6 | GO:1990430 | extracellular matrix protein binding(GO:1990430) |
| 3.6 | 10.9 | GO:0008321 | Ral guanyl-nucleotide exchange factor activity(GO:0008321) |
| 3.6 | 18.0 | GO:0060230 | lipoprotein lipase activator activity(GO:0060230) |
| 3.5 | 38.6 | GO:0015379 | potassium:chloride symporter activity(GO:0015379) potassium ion symporter activity(GO:0022820) |
| 3.4 | 10.2 | GO:0004833 | tryptophan 2,3-dioxygenase activity(GO:0004833) |
| 3.3 | 13.2 | GO:0008336 | gamma-butyrobetaine dioxygenase activity(GO:0008336) |
| 3.2 | 6.5 | GO:0032422 | purine-rich negative regulatory element binding(GO:0032422) |
| 3.2 | 12.8 | GO:0005134 | interleukin-2 receptor binding(GO:0005134) |
| 3.2 | 34.7 | GO:0002161 | aminoacyl-tRNA editing activity(GO:0002161) |
| 3.2 | 88.3 | GO:0005523 | tropomyosin binding(GO:0005523) |
| 3.1 | 15.6 | GO:0038062 | protein tyrosine kinase collagen receptor activity(GO:0038062) collagen receptor activity(GO:0038064) |
| 3.1 | 9.3 | GO:0047275 | glucosaminylgalactosylglucosylceramide beta-galactosyltransferase activity(GO:0047275) |
| 3.1 | 12.2 | GO:0016841 | ammonia-lyase activity(GO:0016841) |
| 3.0 | 9.0 | GO:0071558 | histone demethylase activity (H3-K27 specific)(GO:0071558) |
| 2.8 | 11.1 | GO:0004886 | 9-cis retinoic acid receptor activity(GO:0004886) |
| 2.8 | 19.3 | GO:0043546 | molybdopterin cofactor binding(GO:0043546) |
| 2.6 | 12.9 | GO:0005152 | interleukin-1 receptor antagonist activity(GO:0005152) |
| 2.6 | 12.9 | GO:0015183 | L-aspartate transmembrane transporter activity(GO:0015183) |
| 2.6 | 12.8 | GO:0004687 | myosin light chain kinase activity(GO:0004687) |
| 2.6 | 20.4 | GO:0008474 | palmitoyl-(protein) hydrolase activity(GO:0008474) palmitoyl hydrolase activity(GO:0098599) |
| 2.5 | 49.2 | GO:0000900 | translation repressor activity, nucleic acid binding(GO:0000900) |
| 2.5 | 9.8 | GO:0030492 | hemoglobin binding(GO:0030492) |
| 2.4 | 12.2 | GO:0004468 | lysine N-acetyltransferase activity, acting on acetyl phosphate as donor(GO:0004468) |
| 2.4 | 2.4 | GO:0001855 | complement component C4b binding(GO:0001855) |
| 2.4 | 19.0 | GO:0004111 | creatine kinase activity(GO:0004111) |
| 2.4 | 19.0 | GO:0015349 | thyroid hormone transmembrane transporter activity(GO:0015349) |
| 2.3 | 9.4 | GO:0035651 | AP-3 adaptor complex binding(GO:0035651) |
| 2.2 | 6.7 | GO:0070095 | fructose-6-phosphate binding(GO:0070095) |
| 2.2 | 55.4 | GO:0000062 | fatty-acyl-CoA binding(GO:0000062) |
| 2.2 | 37.6 | GO:0004089 | carbonate dehydratase activity(GO:0004089) |
| 2.2 | 19.9 | GO:0004499 | N,N-dimethylaniline monooxygenase activity(GO:0004499) |
| 2.2 | 28.5 | GO:0005344 | oxygen transporter activity(GO:0005344) |
| 2.1 | 55.0 | GO:0017075 | syntaxin-1 binding(GO:0017075) |
| 2.1 | 10.4 | GO:0060175 | brain-derived neurotrophic factor-activated receptor activity(GO:0060175) |
| 2.1 | 4.2 | GO:0042056 | chemoattractant activity(GO:0042056) |
| 2.1 | 12.4 | GO:0086075 | gap junction channel activity involved in cardiac conduction electrical coupling(GO:0086075) |
| 2.1 | 20.6 | GO:0015386 | sodium:proton antiporter activity(GO:0015385) potassium:proton antiporter activity(GO:0015386) |
| 2.0 | 16.0 | GO:0035727 | lysophosphatidic acid binding(GO:0035727) |
| 2.0 | 9.8 | GO:0015204 | urea transmembrane transporter activity(GO:0015204) |
| 1.9 | 25.1 | GO:0008517 | folic acid transporter activity(GO:0008517) |
| 1.9 | 9.6 | GO:0034046 | poly(G) binding(GO:0034046) |
| 1.9 | 5.8 | GO:0008386 | cholesterol monooxygenase (side-chain-cleaving) activity(GO:0008386) |
| 1.9 | 7.7 | GO:0015220 | choline transmembrane transporter activity(GO:0015220) |
| 1.9 | 7.7 | GO:0004598 | peptidylglycine monooxygenase activity(GO:0004504) peptidylamidoglycolate lyase activity(GO:0004598) |
| 1.9 | 18.9 | GO:0045159 | myosin II binding(GO:0045159) |
| 1.9 | 13.2 | GO:0035005 | 1-phosphatidylinositol-4-phosphate 3-kinase activity(GO:0035005) |
| 1.8 | 25.7 | GO:0030215 | semaphorin receptor binding(GO:0030215) |
| 1.8 | 5.5 | GO:0030343 | vitamin D3 25-hydroxylase activity(GO:0030343) vitamin D 25-hydroxylase activity(GO:0070643) |
| 1.8 | 5.4 | GO:0097259 | tocopherol omega-hydroxylase activity(GO:0052870) alpha-tocopherol omega-hydroxylase activity(GO:0052871) 20-hydroxy-leukotriene B4 omega oxidase activity(GO:0097258) 20-aldehyde-leukotriene B4 20-monooxygenase activity(GO:0097259) |
| 1.8 | 7.1 | GO:0004740 | pyruvate dehydrogenase (acetyl-transferring) kinase activity(GO:0004740) |
| 1.8 | 5.3 | GO:0004024 | alcohol dehydrogenase activity, zinc-dependent(GO:0004024) |
| 1.7 | 12.2 | GO:0015277 | kainate selective glutamate receptor activity(GO:0015277) |
| 1.7 | 27.5 | GO:0070330 | aromatase activity(GO:0070330) |
| 1.7 | 5.1 | GO:0030366 | molybdopterin synthase activity(GO:0030366) |
| 1.7 | 5.0 | GO:0046573 | lactonohydrolase activity(GO:0046573) acyl-L-homoserine-lactone lactonohydrolase activity(GO:0102007) |
| 1.6 | 29.4 | GO:0017049 | GTP-Rho binding(GO:0017049) |
| 1.6 | 17.4 | GO:0003708 | retinoic acid receptor activity(GO:0003708) |
| 1.6 | 11.1 | GO:0015501 | glutamate:sodium symporter activity(GO:0015501) |
| 1.6 | 3.1 | GO:0045118 | thiamine transmembrane transporter activity(GO:0015234) thiamine uptake transmembrane transporter activity(GO:0015403) azole transporter activity(GO:0045118) azole transmembrane transporter activity(GO:1901474) |
| 1.5 | 9.0 | GO:0003872 | 6-phosphofructokinase activity(GO:0003872) |
| 1.5 | 4.5 | GO:0003845 | 11-beta-hydroxysteroid dehydrogenase [NAD(P)] activity(GO:0003845) |
| 1.5 | 4.4 | GO:0008502 | melatonin receptor activity(GO:0008502) |
| 1.5 | 8.8 | GO:0004013 | adenosylhomocysteinase activity(GO:0004013) trialkylsulfonium hydrolase activity(GO:0016802) |
| 1.4 | 4.3 | GO:0004119 | cGMP-inhibited cyclic-nucleotide phosphodiesterase activity(GO:0004119) |
| 1.4 | 4.3 | GO:0002113 | interleukin-33 binding(GO:0002113) |
| 1.4 | 5.7 | GO:0019862 | IgA binding(GO:0019862) |
| 1.4 | 18.5 | GO:0043855 | intracellular cyclic nucleotide activated cation channel activity(GO:0005221) cyclic nucleotide-gated ion channel activity(GO:0043855) |
| 1.4 | 14.2 | GO:0004300 | enoyl-CoA hydratase activity(GO:0004300) |
| 1.4 | 14.2 | GO:0070324 | thyroid hormone binding(GO:0070324) |
| 1.4 | 18.2 | GO:0008503 | benzodiazepine receptor activity(GO:0008503) |
| 1.3 | 9.4 | GO:0052650 | NADP-retinol dehydrogenase activity(GO:0052650) |
| 1.3 | 18.2 | GO:0031432 | titin binding(GO:0031432) |
| 1.3 | 3.9 | GO:0017098 | sulfonylurea receptor binding(GO:0017098) |
| 1.2 | 17.3 | GO:1903136 | cuprous ion binding(GO:1903136) |
| 1.2 | 7.2 | GO:0003906 | DNA-(apurinic or apyrimidinic site) lyase activity(GO:0003906) |
| 1.1 | 33.9 | GO:0004181 | metallocarboxypeptidase activity(GO:0004181) |
| 1.1 | 7.7 | GO:0060072 | large conductance calcium-activated potassium channel activity(GO:0060072) |
| 1.1 | 4.4 | GO:0004505 | phenylalanine 4-monooxygenase activity(GO:0004505) |
| 1.1 | 7.6 | GO:0002162 | dystroglycan binding(GO:0002162) |
| 1.1 | 3.2 | GO:0070546 | L-phenylalanine aminotransferase activity(GO:0070546) L-phenylalanine:2-oxoglutarate aminotransferase activity(GO:0080130) |
| 1.1 | 21.5 | GO:0008331 | high voltage-gated calcium channel activity(GO:0008331) |
| 1.0 | 8.3 | GO:0008271 | secondary active sulfate transmembrane transporter activity(GO:0008271) |
| 1.0 | 3.1 | GO:0050698 | proteoglycan sulfotransferase activity(GO:0050698) |
| 1.0 | 13.4 | GO:0047372 | acylglycerol lipase activity(GO:0047372) |
| 1.0 | 10.1 | GO:0001758 | retinal dehydrogenase activity(GO:0001758) |
| 1.0 | 4.0 | GO:0008466 | glycogenin glucosyltransferase activity(GO:0008466) |
| 1.0 | 4.0 | GO:0097603 | temperature-gated ion channel activity(GO:0097603) |
| 1.0 | 27.0 | GO:0005001 | transmembrane receptor protein tyrosine phosphatase activity(GO:0005001) transmembrane receptor protein phosphatase activity(GO:0019198) |
| 1.0 | 3.0 | GO:0097100 | supercoiled DNA binding(GO:0097100) |
| 1.0 | 3.0 | GO:0005260 | channel-conductance-controlling ATPase activity(GO:0005260) |
| 1.0 | 18.9 | GO:0032794 | GTPase activating protein binding(GO:0032794) |
| 1.0 | 10.8 | GO:0031995 | insulin-like growth factor II binding(GO:0031995) |
| 1.0 | 7.8 | GO:0016846 | carbon-sulfur lyase activity(GO:0016846) |
| 1.0 | 3.8 | GO:1901375 | acetylcholine transmembrane transporter activity(GO:0005277) secondary active organic cation transmembrane transporter activity(GO:0008513) acetate ester transmembrane transporter activity(GO:1901375) |
| 1.0 | 24.0 | GO:0004012 | phospholipid-translocating ATPase activity(GO:0004012) |
| 0.9 | 7.6 | GO:0004873 | asialoglycoprotein receptor activity(GO:0004873) |
| 0.9 | 2.8 | GO:0003863 | alpha-ketoacid dehydrogenase activity(GO:0003826) 3-methyl-2-oxobutanoate dehydrogenase (2-methylpropanoyl-transferring) activity(GO:0003863) |
| 0.9 | 5.5 | GO:0035374 | chondroitin sulfate binding(GO:0035374) |
| 0.9 | 5.5 | GO:0019834 | phospholipase A2 inhibitor activity(GO:0019834) |
| 0.9 | 2.7 | GO:0034714 | type III transforming growth factor beta receptor binding(GO:0034714) |
| 0.9 | 18.9 | GO:0043395 | heparan sulfate proteoglycan binding(GO:0043395) |
| 0.9 | 3.5 | GO:0008508 | bile acid:sodium symporter activity(GO:0008508) |
| 0.9 | 72.3 | GO:0008307 | structural constituent of muscle(GO:0008307) |
| 0.9 | 1.7 | GO:0030272 | 5-formyltetrahydrofolate cyclo-ligase activity(GO:0030272) |
| 0.9 | 4.3 | GO:0000179 | rRNA (adenine-N6,N6-)-dimethyltransferase activity(GO:0000179) |
| 0.9 | 6.0 | GO:0052739 | phosphatidylserine 1-acylhydrolase activity(GO:0052739) |
| 0.9 | 9.4 | GO:0022889 | L-serine transmembrane transporter activity(GO:0015194) serine transmembrane transporter activity(GO:0022889) |
| 0.9 | 0.9 | GO:0003990 | acetylcholinesterase activity(GO:0003990) |
| 0.8 | 11.8 | GO:0017162 | aryl hydrocarbon receptor binding(GO:0017162) |
| 0.8 | 2.5 | GO:0004087 | carbamoyl-phosphate synthase (ammonia) activity(GO:0004087) carbamoyl-phosphate synthase (glutamine-hydrolyzing) activity(GO:0004088) |
| 0.8 | 8.4 | GO:0047498 | calcium-dependent phospholipase A2 activity(GO:0047498) |
| 0.8 | 42.3 | GO:0017080 | sodium channel regulator activity(GO:0017080) |
| 0.8 | 11.4 | GO:0005391 | sodium:potassium-exchanging ATPase activity(GO:0005391) |
| 0.8 | 3.2 | GO:0051120 | hepoxilin A3 synthase activity(GO:0051120) |
| 0.8 | 14.4 | GO:0015467 | G-protein activated inward rectifier potassium channel activity(GO:0015467) |
| 0.8 | 11.1 | GO:0048407 | platelet-derived growth factor binding(GO:0048407) |
| 0.8 | 7.9 | GO:0004767 | sphingomyelin phosphodiesterase activity(GO:0004767) |
| 0.8 | 14.0 | GO:0043522 | leucine zipper domain binding(GO:0043522) |
| 0.8 | 2.3 | GO:0001665 | alpha-N-acetylgalactosaminide alpha-2,6-sialyltransferase activity(GO:0001665) |
| 0.8 | 8.4 | GO:0015643 | toxic substance binding(GO:0015643) |
| 0.8 | 4.5 | GO:0008310 | single-stranded DNA 3'-5' exodeoxyribonuclease activity(GO:0008310) |
| 0.7 | 12.7 | GO:0019992 | diacylglycerol binding(GO:0019992) |
| 0.7 | 2.2 | GO:0016714 | oxidoreductase activity, acting on paired donors, with incorporation or reduction of molecular oxygen, reduced pteridine as one donor, and incorporation of one atom of oxygen(GO:0016714) |
| 0.7 | 8.8 | GO:0086080 | protein binding involved in heterotypic cell-cell adhesion(GO:0086080) |
| 0.7 | 14.6 | GO:0051787 | misfolded protein binding(GO:0051787) |
| 0.7 | 19.0 | GO:0004016 | adenylate cyclase activity(GO:0004016) |
| 0.7 | 2.9 | GO:0070653 | high-density lipoprotein particle receptor binding(GO:0070653) |
| 0.7 | 9.2 | GO:0008140 | cAMP response element binding protein binding(GO:0008140) |
| 0.7 | 21.6 | GO:0043015 | gamma-tubulin binding(GO:0043015) |
| 0.7 | 2.1 | GO:0046921 | glycoprotein 6-alpha-L-fucosyltransferase activity(GO:0008424) alpha-(1->6)-fucosyltransferase activity(GO:0046921) |
| 0.7 | 11.8 | GO:0070513 | death domain binding(GO:0070513) |
| 0.7 | 9.5 | GO:0015095 | magnesium ion transmembrane transporter activity(GO:0015095) |
| 0.7 | 4.1 | GO:0003998 | acylphosphatase activity(GO:0003998) |
| 0.7 | 19.7 | GO:0004435 | phosphatidylinositol phospholipase C activity(GO:0004435) |
| 0.7 | 4.0 | GO:0046965 | retinoid X receptor binding(GO:0046965) |
| 0.7 | 3.4 | GO:0030628 | pre-mRNA 3'-splice site binding(GO:0030628) |
| 0.7 | 2.0 | GO:0000386 | second spliceosomal transesterification activity(GO:0000386) |
| 0.7 | 2.0 | GO:0033300 | dehydroascorbic acid transporter activity(GO:0033300) |
| 0.7 | 12.0 | GO:1905030 | voltage-gated sodium channel activity(GO:0005248) voltage-gated ion channel activity involved in regulation of postsynaptic membrane potential(GO:1905030) |
| 0.7 | 10.7 | GO:0004143 | diacylglycerol kinase activity(GO:0004143) |
| 0.7 | 3.3 | GO:0070697 | activin receptor binding(GO:0070697) |
| 0.7 | 2.0 | GO:0002114 | interleukin-33 receptor activity(GO:0002114) |
| 0.6 | 1.9 | GO:0016434 | rRNA (cytosine) methyltransferase activity(GO:0016434) |
| 0.6 | 1.9 | GO:0036080 | GDP-fucose transmembrane transporter activity(GO:0005457) purine nucleotide-sugar transmembrane transporter activity(GO:0036080) |
| 0.6 | 5.8 | GO:0004969 | histamine receptor activity(GO:0004969) |
| 0.6 | 2.6 | GO:0042020 | interleukin-23 binding(GO:0042019) interleukin-23 receptor activity(GO:0042020) |
| 0.6 | 12.2 | GO:0005537 | mannose binding(GO:0005537) |
| 0.6 | 1.9 | GO:0051377 | mannose-ethanolamine phosphotransferase activity(GO:0051377) |
| 0.6 | 3.8 | GO:0035368 | selenocysteine insertion sequence binding(GO:0035368) |
| 0.6 | 3.8 | GO:0008597 | calcium-dependent protein serine/threonine phosphatase regulator activity(GO:0008597) |
| 0.6 | 10.0 | GO:0004535 | poly(A)-specific ribonuclease activity(GO:0004535) |
| 0.6 | 7.9 | GO:0008429 | phosphatidylethanolamine binding(GO:0008429) |
| 0.6 | 1.2 | GO:0016639 | oxidoreductase activity, acting on the CH-NH2 group of donors, NAD or NADP as acceptor(GO:0016639) |
| 0.6 | 3.0 | GO:0005319 | lipid transporter activity(GO:0005319) |
| 0.6 | 1.2 | GO:0005324 | long-chain fatty acid transporter activity(GO:0005324) |
| 0.6 | 2.4 | GO:0016712 | oxidoreductase activity, acting on paired donors, with incorporation or reduction of molecular oxygen, reduced flavin or flavoprotein as one donor, and incorporation of one atom of oxygen(GO:0016712) |
| 0.6 | 3.5 | GO:0016015 | morphogen activity(GO:0016015) |
| 0.6 | 5.8 | GO:0045294 | alpha-catenin binding(GO:0045294) |
| 0.6 | 8.2 | GO:0015101 | organic cation transmembrane transporter activity(GO:0015101) |
| 0.6 | 2.3 | GO:0005497 | androgen binding(GO:0005497) |
| 0.6 | 8.1 | GO:0033612 | receptor serine/threonine kinase binding(GO:0033612) |
| 0.6 | 1.7 | GO:0004611 | phosphoenolpyruvate carboxykinase activity(GO:0004611) phosphoenolpyruvate carboxykinase (GTP) activity(GO:0004613) |
| 0.6 | 8.0 | GO:0008179 | adenylate cyclase binding(GO:0008179) |
| 0.6 | 8.5 | GO:0051117 | ATPase binding(GO:0051117) |
| 0.6 | 1.7 | GO:0042289 | MHC class II protein binding(GO:0042289) |
| 0.6 | 8.3 | GO:0034483 | heparan sulfate sulfotransferase activity(GO:0034483) |
| 0.6 | 2.2 | GO:0052591 | sn-glycerol-3-phosphate:ubiquinone oxidoreductase activity(GO:0052590) sn-glycerol-3-phosphate:ubiquinone-8 oxidoreductase activity(GO:0052591) |
| 0.6 | 5.0 | GO:0016721 | superoxide dismutase activity(GO:0004784) oxidoreductase activity, acting on superoxide radicals as acceptor(GO:0016721) |
| 0.5 | 2.7 | GO:0046912 | transferase activity, transferring acyl groups, acyl groups converted into alkyl on transfer(GO:0046912) |
| 0.5 | 21.8 | GO:0015485 | cholesterol binding(GO:0015485) |
| 0.5 | 4.9 | GO:0032051 | clathrin light chain binding(GO:0032051) |
| 0.5 | 6.5 | GO:0004971 | AMPA glutamate receptor activity(GO:0004971) |
| 0.5 | 7.0 | GO:0005004 | GPI-linked ephrin receptor activity(GO:0005004) |
| 0.5 | 7.5 | GO:0005132 | type I interferon receptor binding(GO:0005132) |
| 0.5 | 5.3 | GO:1990380 | Lys48-specific deubiquitinase activity(GO:1990380) |
| 0.5 | 4.2 | GO:0005534 | galactose binding(GO:0005534) |
| 0.5 | 14.1 | GO:0017134 | fibroblast growth factor binding(GO:0017134) |
| 0.5 | 2.6 | GO:0004974 | leukotriene receptor activity(GO:0004974) |
| 0.5 | 28.7 | GO:0004714 | transmembrane receptor protein tyrosine kinase activity(GO:0004714) |
| 0.5 | 3.1 | GO:0050998 | nitric-oxide synthase binding(GO:0050998) |
| 0.5 | 3.0 | GO:0030020 | extracellular matrix structural constituent conferring tensile strength(GO:0030020) |
| 0.5 | 2.5 | GO:0008048 | calcium sensitive guanylate cyclase activator activity(GO:0008048) |
| 0.5 | 5.0 | GO:0003696 | satellite DNA binding(GO:0003696) |
| 0.5 | 1.9 | GO:0004749 | ribose phosphate diphosphokinase activity(GO:0004749) |
| 0.5 | 4.8 | GO:0051371 | muscle alpha-actinin binding(GO:0051371) |
| 0.5 | 49.0 | GO:0004867 | serine-type endopeptidase inhibitor activity(GO:0004867) |
| 0.5 | 1.4 | GO:0080019 | fatty-acyl-CoA reductase (alcohol-forming) activity(GO:0080019) |
| 0.5 | 1.4 | GO:0046848 | hydroxyapatite binding(GO:0046848) |
| 0.5 | 8.0 | GO:0008409 | 5'-3' exonuclease activity(GO:0008409) |
| 0.5 | 1.4 | GO:0005250 | A-type (transient outward) potassium channel activity(GO:0005250) |
| 0.5 | 5.2 | GO:0004332 | fructose-bisphosphate aldolase activity(GO:0004332) |
| 0.5 | 34.5 | GO:0005201 | extracellular matrix structural constituent(GO:0005201) |
| 0.5 | 1.8 | GO:0046899 | nucleoside triphosphate adenylate kinase activity(GO:0046899) |
| 0.5 | 5.5 | GO:0005078 | MAP-kinase scaffold activity(GO:0005078) |
| 0.5 | 2.7 | GO:0004522 | ribonuclease A activity(GO:0004522) |
| 0.5 | 6.8 | GO:0045236 | CXCR chemokine receptor binding(GO:0045236) |
| 0.4 | 3.6 | GO:0036312 | phosphatidylinositol 3-kinase regulatory subunit binding(GO:0036312) |
| 0.4 | 6.3 | GO:0004065 | arylsulfatase activity(GO:0004065) |
| 0.4 | 1.8 | GO:0050309 | glucose-6-phosphatase activity(GO:0004346) sugar-terminal-phosphatase activity(GO:0050309) |
| 0.4 | 36.1 | GO:0003777 | microtubule motor activity(GO:0003777) |
| 0.4 | 1.7 | GO:0038047 | beta-endorphin receptor activity(GO:0004979) morphine receptor activity(GO:0038047) |
| 0.4 | 4.7 | GO:0031419 | cobalamin binding(GO:0031419) |
| 0.4 | 14.1 | GO:0016709 | oxidoreductase activity, acting on paired donors, with incorporation or reduction of molecular oxygen, NAD(P)H as one donor, and incorporation of one atom of oxygen(GO:0016709) |
| 0.4 | 11.5 | GO:0051010 | microtubule plus-end binding(GO:0051010) |
| 0.4 | 0.8 | GO:0005030 | neurotrophin receptor activity(GO:0005030) |
| 0.4 | 21.9 | GO:0017112 | Rab guanyl-nucleotide exchange factor activity(GO:0017112) |
| 0.4 | 20.5 | GO:0004984 | olfactory receptor activity(GO:0004984) |
| 0.4 | 3.7 | GO:0070742 | C2H2 zinc finger domain binding(GO:0070742) |
| 0.4 | 6.1 | GO:0017151 | DEAD/H-box RNA helicase binding(GO:0017151) |
| 0.4 | 19.1 | GO:0004364 | glutathione transferase activity(GO:0004364) |
| 0.4 | 4.0 | GO:0008607 | phosphorylase kinase regulator activity(GO:0008607) |
| 0.4 | 1.2 | GO:0015222 | serotonin transmembrane transporter activity(GO:0015222) |
| 0.4 | 3.2 | GO:0030275 | LRR domain binding(GO:0030275) |
| 0.4 | 57.7 | GO:0044325 | ion channel binding(GO:0044325) |
| 0.4 | 12.0 | GO:0003950 | NAD+ ADP-ribosyltransferase activity(GO:0003950) |
| 0.4 | 3.1 | GO:0003810 | protein-glutamine gamma-glutamyltransferase activity(GO:0003810) |
| 0.4 | 42.9 | GO:0004222 | metalloendopeptidase activity(GO:0004222) |
| 0.4 | 3.0 | GO:0004000 | adenosine deaminase activity(GO:0004000) |
| 0.4 | 1.5 | GO:0015232 | heme transporter activity(GO:0015232) |
| 0.4 | 2.2 | GO:0032036 | myosin heavy chain binding(GO:0032036) |
| 0.4 | 7.3 | GO:0050321 | tau-protein kinase activity(GO:0050321) |
| 0.4 | 5.7 | GO:0031492 | nucleosomal DNA binding(GO:0031492) |
| 0.4 | 2.8 | GO:0070181 | small ribosomal subunit rRNA binding(GO:0070181) |
| 0.4 | 1.4 | GO:0042132 | fructose 1,6-bisphosphate 1-phosphatase activity(GO:0042132) |
| 0.4 | 6.7 | GO:0008191 | metalloendopeptidase inhibitor activity(GO:0008191) |
| 0.4 | 2.1 | GO:0009378 | four-way junction helicase activity(GO:0009378) |
| 0.4 | 3.5 | GO:0009374 | biotin binding(GO:0009374) |
| 0.3 | 0.3 | GO:0061752 | telomeric repeat-containing RNA binding(GO:0061752) |
| 0.3 | 10.8 | GO:0004709 | MAP kinase kinase kinase activity(GO:0004709) |
| 0.3 | 4.1 | GO:0043176 | amine binding(GO:0043176) serotonin binding(GO:0051378) |
| 0.3 | 4.0 | GO:0030957 | Tat protein binding(GO:0030957) |
| 0.3 | 1.7 | GO:0004925 | prolactin receptor activity(GO:0004925) |
| 0.3 | 6.4 | GO:0034185 | apolipoprotein binding(GO:0034185) |
| 0.3 | 11.4 | GO:0003785 | actin monomer binding(GO:0003785) |
| 0.3 | 2.0 | GO:0001515 | opioid peptide activity(GO:0001515) |
| 0.3 | 1.6 | GO:0050816 | phosphothreonine binding(GO:0050816) |
| 0.3 | 1.9 | GO:0036310 | annealing helicase activity(GO:0036310) |
| 0.3 | 10.3 | GO:0005044 | scavenger receptor activity(GO:0005044) |
| 0.3 | 2.6 | GO:0015245 | fatty acid transporter activity(GO:0015245) |
| 0.3 | 1.0 | GO:0004802 | transketolase activity(GO:0004802) |
| 0.3 | 8.2 | GO:0004890 | GABA-A receptor activity(GO:0004890) |
| 0.3 | 8.2 | GO:0001106 | RNA polymerase II transcription corepressor activity(GO:0001106) |
| 0.3 | 0.6 | GO:0047006 | 17-alpha,20-alpha-dihydroxypregn-4-en-3-one dehydrogenase activity(GO:0047006) |
| 0.3 | 5.8 | GO:0005520 | insulin-like growth factor binding(GO:0005520) |
| 0.3 | 1.5 | GO:0016812 | hydrolase activity, acting on carbon-nitrogen (but not peptide) bonds, in cyclic amides(GO:0016812) |
| 0.3 | 1.1 | GO:0005143 | interleukin-12 receptor binding(GO:0005143) |
| 0.3 | 1.1 | GO:0004948 | calcitonin receptor activity(GO:0004948) |
| 0.3 | 6.7 | GO:0032266 | phosphatidylinositol-3-phosphate binding(GO:0032266) |
| 0.3 | 33.1 | GO:0016820 | hydrolase activity, acting on acid anhydrides, catalyzing transmembrane movement of substances(GO:0016820) |
| 0.3 | 7.4 | GO:0001972 | retinoic acid binding(GO:0001972) |
| 0.3 | 11.0 | GO:0005507 | copper ion binding(GO:0005507) |
| 0.2 | 2.9 | GO:0008519 | ammonium transmembrane transporter activity(GO:0008519) |
| 0.2 | 1.7 | GO:0004977 | melanocortin receptor activity(GO:0004977) |
| 0.2 | 2.1 | GO:0005025 | transforming growth factor beta receptor activity, type I(GO:0005025) |
| 0.2 | 3.3 | GO:0004653 | polypeptide N-acetylgalactosaminyltransferase activity(GO:0004653) |
| 0.2 | 6.0 | GO:0003887 | DNA-directed DNA polymerase activity(GO:0003887) |
| 0.2 | 4.1 | GO:0070840 | dynein complex binding(GO:0070840) |
| 0.2 | 8.3 | GO:0001540 | beta-amyloid binding(GO:0001540) |
| 0.2 | 5.1 | GO:0005092 | GDP-dissociation inhibitor activity(GO:0005092) |
| 0.2 | 1.1 | GO:0036122 | BMP binding(GO:0036122) |
| 0.2 | 6.4 | GO:0001223 | transcription coactivator binding(GO:0001223) |
| 0.2 | 5.4 | GO:0004385 | guanylate kinase activity(GO:0004385) |
| 0.2 | 2.7 | GO:0030955 | potassium ion binding(GO:0030955) |
| 0.2 | 1.0 | GO:0051880 | G-quadruplex DNA binding(GO:0051880) |
| 0.2 | 5.0 | GO:0003746 | translation elongation factor activity(GO:0003746) |
| 0.2 | 6.2 | GO:1990841 | promoter-specific chromatin binding(GO:1990841) |
| 0.2 | 8.1 | GO:0070412 | R-SMAD binding(GO:0070412) |
| 0.2 | 2.8 | GO:0004622 | lysophospholipase activity(GO:0004622) |
| 0.2 | 3.6 | GO:0032454 | histone demethylase activity (H3-K9 specific)(GO:0032454) |
| 0.2 | 4.3 | GO:0016646 | oxidoreductase activity, acting on the CH-NH group of donors, NAD or NADP as acceptor(GO:0016646) |
| 0.2 | 3.1 | GO:0042169 | SH2 domain binding(GO:0042169) |
| 0.2 | 1.9 | GO:0004115 | 3',5'-cyclic-AMP phosphodiesterase activity(GO:0004115) |
| 0.2 | 3.0 | GO:0098641 | cadherin binding involved in cell-cell adhesion(GO:0098641) |
| 0.2 | 6.7 | GO:0004683 | calmodulin-dependent protein kinase activity(GO:0004683) |
| 0.2 | 0.9 | GO:0016725 | oxidoreductase activity, acting on CH or CH2 groups(GO:0016725) |
| 0.2 | 6.4 | GO:0015459 | potassium channel regulator activity(GO:0015459) |
| 0.2 | 1.6 | GO:0030306 | ADP-ribosylation factor binding(GO:0030306) |
| 0.2 | 4.2 | GO:0005246 | calcium channel regulator activity(GO:0005246) |
| 0.2 | 11.8 | GO:0030165 | PDZ domain binding(GO:0030165) |
| 0.2 | 1.4 | GO:0038052 | RNA polymerase II transcription factor activity, estrogen-activated sequence-specific DNA binding(GO:0038052) |
| 0.2 | 5.6 | GO:0030742 | GTP-dependent protein binding(GO:0030742) |
| 0.2 | 1.2 | GO:0050693 | LBD domain binding(GO:0050693) |
| 0.2 | 20.5 | GO:0005200 | structural constituent of cytoskeleton(GO:0005200) |
| 0.2 | 3.3 | GO:0001671 | ATPase activator activity(GO:0001671) |
| 0.2 | 1.0 | GO:0005545 | 1-phosphatidylinositol binding(GO:0005545) |
| 0.2 | 0.7 | GO:0001016 | RNA polymerase III regulatory region DNA binding(GO:0001016) |
| 0.2 | 7.0 | GO:0030331 | estrogen receptor binding(GO:0030331) |
| 0.2 | 2.5 | GO:0004602 | glutathione peroxidase activity(GO:0004602) |
| 0.2 | 1.1 | GO:0070492 | oligosaccharide binding(GO:0070492) |
| 0.2 | 12.0 | GO:0051219 | phosphoprotein binding(GO:0051219) |
| 0.2 | 3.5 | GO:0071617 | 1-acylglycerol-3-phosphate O-acyltransferase activity(GO:0003841) lysophosphatidic acid acyltransferase activity(GO:0042171) lysophospholipid acyltransferase activity(GO:0071617) |
| 0.2 | 2.8 | GO:0015269 | calcium-activated potassium channel activity(GO:0015269) |
| 0.2 | 2.9 | GO:0016702 | oxidoreductase activity, acting on single donors with incorporation of molecular oxygen, incorporation of two atoms of oxygen(GO:0016702) |
| 0.2 | 0.8 | GO:0008440 | inositol-1,4,5-trisphosphate 3-kinase activity(GO:0008440) |
| 0.1 | 2.8 | GO:0043014 | alpha-tubulin binding(GO:0043014) |
| 0.1 | 2.3 | GO:0102391 | decanoate--CoA ligase activity(GO:0102391) |
| 0.1 | 2.7 | GO:0035198 | miRNA binding(GO:0035198) |
| 0.1 | 2.8 | GO:0008066 | glutamate receptor activity(GO:0008066) |
| 0.1 | 1.9 | GO:0070679 | inositol 1,4,5 trisphosphate binding(GO:0070679) |
| 0.1 | 2.7 | GO:0042166 | acetylcholine binding(GO:0042166) |
| 0.1 | 1.6 | GO:0008395 | steroid hydroxylase activity(GO:0008395) |
| 0.1 | 1.1 | GO:0008432 | JUN kinase binding(GO:0008432) |
| 0.1 | 0.4 | GO:0004914 | interleukin-5 receptor activity(GO:0004914) |
| 0.1 | 80.3 | GO:0005509 | calcium ion binding(GO:0005509) |
| 0.1 | 0.4 | GO:0016215 | stearoyl-CoA 9-desaturase activity(GO:0004768) acyl-CoA desaturase activity(GO:0016215) |
| 0.1 | 1.9 | GO:0017091 | AU-rich element binding(GO:0017091) |
| 0.1 | 1.3 | GO:0035259 | glucocorticoid receptor binding(GO:0035259) |
| 0.1 | 1.8 | GO:0003774 | motor activity(GO:0003774) |
| 0.1 | 3.1 | GO:0031683 | G-protein beta/gamma-subunit complex binding(GO:0031683) |
| 0.1 | 2.6 | GO:0098531 | RNA polymerase II transcription factor activity, ligand-activated sequence-specific DNA binding(GO:0004879) transcription factor activity, direct ligand regulated sequence-specific DNA binding(GO:0098531) |
| 0.1 | 1.3 | GO:0016615 | malate dehydrogenase activity(GO:0016615) |
| 0.1 | 3.0 | GO:0008188 | neuropeptide receptor activity(GO:0008188) |
| 0.1 | 4.7 | GO:1901476 | carbohydrate transmembrane transporter activity(GO:0015144) carbohydrate transporter activity(GO:1901476) |
| 0.1 | 0.2 | GO:0015377 | cation:chloride symporter activity(GO:0015377) |
| 0.1 | 2.1 | GO:0005159 | insulin-like growth factor receptor binding(GO:0005159) |
| 0.1 | 0.5 | GO:0004910 | interleukin-1, Type II, blocking receptor activity(GO:0004910) |
| 0.1 | 1.2 | GO:0097371 | MDM2/MDM4 family protein binding(GO:0097371) |
| 0.1 | 9.8 | GO:0005516 | calmodulin binding(GO:0005516) |
| 0.1 | 0.3 | GO:0030506 | ankyrin binding(GO:0030506) |
| 0.1 | 0.6 | GO:0071532 | ankyrin repeat binding(GO:0071532) |
| 0.1 | 0.2 | GO:0017018 | myosin phosphatase activity(GO:0017018) |
| 0.1 | 2.3 | GO:0050699 | WW domain binding(GO:0050699) |
| 0.1 | 2.6 | GO:0043022 | ribosome binding(GO:0043022) |
| 0.1 | 0.5 | GO:0004118 | cGMP-stimulated cyclic-nucleotide phosphodiesterase activity(GO:0004118) |
| 0.1 | 0.7 | GO:0045545 | syndecan binding(GO:0045545) |
| 0.1 | 0.3 | GO:0017040 | ceramidase activity(GO:0017040) |
| 0.1 | 1.2 | GO:0004708 | MAP kinase kinase activity(GO:0004708) |
| 0.1 | 0.3 | GO:0005415 | nucleoside:sodium symporter activity(GO:0005415) |
| 0.1 | 0.6 | GO:0004028 | 3-chloroallyl aldehyde dehydrogenase activity(GO:0004028) |
| 0.1 | 8.1 | GO:0051015 | actin filament binding(GO:0051015) |
| 0.1 | 5.5 | GO:0008201 | heparin binding(GO:0008201) |
| 0.1 | 2.4 | GO:0000049 | tRNA binding(GO:0000049) |
| 0.1 | 1.8 | GO:0005109 | frizzled binding(GO:0005109) |
| 0.1 | 2.4 | GO:0004712 | protein serine/threonine/tyrosine kinase activity(GO:0004712) |
| 0.1 | 1.4 | GO:0030971 | receptor tyrosine kinase binding(GO:0030971) |
| 0.1 | 5.5 | GO:0005179 | hormone activity(GO:0005179) |
| 0.1 | 2.0 | GO:0004521 | endoribonuclease activity(GO:0004521) |
| 0.0 | 0.2 | GO:0035243 | protein-arginine omega-N symmetric methyltransferase activity(GO:0035243) |
| 0.0 | 9.2 | GO:0003735 | structural constituent of ribosome(GO:0003735) |
| 0.0 | 1.5 | GO:0001105 | RNA polymerase II transcription coactivator activity(GO:0001105) |
| 0.0 | 1.1 | GO:0030544 | Hsp70 protein binding(GO:0030544) |
| 0.0 | 5.0 | GO:0008017 | microtubule binding(GO:0008017) |
| 0.0 | 0.4 | GO:0008417 | fucosyltransferase activity(GO:0008417) |
| 0.0 | 0.6 | GO:0005343 | organic acid:sodium symporter activity(GO:0005343) |
| 0.0 | 0.8 | GO:0048365 | Rac GTPase binding(GO:0048365) |
| 0.0 | 1.7 | GO:0003725 | double-stranded RNA binding(GO:0003725) |
| 0.0 | 0.1 | GO:0043426 | MRF binding(GO:0043426) |
| 0.0 | 1.1 | GO:0004722 | protein serine/threonine phosphatase activity(GO:0004722) |
| 0.0 | 0.0 | GO:0031781 | melanocortin receptor binding(GO:0031779) type 3 melanocortin receptor binding(GO:0031781) type 4 melanocortin receptor binding(GO:0031782) |
| 0.0 | 0.8 | GO:0003705 | transcription factor activity, RNA polymerase II distal enhancer sequence-specific binding(GO:0003705) |
| 0.0 | 0.1 | GO:0015175 | neutral amino acid transmembrane transporter activity(GO:0015175) |
Gene overrepresentation in C2:CP category:
| Log-likelihood per target | Total log-likelihood | Term | Description |
|---|---|---|---|
| 2.9 | 160.0 | NABA PROTEOGLYCANS | Genes encoding proteoglycans |
| 1.3 | 8.0 | PID TCR RAS PATHWAY | Ras signaling in the CD4+ TCR pathway |
| 1.3 | 33.1 | PID LPA4 PATHWAY | LPA4-mediated signaling events |
| 1.3 | 65.9 | SIG CD40PATHWAYMAP | Genes related to CD40 signaling |
| 1.3 | 72.0 | PID NCADHERIN PATHWAY | N-cadherin signaling events |
| 1.1 | 23.5 | PID ECADHERIN KERATINOCYTE PATHWAY | E-cadherin signaling in keratinocytes |
| 1.0 | 239.9 | NABA ECM GLYCOPROTEINS | Genes encoding structural ECM glycoproteins |
| 0.9 | 13.6 | PID RANBP2 PATHWAY | Sumoylation by RanBP2 regulates transcriptional repression |
| 0.9 | 124.2 | PID MYC REPRESS PATHWAY | Validated targets of C-MYC transcriptional repression |
| 0.8 | 13.8 | PID ALK2 PATHWAY | ALK2 signaling events |
| 0.8 | 15.7 | ST G ALPHA S PATHWAY | G alpha s Pathway |
| 0.8 | 4.7 | PID INTEGRIN5 PATHWAY | Beta5 beta6 beta7 and beta8 integrin cell surface interactions |
| 0.7 | 36.4 | SIG REGULATION OF THE ACTIN CYTOSKELETON BY RHO GTPASES | Genes related to regulation of the actin cytoskeleton |
| 0.7 | 117.1 | NABA ECM AFFILIATED | Genes encoding proteins affiliated structurally or functionally to extracellular matrix proteins |
| 0.7 | 30.9 | PID INTEGRIN1 PATHWAY | Beta1 integrin cell surface interactions |
| 0.6 | 38.4 | PID TAP63 PATHWAY | Validated transcriptional targets of TAp63 isoforms |
| 0.6 | 25.1 | PID RAS PATHWAY | Regulation of Ras family activation |
| 0.6 | 10.7 | PID ER NONGENOMIC PATHWAY | Plasma membrane estrogen receptor signaling |
| 0.6 | 6.2 | PID GLYPICAN 1PATHWAY | Glypican 1 network |
| 0.6 | 30.4 | PID ARF6 TRAFFICKING PATHWAY | Arf6 trafficking events |
| 0.6 | 19.9 | PID EPHA FWDPATHWAY | EPHA forward signaling |
| 0.5 | 38.3 | PID IL6 7 PATHWAY | IL6-mediated signaling events |
| 0.5 | 7.4 | SA G1 AND S PHASES | Cdk2, 4, and 6 bind cyclin D in G1, while cdk2/cyclin E promotes the G1/S transition. |
| 0.5 | 3.1 | ST INTERFERON GAMMA PATHWAY | Interferon gamma pathway. |
| 0.5 | 8.7 | PID P38 MK2 PATHWAY | p38 signaling mediated by MAPKAP kinases |
| 0.5 | 16.4 | PID RETINOIC ACID PATHWAY | Retinoic acid receptors-mediated signaling |
| 0.5 | 2.0 | PID SYNDECAN 4 PATHWAY | Syndecan-4-mediated signaling events |
| 0.5 | 15.7 | PID RHODOPSIN PATHWAY | Visual signal transduction: Rods |
| 0.5 | 9.2 | ST WNT CA2 CYCLIC GMP PATHWAY | Wnt/Ca2+/cyclic GMP signaling. |
| 0.4 | 18.1 | PID AURORA A PATHWAY | Aurora A signaling |
| 0.4 | 11.9 | PID ANGIOPOIETIN RECEPTOR PATHWAY | Angiopoietin receptor Tie2-mediated signaling |
| 0.4 | 15.5 | PID RHOA PATHWAY | RhoA signaling pathway |
| 0.4 | 20.6 | PID LKB1 PATHWAY | LKB1 signaling events |
| 0.4 | 19.0 | PID HNF3A PATHWAY | FOXA1 transcription factor network |
| 0.4 | 2.3 | PID AR NONGENOMIC PATHWAY | Nongenotropic Androgen signaling |
| 0.4 | 3.4 | ST ADRENERGIC | Adrenergic Pathway |
| 0.4 | 12.4 | PID FOXM1 PATHWAY | FOXM1 transcription factor network |
| 0.4 | 25.1 | PID P53 REGULATION PATHWAY | p53 pathway |
| 0.4 | 8.5 | PID PI3K PLC TRK PATHWAY | Trk receptor signaling mediated by PI3K and PLC-gamma |
| 0.4 | 7.7 | PID ARF6 PATHWAY | Arf6 signaling events |
| 0.4 | 45.7 | PID BETA CATENIN NUC PATHWAY | Regulation of nuclear beta catenin signaling and target gene transcription |
| 0.4 | 2.9 | PID CONE PATHWAY | Visual signal transduction: Cones |
| 0.3 | 0.7 | PID IL8 CXCR1 PATHWAY | IL8- and CXCR1-mediated signaling events |
| 0.3 | 18.2 | PID HNF3B PATHWAY | FOXA2 and FOXA3 transcription factor networks |
| 0.3 | 2.0 | SA PROGRAMMED CELL DEATH | Programmed cell death, or apoptosis, eliminates damaged or unneeded cells. |
| 0.3 | 17.2 | PID LYSOPHOSPHOLIPID PATHWAY | LPA receptor mediated events |
| 0.3 | 11.8 | PID HIV NEF PATHWAY | HIV-1 Nef: Negative effector of Fas and TNF-alpha |
| 0.3 | 6.9 | PID REELIN PATHWAY | Reelin signaling pathway |
| 0.3 | 7.1 | PID P75 NTR PATHWAY | p75(NTR)-mediated signaling |
| 0.2 | 3.8 | PID CIRCADIAN PATHWAY | Circadian rhythm pathway |
| 0.2 | 7.3 | PID UPA UPAR PATHWAY | Urokinase-type plasminogen activator (uPA) and uPAR-mediated signaling |
| 0.2 | 9.3 | PID HIF2PATHWAY | HIF-2-alpha transcription factor network |
| 0.2 | 13.2 | PID TRKR PATHWAY | Neurotrophic factor-mediated Trk receptor signaling |
| 0.2 | 4.6 | PID INTEGRIN A9B1 PATHWAY | Alpha9 beta1 integrin signaling events |
| 0.2 | 19.5 | PID PDGFRB PATHWAY | PDGFR-beta signaling pathway |
| 0.2 | 2.9 | PID ERBB1 DOWNSTREAM PATHWAY | ErbB1 downstream signaling |
| 0.2 | 6.1 | PID FGF PATHWAY | FGF signaling pathway |
| 0.2 | 2.8 | PID A6B1 A6B4 INTEGRIN PATHWAY | a6b1 and a6b4 Integrin signaling |
| 0.2 | 4.0 | SIG PIP3 SIGNALING IN B LYMPHOCYTES | Genes related to PIP3 signaling in B lymphocytes |
| 0.2 | 38.8 | NABA ECM REGULATORS | Genes encoding enzymes and their regulators involved in the remodeling of the extracellular matrix |
| 0.2 | 3.7 | PID HDAC CLASSIII PATHWAY | Signaling events mediated by HDAC Class III |
| 0.1 | 4.3 | PID ALPHA SYNUCLEIN PATHWAY | Alpha-synuclein signaling |
| 0.1 | 5.8 | PID PTP1B PATHWAY | Signaling events mediated by PTP1B |
| 0.1 | 1.2 | PID ENDOTHELIN PATHWAY | Endothelins |
| 0.1 | 0.6 | PID WNT NONCANONICAL PATHWAY | Noncanonical Wnt signaling pathway |
| 0.1 | 1.3 | PID TXA2PATHWAY | Thromboxane A2 receptor signaling |
| 0.1 | 1.8 | PID FRA PATHWAY | Validated transcriptional targets of AP1 family members Fra1 and Fra2 |
| 0.1 | 4.0 | PID HDAC CLASSI PATHWAY | Signaling events mediated by HDAC Class I |
| 0.1 | 1.7 | PID EPHB FWD PATHWAY | EPHB forward signaling |
| 0.1 | 0.4 | PID IL5 PATHWAY | IL5-mediated signaling events |
| 0.1 | 2.6 | PID FANCONI PATHWAY | Fanconi anemia pathway |
| 0.1 | 0.7 | PID CDC42 PATHWAY | CDC42 signaling events |
| 0.0 | 1.6 | PID CDC42 REG PATHWAY | Regulation of CDC42 activity |
| 0.0 | 1.0 | NABA CORE MATRISOME | Ensemble of genes encoding core extracellular matrix including ECM glycoproteins, collagens and proteoglycans |
| 0.0 | 13.5 | NABA MATRISOME ASSOCIATED | Ensemble of genes encoding ECM-associated proteins including ECM-affilaited proteins, ECM regulators and secreted factors |
| 0.0 | 1.8 | PID AR TF PATHWAY | Regulation of Androgen receptor activity |
| 0.0 | 0.4 | PID IL2 1PATHWAY | IL2-mediated signaling events |
| 0.0 | 0.5 | PID P38 ALPHA BETA PATHWAY | Regulation of p38-alpha and p38-beta |
| 0.0 | 0.2 | ST GA13 PATHWAY | G alpha 13 Pathway |
Gene overrepresentation in C2:CP:REACTOME category:
| Log-likelihood per target | Total log-likelihood | Term | Description |
|---|---|---|---|
| 6.1 | 110.1 | REACTOME NOREPINEPHRINE NEUROTRANSMITTER RELEASE CYCLE | Genes involved in Norepinephrine Neurotransmitter Release Cycle |
| 5.7 | 154.6 | REACTOME CS DS DEGRADATION | Genes involved in CS/DS degradation |
| 3.1 | 78.0 | REACTOME HDL MEDIATED LIPID TRANSPORT | Genes involved in HDL-mediated lipid transport |
| 2.8 | 181.3 | REACTOME SMOOTH MUSCLE CONTRACTION | Genes involved in Smooth Muscle Contraction |
| 2.5 | 37.6 | REACTOME REVERSIBLE HYDRATION OF CARBON DIOXIDE | Genes involved in Reversible Hydration of Carbon Dioxide |
| 2.5 | 67.0 | REACTOME BRANCHED CHAIN AMINO ACID CATABOLISM | Genes involved in Branched-chain amino acid catabolism |
| 2.0 | 40.0 | REACTOME ACTIVATION OF THE AP1 FAMILY OF TRANSCRIPTION FACTORS | Genes involved in Activation of the AP-1 family of transcription factors |
| 1.8 | 88.4 | REACTOME MYOGENESIS | Genes involved in Myogenesis |
| 1.5 | 33.7 | REACTOME OTHER SEMAPHORIN INTERACTIONS | Genes involved in Other semaphorin interactions |
| 1.3 | 13.2 | REACTOME DSCAM INTERACTIONS | Genes involved in DSCAM interactions |
| 1.3 | 65.0 | REACTOME COMPLEMENT CASCADE | Genes involved in Complement cascade |
| 1.3 | 32.9 | REACTOME ADHERENS JUNCTIONS INTERACTIONS | Genes involved in Adherens junctions interactions |
| 1.2 | 21.7 | REACTOME XENOBIOTICS | Genes involved in Xenobiotics |
| 1.1 | 35.8 | REACTOME TRANSFERRIN ENDOCYTOSIS AND RECYCLING | Genes involved in Transferrin endocytosis and recycling |
| 1.1 | 21.0 | REACTOME REGULATION OF RHEB GTPASE ACTIVITY BY AMPK | Genes involved in Regulation of Rheb GTPase activity by AMPK |
| 1.0 | 3.1 | REACTOME NEGATIVE REGULATION OF THE PI3K AKT NETWORK | Genes involved in Negative regulation of the PI3K/AKT network |
| 1.0 | 15.4 | REACTOME AKT PHOSPHORYLATES TARGETS IN THE CYTOSOL | Genes involved in AKT phosphorylates targets in the cytosol |
| 0.9 | 1.9 | REACTOME INSULIN RECEPTOR RECYCLING | Genes involved in Insulin receptor recycling |
| 0.9 | 11.2 | REACTOME ADENYLATE CYCLASE ACTIVATING PATHWAY | Genes involved in Adenylate cyclase activating pathway |
| 0.9 | 10.9 | REACTOME GLUTAMATE NEUROTRANSMITTER RELEASE CYCLE | Genes involved in Glutamate Neurotransmitter Release Cycle |
| 0.9 | 12.6 | REACTOME ANDROGEN BIOSYNTHESIS | Genes involved in Androgen biosynthesis |
| 0.8 | 9.8 | REACTOME ABACAVIR TRANSPORT AND METABOLISM | Genes involved in Abacavir transport and metabolism |
| 0.8 | 13.7 | REACTOME PRE NOTCH PROCESSING IN GOLGI | Genes involved in Pre-NOTCH Processing in Golgi |
| 0.8 | 24.6 | REACTOME GABA A RECEPTOR ACTIVATION | Genes involved in GABA A receptor activation |
| 0.8 | 26.9 | REACTOME CASPASE MEDIATED CLEAVAGE OF CYTOSKELETAL PROTEINS | Genes involved in Caspase-mediated cleavage of cytoskeletal proteins |
| 0.8 | 10.8 | REACTOME REGULATION OF GENE EXPRESSION IN BETA CELLS | Genes involved in Regulation of gene expression in beta cells |
| 0.7 | 19.1 | REACTOME KINESINS | Genes involved in Kinesins |
| 0.7 | 38.7 | REACTOME ION TRANSPORT BY P TYPE ATPASES | Genes involved in Ion transport by P-type ATPases |
| 0.7 | 6.4 | REACTOME RECYCLING OF BILE ACIDS AND SALTS | Genes involved in Recycling of bile acids and salts |
| 0.7 | 12.6 | REACTOME GAP JUNCTION ASSEMBLY | Genes involved in Gap junction assembly |
| 0.7 | 14.4 | REACTOME INHIBITION OF VOLTAGE GATED CA2 CHANNELS VIA GBETA GAMMA SUBUNITS | Genes involved in Inhibition of voltage gated Ca2+ channels via Gbeta/gamma subunits |
| 0.7 | 10.1 | REACTOME APOPTOTIC CLEAVAGE OF CELL ADHESION PROTEINS | Genes involved in Apoptotic cleavage of cell adhesion proteins |
| 0.7 | 21.7 | REACTOME INTERACTION BETWEEN L1 AND ANKYRINS | Genes involved in Interaction between L1 and Ankyrins |
| 0.6 | 26.0 | REACTOME CYTOCHROME P450 ARRANGED BY SUBSTRATE TYPE | Genes involved in Cytochrome P450 - arranged by substrate type |
| 0.6 | 18.7 | REACTOME AMINE COMPOUND SLC TRANSPORTERS | Genes involved in Amine compound SLC transporters |
| 0.6 | 3.7 | REACTOME SIGNALING BY EGFR IN CANCER | Genes involved in Signaling by EGFR in Cancer |
| 0.6 | 38.5 | REACTOME NCAM1 INTERACTIONS | Genes involved in NCAM1 interactions |
| 0.6 | 12.0 | REACTOME TRANSPORT OF ORGANIC ANIONS | Genes involved in Transport of organic anions |
| 0.6 | 10.4 | REACTOME IONOTROPIC ACTIVITY OF KAINATE RECEPTORS | Genes involved in Ionotropic activity of Kainate Receptors |
| 0.6 | 9.1 | REACTOME SYNTHESIS SECRETION AND DEACYLATION OF GHRELIN | Genes involved in Synthesis, Secretion, and Deacylation of Ghrelin |
| 0.6 | 8.4 | REACTOME ACYL CHAIN REMODELLING OF PG | Genes involved in Acyl chain remodelling of PG |
| 0.6 | 7.7 | REACTOME KERATAN SULFATE DEGRADATION | Genes involved in Keratan sulfate degradation |
| 0.5 | 3.8 | REACTOME INWARDLY RECTIFYING K CHANNELS | Genes involved in Inwardly rectifying K+ channels |
| 0.5 | 25.3 | REACTOME STRIATED MUSCLE CONTRACTION | Genes involved in Striated Muscle Contraction |
| 0.5 | 7.9 | REACTOME COMMON PATHWAY | Genes involved in Common Pathway |
| 0.5 | 10.4 | REACTOME SPRY REGULATION OF FGF SIGNALING | Genes involved in Spry regulation of FGF signaling |
| 0.5 | 20.5 | REACTOME OLFACTORY SIGNALING PATHWAY | Genes involved in Olfactory Signaling Pathway |
| 0.5 | 16.0 | REACTOME NOTCH1 INTRACELLULAR DOMAIN REGULATES TRANSCRIPTION | Genes involved in NOTCH1 Intracellular Domain Regulates Transcription |
| 0.5 | 1.4 | REACTOME DESTABILIZATION OF MRNA BY BRF1 | Genes involved in Destabilization of mRNA by Butyrate Response Factor 1 (BRF1) |
| 0.5 | 20.9 | REACTOME GLYCOLYSIS | Genes involved in Glycolysis |
| 0.4 | 11.2 | REACTOME TIE2 SIGNALING | Genes involved in Tie2 Signaling |
| 0.4 | 11.2 | REACTOME REGULATION OF INSULIN LIKE GROWTH FACTOR IGF ACTIVITY BY INSULIN LIKE GROWTH FACTOR BINDING PROTEINS IGFBPS | Genes involved in Regulation of Insulin-like Growth Factor (IGF) Activity by Insulin-like Growth Factor Binding Proteins (IGFBPs) |
| 0.4 | 9.4 | REACTOME SYNTHESIS OF PIPS AT THE GOLGI MEMBRANE | Genes involved in Synthesis of PIPs at the Golgi membrane |
| 0.4 | 3.5 | REACTOME GABA RECEPTOR ACTIVATION | Genes involved in GABA receptor activation |
| 0.4 | 18.2 | REACTOME EFFECTS OF PIP2 HYDROLYSIS | Genes involved in Effects of PIP2 hydrolysis |
| 0.4 | 44.0 | REACTOME TRANSPORT OF INORGANIC CATIONS ANIONS AND AMINO ACIDS OLIGOPEPTIDES | Genes involved in Transport of inorganic cations/anions and amino acids/oligopeptides |
| 0.4 | 11.1 | REACTOME G BETA GAMMA SIGNALLING THROUGH PI3KGAMMA | Genes involved in G beta:gamma signalling through PI3Kgamma |
| 0.4 | 6.1 | REACTOME CLASS C 3 METABOTROPIC GLUTAMATE PHEROMONE RECEPTORS | Genes involved in Class C/3 (Metabotropic glutamate/pheromone receptors) |
| 0.4 | 5.6 | REACTOME TRYPTOPHAN CATABOLISM | Genes involved in Tryptophan catabolism |
| 0.4 | 4.0 | REACTOME G PROTEIN ACTIVATION | Genes involved in G-protein activation |
| 0.4 | 8.4 | REACTOME ACTIVATION OF BH3 ONLY PROTEINS | Genes involved in Activation of BH3-only proteins |
| 0.4 | 4.3 | REACTOME DEVELOPMENTAL BIOLOGY | Genes involved in Developmental Biology |
| 0.4 | 3.5 | REACTOME SYNTHESIS SECRETION AND INACTIVATION OF GLP1 | Genes involved in Synthesis, Secretion, and Inactivation of Glucagon-like Peptide-1 (GLP-1) |
| 0.4 | 8.5 | REACTOME MITOCHONDRIAL TRNA AMINOACYLATION | Genes involved in Mitochondrial tRNA aminoacylation |
| 0.4 | 4.2 | REACTOME IRAK1 RECRUITS IKK COMPLEX | Genes involved in IRAK1 recruits IKK complex |
| 0.4 | 2.8 | REACTOME GAMMA CARBOXYLATION TRANSPORT AND AMINO TERMINAL CLEAVAGE OF PROTEINS | Genes involved in Gamma-carboxylation, transport, and amino-terminal cleavage of proteins |
| 0.3 | 2.7 | REACTOME REGULATION OF BETA CELL DEVELOPMENT | Genes involved in Regulation of beta-cell development |
| 0.3 | 11.5 | REACTOME HS GAG BIOSYNTHESIS | Genes involved in HS-GAG biosynthesis |
| 0.3 | 5.1 | REACTOME FGFR2C LIGAND BINDING AND ACTIVATION | Genes involved in FGFR2c ligand binding and activation |
| 0.3 | 4.1 | REACTOME SEROTONIN RECEPTORS | Genes involved in Serotonin receptors |
| 0.3 | 3.7 | REACTOME LIPOPROTEIN METABOLISM | Genes involved in Lipoprotein metabolism |
| 0.3 | 7.7 | REACTOME POST CHAPERONIN TUBULIN FOLDING PATHWAY | Genes involved in Post-chaperonin tubulin folding pathway |
| 0.3 | 15.1 | REACTOME NITRIC OXIDE STIMULATES GUANYLATE CYCLASE | Genes involved in Nitric oxide stimulates guanylate cyclase |
| 0.3 | 11.5 | REACTOME ELONGATION ARREST AND RECOVERY | Genes involved in Elongation arrest and recovery |
| 0.2 | 4.9 | REACTOME EGFR DOWNREGULATION | Genes involved in EGFR downregulation |
| 0.2 | 21.2 | REACTOME INTEGRIN CELL SURFACE INTERACTIONS | Genes involved in Integrin cell surface interactions |
| 0.2 | 5.5 | REACTOME CRMPS IN SEMA3A SIGNALING | Genes involved in CRMPs in Sema3A signaling |
| 0.2 | 2.4 | REACTOME STEROID HORMONES | Genes involved in Steroid hormones |
| 0.2 | 7.3 | REACTOME SULFUR AMINO ACID METABOLISM | Genes involved in Sulfur amino acid metabolism |
| 0.2 | 21.4 | REACTOME NUCLEAR RECEPTOR TRANSCRIPTION PATHWAY | Genes involved in Nuclear Receptor transcription pathway |
| 0.2 | 17.7 | REACTOME AMYLOIDS | Genes involved in Amyloids |
| 0.2 | 20.9 | REACTOME CLASS B 2 SECRETIN FAMILY RECEPTORS | Genes involved in Class B/2 (Secretin family receptors) |
| 0.2 | 3.4 | REACTOME GLUCONEOGENESIS | Genes involved in Gluconeogenesis |
| 0.2 | 35.8 | REACTOME G ALPHA Q SIGNALLING EVENTS | Genes involved in G alpha (q) signalling events |
| 0.2 | 6.9 | REACTOME NCAM SIGNALING FOR NEURITE OUT GROWTH | Genes involved in NCAM signaling for neurite out-growth |
| 0.2 | 7.0 | REACTOME DEGRADATION OF THE EXTRACELLULAR MATRIX | Genes involved in Degradation of the extracellular matrix |
| 0.2 | 2.9 | REACTOME P38MAPK EVENTS | Genes involved in p38MAPK events |
| 0.2 | 3.5 | REACTOME SYNTHESIS OF PA | Genes involved in Synthesis of PA |
| 0.2 | 0.4 | REACTOME ALPHA LINOLENIC ACID ALA METABOLISM | Genes involved in alpha-linolenic acid (ALA) metabolism |
| 0.2 | 6.7 | REACTOME GLUTATHIONE CONJUGATION | Genes involved in Glutathione conjugation |
| 0.2 | 5.5 | REACTOME ABC FAMILY PROTEINS MEDIATED TRANSPORT | Genes involved in ABC-family proteins mediated transport |
| 0.2 | 5.9 | REACTOME SEMA4D INDUCED CELL MIGRATION AND GROWTH CONE COLLAPSE | Genes involved in Sema4D induced cell migration and growth-cone collapse |
| 0.2 | 3.2 | REACTOME TERMINATION OF O GLYCAN BIOSYNTHESIS | Genes involved in Termination of O-glycan biosynthesis |
| 0.2 | 7.0 | REACTOME TRAFFICKING OF AMPA RECEPTORS | Genes involved in Trafficking of AMPA receptors |
| 0.2 | 2.7 | REACTOME PRESYNAPTIC NICOTINIC ACETYLCHOLINE RECEPTORS | Genes involved in Presynaptic nicotinic acetylcholine receptors |
| 0.1 | 1.2 | REACTOME G ALPHA Z SIGNALLING EVENTS | Genes involved in G alpha (z) signalling events |
| 0.1 | 2.9 | REACTOME MEIOSIS | Genes involved in Meiosis |
| 0.1 | 6.7 | REACTOME VOLTAGE GATED POTASSIUM CHANNELS | Genes involved in Voltage gated Potassium channels |
| 0.1 | 1.6 | REACTOME AMINE LIGAND BINDING RECEPTORS | Genes involved in Amine ligand-binding receptors |
| 0.1 | 4.6 | REACTOME CELL CELL JUNCTION ORGANIZATION | Genes involved in Cell-cell junction organization |
| 0.1 | 1.1 | REACTOME ROLE OF DCC IN REGULATING APOPTOSIS | Genes involved in Role of DCC in regulating apoptosis |
| 0.1 | 1.1 | REACTOME GAP JUNCTION TRAFFICKING | Genes involved in Gap junction trafficking |
| 0.1 | 5.7 | REACTOME G ALPHA S SIGNALLING EVENTS | Genes involved in G alpha (s) signalling events |
| 0.1 | 2.2 | REACTOME PHASE1 FUNCTIONALIZATION OF COMPOUNDS | Genes involved in Phase 1 - Functionalization of compounds |
| 0.1 | 2.0 | REACTOME FACILITATIVE NA INDEPENDENT GLUCOSE TRANSPORTERS | Genes involved in Facilitative Na+-independent glucose transporters |
| 0.1 | 4.1 | REACTOME SIGNALING BY BMP | Genes involved in Signaling by BMP |
| 0.1 | 1.1 | REACTOME IRON UPTAKE AND TRANSPORT | Genes involved in Iron uptake and transport |
| 0.1 | 2.6 | REACTOME SPHINGOLIPID DE NOVO BIOSYNTHESIS | Genes involved in Sphingolipid de novo biosynthesis |
| 0.1 | 0.8 | REACTOME REGULATORY RNA PATHWAYS | Genes involved in Regulatory RNA pathways |
| 0.1 | 0.9 | REACTOME CD28 DEPENDENT VAV1 PATHWAY | Genes involved in CD28 dependent Vav1 pathway |
| 0.1 | 1.5 | REACTOME SYNTHESIS OF GLYCOSYLPHOSPHATIDYLINOSITOL GPI | Genes involved in Synthesis of glycosylphosphatidylinositol (GPI) |
| 0.1 | 1.2 | REACTOME ACTIVATION OF CHAPERONES BY ATF6 ALPHA | Genes involved in Activation of Chaperones by ATF6-alpha |
| 0.1 | 0.4 | REACTOME PRE NOTCH EXPRESSION AND PROCESSING | Genes involved in Pre-NOTCH Expression and Processing |
| 0.0 | 0.5 | REACTOME DIGESTION OF DIETARY CARBOHYDRATE | Genes involved in Digestion of dietary carbohydrate |
| 0.0 | 0.9 | REACTOME EXTRINSIC PATHWAY FOR APOPTOSIS | Genes involved in Extrinsic Pathway for Apoptosis |
| 0.0 | 0.7 | REACTOME GLUCURONIDATION | Genes involved in Glucuronidation |
| 0.0 | 0.4 | REACTOME AMINE DERIVED HORMONES | Genes involved in Amine-derived hormones |
| 0.0 | 0.0 | REACTOME ROLE OF SECOND MESSENGERS IN NETRIN1 SIGNALING | Genes involved in Role of second messengers in netrin-1 signaling |