Project
GNF SymAtlas + NCI-60 cancer cell lines, comparison of cancers vs non-cancers, human (Su, 2004; Ross, 2000)
Navigation
Downloads
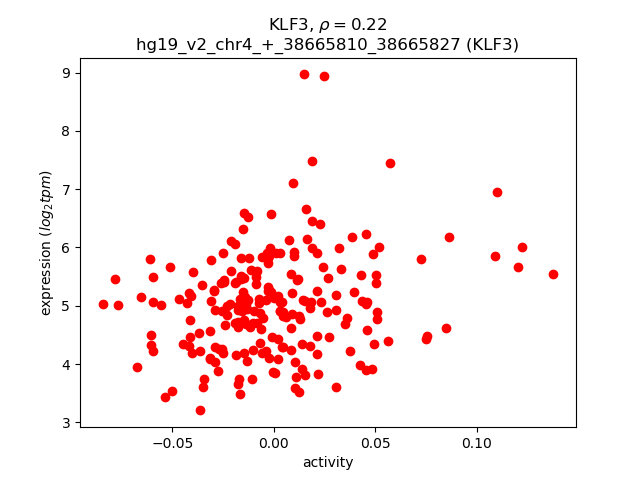
Results for KLF3
Z-value: 0.31
Motif logo

Transcription factors associated with KLF3
| Gene Symbol | Gene ID | Gene Info |
|---|---|---|
|
KLF3
|
ENSG00000109787.8 | Kruppel like factor 3 |
Activity-expression correlation:
| Gene | Promoter | Pearson corr. coef. | P-value | Plot |
|---|---|---|---|---|
| KLF3 | hg19_v2_chr4_+_38665810_38665827 | 0.22 | 8.5e-04 | Click! |
Activity profile of KLF3 motif
Sorted Z-values of KLF3 motif
| Promoter | Log-likelihood | Transcript | Gene | Gene Info |
|---|---|---|---|---|
| chr11_-_72432950 | 11.64 |
ENST00000426523.1
ENST00000429686.1 |
ARAP1
|
ArfGAP with RhoGAP domain, ankyrin repeat and PH domain 1 |
| chr19_-_10464570 | 8.01 |
ENST00000529739.1
|
TYK2
|
tyrosine kinase 2 |
| chrX_-_71526741 | 7.04 |
ENST00000454225.1
|
CITED1
|
Cbp/p300-interacting transactivator, with Glu/Asp-rich carboxy-terminal domain, 1 |
| chr6_-_35109080 | 6.92 |
ENST00000486638.1
ENST00000505400.1 ENST00000412155.2 ENST00000373979.2 ENST00000507706.1 ENST00000444780.2 ENST00000492680.2 |
TCP11
|
t-complex 11, testis-specific |
| chr6_-_33048483 | 6.49 |
ENST00000419277.1
|
HLA-DPA1
|
major histocompatibility complex, class II, DP alpha 1 |
| chr16_-_11370330 | 6.40 |
ENST00000241808.4
ENST00000435245.2 |
PRM2
|
protamine 2 |
| chr6_-_32498046 | 6.30 |
ENST00000374975.3
|
HLA-DRB5
|
major histocompatibility complex, class II, DR beta 5 |
| chr19_+_49838653 | 6.18 |
ENST00000598095.1
ENST00000426897.2 ENST00000323906.4 ENST00000535669.2 ENST00000597602.1 ENST00000595660.1 |
CD37
|
CD37 molecule |
| chr11_+_117857063 | 6.18 |
ENST00000227752.3
ENST00000541785.1 ENST00000545409.1 |
IL10RA
|
interleukin 10 receptor, alpha |
| chr1_-_160681593 | 6.06 |
ENST00000368045.3
ENST00000368046.3 |
CD48
|
CD48 molecule |
| chr2_+_71295733 | 5.70 |
ENST00000443938.2
ENST00000244204.6 |
NAGK
|
N-acetylglucosamine kinase |
| chr20_+_30639991 | 5.65 |
ENST00000534862.1
ENST00000538448.1 ENST00000375862.2 |
HCK
|
hemopoietic cell kinase |
| chr19_+_1067271 | 5.37 |
ENST00000536472.1
ENST00000590214.1 |
HMHA1
|
histocompatibility (minor) HA-1 |
| chr2_+_71295717 | 5.27 |
ENST00000418807.3
ENST00000443872.2 |
NAGK
|
N-acetylglucosamine kinase |
| chrX_-_71526813 | 5.22 |
ENST00000246139.5
|
CITED1
|
Cbp/p300-interacting transactivator, with Glu/Asp-rich carboxy-terminal domain, 1 |
| chr19_-_13213662 | 5.19 |
ENST00000264824.4
|
LYL1
|
lymphoblastic leukemia derived sequence 1 |
| chrX_-_71526999 | 5.15 |
ENST00000453707.2
ENST00000373619.3 |
CITED1
|
Cbp/p300-interacting transactivator, with Glu/Asp-rich carboxy-terminal domain, 1 |
| chr9_+_100174344 | 5.09 |
ENST00000422139.2
|
TDRD7
|
tudor domain containing 7 |
| chr17_+_42427826 | 5.08 |
ENST00000586443.1
|
GRN
|
granulin |
| chr16_-_68033356 | 5.01 |
ENST00000393847.1
ENST00000573808.1 ENST00000572624.1 |
DPEP2
|
dipeptidase 2 |
| chr7_-_150497621 | 4.99 |
ENST00000434545.1
|
TMEM176B
|
transmembrane protein 176B |
| chr12_-_13256593 | 4.94 |
ENST00000542415.1
ENST00000324458.8 |
GSG1
|
germ cell associated 1 |
| chr11_-_5248294 | 4.88 |
ENST00000335295.4
|
HBB
|
hemoglobin, beta |
| chr22_-_51017084 | 4.88 |
ENST00000360719.2
ENST00000457250.1 ENST00000440709.1 |
CPT1B
|
carnitine palmitoyltransferase 1B (muscle) |
| chrX_-_52260199 | 4.84 |
ENST00000375600.1
|
XAGE1A
|
X antigen family, member 1A |
| chr6_+_144471643 | 4.84 |
ENST00000367568.4
|
STX11
|
syntaxin 11 |
| chr20_+_55966444 | 4.84 |
ENST00000356208.5
ENST00000440234.2 |
RBM38
|
RNA binding motif protein 38 |
| chrX_+_52511925 | 4.71 |
ENST00000375588.1
|
XAGE1C
|
X antigen family, member 1C |
| chr11_-_64512273 | 4.70 |
ENST00000377497.3
ENST00000377487.1 ENST00000430645.1 |
RASGRP2
|
RAS guanyl releasing protein 2 (calcium and DAG-regulated) |
| chr17_+_33914460 | 4.68 |
ENST00000537622.2
|
AP2B1
|
adaptor-related protein complex 2, beta 1 subunit |
| chr5_-_149492904 | 4.66 |
ENST00000286301.3
ENST00000511344.1 |
CSF1R
|
colony stimulating factor 1 receptor |
| chr16_+_1578674 | 4.65 |
ENST00000253934.5
|
TMEM204
|
transmembrane protein 204 |
| chr7_+_73623717 | 4.63 |
ENST00000344995.5
ENST00000460943.1 |
LAT2
|
linker for activation of T cells family, member 2 |
| chr12_+_111843749 | 4.62 |
ENST00000341259.2
|
SH2B3
|
SH2B adaptor protein 3 |
| chrX_-_52533139 | 4.61 |
ENST00000374959.3
|
XAGE1D
|
X antigen family, member 1D |
| chr12_-_13256571 | 4.58 |
ENST00000545401.1
ENST00000432710.2 ENST00000351606.6 |
GSG1
|
germ cell associated 1 |
| chr19_+_14492247 | 4.42 |
ENST00000357355.3
ENST00000592261.2 ENST00000242786.5 |
CD97
|
CD97 molecule |
| chr17_-_76870126 | 4.41 |
ENST00000586057.1
|
TIMP2
|
TIMP metallopeptidase inhibitor 2 |
| chr6_-_35109145 | 4.39 |
ENST00000373974.4
ENST00000244645.3 |
TCP11
|
t-complex 11, testis-specific |
| chr11_+_121447469 | 4.36 |
ENST00000532694.1
ENST00000534286.1 |
SORL1
|
sortilin-related receptor, L(DLR class) A repeats containing |
| chr2_+_37571717 | 4.33 |
ENST00000338415.3
ENST00000404976.1 |
QPCT
|
glutaminyl-peptide cyclotransferase |
| chr1_+_2004901 | 4.20 |
ENST00000400921.2
|
PRKCZ
|
protein kinase C, zeta |
| chrX_-_47489244 | 4.17 |
ENST00000469388.1
ENST00000396992.3 ENST00000377005.2 |
CFP
|
complement factor properdin |
| chr17_+_33914276 | 4.14 |
ENST00000592545.1
ENST00000538556.1 ENST00000312678.8 ENST00000589344.1 |
AP2B1
|
adaptor-related protein complex 2, beta 1 subunit |
| chr4_-_90757364 | 4.12 |
ENST00000508895.1
|
SNCA
|
synuclein, alpha (non A4 component of amyloid precursor) |
| chr17_-_26876350 | 4.05 |
ENST00000470125.1
|
UNC119
|
unc-119 homolog (C. elegans) |
| chr7_+_150497569 | 4.03 |
ENST00000004103.3
|
TMEM176A
|
transmembrane protein 176A |
| chr19_-_4455290 | 4.03 |
ENST00000394765.3
ENST00000592515.1 |
UBXN6
|
UBX domain protein 6 |
| chr2_+_37571845 | 4.02 |
ENST00000537448.1
|
QPCT
|
glutaminyl-peptide cyclotransferase |
| chrX_-_52546033 | 4.00 |
ENST00000375567.3
|
XAGE1E
|
X antigen family, member 1E |
| chr10_-_73611046 | 3.82 |
ENST00000394934.1
ENST00000394936.3 |
PSAP
|
prosaposin |
| chr7_-_150498426 | 3.72 |
ENST00000447204.2
|
TMEM176B
|
transmembrane protein 176B |
| chr19_+_36195467 | 3.71 |
ENST00000426659.2
|
ZBTB32
|
zinc finger and BTB domain containing 32 |
| chr22_-_51016846 | 3.71 |
ENST00000312108.7
ENST00000395650.2 |
CPT1B
|
carnitine palmitoyltransferase 1B (muscle) |
| chr7_-_2272566 | 3.66 |
ENST00000402746.1
ENST00000265854.7 ENST00000429779.1 ENST00000399654.2 |
MAD1L1
|
MAD1 mitotic arrest deficient-like 1 (yeast) |
| chr7_+_150434430 | 3.57 |
ENST00000358647.3
|
GIMAP5
|
GTPase, IMAP family member 5 |
| chr5_-_176433693 | 3.57 |
ENST00000507513.1
ENST00000511320.1 |
UIMC1
|
ubiquitin interaction motif containing 1 |
| chr11_-_2906979 | 3.53 |
ENST00000380725.1
ENST00000313407.6 ENST00000430149.2 ENST00000440480.2 ENST00000414822.3 |
CDKN1C
|
cyclin-dependent kinase inhibitor 1C (p57, Kip2) |
| chr7_+_150497491 | 3.52 |
ENST00000484928.1
|
TMEM176A
|
transmembrane protein 176A |
| chr19_+_12902289 | 3.47 |
ENST00000302754.4
|
JUNB
|
jun B proto-oncogene |
| chr5_-_176433582 | 3.41 |
ENST00000506128.1
|
UIMC1
|
ubiquitin interaction motif containing 1 |
| chr17_+_7452336 | 3.37 |
ENST00000293826.4
|
TNFSF12-TNFSF13
|
TNFSF12-TNFSF13 readthrough |
| chr16_+_85061367 | 3.36 |
ENST00000538274.1
ENST00000258180.3 |
KIAA0513
|
KIAA0513 |
| chr11_-_64511575 | 3.36 |
ENST00000431822.1
ENST00000377486.3 ENST00000394432.3 |
RASGRP2
|
RAS guanyl releasing protein 2 (calcium and DAG-regulated) |
| chr22_-_50964558 | 3.34 |
ENST00000535425.1
ENST00000439934.1 |
SCO2
|
SCO2 cytochrome c oxidase assembly protein |
| chr19_-_10450328 | 3.28 |
ENST00000160262.5
|
ICAM3
|
intercellular adhesion molecule 3 |
| chr1_+_38022572 | 3.23 |
ENST00000541606.1
|
DNALI1
|
dynein, axonemal, light intermediate chain 1 |
| chr22_-_26961328 | 3.22 |
ENST00000398110.2
|
TPST2
|
tyrosylprotein sulfotransferase 2 |
| chr8_+_22436635 | 3.20 |
ENST00000452226.1
ENST00000397760.4 ENST00000339162.7 ENST00000397761.2 |
PDLIM2
|
PDZ and LIM domain 2 (mystique) |
| chr5_-_150521192 | 3.17 |
ENST00000523714.1
ENST00000521749.1 |
ANXA6
|
annexin A6 |
| chr11_-_5531215 | 3.16 |
ENST00000311659.4
|
UBQLN3
|
ubiquilin 3 |
| chr19_-_10450287 | 3.15 |
ENST00000589261.1
ENST00000590569.1 ENST00000589580.1 ENST00000589249.1 |
ICAM3
|
intercellular adhesion molecule 3 |
| chr19_+_1941117 | 3.15 |
ENST00000255641.8
|
CSNK1G2
|
casein kinase 1, gamma 2 |
| chr3_-_49449350 | 3.15 |
ENST00000454011.2
ENST00000445425.1 ENST00000422781.1 |
RHOA
|
ras homolog family member A |
| chr8_-_134115118 | 3.14 |
ENST00000395352.3
ENST00000338087.5 |
SLA
|
Src-like-adaptor |
| chr12_+_116997186 | 3.13 |
ENST00000306985.4
|
MAP1LC3B2
|
microtubule-associated protein 1 light chain 3 beta 2 |
| chr11_-_64512803 | 3.08 |
ENST00000377489.1
ENST00000354024.3 |
RASGRP2
|
RAS guanyl releasing protein 2 (calcium and DAG-regulated) |
| chr3_+_186648307 | 3.02 |
ENST00000457772.2
ENST00000455441.1 ENST00000427315.1 |
ST6GAL1
|
ST6 beta-galactosamide alpha-2,6-sialyltranferase 1 |
| chr1_+_114471809 | 3.02 |
ENST00000426820.2
|
HIPK1
|
homeodomain interacting protein kinase 1 |
| chr19_-_10227503 | 2.99 |
ENST00000593054.1
|
EIF3G
|
eukaryotic translation initiation factor 3, subunit G |
| chr8_-_21771214 | 2.98 |
ENST00000276420.4
|
DOK2
|
docking protein 2, 56kDa |
| chr3_+_49449636 | 2.97 |
ENST00000273590.3
|
TCTA
|
T-cell leukemia translocation altered |
| chr16_-_67514982 | 2.96 |
ENST00000565835.1
ENST00000540149.1 ENST00000290949.3 |
ATP6V0D1
|
ATPase, H+ transporting, lysosomal 38kDa, V0 subunit d1 |
| chr10_+_94451574 | 2.93 |
ENST00000492654.2
|
HHEX
|
hematopoietically expressed homeobox |
| chr5_-_176433350 | 2.92 |
ENST00000377227.4
ENST00000377219.2 |
UIMC1
|
ubiquitin interaction motif containing 1 |
| chr16_+_8715536 | 2.91 |
ENST00000563958.1
ENST00000381920.3 ENST00000564554.1 |
METTL22
|
methyltransferase like 22 |
| chr12_-_96390063 | 2.90 |
ENST00000541929.1
|
HAL
|
histidine ammonia-lyase |
| chr11_-_2323290 | 2.85 |
ENST00000381153.3
|
C11orf21
|
chromosome 11 open reading frame 21 |
| chr2_-_85637459 | 2.82 |
ENST00000409921.1
|
CAPG
|
capping protein (actin filament), gelsolin-like |
| chr12_-_13248562 | 2.82 |
ENST00000457134.2
ENST00000537302.1 |
GSG1
|
germ cell associated 1 |
| chr5_+_135385202 | 2.79 |
ENST00000514554.1
|
TGFBI
|
transforming growth factor, beta-induced, 68kDa |
| chr1_+_25870070 | 2.76 |
ENST00000374338.4
|
LDLRAP1
|
low density lipoprotein receptor adaptor protein 1 |
| chr22_+_35776828 | 2.76 |
ENST00000216117.8
|
HMOX1
|
heme oxygenase (decycling) 1 |
| chr11_+_65407331 | 2.74 |
ENST00000527525.1
|
SIPA1
|
signal-induced proliferation-associated 1 |
| chr15_+_91427642 | 2.73 |
ENST00000328850.3
ENST00000414248.2 |
FES
|
feline sarcoma oncogene |
| chr19_+_41313017 | 2.72 |
ENST00000595621.1
ENST00000595051.1 |
EGLN2
|
egl-9 family hypoxia-inducible factor 2 |
| chr11_+_1874200 | 2.68 |
ENST00000311604.3
|
LSP1
|
lymphocyte-specific protein 1 |
| chr19_+_14491948 | 2.65 |
ENST00000358600.3
|
CD97
|
CD97 molecule |
| chr15_+_75074410 | 2.61 |
ENST00000439220.2
|
CSK
|
c-src tyrosine kinase |
| chr8_-_21771182 | 2.57 |
ENST00000523932.1
ENST00000544659.1 |
DOK2
|
docking protein 2, 56kDa |
| chr2_+_68592305 | 2.57 |
ENST00000234313.7
|
PLEK
|
pleckstrin |
| chr6_-_41254403 | 2.56 |
ENST00000589614.1
ENST00000334475.6 ENST00000591620.1 ENST00000244709.4 |
TREM1
|
triggering receptor expressed on myeloid cells 1 |
| chr1_-_28520447 | 2.54 |
ENST00000539896.1
|
PTAFR
|
platelet-activating factor receptor |
| chr15_+_81589254 | 2.54 |
ENST00000394652.2
|
IL16
|
interleukin 16 |
| chr19_+_17337406 | 2.54 |
ENST00000597836.1
|
OCEL1
|
occludin/ELL domain containing 1 |
| chr19_+_50321528 | 2.52 |
ENST00000312865.6
ENST00000595185.1 ENST00000538643.1 |
MED25
|
mediator complex subunit 25 |
| chr4_+_2845547 | 2.49 |
ENST00000264758.7
ENST00000446856.1 ENST00000398125.1 |
ADD1
|
adducin 1 (alpha) |
| chr3_-_49449521 | 2.48 |
ENST00000431929.1
ENST00000418115.1 |
RHOA
|
ras homolog family member A |
| chr3_+_20081515 | 2.46 |
ENST00000263754.4
|
KAT2B
|
K(lysine) acetyltransferase 2B |
| chr12_-_118797475 | 2.46 |
ENST00000541786.1
ENST00000419821.2 ENST00000541878.1 |
TAOK3
|
TAO kinase 3 |
| chr14_-_106406090 | 2.45 |
ENST00000390593.2
|
IGHV6-1
|
immunoglobulin heavy variable 6-1 |
| chr2_-_85645545 | 2.42 |
ENST00000409275.1
|
CAPG
|
capping protein (actin filament), gelsolin-like |
| chr19_+_36195429 | 2.42 |
ENST00000392197.2
|
ZBTB32
|
zinc finger and BTB domain containing 32 |
| chr5_+_75699149 | 2.40 |
ENST00000379730.3
|
IQGAP2
|
IQ motif containing GTPase activating protein 2 |
| chr5_+_134074191 | 2.39 |
ENST00000297156.2
|
CAMLG
|
calcium modulating ligand |
| chr3_-_122512619 | 2.37 |
ENST00000383659.1
ENST00000306103.2 |
HSPBAP1
|
HSPB (heat shock 27kDa) associated protein 1 |
| chr8_-_101963482 | 2.37 |
ENST00000419477.2
|
YWHAZ
|
tyrosine 3-monooxygenase/tryptophan 5-monooxygenase activation protein, zeta |
| chr3_+_54156664 | 2.32 |
ENST00000474759.1
ENST00000288197.5 |
CACNA2D3
|
calcium channel, voltage-dependent, alpha 2/delta subunit 3 |
| chrX_-_153599578 | 2.32 |
ENST00000360319.4
ENST00000344736.4 |
FLNA
|
filamin A, alpha |
| chr18_+_61554932 | 2.32 |
ENST00000299502.4
ENST00000457692.1 ENST00000413956.1 |
SERPINB2
|
serpin peptidase inhibitor, clade B (ovalbumin), member 2 |
| chr15_+_81591757 | 2.31 |
ENST00000558332.1
|
IL16
|
interleukin 16 |
| chr12_-_54121261 | 2.31 |
ENST00000549784.1
ENST00000262059.4 |
CALCOCO1
|
calcium binding and coiled-coil domain 1 |
| chr8_+_22436248 | 2.30 |
ENST00000308354.7
|
PDLIM2
|
PDZ and LIM domain 2 (mystique) |
| chr5_-_169725231 | 2.28 |
ENST00000046794.5
|
LCP2
|
lymphocyte cytosolic protein 2 (SH2 domain containing leukocyte protein of 76kDa) |
| chr15_+_91427691 | 2.25 |
ENST00000559355.1
ENST00000394302.1 |
FES
|
feline sarcoma oncogene |
| chr11_+_65647280 | 2.25 |
ENST00000307886.3
ENST00000528419.1 ENST00000526034.1 |
CTSW
|
cathepsin W |
| chr14_-_74960030 | 2.25 |
ENST00000553490.1
ENST00000557510.1 |
NPC2
|
Niemann-Pick disease, type C2 |
| chr14_-_74959994 | 2.25 |
ENST00000238633.2
ENST00000434013.2 |
NPC2
|
Niemann-Pick disease, type C2 |
| chr5_+_134074231 | 2.24 |
ENST00000514518.1
|
CAMLG
|
calcium modulating ligand |
| chr14_-_74959978 | 2.23 |
ENST00000541064.1
|
NPC2
|
Niemann-Pick disease, type C2 |
| chrX_-_52260355 | 2.13 |
ENST00000375602.1
ENST00000399800.3 |
XAGE1A
|
X antigen family, member 1A |
| chr12_+_117013656 | 2.12 |
ENST00000556529.1
|
MAP1LC3B2
|
microtubule-associated protein 1 light chain 3 beta 2 |
| chr5_+_96038476 | 2.11 |
ENST00000511049.1
ENST00000309190.5 ENST00000510156.1 ENST00000509903.1 ENST00000511782.1 ENST00000504465.1 |
CAST
|
calpastatin |
| chr11_-_414948 | 2.10 |
ENST00000530494.1
ENST00000528209.1 ENST00000431843.2 ENST00000528058.1 |
SIGIRR
|
single immunoglobulin and toll-interleukin 1 receptor (TIR) domain |
| chr11_-_72433346 | 2.08 |
ENST00000334211.8
|
ARAP1
|
ArfGAP with RhoGAP domain, ankyrin repeat and PH domain 1 |
| chr3_+_54156570 | 2.07 |
ENST00000415676.2
|
CACNA2D3
|
calcium channel, voltage-dependent, alpha 2/delta subunit 3 |
| chr7_-_150974494 | 2.07 |
ENST00000392811.2
|
SMARCD3
|
SWI/SNF related, matrix associated, actin dependent regulator of chromatin, subfamily d, member 3 |
| chr21_-_38445443 | 2.03 |
ENST00000360525.4
|
PIGP
|
phosphatidylinositol glycan anchor biosynthesis, class P |
| chr19_-_40971667 | 2.03 |
ENST00000263368.4
|
BLVRB
|
biliverdin reductase B (flavin reductase (NADPH)) |
| chr1_+_207494853 | 2.02 |
ENST00000367064.3
ENST00000367063.2 ENST00000391921.4 ENST00000367067.4 ENST00000314754.8 ENST00000367065.5 ENST00000391920.4 ENST00000367062.4 ENST00000343420.6 |
CD55
|
CD55 molecule, decay accelerating factor for complement (Cromer blood group) |
| chrX_+_52511761 | 1.99 |
ENST00000399795.3
ENST00000375589.1 |
XAGE1C
|
X antigen family, member 1C |
| chr17_+_2699697 | 1.99 |
ENST00000254695.8
ENST00000366401.4 ENST00000542807.1 |
RAP1GAP2
|
RAP1 GTPase activating protein 2 |
| chr1_+_114471972 | 1.99 |
ENST00000369559.4
ENST00000369554.2 |
HIPK1
|
homeodomain interacting protein kinase 1 |
| chrX_-_151938171 | 1.97 |
ENST00000393902.3
ENST00000417212.1 ENST00000370278.3 |
MAGEA3
|
melanoma antigen family A, 3 |
| chr22_+_40573921 | 1.96 |
ENST00000454349.2
ENST00000335727.9 |
TNRC6B
|
trinucleotide repeat containing 6B |
| chr12_-_49504655 | 1.96 |
ENST00000551782.1
ENST00000267102.8 |
LMBR1L
|
limb development membrane protein 1-like |
| chr12_+_29302119 | 1.95 |
ENST00000536681.3
|
FAR2
|
fatty acyl CoA reductase 2 |
| chr12_-_57522813 | 1.93 |
ENST00000556155.1
|
STAT6
|
signal transducer and activator of transcription 6, interleukin-4 induced |
| chr7_+_100450328 | 1.92 |
ENST00000540482.1
ENST00000418037.1 ENST00000428758.1 ENST00000275729.3 ENST00000415287.1 ENST00000354161.3 ENST00000416675.1 |
SLC12A9
|
solute carrier family 12, member 9 |
| chr21_-_38445297 | 1.92 |
ENST00000430792.1
ENST00000399103.1 |
PIGP
|
phosphatidylinositol glycan anchor biosynthesis, class P |
| chr14_-_24711865 | 1.90 |
ENST00000399423.4
ENST00000267415.7 |
TINF2
|
TERF1 (TRF1)-interacting nuclear factor 2 |
| chr19_-_47616992 | 1.90 |
ENST00000253048.5
|
ZC3H4
|
zinc finger CCCH-type containing 4 |
| chr8_-_101962777 | 1.89 |
ENST00000395951.3
|
YWHAZ
|
tyrosine 3-monooxygenase/tryptophan 5-monooxygenase activation protein, zeta |
| chrX_-_152486108 | 1.89 |
ENST00000356661.5
|
MAGEA1
|
melanoma antigen family A, 1 (directs expression of antigen MZ2-E) |
| chr14_-_24711470 | 1.87 |
ENST00000559969.1
|
TINF2
|
TERF1 (TRF1)-interacting nuclear factor 2 |
| chr12_-_54121212 | 1.86 |
ENST00000548263.1
ENST00000430117.2 ENST00000550804.1 ENST00000549173.1 ENST00000551900.1 ENST00000546619.1 ENST00000548177.1 ENST00000549349.1 |
CALCOCO1
|
calcium binding and coiled-coil domain 1 |
| chr6_-_133035185 | 1.85 |
ENST00000367928.4
|
VNN1
|
vanin 1 |
| chr11_+_59480899 | 1.84 |
ENST00000300150.7
|
STX3
|
syntaxin 3 |
| chr3_-_50383096 | 1.83 |
ENST00000442887.1
ENST00000360165.3 |
ZMYND10
|
zinc finger, MYND-type containing 10 |
| chr13_-_46961580 | 1.83 |
ENST00000378787.3
ENST00000378797.2 ENST00000429979.1 ENST00000378781.3 |
KIAA0226L
|
KIAA0226-like |
| chr14_-_24711806 | 1.81 |
ENST00000540705.1
ENST00000538777.1 ENST00000558566.1 ENST00000559019.1 |
TINF2
|
TERF1 (TRF1)-interacting nuclear factor 2 |
| chr16_+_8715574 | 1.79 |
ENST00000561758.1
|
METTL22
|
methyltransferase like 22 |
| chr3_+_49059038 | 1.79 |
ENST00000451378.2
|
NDUFAF3
|
NADH dehydrogenase (ubiquinone) complex I, assembly factor 3 |
| chr19_-_40971643 | 1.78 |
ENST00000595483.1
|
BLVRB
|
biliverdin reductase B (flavin reductase (NADPH)) |
| chr19_-_40324767 | 1.75 |
ENST00000601972.1
ENST00000430012.2 ENST00000323039.5 ENST00000348817.3 |
DYRK1B
|
dual-specificity tyrosine-(Y)-phosphorylation regulated kinase 1B |
| chrX_-_52546189 | 1.74 |
ENST00000375570.1
ENST00000429372.2 |
XAGE1E
|
X antigen family, member 1E |
| chr12_-_96390108 | 1.71 |
ENST00000538703.1
ENST00000261208.3 |
HAL
|
histidine ammonia-lyase |
| chr5_-_112257914 | 1.70 |
ENST00000513339.1
ENST00000545426.1 ENST00000504247.1 |
REEP5
|
receptor accessory protein 5 |
| chrX_+_52238810 | 1.69 |
ENST00000437949.2
ENST00000375616.1 |
XAGE1B
|
X antigen family, member 1B |
| chr15_-_42565606 | 1.69 |
ENST00000307216.6
ENST00000448392.1 |
TMEM87A
|
transmembrane protein 87A |
| chr4_+_2794750 | 1.67 |
ENST00000452765.2
ENST00000389838.2 |
SH3BP2
|
SH3-domain binding protein 2 |
| chr1_+_180165672 | 1.66 |
ENST00000443059.1
|
QSOX1
|
quiescin Q6 sulfhydryl oxidase 1 |
| chr15_+_75074385 | 1.66 |
ENST00000220003.9
|
CSK
|
c-src tyrosine kinase |
| chr12_-_15114492 | 1.64 |
ENST00000541546.1
|
ARHGDIB
|
Rho GDP dissociation inhibitor (GDI) beta |
| chr22_+_29702572 | 1.64 |
ENST00000407647.2
ENST00000416823.1 ENST00000428622.1 |
GAS2L1
|
growth arrest-specific 2 like 1 |
| chr13_-_33002279 | 1.63 |
ENST00000380130.2
|
N4BP2L1
|
NEDD4 binding protein 2-like 1 |
| chr12_-_81331697 | 1.62 |
ENST00000552864.1
|
LIN7A
|
lin-7 homolog A (C. elegans) |
| chr20_-_1600642 | 1.62 |
ENST00000381603.3
ENST00000381605.4 ENST00000279477.7 ENST00000568365.1 ENST00000564763.1 |
SIRPB1
RP4-576H24.4
|
signal-regulatory protein beta 1 Uncharacterized protein |
| chr16_+_75681650 | 1.58 |
ENST00000300086.4
|
TERF2IP
|
telomeric repeat binding factor 2, interacting protein |
| chr2_-_85636928 | 1.57 |
ENST00000449030.1
|
CAPG
|
capping protein (actin filament), gelsolin-like |
| chr5_+_140501581 | 1.56 |
ENST00000194152.1
|
PCDHB4
|
protocadherin beta 4 |
| chr2_+_241564655 | 1.55 |
ENST00000407714.1
|
GPR35
|
G protein-coupled receptor 35 |
| chrX_-_153210107 | 1.55 |
ENST00000369997.3
ENST00000393700.3 ENST00000412763.1 |
RENBP
|
renin binding protein |
| chr11_+_46368975 | 1.53 |
ENST00000527911.1
|
DGKZ
|
diacylglycerol kinase, zeta |
| chr2_+_169923577 | 1.53 |
ENST00000432060.2
|
DHRS9
|
dehydrogenase/reductase (SDR family) member 9 |
| chrX_-_52533295 | 1.51 |
ENST00000375578.1
ENST00000396497.3 |
XAGE1D
|
X antigen family, member 1D |
| chr18_+_6729698 | 1.50 |
ENST00000383472.4
|
ARHGAP28
|
Rho GTPase activating protein 28 |
| chr19_+_17337027 | 1.48 |
ENST00000601529.1
ENST00000600232.1 |
OCEL1
|
occludin/ELL domain containing 1 |
| chr19_-_44174330 | 1.48 |
ENST00000340093.3
|
PLAUR
|
plasminogen activator, urokinase receptor |
| chr3_+_9773409 | 1.47 |
ENST00000433861.2
ENST00000424362.1 ENST00000383829.2 ENST00000302054.3 ENST00000420291.1 |
BRPF1
|
bromodomain and PHD finger containing, 1 |
| chr13_-_47012325 | 1.46 |
ENST00000409879.2
|
KIAA0226L
|
KIAA0226-like |
| chr22_+_39760130 | 1.42 |
ENST00000381535.4
|
SYNGR1
|
synaptogyrin 1 |
| chr3_+_14166440 | 1.42 |
ENST00000306077.4
|
TMEM43
|
transmembrane protein 43 |
| chr21_-_38445011 | 1.41 |
ENST00000464265.1
ENST00000399102.1 |
PIGP
|
phosphatidylinositol glycan anchor biosynthesis, class P |
| chr11_-_119252425 | 1.40 |
ENST00000260187.2
|
USP2
|
ubiquitin specific peptidase 2 |
| chr2_-_24307635 | 1.40 |
ENST00000313482.4
|
TP53I3
|
tumor protein p53 inducible protein 3 |
| chr8_-_101348408 | 1.37 |
ENST00000519527.1
ENST00000522369.1 |
RNF19A
|
ring finger protein 19A, RBR E3 ubiquitin protein ligase |
| chr14_-_65569057 | 1.37 |
ENST00000555419.1
ENST00000341653.2 |
MAX
|
MYC associated factor X |
| chr11_-_64512469 | 1.37 |
ENST00000377485.1
|
RASGRP2
|
RAS guanyl releasing protein 2 (calcium and DAG-regulated) |
| chr10_-_135122603 | 1.37 |
ENST00000368563.2
|
TUBGCP2
|
tubulin, gamma complex associated protein 2 |
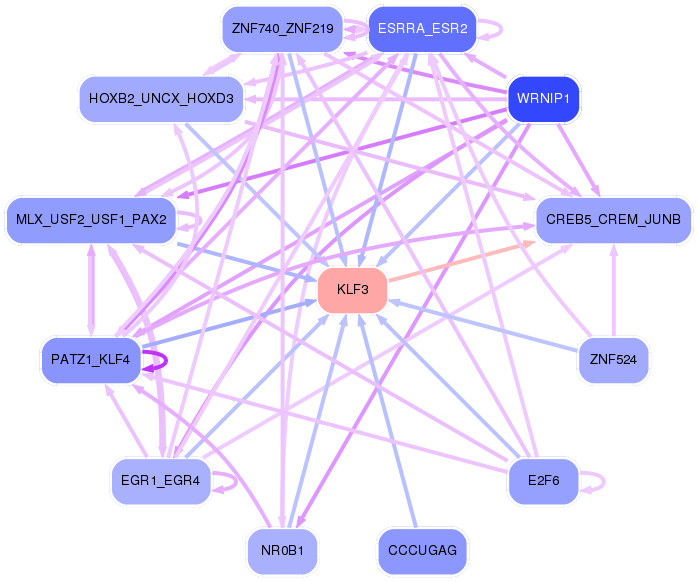
Network of associatons between targets according to the STRING database.

First level regulatory network of KLF3
Gene Ontology Analysis
Gene overrepresentation in biological_process category:
| Log-likelihood per target | Total log-likelihood | Term | Description |
|---|---|---|---|
| 3.8 | 11.3 | GO:1902490 | regulation of sperm capacitation(GO:1902490) |
| 3.4 | 13.7 | GO:0030037 | actin filament reorganization involved in cell cycle(GO:0030037) |
| 3.1 | 12.5 | GO:0006050 | mannosamine metabolic process(GO:0006050) N-acetylmannosamine metabolic process(GO:0006051) |
| 2.9 | 17.5 | GO:0071105 | response to interleukin-11(GO:0071105) |
| 2.8 | 8.4 | GO:0017186 | peptidyl-pyroglutamic acid biosynthetic process, using glutaminyl-peptide cyclotransferase(GO:0017186) |
| 1.9 | 5.6 | GO:0002522 | leukocyte migration involved in immune response(GO:0002522) |
| 1.8 | 8.8 | GO:0099590 | neurotransmitter receptor internalization(GO:0099590) |
| 1.7 | 6.7 | GO:0019747 | regulation of isoprenoid metabolic process(GO:0019747) |
| 1.6 | 9.9 | GO:0070537 | histone H2A K63-linked deubiquitination(GO:0070537) |
| 1.5 | 4.6 | GO:0043606 | histidine catabolic process to glutamate and formamide(GO:0019556) histidine catabolic process to glutamate and formate(GO:0019557) formamide metabolic process(GO:0043606) |
| 1.5 | 4.4 | GO:1902771 | regulation of choline O-acetyltransferase activity(GO:1902769) positive regulation of choline O-acetyltransferase activity(GO:1902771) negative regulation of tau-protein kinase activity(GO:1902948) positive regulation of early endosome to recycling endosome transport(GO:1902955) negative regulation of aspartic-type endopeptidase activity involved in amyloid precursor protein catabolic process(GO:1902960) negative regulation of neurofibrillary tangle assembly(GO:1902997) negative regulation of aspartic-type peptidase activity(GO:1905246) |
| 1.4 | 4.3 | GO:0006478 | peptidyl-tyrosine sulfation(GO:0006478) |
| 1.4 | 5.6 | GO:1990869 | response to chemokine(GO:1990868) cellular response to chemokine(GO:1990869) |
| 1.2 | 4.9 | GO:0030185 | nitric oxide transport(GO:0030185) |
| 1.2 | 16.3 | GO:2001199 | negative regulation of dendritic cell differentiation(GO:2001199) |
| 1.0 | 4.0 | GO:1900186 | negative regulation of clathrin-mediated endocytosis(GO:1900186) |
| 1.0 | 2.9 | GO:0010621 | negative regulation of transcription by transcription factor localization(GO:0010621) gall bladder development(GO:0061010) |
| 0.9 | 5.6 | GO:0010836 | negative regulation of protein ADP-ribosylation(GO:0010836) |
| 0.9 | 2.8 | GO:0006788 | heme oxidation(GO:0006788) smooth muscle hyperplasia(GO:0014806) |
| 0.9 | 5.5 | GO:2001181 | positive regulation of interleukin-10 secretion(GO:2001181) |
| 0.9 | 4.4 | GO:0032487 | regulation of Rap protein signal transduction(GO:0032487) |
| 0.9 | 4.3 | GO:0042997 | negative regulation of Golgi to plasma membrane protein transport(GO:0042997) |
| 0.8 | 2.5 | GO:1904301 | positive regulation of neutrophil degranulation(GO:0043315) cellular response to gravity(GO:0071258) positive regulation of neutrophil activation(GO:1902565) regulation of transcytosis(GO:1904298) positive regulation of transcytosis(GO:1904300) regulation of maternal process involved in parturition(GO:1904301) positive regulation of maternal process involved in parturition(GO:1904303) response to 2-O-acetyl-1-O-hexadecyl-sn-glycero-3-phosphocholine(GO:1904316) cellular response to 2-O-acetyl-1-O-hexadecyl-sn-glycero-3-phosphocholine(GO:1904317) |
| 0.8 | 2.5 | GO:1904425 | negative regulation of GTP binding(GO:1904425) |
| 0.8 | 4.1 | GO:0051622 | negative regulation of dopamine uptake involved in synaptic transmission(GO:0051585) norepinephrine uptake(GO:0051620) regulation of norepinephrine uptake(GO:0051621) negative regulation of norepinephrine uptake(GO:0051622) negative regulation of catecholamine uptake involved in synaptic transmission(GO:0051945) regulation of glutathione peroxidase activity(GO:1903282) positive regulation of glutathione peroxidase activity(GO:1903284) positive regulation of hydrogen peroxide catabolic process(GO:1903285) regulation of peroxidase activity(GO:2000468) positive regulation of peroxidase activity(GO:2000470) |
| 0.8 | 2.5 | GO:0035948 | positive regulation of gluconeogenesis by positive regulation of transcription from RNA polymerase II promoter(GO:0035948) |
| 0.7 | 3.0 | GO:0072675 | multinuclear osteoclast differentiation(GO:0072674) osteoclast fusion(GO:0072675) |
| 0.7 | 2.0 | GO:0010166 | wax biosynthetic process(GO:0010025) wax metabolic process(GO:0010166) |
| 0.6 | 2.5 | GO:2001178 | mediator complex assembly(GO:0036034) regulation of mediator complex assembly(GO:2001176) positive regulation of mediator complex assembly(GO:2001178) |
| 0.6 | 3.7 | GO:0090235 | regulation of metaphase plate congression(GO:0090235) |
| 0.6 | 2.4 | GO:0038195 | urokinase plasminogen activator signaling pathway(GO:0038195) |
| 0.6 | 3.5 | GO:0060136 | embryonic process involved in female pregnancy(GO:0060136) |
| 0.6 | 5.0 | GO:0060235 | lens induction in camera-type eye(GO:0060235) |
| 0.5 | 2.7 | GO:0042631 | cellular response to water deprivation(GO:0042631) |
| 0.5 | 1.0 | GO:0002125 | maternal aggressive behavior(GO:0002125) |
| 0.5 | 3.5 | GO:1902746 | regulation of lens fiber cell differentiation(GO:1902746) |
| 0.5 | 4.0 | GO:0032510 | endosome to lysosome transport via multivesicular body sorting pathway(GO:0032510) |
| 0.5 | 2.0 | GO:2000563 | positive regulation of CD4-positive, alpha-beta T cell proliferation(GO:2000563) |
| 0.5 | 1.9 | GO:0002296 | T-helper 1 cell lineage commitment(GO:0002296) |
| 0.5 | 4.6 | GO:0001955 | blood vessel maturation(GO:0001955) |
| 0.4 | 3.5 | GO:0060372 | regulation of atrial cardiac muscle cell membrane repolarization(GO:0060372) |
| 0.4 | 8.6 | GO:0006853 | carnitine shuttle(GO:0006853) |
| 0.4 | 2.1 | GO:0010732 | protein glutathionylation(GO:0010731) regulation of protein glutathionylation(GO:0010732) negative regulation of protein glutathionylation(GO:0010734) |
| 0.4 | 2.6 | GO:0070945 | neutrophil mediated killing of gram-negative bacterium(GO:0070945) |
| 0.4 | 6.8 | GO:0071803 | positive regulation of podosome assembly(GO:0071803) |
| 0.4 | 2.1 | GO:0045079 | negative regulation of chemokine biosynthetic process(GO:0045079) |
| 0.4 | 4.2 | GO:0036066 | protein O-linked fucosylation(GO:0036066) |
| 0.4 | 2.1 | GO:0003219 | cardiac right ventricle formation(GO:0003219) |
| 0.4 | 1.6 | GO:0071461 | cellular response to redox state(GO:0071461) |
| 0.4 | 1.2 | GO:0009051 | pentose-phosphate shunt, oxidative branch(GO:0009051) |
| 0.4 | 4.1 | GO:0038145 | macrophage colony-stimulating factor signaling pathway(GO:0038145) |
| 0.4 | 1.6 | GO:0051970 | negative regulation of transmission of nerve impulse(GO:0051970) |
| 0.4 | 2.3 | GO:0035469 | determination of pancreatic left/right asymmetry(GO:0035469) |
| 0.4 | 3.0 | GO:0075525 | viral translational termination-reinitiation(GO:0075525) |
| 0.4 | 2.6 | GO:0033625 | positive regulation of integrin activation(GO:0033625) |
| 0.4 | 2.5 | GO:1903142 | positive regulation of endothelial cell development(GO:1901552) positive regulation of establishment of endothelial barrier(GO:1903142) |
| 0.4 | 6.7 | GO:0031629 | synaptic vesicle fusion to presynaptic active zone membrane(GO:0031629) vesicle fusion to plasma membrane(GO:0099500) |
| 0.3 | 2.7 | GO:0018401 | peptidyl-proline hydroxylation to 4-hydroxy-L-proline(GO:0018401) |
| 0.3 | 0.3 | GO:2000017 | positive regulation of determination of dorsal identity(GO:2000017) |
| 0.3 | 3.0 | GO:0006054 | N-acetylneuraminate metabolic process(GO:0006054) |
| 0.3 | 3.8 | GO:0033015 | porphyrin-containing compound catabolic process(GO:0006787) tetrapyrrole catabolic process(GO:0033015) heme catabolic process(GO:0042167) pigment catabolic process(GO:0046149) |
| 0.3 | 6.3 | GO:0016254 | preassembly of GPI anchor in ER membrane(GO:0016254) |
| 0.3 | 1.2 | GO:0072180 | mesonephric duct morphogenesis(GO:0072180) |
| 0.3 | 1.2 | GO:0002925 | positive regulation of humoral immune response mediated by circulating immunoglobulin(GO:0002925) |
| 0.3 | 1.2 | GO:0002317 | plasma cell differentiation(GO:0002317) |
| 0.3 | 0.8 | GO:0051684 | maintenance of Golgi location(GO:0051684) |
| 0.3 | 5.1 | GO:0002089 | lens morphogenesis in camera-type eye(GO:0002089) |
| 0.3 | 0.8 | GO:0016999 | antibiotic metabolic process(GO:0016999) cellular amide catabolic process(GO:0043605) |
| 0.3 | 1.8 | GO:0036159 | inner dynein arm assembly(GO:0036159) |
| 0.3 | 2.8 | GO:0090205 | positive regulation of cholesterol metabolic process(GO:0090205) |
| 0.2 | 1.0 | GO:0014040 | positive regulation of Schwann cell differentiation(GO:0014040) |
| 0.2 | 1.7 | GO:0051549 | positive regulation of keratinocyte migration(GO:0051549) |
| 0.2 | 0.2 | GO:0043366 | beta selection(GO:0043366) |
| 0.2 | 1.6 | GO:0035624 | receptor transactivation(GO:0035624) |
| 0.2 | 1.1 | GO:2000782 | regulation of unidimensional cell growth(GO:0051510) negative regulation of unidimensional cell growth(GO:0051511) establishment of cell polarity regulating cell shape(GO:0071964) regulation of establishment or maintenance of cell polarity regulating cell shape(GO:2000769) positive regulation of establishment or maintenance of cell polarity regulating cell shape(GO:2000771) regulation of establishment of cell polarity regulating cell shape(GO:2000782) positive regulation of establishment of cell polarity regulating cell shape(GO:2000784) regulation of barbed-end actin filament capping(GO:2000812) positive regulation of barbed-end actin filament capping(GO:2000814) |
| 0.2 | 3.8 | GO:0060742 | epithelial cell differentiation involved in prostate gland development(GO:0060742) |
| 0.2 | 0.9 | GO:1903644 | regulation of chaperone-mediated protein folding(GO:1903644) |
| 0.2 | 0.9 | GO:1902231 | positive regulation of intrinsic apoptotic signaling pathway in response to DNA damage(GO:1902231) |
| 0.2 | 1.3 | GO:0055059 | asymmetric neuroblast division(GO:0055059) |
| 0.2 | 0.6 | GO:0090035 | regulation of chaperone-mediated protein complex assembly(GO:0090034) positive regulation of chaperone-mediated protein complex assembly(GO:0090035) |
| 0.2 | 0.6 | GO:0019482 | beta-alanine metabolic process(GO:0019482) |
| 0.2 | 1.4 | GO:0071763 | nuclear membrane organization(GO:0071763) |
| 0.2 | 0.9 | GO:0035063 | nuclear speck organization(GO:0035063) |
| 0.2 | 1.9 | GO:0015939 | pantothenate metabolic process(GO:0015939) |
| 0.2 | 1.8 | GO:0043152 | induction of bacterial agglutination(GO:0043152) |
| 0.2 | 0.5 | GO:1903033 | regulation of microtubule plus-end binding(GO:1903031) positive regulation of microtubule plus-end binding(GO:1903033) |
| 0.2 | 5.3 | GO:0031116 | positive regulation of microtubule polymerization(GO:0031116) |
| 0.2 | 4.6 | GO:0030947 | regulation of vascular endothelial growth factor receptor signaling pathway(GO:0030947) |
| 0.2 | 2.4 | GO:0070493 | thrombin receptor signaling pathway(GO:0070493) |
| 0.2 | 4.6 | GO:0035162 | embryonic hemopoiesis(GO:0035162) |
| 0.2 | 3.4 | GO:0008535 | respiratory chain complex IV assembly(GO:0008535) |
| 0.2 | 0.2 | GO:1903179 | regulation of dopamine biosynthetic process(GO:1903179) positive regulation of dopamine biosynthetic process(GO:1903181) |
| 0.2 | 3.7 | GO:0050930 | induction of positive chemotaxis(GO:0050930) |
| 0.2 | 1.8 | GO:0042904 | 9-cis-retinoic acid biosynthetic process(GO:0042904) 9-cis-retinoic acid metabolic process(GO:0042905) |
| 0.2 | 6.4 | GO:0030261 | chromosome condensation(GO:0030261) |
| 0.2 | 1.2 | GO:0034587 | piRNA metabolic process(GO:0034587) |
| 0.2 | 0.3 | GO:0048597 | B cell negative selection(GO:0002352) post-embryonic camera-type eye morphogenesis(GO:0048597) |
| 0.2 | 2.3 | GO:0090168 | Golgi reassembly(GO:0090168) |
| 0.2 | 0.9 | GO:0000290 | deadenylation-dependent decapping of nuclear-transcribed mRNA(GO:0000290) |
| 0.2 | 2.1 | GO:2000675 | negative regulation of type B pancreatic cell apoptotic process(GO:2000675) |
| 0.1 | 3.9 | GO:0051560 | mitochondrial calcium ion homeostasis(GO:0051560) |
| 0.1 | 2.4 | GO:0090361 | platelet-derived growth factor production(GO:0090360) regulation of platelet-derived growth factor production(GO:0090361) |
| 0.1 | 1.0 | GO:0060011 | Sertoli cell proliferation(GO:0060011) |
| 0.1 | 1.6 | GO:0031848 | protection from non-homologous end joining at telomere(GO:0031848) |
| 0.1 | 0.4 | GO:0032759 | TRAIL production(GO:0032639) regulation of TRAIL production(GO:0032679) positive regulation of TRAIL production(GO:0032759) |
| 0.1 | 1.4 | GO:0048172 | regulation of short-term neuronal synaptic plasticity(GO:0048172) |
| 0.1 | 7.2 | GO:0060338 | regulation of type I interferon-mediated signaling pathway(GO:0060338) |
| 0.1 | 11.7 | GO:0071277 | cellular response to calcium ion(GO:0071277) |
| 0.1 | 1.1 | GO:0033578 | protein glycosylation in Golgi(GO:0033578) |
| 0.1 | 2.6 | GO:1902236 | negative regulation of endoplasmic reticulum stress-induced intrinsic apoptotic signaling pathway(GO:1902236) |
| 0.1 | 2.1 | GO:0045475 | locomotor rhythm(GO:0045475) |
| 0.1 | 2.0 | GO:0060211 | regulation of nuclear-transcribed mRNA poly(A) tail shortening(GO:0060211) positive regulation of nuclear-transcribed mRNA poly(A) tail shortening(GO:0060213) |
| 0.1 | 6.1 | GO:0042769 | DNA damage response, detection of DNA damage(GO:0042769) |
| 0.1 | 2.3 | GO:0006465 | signal peptide processing(GO:0006465) |
| 0.1 | 0.6 | GO:0051611 | negative regulation of neurotransmitter uptake(GO:0051581) serotonin uptake(GO:0051610) regulation of serotonin uptake(GO:0051611) negative regulation of serotonin uptake(GO:0051612) |
| 0.1 | 1.8 | GO:0007520 | myoblast fusion(GO:0007520) |
| 0.1 | 0.2 | GO:0090086 | negative regulation of protein deubiquitination(GO:0090086) |
| 0.1 | 0.9 | GO:0090286 | cytoskeletal anchoring at nuclear membrane(GO:0090286) |
| 0.1 | 2.7 | GO:0097067 | cellular response to thyroid hormone stimulus(GO:0097067) |
| 0.1 | 0.7 | GO:0051105 | regulation of DNA ligation(GO:0051105) positive regulation of DNA ligation(GO:0051106) |
| 0.1 | 0.1 | GO:0071306 | cellular response to vitamin E(GO:0071306) |
| 0.1 | 0.4 | GO:1903526 | negative regulation of membrane tubulation(GO:1903526) |
| 0.1 | 12.9 | GO:0060333 | interferon-gamma-mediated signaling pathway(GO:0060333) |
| 0.1 | 0.2 | GO:0060023 | soft palate development(GO:0060023) |
| 0.1 | 0.3 | GO:0061461 | lysine import(GO:0034226) L-lysine import(GO:0061461) L-lysine import into cell(GO:1903410) |
| 0.1 | 3.0 | GO:0007035 | vacuolar acidification(GO:0007035) |
| 0.1 | 0.3 | GO:0001694 | histamine biosynthetic process(GO:0001694) |
| 0.1 | 0.4 | GO:1900041 | negative regulation of interleukin-2 secretion(GO:1900041) |
| 0.1 | 2.1 | GO:0007095 | mitotic G2 DNA damage checkpoint(GO:0007095) |
| 0.1 | 0.7 | GO:0051415 | interphase microtubule nucleation by interphase microtubule organizing center(GO:0051415) microtubule nucleation by microtubule organizing center(GO:0051418) |
| 0.1 | 1.9 | GO:0045199 | maintenance of apical/basal cell polarity(GO:0035090) maintenance of epithelial cell apical/basal polarity(GO:0045199) |
| 0.1 | 0.6 | GO:0006207 | 'de novo' pyrimidine nucleobase biosynthetic process(GO:0006207) pyrimidine nucleobase biosynthetic process(GO:0019856) response to oleic acid(GO:0034201) |
| 0.1 | 1.0 | GO:0006930 | negative regulation of receptor internalization(GO:0002091) substrate-dependent cell migration, cell extension(GO:0006930) |
| 0.1 | 0.9 | GO:0046951 | ketone body biosynthetic process(GO:0046951) |
| 0.1 | 0.3 | GO:0070837 | dehydroascorbic acid transport(GO:0070837) |
| 0.1 | 0.9 | GO:0071550 | death-inducing signaling complex assembly(GO:0071550) |
| 0.1 | 1.1 | GO:0001895 | retina homeostasis(GO:0001895) |
| 0.1 | 2.0 | GO:0046339 | diacylglycerol metabolic process(GO:0046339) |
| 0.1 | 0.5 | GO:0002933 | lipid hydroxylation(GO:0002933) |
| 0.1 | 0.2 | GO:0032304 | negative regulation of icosanoid secretion(GO:0032304) |
| 0.1 | 0.4 | GO:0006696 | ergosterol biosynthetic process(GO:0006696) ergosterol metabolic process(GO:0008204) |
| 0.1 | 6.7 | GO:0045576 | mast cell activation(GO:0045576) |
| 0.1 | 0.8 | GO:0043374 | CD8-positive, alpha-beta T cell differentiation(GO:0043374) |
| 0.1 | 1.2 | GO:0021702 | cerebellar Purkinje cell layer formation(GO:0021694) cerebellar Purkinje cell differentiation(GO:0021702) |
| 0.1 | 2.6 | GO:0035902 | response to immobilization stress(GO:0035902) |
| 0.1 | 4.8 | GO:0010830 | regulation of myotube differentiation(GO:0010830) |
| 0.1 | 0.3 | GO:0090385 | phagosome-lysosome fusion(GO:0090385) |
| 0.1 | 0.3 | GO:0090116 | C-5 methylation of cytosine(GO:0090116) |
| 0.1 | 1.9 | GO:0045746 | negative regulation of Notch signaling pathway(GO:0045746) |
| 0.1 | 0.3 | GO:0007386 | compartment pattern specification(GO:0007386) |
| 0.1 | 1.4 | GO:0007517 | muscle organ development(GO:0007517) |
| 0.1 | 0.2 | GO:1990764 | regulation of myofibroblast contraction(GO:1904328) myofibroblast contraction(GO:1990764) |
| 0.1 | 0.5 | GO:1902455 | negative regulation of stem cell population maintenance(GO:1902455) |
| 0.1 | 0.2 | GO:0060370 | susceptibility to T cell mediated cytotoxicity(GO:0060370) |
| 0.1 | 0.4 | GO:0033141 | positive regulation of peptidyl-serine phosphorylation of STAT protein(GO:0033141) |
| 0.1 | 0.7 | GO:0030220 | platelet formation(GO:0030220) |
| 0.1 | 0.3 | GO:0051708 | intracellular transport of viral protein in host cell(GO:0019060) symbiont intracellular protein transport in host(GO:0030581) intracellular protein transport in other organism involved in symbiotic interaction(GO:0051708) |
| 0.1 | 0.2 | GO:0048852 | hypophysis morphogenesis(GO:0048850) diencephalon morphogenesis(GO:0048852) |
| 0.1 | 0.9 | GO:0046688 | response to copper ion(GO:0046688) |
| 0.1 | 1.3 | GO:0097120 | receptor localization to synapse(GO:0097120) |
| 0.1 | 0.7 | GO:0032703 | negative regulation of interleukin-2 production(GO:0032703) |
| 0.1 | 1.0 | GO:0016242 | negative regulation of macroautophagy(GO:0016242) |
| 0.1 | 0.2 | GO:0018201 | N-terminal peptidyl-glycine N-myristoylation(GO:0018008) peptidyl-glycine modification(GO:0018201) |
| 0.1 | 0.6 | GO:0008298 | intracellular mRNA localization(GO:0008298) |
| 0.0 | 1.0 | GO:0098780 | response to mitochondrial depolarisation(GO:0098780) |
| 0.0 | 0.8 | GO:0007567 | parturition(GO:0007567) |
| 0.0 | 1.2 | GO:0042730 | fibrinolysis(GO:0042730) |
| 0.0 | 0.6 | GO:0006657 | CDP-choline pathway(GO:0006657) |
| 0.0 | 1.6 | GO:0016339 | calcium-dependent cell-cell adhesion via plasma membrane cell adhesion molecules(GO:0016339) |
| 0.0 | 3.8 | GO:0048678 | response to axon injury(GO:0048678) |
| 0.0 | 0.8 | GO:0006952 | defense response(GO:0006952) |
| 0.0 | 1.9 | GO:0001881 | receptor recycling(GO:0001881) |
| 0.0 | 0.3 | GO:0032785 | negative regulation of DNA-templated transcription, elongation(GO:0032785) negative regulation of transcription elongation from RNA polymerase II promoter(GO:0034244) |
| 0.0 | 0.2 | GO:0061143 | alveolar primary septum development(GO:0061143) |
| 0.0 | 2.9 | GO:0006968 | cellular defense response(GO:0006968) |
| 0.0 | 0.2 | GO:0045198 | establishment of epithelial cell apical/basal polarity(GO:0045198) |
| 0.0 | 4.8 | GO:0050807 | regulation of synapse organization(GO:0050807) |
| 0.0 | 0.5 | GO:0060081 | membrane hyperpolarization(GO:0060081) |
| 0.0 | 0.5 | GO:0097659 | transcription, DNA-templated(GO:0006351) nucleic acid-templated transcription(GO:0097659) |
| 0.0 | 2.6 | GO:0006910 | phagocytosis, recognition(GO:0006910) |
| 0.0 | 0.1 | GO:0051005 | negative regulation of lipoprotein lipase activity(GO:0051005) |
| 0.0 | 3.2 | GO:0030148 | sphingolipid biosynthetic process(GO:0030148) |
| 0.0 | 0.5 | GO:0090161 | Golgi ribbon formation(GO:0090161) |
| 0.0 | 0.5 | GO:0016024 | CDP-diacylglycerol biosynthetic process(GO:0016024) |
| 0.0 | 4.1 | GO:0002819 | regulation of adaptive immune response(GO:0002819) |
| 0.0 | 0.9 | GO:0032786 | positive regulation of DNA-templated transcription, elongation(GO:0032786) |
| 0.0 | 0.4 | GO:0021670 | lateral ventricle development(GO:0021670) |
| 0.0 | 0.1 | GO:0060152 | peroxisome localization(GO:0060151) microtubule-based peroxisome localization(GO:0060152) |
| 0.0 | 1.1 | GO:0033120 | positive regulation of RNA splicing(GO:0033120) |
| 0.0 | 0.9 | GO:0002456 | T cell mediated immunity(GO:0002456) |
| 0.0 | 0.1 | GO:0010961 | cellular magnesium ion homeostasis(GO:0010961) |
| 0.0 | 0.1 | GO:0043324 | eye pigment biosynthetic process(GO:0006726) eye pigment metabolic process(GO:0042441) pigment metabolic process involved in developmental pigmentation(GO:0043324) pigment metabolic process involved in pigmentation(GO:0043474) |
| 0.0 | 0.9 | GO:0070423 | nucleotide-binding oligomerization domain containing signaling pathway(GO:0070423) |
| 0.0 | 0.3 | GO:0051085 | chaperone mediated protein folding requiring cofactor(GO:0051085) |
| 0.0 | 1.3 | GO:0006687 | glycosphingolipid metabolic process(GO:0006687) |
| 0.0 | 0.9 | GO:1902230 | negative regulation of intrinsic apoptotic signaling pathway in response to DNA damage(GO:1902230) |
| 0.0 | 0.7 | GO:0031581 | hemidesmosome assembly(GO:0031581) |
| 0.0 | 1.0 | GO:0033344 | cholesterol efflux(GO:0033344) |
| 0.0 | 0.9 | GO:0002763 | positive regulation of myeloid leukocyte differentiation(GO:0002763) |
| 0.0 | 0.6 | GO:0035590 | purinergic nucleotide receptor signaling pathway(GO:0035590) |
| 0.0 | 0.1 | GO:0007256 | activation of JNKK activity(GO:0007256) |
| 0.0 | 1.5 | GO:0043966 | histone H3 acetylation(GO:0043966) |
| 0.0 | 0.8 | GO:0016486 | peptide hormone processing(GO:0016486) |
| 0.0 | 2.4 | GO:0002223 | stimulatory C-type lectin receptor signaling pathway(GO:0002223) |
| 0.0 | 0.1 | GO:0035372 | protein localization to microtubule(GO:0035372) |
| 0.0 | 2.9 | GO:0002576 | platelet degranulation(GO:0002576) |
| 0.0 | 1.0 | GO:0006739 | NADP metabolic process(GO:0006739) |
| 0.0 | 0.5 | GO:0042776 | mitochondrial ATP synthesis coupled proton transport(GO:0042776) |
| 0.0 | 0.6 | GO:0006308 | DNA catabolic process(GO:0006308) |
| 0.0 | 0.5 | GO:0015721 | bile acid and bile salt transport(GO:0015721) |
| 0.0 | 0.5 | GO:0032728 | positive regulation of interferon-beta production(GO:0032728) |
| 0.0 | 0.2 | GO:0042398 | cellular modified amino acid biosynthetic process(GO:0042398) |
| 0.0 | 0.4 | GO:0007202 | activation of phospholipase C activity(GO:0007202) |
| 0.0 | 1.6 | GO:0018022 | peptidyl-lysine methylation(GO:0018022) |
| 0.0 | 0.3 | GO:0042136 | neurotransmitter biosynthetic process(GO:0042136) |
| 0.0 | 0.6 | GO:0034724 | DNA replication-independent nucleosome assembly(GO:0006336) DNA replication-independent nucleosome organization(GO:0034724) |
| 0.0 | 0.2 | GO:0034643 | establishment of mitochondrion localization, microtubule-mediated(GO:0034643) mitochondrion transport along microtubule(GO:0047497) establishment of mitochondrion localization(GO:0051654) |
| 0.0 | 1.0 | GO:0010257 | NADH dehydrogenase complex assembly(GO:0010257) mitochondrial respiratory chain complex I assembly(GO:0032981) mitochondrial respiratory chain complex I biogenesis(GO:0097031) |
| 0.0 | 1.8 | GO:0007265 | Ras protein signal transduction(GO:0007265) |
| 0.0 | 0.2 | GO:0030252 | growth hormone secretion(GO:0030252) |
| 0.0 | 0.4 | GO:1901385 | regulation of voltage-gated calcium channel activity(GO:1901385) |
| 0.0 | 1.3 | GO:0035023 | regulation of Rho protein signal transduction(GO:0035023) |
Gene overrepresentation in cellular_component category:
| Log-likelihood per target | Total log-likelihood | Term | Description |
|---|---|---|---|
| 1.2 | 4.9 | GO:0031838 | haptoglobin-hemoglobin complex(GO:0031838) |
| 1.1 | 5.6 | GO:0010370 | perinucleolar chromocenter(GO:0010370) |
| 0.9 | 9.9 | GO:0070531 | BRCA1-A complex(GO:0070531) |
| 0.8 | 2.3 | GO:0031523 | Myb complex(GO:0031523) |
| 0.7 | 6.3 | GO:0033391 | chromatoid body(GO:0033391) |
| 0.7 | 5.5 | GO:0045179 | apical cortex(GO:0045179) |
| 0.7 | 4.1 | GO:1990682 | CSF1-CSF1R complex(GO:1990682) |
| 0.6 | 6.3 | GO:0000506 | glycosylphosphatidylinositol-N-acetylglucosaminyltransferase (GPI-GnT) complex(GO:0000506) |
| 0.6 | 9.3 | GO:0008290 | F-actin capping protein complex(GO:0008290) |
| 0.6 | 12.8 | GO:0042613 | MHC class II protein complex(GO:0042613) |
| 0.6 | 11.3 | GO:0097225 | sperm midpiece(GO:0097225) |
| 0.5 | 11.6 | GO:0030122 | AP-2 adaptor complex(GO:0030122) |
| 0.5 | 1.8 | GO:1990796 | photoreceptor cell terminal bouton(GO:1990796) |
| 0.5 | 2.3 | GO:0036398 | TCR signalosome(GO:0036398) |
| 0.4 | 3.5 | GO:0035976 | AP1 complex(GO:0035976) |
| 0.4 | 4.0 | GO:0070775 | H3 histone acetyltransferase complex(GO:0070775) MOZ/MORF histone acetyltransferase complex(GO:0070776) |
| 0.3 | 4.4 | GO:0005641 | nuclear envelope lumen(GO:0005641) |
| 0.3 | 1.4 | GO:0008275 | gamma-tubulin small complex(GO:0008275) |
| 0.3 | 2.5 | GO:0000125 | PCAF complex(GO:0000125) |
| 0.3 | 1.8 | GO:0005787 | signal peptidase complex(GO:0005787) |
| 0.3 | 1.3 | GO:1990316 | ATG1/ULK1 kinase complex(GO:1990316) |
| 0.2 | 20.1 | GO:1904724 | tertiary granule lumen(GO:1904724) |
| 0.2 | 1.6 | GO:0070187 | telosome(GO:0070187) |
| 0.2 | 2.4 | GO:0071438 | invadopodium membrane(GO:0071438) |
| 0.2 | 1.1 | GO:0071012 | catalytic step 1 spliceosome(GO:0071012) |
| 0.2 | 0.9 | GO:0032044 | DSIF complex(GO:0032044) |
| 0.2 | 3.0 | GO:0033179 | proton-transporting V-type ATPase, V0 domain(GO:0033179) |
| 0.2 | 0.8 | GO:0031616 | spindle pole centrosome(GO:0031616) |
| 0.2 | 0.9 | GO:0045298 | tubulin complex(GO:0045298) |
| 0.2 | 15.0 | GO:0032580 | Golgi cisterna membrane(GO:0032580) |
| 0.2 | 30.2 | GO:0031234 | extrinsic component of cytoplasmic side of plasma membrane(GO:0031234) |
| 0.2 | 4.9 | GO:0031092 | platelet alpha granule membrane(GO:0031092) |
| 0.2 | 1.9 | GO:0097025 | MPP7-DLG1-LIN7 complex(GO:0097025) |
| 0.2 | 2.7 | GO:0031089 | platelet dense granule lumen(GO:0031089) |
| 0.1 | 4.4 | GO:0042629 | mast cell granule(GO:0042629) |
| 0.1 | 0.7 | GO:0030061 | mitochondrial crista(GO:0030061) |
| 0.1 | 6.2 | GO:0001772 | immunological synapse(GO:0001772) |
| 0.1 | 4.6 | GO:0000421 | autophagosome membrane(GO:0000421) |
| 0.1 | 0.4 | GO:0071159 | NF-kappaB complex(GO:0071159) |
| 0.1 | 3.0 | GO:0005852 | eukaryotic translation initiation factor 3 complex(GO:0005852) |
| 0.1 | 5.8 | GO:0031201 | SNARE complex(GO:0031201) |
| 0.1 | 7.7 | GO:0035577 | azurophil granule membrane(GO:0035577) |
| 0.1 | 1.3 | GO:0060077 | inhibitory synapse(GO:0060077) |
| 0.1 | 5.8 | GO:0000786 | nucleosome(GO:0000786) |
| 0.1 | 1.3 | GO:0097136 | Bcl-2 family protein complex(GO:0097136) |
| 0.1 | 14.3 | GO:0031225 | anchored component of membrane(GO:0031225) |
| 0.1 | 12.0 | GO:0032587 | ruffle membrane(GO:0032587) |
| 0.1 | 0.3 | GO:0036502 | Derlin-1-VIMP complex(GO:0036502) |
| 0.1 | 1.1 | GO:0005577 | fibrinogen complex(GO:0005577) |
| 0.1 | 2.1 | GO:0071564 | npBAF complex(GO:0071564) |
| 0.1 | 1.7 | GO:0071782 | endoplasmic reticulum tubular network(GO:0071782) |
| 0.1 | 0.8 | GO:0045495 | P granule(GO:0043186) pole plasm(GO:0045495) germ plasm(GO:0060293) |
| 0.1 | 0.5 | GO:0032807 | DNA ligase IV complex(GO:0032807) |
| 0.1 | 0.9 | GO:0008385 | IkappaB kinase complex(GO:0008385) |
| 0.1 | 0.4 | GO:1990037 | Lewy body core(GO:1990037) |
| 0.1 | 0.5 | GO:0033268 | node of Ranvier(GO:0033268) |
| 0.1 | 1.2 | GO:0001518 | voltage-gated sodium channel complex(GO:0001518) |
| 0.1 | 6.2 | GO:0035578 | azurophil granule lumen(GO:0035578) |
| 0.1 | 1.6 | GO:0005779 | integral component of peroxisomal membrane(GO:0005779) intrinsic component of peroxisomal membrane(GO:0031231) |
| 0.1 | 0.5 | GO:0045261 | proton-transporting ATP synthase complex, catalytic core F(1)(GO:0045261) |
| 0.1 | 8.0 | GO:0016605 | PML body(GO:0016605) |
| 0.1 | 1.6 | GO:0034451 | centriolar satellite(GO:0034451) |
| 0.1 | 0.2 | GO:0030906 | retromer, cargo-selective complex(GO:0030906) |
| 0.1 | 0.2 | GO:0000137 | Golgi cis cisterna(GO:0000137) |
| 0.1 | 6.0 | GO:0031902 | late endosome membrane(GO:0031902) |
| 0.1 | 1.2 | GO:0005686 | U2 snRNP(GO:0005686) |
| 0.1 | 3.6 | GO:0043195 | terminal bouton(GO:0043195) |
| 0.1 | 0.3 | GO:0032021 | NELF complex(GO:0032021) |
| 0.1 | 2.6 | GO:0042571 | immunoglobulin complex, circulating(GO:0042571) |
| 0.0 | 2.6 | GO:0030286 | dynein complex(GO:0030286) |
| 0.0 | 2.2 | GO:0043034 | costamere(GO:0043034) |
| 0.0 | 0.7 | GO:0042599 | lamellar body(GO:0042599) |
| 0.0 | 0.8 | GO:0030173 | integral component of Golgi membrane(GO:0030173) |
| 0.0 | 8.7 | GO:0005741 | mitochondrial outer membrane(GO:0005741) |
| 0.0 | 1.3 | GO:0005665 | DNA-directed RNA polymerase II, core complex(GO:0005665) |
| 0.0 | 2.7 | GO:0005901 | caveola(GO:0005901) |
| 0.0 | 2.4 | GO:0045171 | intercellular bridge(GO:0045171) |
| 0.0 | 0.6 | GO:0070578 | RISC-loading complex(GO:0070578) |
| 0.0 | 0.7 | GO:0035861 | site of double-strand break(GO:0035861) |
| 0.0 | 1.0 | GO:0035371 | microtubule plus-end(GO:0035371) |
| 0.0 | 0.3 | GO:0001741 | XY body(GO:0001741) |
| 0.0 | 0.5 | GO:0005666 | DNA-directed RNA polymerase III complex(GO:0005666) |
| 0.0 | 2.0 | GO:0005902 | microvillus(GO:0005902) |
| 0.0 | 2.2 | GO:0070821 | tertiary granule membrane(GO:0070821) |
| 0.0 | 0.3 | GO:0005583 | fibrillar collagen trimer(GO:0005583) banded collagen fibril(GO:0098643) |
| 0.0 | 2.8 | GO:0005604 | basement membrane(GO:0005604) |
| 0.0 | 1.7 | GO:0030315 | T-tubule(GO:0030315) |
| 0.0 | 0.4 | GO:0030478 | actin cap(GO:0030478) |
| 0.0 | 0.2 | GO:0042567 | insulin-like growth factor ternary complex(GO:0042567) |
| 0.0 | 0.4 | GO:0032154 | cleavage furrow(GO:0032154) cell surface furrow(GO:0097610) |
| 0.0 | 3.5 | GO:0072562 | blood microparticle(GO:0072562) |
| 0.0 | 0.8 | GO:0016235 | aggresome(GO:0016235) |
| 0.0 | 1.6 | GO:0005769 | early endosome(GO:0005769) |
| 0.0 | 0.5 | GO:0070971 | endoplasmic reticulum exit site(GO:0070971) |
| 0.0 | 2.0 | GO:0000932 | cytoplasmic mRNA processing body(GO:0000932) |
| 0.0 | 2.3 | GO:0030667 | secretory granule membrane(GO:0030667) |
| 0.0 | 5.5 | GO:0031965 | nuclear membrane(GO:0031965) |
| 0.0 | 0.4 | GO:0031258 | lamellipodium membrane(GO:0031258) |
| 0.0 | 0.1 | GO:1903439 | calcitonin family receptor complex(GO:1903439) amylin receptor complex(GO:1903440) |
| 0.0 | 0.1 | GO:0033162 | melanosome membrane(GO:0033162) chitosome(GO:0045009) |
| 0.0 | 0.6 | GO:0042645 | nucleoid(GO:0009295) mitochondrial nucleoid(GO:0042645) |
| 0.0 | 1.0 | GO:0031901 | early endosome membrane(GO:0031901) |
Gene overrepresentation in molecular_function category:
| Log-likelihood per target | Total log-likelihood | Term | Description |
|---|---|---|---|
| 3.7 | 11.0 | GO:0045127 | N-acetylglucosamine kinase activity(GO:0045127) |
| 2.8 | 8.4 | GO:0016603 | glutaminyl-peptide cyclotransferase activity(GO:0016603) |
| 1.7 | 8.6 | GO:0004095 | carnitine O-palmitoyltransferase activity(GO:0004095) |
| 1.4 | 4.3 | GO:0008476 | protein-tyrosine sulfotransferase activity(GO:0008476) |
| 1.2 | 17.4 | GO:0050693 | LBD domain binding(GO:0050693) |
| 1.2 | 22.1 | GO:0031702 | type 1 angiotensin receptor binding(GO:0031702) |
| 1.2 | 4.6 | GO:0016841 | ammonia-lyase activity(GO:0016841) |
| 1.0 | 3.0 | GO:0003835 | beta-galactoside alpha-2,6-sialyltransferase activity(GO:0003835) |
| 1.0 | 3.8 | GO:0004074 | biliverdin reductase activity(GO:0004074) |
| 0.9 | 5.6 | GO:0051021 | GDP-dissociation inhibitor binding(GO:0051021) Rho GDP-dissociation inhibitor binding(GO:0051022) |
| 0.9 | 2.8 | GO:0004392 | heme oxygenase (decyclizing) activity(GO:0004392) |
| 0.9 | 6.2 | GO:0004920 | interleukin-10 receptor activity(GO:0004920) |
| 0.8 | 4.1 | GO:0060961 | phospholipase D inhibitor activity(GO:0060961) |
| 0.8 | 4.9 | GO:0030492 | hemoglobin binding(GO:0030492) |
| 0.8 | 2.4 | GO:0030377 | urokinase plasminogen activator receptor activity(GO:0030377) |
| 0.7 | 12.5 | GO:0019992 | diacylglycerol binding(GO:0019992) |
| 0.7 | 2.0 | GO:0080019 | fatty-acyl-CoA reductase (alcohol-forming) activity(GO:0080019) |
| 0.6 | 6.3 | GO:0017176 | phosphatidylinositol N-acetylglucosaminyltransferase activity(GO:0017176) |
| 0.6 | 2.3 | GO:0034988 | Fc-gamma receptor I complex binding(GO:0034988) |
| 0.5 | 10.8 | GO:0070530 | K63-linked polyubiquitin binding(GO:0070530) |
| 0.5 | 11.6 | GO:0035615 | clathrin adaptor activity(GO:0035615) endocytic adaptor activity(GO:0098748) |
| 0.5 | 2.5 | GO:0004992 | platelet activating factor receptor activity(GO:0004992) |
| 0.5 | 3.0 | GO:0008553 | hydrogen-exporting ATPase activity, phosphorylative mechanism(GO:0008553) |
| 0.5 | 2.5 | GO:0004468 | lysine N-acetyltransferase activity, acting on acetyl phosphate as donor(GO:0004468) |
| 0.5 | 6.4 | GO:0046870 | cadmium ion binding(GO:0046870) |
| 0.5 | 3.8 | GO:0004565 | beta-galactosidase activity(GO:0004565) |
| 0.5 | 6.5 | GO:0032395 | MHC class II receptor activity(GO:0032395) |
| 0.5 | 0.9 | GO:0046912 | transferase activity, transferring acyl groups, acyl groups converted into alkyl on transfer(GO:0046912) |
| 0.4 | 1.7 | GO:0016971 | flavin-linked sulfhydryl oxidase activity(GO:0016971) thiol oxidase activity(GO:0016972) |
| 0.4 | 1.2 | GO:0017057 | 6-phosphogluconolactonase activity(GO:0017057) |
| 0.4 | 1.2 | GO:0086062 | voltage-gated sodium channel activity involved in Purkinje myocyte action potential(GO:0086062) |
| 0.4 | 1.2 | GO:0048030 | disaccharide binding(GO:0048030) |
| 0.4 | 1.5 | GO:0004530 | deoxyribonuclease I activity(GO:0004530) |
| 0.4 | 1.9 | GO:0017159 | pantetheine hydrolase activity(GO:0017159) |
| 0.4 | 2.1 | GO:0010859 | calcium-dependent cysteine-type endopeptidase inhibitor activity(GO:0010859) |
| 0.3 | 1.0 | GO:0005137 | interleukin-5 receptor binding(GO:0005137) |
| 0.3 | 1.2 | GO:0060422 | peptidyl-dipeptidase inhibitor activity(GO:0060422) |
| 0.3 | 5.5 | GO:0043274 | phospholipase binding(GO:0043274) |
| 0.3 | 3.3 | GO:0004645 | phosphorylase activity(GO:0004645) |
| 0.3 | 2.4 | GO:0071933 | Arp2/3 complex binding(GO:0071933) |
| 0.3 | 4.8 | GO:0030306 | ADP-ribosylation factor binding(GO:0030306) |
| 0.3 | 1.5 | GO:0010484 | H3 histone acetyltransferase activity(GO:0010484) |
| 0.3 | 5.6 | GO:0005068 | transmembrane receptor protein tyrosine kinase adaptor activity(GO:0005068) |
| 0.3 | 0.6 | GO:0004088 | carbamoyl-phosphate synthase (ammonia) activity(GO:0004087) carbamoyl-phosphate synthase (glutamine-hydrolyzing) activity(GO:0004088) |
| 0.3 | 2.7 | GO:0019826 | oxygen sensor activity(GO:0019826) |
| 0.3 | 5.8 | GO:0008239 | dipeptidyl-peptidase activity(GO:0008239) |
| 0.3 | 1.8 | GO:0050544 | icosanoid binding(GO:0050542) arachidonic acid binding(GO:0050544) fatty acid derivative binding(GO:1901567) |
| 0.3 | 1.5 | GO:0016812 | hydrolase activity, acting on carbon-nitrogen (but not peptide) bonds, in cyclic amides(GO:0016812) |
| 0.3 | 2.5 | GO:0004022 | alcohol dehydrogenase (NAD) activity(GO:0004022) |
| 0.2 | 1.4 | GO:0003960 | NADPH:quinone reductase activity(GO:0003960) |
| 0.2 | 18.3 | GO:0004715 | non-membrane spanning protein tyrosine kinase activity(GO:0004715) |
| 0.2 | 4.9 | GO:0042609 | CD4 receptor binding(GO:0042609) |
| 0.2 | 0.8 | GO:0004140 | dephospho-CoA kinase activity(GO:0004140) |
| 0.2 | 4.2 | GO:0070016 | armadillo repeat domain binding(GO:0070016) |
| 0.2 | 3.5 | GO:0004861 | cyclin-dependent protein serine/threonine kinase inhibitor activity(GO:0004861) |
| 0.2 | 13.2 | GO:0070063 | RNA polymerase binding(GO:0070063) |
| 0.2 | 0.6 | GO:0004983 | neuropeptide Y receptor activity(GO:0004983) |
| 0.2 | 5.9 | GO:0042605 | peptide antigen binding(GO:0042605) |
| 0.2 | 2.9 | GO:0008190 | eukaryotic initiation factor 4E binding(GO:0008190) |
| 0.2 | 0.6 | GO:0004142 | diacylglycerol cholinephosphotransferase activity(GO:0004142) |
| 0.2 | 0.7 | GO:0070051 | fibrinogen binding(GO:0070051) |
| 0.2 | 0.9 | GO:0061665 | SUMO ligase activity(GO:0061665) |
| 0.2 | 1.9 | GO:0015379 | potassium:chloride symporter activity(GO:0015379) potassium ion symporter activity(GO:0022820) |
| 0.2 | 1.2 | GO:0008142 | oxysterol binding(GO:0008142) |
| 0.2 | 2.3 | GO:0008234 | cysteine-type endopeptidase activity(GO:0004197) cysteine-type peptidase activity(GO:0008234) |
| 0.2 | 0.5 | GO:0050501 | hyaluronan synthase activity(GO:0050501) |
| 0.2 | 1.9 | GO:0097016 | L27 domain binding(GO:0097016) |
| 0.2 | 1.6 | GO:0005094 | Rho GDP-dissociation inhibitor activity(GO:0005094) |
| 0.2 | 0.6 | GO:0042903 | tubulin deacetylase activity(GO:0042903) |
| 0.1 | 1.2 | GO:0019863 | IgE binding(GO:0019863) |
| 0.1 | 1.6 | GO:0098505 | G-rich strand telomeric DNA binding(GO:0098505) |
| 0.1 | 1.6 | GO:0016494 | C-X-C chemokine receptor activity(GO:0016494) |
| 0.1 | 5.6 | GO:0042162 | telomeric DNA binding(GO:0042162) |
| 0.1 | 3.5 | GO:0008191 | metalloendopeptidase inhibitor activity(GO:0008191) |
| 0.1 | 5.8 | GO:0005484 | SNAP receptor activity(GO:0005484) |
| 0.1 | 2.6 | GO:0043325 | phosphatidylinositol-3,4-bisphosphate binding(GO:0043325) |
| 0.1 | 0.5 | GO:0070410 | co-SMAD binding(GO:0070410) |
| 0.1 | 0.9 | GO:0000340 | RNA 7-methylguanosine cap binding(GO:0000340) |
| 0.1 | 1.7 | GO:0004143 | diacylglycerol kinase activity(GO:0004143) |
| 0.1 | 2.6 | GO:0070840 | dynein complex binding(GO:0070840) |
| 0.1 | 2.7 | GO:0008093 | cytoskeletal adaptor activity(GO:0008093) |
| 0.1 | 0.4 | GO:0051996 | farnesyl-diphosphate farnesyltransferase activity(GO:0004310) squalene synthase activity(GO:0051996) |
| 0.1 | 5.6 | GO:0015485 | cholesterol binding(GO:0015485) |
| 0.1 | 0.9 | GO:0016721 | superoxide dismutase activity(GO:0004784) oxidoreductase activity, acting on superoxide radicals as acceptor(GO:0016721) |
| 0.1 | 3.0 | GO:0001784 | phosphotyrosine binding(GO:0001784) |
| 0.1 | 3.4 | GO:0004709 | MAP kinase kinase kinase activity(GO:0004709) |
| 0.1 | 2.5 | GO:0046965 | retinoid X receptor binding(GO:0046965) |
| 0.1 | 0.5 | GO:0043532 | angiostatin binding(GO:0043532) |
| 0.1 | 0.3 | GO:0033300 | dehydroascorbic acid transporter activity(GO:0033300) |
| 0.1 | 1.3 | GO:0008140 | cAMP response element binding protein binding(GO:0008140) |
| 0.1 | 4.2 | GO:0005164 | tumor necrosis factor receptor binding(GO:0005164) |
| 0.1 | 0.3 | GO:0003846 | 2-acylglycerol O-acyltransferase activity(GO:0003846) |
| 0.1 | 0.3 | GO:0016361 | activin receptor activity, type I(GO:0016361) |
| 0.1 | 0.8 | GO:0001730 | 2'-5'-oligoadenylate synthetase activity(GO:0001730) |
| 0.1 | 1.6 | GO:0045504 | dynein heavy chain binding(GO:0045504) |
| 0.1 | 0.4 | GO:0071532 | ankyrin repeat binding(GO:0071532) |
| 0.1 | 1.6 | GO:0016922 | ligand-dependent nuclear receptor binding(GO:0016922) |
| 0.1 | 0.7 | GO:0051011 | microtubule minus-end binding(GO:0051011) |
| 0.1 | 1.7 | GO:0030506 | ankyrin binding(GO:0030506) |
| 0.1 | 0.7 | GO:0003910 | DNA ligase (ATP) activity(GO:0003910) |
| 0.1 | 0.7 | GO:0005432 | calcium:sodium antiporter activity(GO:0005432) |
| 0.1 | 0.3 | GO:0004102 | choline O-acetyltransferase activity(GO:0004102) |
| 0.1 | 1.3 | GO:0051400 | BH domain binding(GO:0051400) |
| 0.1 | 0.8 | GO:0008970 | phosphatidylcholine 1-acylhydrolase activity(GO:0008970) |
| 0.1 | 3.8 | GO:0070888 | E-box binding(GO:0070888) |
| 0.1 | 3.3 | GO:0051219 | phosphoprotein binding(GO:0051219) |
| 0.1 | 1.3 | GO:0001055 | RNA polymerase II activity(GO:0001055) |
| 0.1 | 0.2 | GO:0018685 | alkane 1-monooxygenase activity(GO:0018685) |
| 0.1 | 5.1 | GO:0004714 | transmembrane receptor protein tyrosine kinase activity(GO:0004714) |
| 0.1 | 0.4 | GO:0048406 | nerve growth factor binding(GO:0048406) |
| 0.1 | 1.6 | GO:0042169 | SH2 domain binding(GO:0042169) |
| 0.1 | 1.1 | GO:0017070 | U6 snRNA binding(GO:0017070) |
| 0.1 | 0.3 | GO:0003886 | DNA (cytosine-5-)-methyltransferase activity(GO:0003886) |
| 0.1 | 2.6 | GO:0034987 | immunoglobulin receptor binding(GO:0034987) |
| 0.1 | 0.6 | GO:0004931 | extracellular ATP-gated cation channel activity(GO:0004931) ATP-gated ion channel activity(GO:0035381) |
| 0.1 | 0.2 | GO:0004379 | glycylpeptide N-tetradecanoyltransferase activity(GO:0004379) myristoyltransferase activity(GO:0019107) |
| 0.1 | 0.4 | GO:0016167 | glial cell-derived neurotrophic factor receptor activity(GO:0016167) |
| 0.0 | 1.1 | GO:0071889 | 14-3-3 protein binding(GO:0071889) |
| 0.0 | 1.7 | GO:0030507 | spectrin binding(GO:0030507) |
| 0.0 | 1.4 | GO:0031624 | ubiquitin conjugating enzyme binding(GO:0031624) |
| 0.0 | 0.5 | GO:0001056 | RNA polymerase III activity(GO:0001056) |
| 0.0 | 0.3 | GO:0004035 | alkaline phosphatase activity(GO:0004035) |
| 0.0 | 0.7 | GO:0070330 | aromatase activity(GO:0070330) |
| 0.0 | 1.6 | GO:0004866 | endopeptidase inhibitor activity(GO:0004866) endopeptidase regulator activity(GO:0061135) |
| 0.0 | 2.4 | GO:0003743 | translation initiation factor activity(GO:0003743) |
| 0.0 | 3.5 | GO:0035591 | signaling adaptor activity(GO:0035591) |
| 0.0 | 0.3 | GO:1990381 | ubiquitin-specific protease binding(GO:1990381) |
| 0.0 | 0.7 | GO:0043395 | heparan sulfate proteoglycan binding(GO:0043395) |
| 0.0 | 2.2 | GO:0005089 | Rho guanyl-nucleotide exchange factor activity(GO:0005089) |
| 0.0 | 0.5 | GO:0008081 | phosphoric diester hydrolase activity(GO:0008081) |
| 0.0 | 0.2 | GO:0030020 | extracellular matrix structural constituent conferring tensile strength(GO:0030020) |
| 0.0 | 1.4 | GO:0043621 | protein self-association(GO:0043621) |
| 0.0 | 1.8 | GO:0050840 | extracellular matrix binding(GO:0050840) |
| 0.0 | 8.1 | GO:0003729 | mRNA binding(GO:0003729) poly(A) RNA binding(GO:0044822) |
| 0.0 | 1.9 | GO:0097110 | scaffold protein binding(GO:0097110) |
| 0.0 | 1.3 | GO:0030544 | Hsp70 protein binding(GO:0030544) |
| 0.0 | 8.3 | GO:0003714 | transcription corepressor activity(GO:0003714) |
| 0.0 | 1.2 | GO:0043539 | protein serine/threonine kinase activator activity(GO:0043539) |
| 0.0 | 1.0 | GO:0030332 | cyclin binding(GO:0030332) |
| 0.0 | 0.8 | GO:0005540 | hyaluronic acid binding(GO:0005540) |
| 0.0 | 1.6 | GO:0016279 | lysine N-methyltransferase activity(GO:0016278) protein-lysine N-methyltransferase activity(GO:0016279) |
| 0.0 | 8.7 | GO:0005096 | GTPase activator activity(GO:0005096) |
| 0.0 | 0.5 | GO:0097493 | structural molecule activity conferring elasticity(GO:0097493) |
| 0.0 | 2.6 | GO:0004867 | serine-type endopeptidase inhibitor activity(GO:0004867) |
| 0.0 | 0.5 | GO:0015125 | bile acid transmembrane transporter activity(GO:0015125) |
| 0.0 | 0.1 | GO:0031708 | endothelin B receptor binding(GO:0031708) |
| 0.0 | 1.9 | GO:0042826 | histone deacetylase binding(GO:0042826) |
| 0.0 | 0.5 | GO:0051010 | microtubule plus-end binding(GO:0051010) |
| 0.0 | 2.5 | GO:0005262 | calcium channel activity(GO:0005262) |
| 0.0 | 0.1 | GO:0000293 | ferric-chelate reductase activity(GO:0000293) |
| 0.0 | 0.8 | GO:0004864 | protein phosphatase inhibitor activity(GO:0004864) |
| 0.0 | 0.7 | GO:0030374 | ligand-dependent nuclear receptor transcription coactivator activity(GO:0030374) |
| 0.0 | 0.2 | GO:0001206 | transcriptional repressor activity, RNA polymerase II distal enhancer sequence-specific binding(GO:0001206) |
| 0.0 | 0.2 | GO:0031748 | D1 dopamine receptor binding(GO:0031748) |
| 0.0 | 0.2 | GO:0008517 | folic acid transporter activity(GO:0008517) |
| 0.0 | 0.1 | GO:0097643 | amylin receptor activity(GO:0097643) |
| 0.0 | 0.2 | GO:0008327 | methyl-CpG binding(GO:0008327) |
| 0.0 | 0.5 | GO:0008028 | monocarboxylic acid transmembrane transporter activity(GO:0008028) |
| 0.0 | 1.1 | GO:0000979 | RNA polymerase II core promoter sequence-specific DNA binding(GO:0000979) |
| 0.0 | 0.2 | GO:0046934 | phosphatidylinositol-4,5-bisphosphate 3-kinase activity(GO:0046934) |
| 0.0 | 0.9 | GO:0030674 | protein binding, bridging(GO:0030674) |
| 0.0 | 0.1 | GO:0048407 | platelet-derived growth factor binding(GO:0048407) |
Gene overrepresentation in C2:CP category:
| Log-likelihood per target | Total log-likelihood | Term | Description |
|---|---|---|---|
| 0.8 | 8.0 | ST IL 13 PATHWAY | Interleukin 13 (IL-13) Pathway |
| 0.3 | 16.8 | PID RAS PATHWAY | Regulation of Ras family activation |
| 0.3 | 5.6 | PID THROMBIN PAR4 PATHWAY | PAR4-mediated thrombin signaling events |
| 0.2 | 12.7 | PID INTEGRIN2 PATHWAY | Beta2 integrin cell surface interactions |
| 0.2 | 17.3 | PID RHOA REG PATHWAY | Regulation of RhoA activity |
| 0.2 | 2.0 | ST PHOSPHOINOSITIDE 3 KINASE PATHWAY | PI3K Pathway |
| 0.2 | 5.6 | PID IL8 CXCR1 PATHWAY | IL8- and CXCR1-mediated signaling events |
| 0.2 | 1.0 | PID IL5 PATHWAY | IL5-mediated signaling events |
| 0.2 | 13.0 | PID TCR PATHWAY | TCR signaling in naïve CD4+ T cells |
| 0.2 | 8.9 | PID ATM PATHWAY | ATM pathway |
| 0.2 | 13.8 | PID IL4 2PATHWAY | IL4-mediated signaling events |
| 0.2 | 4.4 | PID EPO PATHWAY | EPO signaling pathway |
| 0.1 | 21.6 | PID SMAD2 3NUCLEAR PATHWAY | Regulation of nuclear SMAD2/3 signaling |
| 0.1 | 6.7 | PID HNF3B PATHWAY | FOXA2 and FOXA3 transcription factor networks |
| 0.1 | 1.0 | PID TCR RAS PATHWAY | Ras signaling in the CD4+ TCR pathway |
| 0.1 | 7.2 | PID TELOMERASE PATHWAY | Regulation of Telomerase |
| 0.1 | 2.3 | PID IGF1 PATHWAY | IGF1 pathway |
| 0.1 | 6.2 | PID FRA PATHWAY | Validated transcriptional targets of AP1 family members Fra1 and Fra2 |
| 0.1 | 1.4 | PID P38 MK2 PATHWAY | p38 signaling mediated by MAPKAP kinases |
| 0.1 | 5.0 | PID FCER1 PATHWAY | Fc-epsilon receptor I signaling in mast cells |
| 0.1 | 2.5 | PID P38 MKK3 6PATHWAY | p38 MAPK signaling pathway |
| 0.1 | 8.1 | PID CMYB PATHWAY | C-MYB transcription factor network |
| 0.1 | 1.6 | PID ERB GENOMIC PATHWAY | Validated nuclear estrogen receptor beta network |
| 0.1 | 2.7 | PID HIF1A PATHWAY | Hypoxic and oxygen homeostasis regulation of HIF-1-alpha |
| 0.1 | 2.4 | PID HEDGEHOG GLI PATHWAY | Hedgehog signaling events mediated by Gli proteins |
| 0.0 | 1.4 | PID TCR CALCIUM PATHWAY | Calcium signaling in the CD4+ TCR pathway |
| 0.0 | 2.1 | PID LKB1 PATHWAY | LKB1 signaling events |
| 0.0 | 3.6 | PID MYC REPRESS PATHWAY | Validated targets of C-MYC transcriptional repression |
| 0.0 | 1.1 | SA FAS SIGNALING | The TNF-type receptor Fas induces apoptosis on ligand binding. |
| 0.0 | 1.9 | PID ALPHA SYNUCLEIN PATHWAY | Alpha-synuclein signaling |
| 0.0 | 0.7 | PID EPHRINB REV PATHWAY | Ephrin B reverse signaling |
| 0.0 | 2.8 | PID ERA GENOMIC PATHWAY | Validated nuclear estrogen receptor alpha network |
| 0.0 | 8.8 | NABA ECM REGULATORS | Genes encoding enzymes and their regulators involved in the remodeling of the extracellular matrix |
| 0.0 | 0.5 | PID DNA PK PATHWAY | DNA-PK pathway in nonhomologous end joining |
| 0.0 | 0.9 | PID HNF3A PATHWAY | FOXA1 transcription factor network |
| 0.0 | 1.3 | PID MTOR 4PATHWAY | mTOR signaling pathway |
| 0.0 | 0.3 | SA PROGRAMMED CELL DEATH | Programmed cell death, or apoptosis, eliminates damaged or unneeded cells. |
| 0.0 | 0.3 | PID ALK2 PATHWAY | ALK2 signaling events |
| 0.0 | 1.3 | PID HIF1 TFPATHWAY | HIF-1-alpha transcription factor network |
| 0.0 | 0.1 | ST TYPE I INTERFERON PATHWAY | Type I Interferon (alpha/beta IFN) Pathway |
| 0.0 | 0.7 | SA MMP CYTOKINE CONNECTION | Cytokines can induce activation of matrix metalloproteinases, which degrade extracellular matrix. |
| 0.0 | 0.6 | PID NFAT TFPATHWAY | Calcineurin-regulated NFAT-dependent transcription in lymphocytes |
| 0.0 | 0.4 | PID ERBB1 RECEPTOR PROXIMAL PATHWAY | EGF receptor (ErbB1) signaling pathway |
| 0.0 | 0.5 | PID AURORA A PATHWAY | Aurora A signaling |
| 0.0 | 0.6 | PID HDAC CLASSI PATHWAY | Signaling events mediated by HDAC Class I |
| 0.0 | 0.4 | PID AR TF PATHWAY | Regulation of Androgen receptor activity |
Gene overrepresentation in C2:CP:REACTOME category:
| Log-likelihood per target | Total log-likelihood | Term | Description |
|---|---|---|---|
| 0.6 | 17.1 | REACTOME PHOSPHORYLATION OF CD3 AND TCR ZETA CHAINS | Genes involved in Phosphorylation of CD3 and TCR zeta chains |
| 0.5 | 4.9 | REACTOME REGULATION OF THE FANCONI ANEMIA PATHWAY | Genes involved in Regulation of the Fanconi anemia pathway |
| 0.5 | 11.1 | REACTOME TGF BETA RECEPTOR SIGNALING IN EMT EPITHELIAL TO MESENCHYMAL TRANSITION | Genes involved in TGF-beta receptor signaling in EMT (epithelial to mesenchymal transition) |
| 0.4 | 8.0 | REACTOME IL 6 SIGNALING | Genes involved in Interleukin-6 signaling |
| 0.4 | 19.2 | REACTOME RAP1 SIGNALLING | Genes involved in Rap1 signalling |
| 0.4 | 8.8 | REACTOME RETROGRADE NEUROTROPHIN SIGNALLING | Genes involved in Retrograde neurotrophin signalling |
| 0.3 | 9.8 | REACTOME ACTIVATED AMPK STIMULATES FATTY ACID OXIDATION IN MUSCLE | Genes involved in Activated AMPK stimulates fatty-acid oxidation in muscle |
| 0.3 | 6.3 | REACTOME SYNTHESIS OF GLYCOSYLPHOSPHATIDYLINOSITOL GPI | Genes involved in Synthesis of glycosylphosphatidylinositol (GPI) |
| 0.3 | 7.7 | REACTOME PROTEOLYTIC CLEAVAGE OF SNARE COMPLEX PROTEINS | Genes involved in Proteolytic cleavage of SNARE complex proteins |
| 0.2 | 5.0 | REACTOME SEMA3A PLEXIN REPULSION SIGNALING BY INHIBITING INTEGRIN ADHESION | Genes involved in SEMA3A-Plexin repulsion signaling by inhibiting Integrin adhesion |
| 0.2 | 5.6 | REACTOME REGULATION OF SIGNALING BY CBL | Genes involved in Regulation of signaling by CBL |
| 0.2 | 0.2 | REACTOME TRANSLOCATION OF ZAP 70 TO IMMUNOLOGICAL SYNAPSE | Genes involved in Translocation of ZAP-70 to Immunological synapse |
| 0.2 | 6.2 | REACTOME METABOLISM OF PORPHYRINS | Genes involved in Metabolism of porphyrins |
| 0.2 | 2.5 | REACTOME NOTCH HLH TRANSCRIPTION PATHWAY | Genes involved in Notch-HLH transcription pathway |
| 0.2 | 4.6 | REACTOME REGULATION OF KIT SIGNALING | Genes involved in Regulation of KIT signaling |
| 0.2 | 2.0 | REACTOME PRE NOTCH TRANSCRIPTION AND TRANSLATION | Genes involved in Pre-NOTCH Transcription and Translation |
| 0.2 | 4.9 | REACTOME CIRCADIAN REPRESSION OF EXPRESSION BY REV ERBA | Genes involved in Circadian Repression of Expression by REV-ERBA |
| 0.2 | 1.6 | REACTOME POST TRANSLATIONAL MODIFICATION SYNTHESIS OF GPI ANCHORED PROTEINS | Genes involved in Post-translational modification: synthesis of GPI-anchored proteins |
| 0.2 | 3.2 | REACTOME TIE2 SIGNALING | Genes involved in Tie2 Signaling |
| 0.2 | 3.0 | REACTOME TERMINATION OF O GLYCAN BIOSYNTHESIS | Genes involved in Termination of O-glycan biosynthesis |
| 0.1 | 5.7 | REACTOME DEGRADATION OF THE EXTRACELLULAR MATRIX | Genes involved in Degradation of the extracellular matrix |
| 0.1 | 7.9 | REACTOME AMYLOIDS | Genes involved in Amyloids |
| 0.1 | 6.6 | REACTOME PACKAGING OF TELOMERE ENDS | Genes involved in Packaging Of Telomere Ends |
| 0.1 | 21.2 | REACTOME SIGNALING BY RHO GTPASES | Genes involved in Signaling by Rho GTPases |
| 0.1 | 1.8 | REACTOME SYNTHESIS SECRETION AND DEACYLATION OF GHRELIN | Genes involved in Synthesis, Secretion, and Deacylation of Ghrelin |
| 0.1 | 2.4 | REACTOME GPVI MEDIATED ACTIVATION CASCADE | Genes involved in GPVI-mediated activation cascade |
| 0.1 | 3.0 | REACTOME INSULIN RECEPTOR RECYCLING | Genes involved in Insulin receptor recycling |
| 0.1 | 0.9 | REACTOME MRNA DECAY BY 3 TO 5 EXORIBONUCLEASE | Genes involved in mRNA Decay by 3' to 5' Exoribonuclease |
| 0.1 | 3.3 | REACTOME SPHINGOLIPID DE NOVO BIOSYNTHESIS | Genes involved in Sphingolipid de novo biosynthesis |
| 0.1 | 2.3 | REACTOME SIGNAL REGULATORY PROTEIN SIRP FAMILY INTERACTIONS | Genes involved in Signal regulatory protein (SIRP) family interactions |
| 0.1 | 2.7 | REACTOME OXYGEN DEPENDENT PROLINE HYDROXYLATION OF HYPOXIA INDUCIBLE FACTOR ALPHA | Genes involved in Oxygen-dependent Proline Hydroxylation of Hypoxia-inducible Factor Alpha |
| 0.1 | 3.8 | REACTOME SPHINGOLIPID METABOLISM | Genes involved in Sphingolipid metabolism |
| 0.1 | 2.0 | REACTOME REGULATION OF COMPLEMENT CASCADE | Genes involved in Regulation of Complement cascade |
| 0.1 | 6.6 | REACTOME IMMUNOREGULATORY INTERACTIONS BETWEEN A LYMPHOID AND A NON LYMPHOID CELL | Genes involved in Immunoregulatory interactions between a Lymphoid and a non-Lymphoid cell |
| 0.1 | 0.9 | REACTOME IKK COMPLEX RECRUITMENT MEDIATED BY RIP1 | Genes involved in IKK complex recruitment mediated by RIP1 |
| 0.1 | 0.7 | REACTOME GRB2 SOS PROVIDES LINKAGE TO MAPK SIGNALING FOR INTERGRINS | Genes involved in GRB2:SOS provides linkage to MAPK signaling for Intergrins |
| 0.1 | 0.6 | REACTOME REGULATORY RNA PATHWAYS | Genes involved in Regulatory RNA pathways |
| 0.1 | 1.1 | REACTOME SEMA3A PAK DEPENDENT AXON REPULSION | Genes involved in Sema3A PAK dependent Axon repulsion |
| 0.1 | 0.4 | REACTOME NFKB IS ACTIVATED AND SIGNALS SURVIVAL | Genes involved in NF-kB is activated and signals survival |
| 0.1 | 6.2 | REACTOME CLASS B 2 SECRETIN FAMILY RECEPTORS | Genes involved in Class B/2 (Secretin family receptors) |
| 0.1 | 1.9 | REACTOME PEROXISOMAL LIPID METABOLISM | Genes involved in Peroxisomal lipid metabolism |
| 0.0 | 0.7 | REACTOME RECRUITMENT OF NUMA TO MITOTIC CENTROSOMES | Genes involved in Recruitment of NuMA to mitotic centrosomes |
| 0.0 | 0.6 | REACTOME PYRIMIDINE CATABOLISM | Genes involved in Pyrimidine catabolism |
| 0.0 | 0.5 | REACTOME HYALURONAN METABOLISM | Genes involved in Hyaluronan metabolism |
| 0.0 | 3.1 | REACTOME FORMATION OF THE TERNARY COMPLEX AND SUBSEQUENTLY THE 43S COMPLEX | Genes involved in Formation of the ternary complex, and subsequently, the 43S complex |
| 0.0 | 0.6 | REACTOME INTRINSIC PATHWAY | Genes involved in Intrinsic Pathway |
| 0.0 | 1.2 | REACTOME INTERACTION BETWEEN L1 AND ANKYRINS | Genes involved in Interaction between L1 and Ankyrins |
| 0.0 | 2.6 | REACTOME INTERFERON GAMMA SIGNALING | Genes involved in Interferon gamma signaling |
| 0.0 | 0.5 | REACTOME RNA POL III CHAIN ELONGATION | Genes involved in RNA Polymerase III Chain Elongation |
| 0.0 | 1.2 | REACTOME MRNA SPLICING MINOR PATHWAY | Genes involved in mRNA Splicing - Minor Pathway |
| 0.0 | 0.7 | REACTOME XENOBIOTICS | Genes involved in Xenobiotics |
| 0.0 | 2.2 | REACTOME TRANSCRIPTIONAL ACTIVITY OF SMAD2 SMAD3 SMAD4 HETEROTRIMER | Genes involved in Transcriptional activity of SMAD2/SMAD3:SMAD4 heterotrimer |
| 0.0 | 0.5 | REACTOME GAMMA CARBOXYLATION TRANSPORT AND AMINO TERMINAL CLEAVAGE OF PROTEINS | Genes involved in Gamma-carboxylation, transport, and amino-terminal cleavage of proteins |
| 0.0 | 0.4 | REACTOME CHYLOMICRON MEDIATED LIPID TRANSPORT | Genes involved in Chylomicron-mediated lipid transport |
| 0.0 | 1.6 | REACTOME DOWNSTREAM SIGNAL TRANSDUCTION | Genes involved in Downstream signal transduction |
| 0.0 | 0.6 | REACTOME SYNTHESIS OF PE | Genes involved in Synthesis of PE |
| 0.0 | 0.1 | REACTOME TRAF6 MEDIATED IRF7 ACTIVATION IN TLR7 8 OR 9 SIGNALING | Genes involved in TRAF6 mediated IRF7 activation in TLR7/8 or 9 signaling |
| 0.0 | 1.8 | REACTOME TRANSCRIPTIONAL REGULATION OF WHITE ADIPOCYTE DIFFERENTIATION | Genes involved in Transcriptional Regulation of White Adipocyte Differentiation |
| 0.0 | 0.9 | REACTOME ABORTIVE ELONGATION OF HIV1 TRANSCRIPT IN THE ABSENCE OF TAT | Genes involved in Abortive elongation of HIV-1 transcript in the absence of Tat |
| 0.0 | 0.4 | REACTOME DCC MEDIATED ATTRACTIVE SIGNALING | Genes involved in DCC mediated attractive signaling |
| 0.0 | 0.5 | REACTOME FORMATION OF ATP BY CHEMIOSMOTIC COUPLING | Genes involved in Formation of ATP by chemiosmotic coupling |
| 0.0 | 1.4 | REACTOME ACTIVATION OF CHAPERONE GENES BY XBP1S | Genes involved in Activation of Chaperone Genes by XBP1(S) |
| 0.0 | 0.4 | REACTOME ACTIVATION OF GENES BY ATF4 | Genes involved in Activation of Genes by ATF4 |
| 0.0 | 0.4 | REACTOME CS DS DEGRADATION | Genes involved in CS/DS degradation |
| 0.0 | 0.9 | REACTOME MYOGENESIS | Genes involved in Myogenesis |
| 0.0 | 0.3 | REACTOME IRON UPTAKE AND TRANSPORT | Genes involved in Iron uptake and transport |
| 0.0 | 0.3 | REACTOME ACETYLCHOLINE NEUROTRANSMITTER RELEASE CYCLE | Genes involved in Acetylcholine Neurotransmitter Release Cycle |
| 0.0 | 1.7 | REACTOME RESPONSE TO ELEVATED PLATELET CYTOSOLIC CA2 | Genes involved in Response to elevated platelet cytosolic Ca2+ |
| 0.0 | 0.3 | REACTOME FACILITATIVE NA INDEPENDENT GLUCOSE TRANSPORTERS | Genes involved in Facilitative Na+-independent glucose transporters |
| 0.0 | 0.9 | REACTOME MYD88 MAL CASCADE INITIATED ON PLASMA MEMBRANE | Genes involved in MyD88:Mal cascade initiated on plasma membrane |
| 0.0 | 2.9 | REACTOME TRANSMISSION ACROSS CHEMICAL SYNAPSES | Genes involved in Transmission across Chemical Synapses |
| 0.0 | 0.5 | REACTOME L1CAM INTERACTIONS | Genes involved in L1CAM interactions |