Project
GNF SymAtlas + NCI-60 cancer cell lines, comparison of cancers vs non-cancers, human (Su, 2004; Ross, 2000)
Navigation
Downloads
Results for LMX1B_MNX1_RAX2
Z-value: 0.88
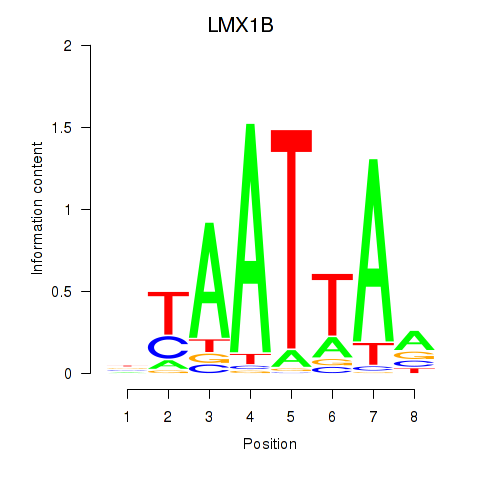
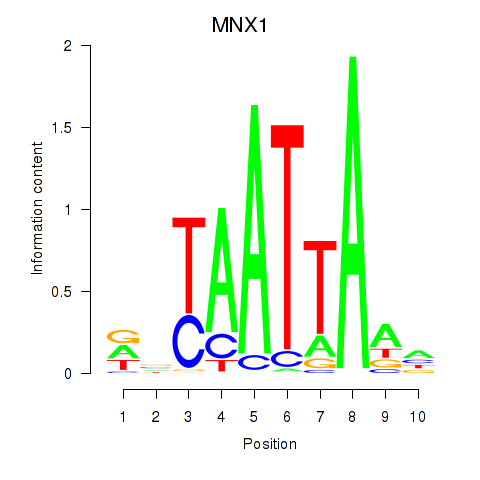
Motif logo

Transcription factors associated with LMX1B_MNX1_RAX2
| Gene Symbol | Gene ID | Gene Info |
|---|---|---|
|
LMX1B
|
ENSG00000136944.13 | LIM homeobox transcription factor 1 beta |
|
MNX1
|
ENSG00000130675.10 | motor neuron and pancreas homeobox 1 |
|
RAX2
|
ENSG00000173976.11 | retina and anterior neural fold homeobox 2 |
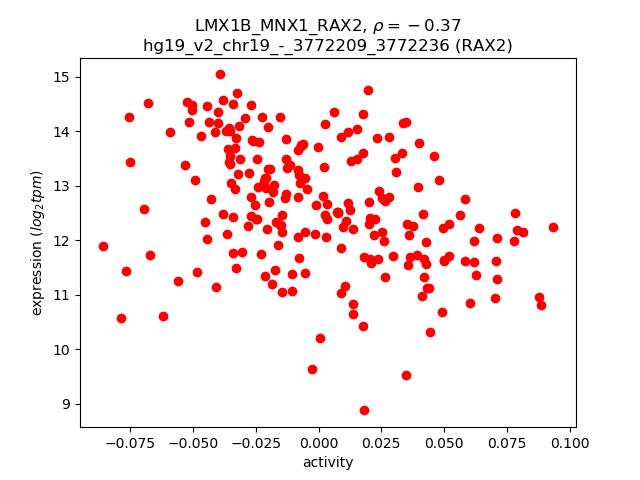
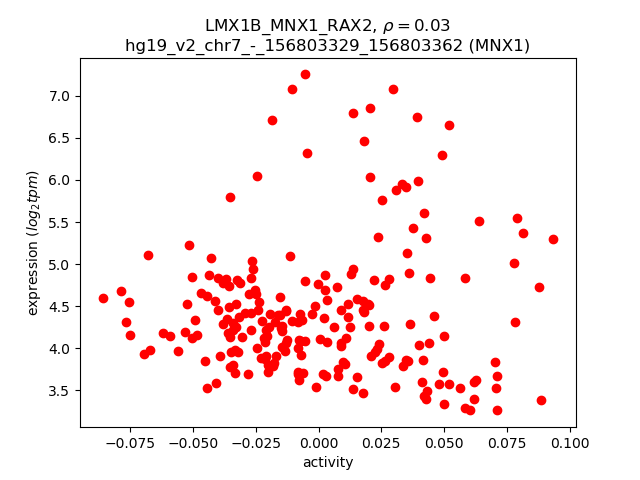
Activity-expression correlation:
| Gene | Promoter | Pearson corr. coef. | P-value | Plot |
|---|---|---|---|---|
| RAX2 | hg19_v2_chr19_-_3772209_3772236 | -0.37 | 2.5e-08 | Click! |
| LMX1B | hg19_v2_chr9_+_129376722_129376748 | -0.22 | 8.7e-04 | Click! |
| MNX1 | hg19_v2_chr7_-_156803329_156803362 | 0.03 | 6.2e-01 | Click! |
Activity profile of LMX1B_MNX1_RAX2 motif
Sorted Z-values of LMX1B_MNX1_RAX2 motif
| Promoter | Log-likelihood | Transcript | Gene | Gene Info |
|---|---|---|---|---|
| chr4_+_169418195 | 26.05 |
ENST00000261509.6
ENST00000335742.7 |
PALLD
|
palladin, cytoskeletal associated protein |
| chr2_-_136678123 | 15.97 |
ENST00000422708.1
|
DARS
|
aspartyl-tRNA synthetase |
| chr12_+_28410128 | 15.15 |
ENST00000381259.1
ENST00000381256.1 |
CCDC91
|
coiled-coil domain containing 91 |
| chr12_-_52967600 | 13.11 |
ENST00000549343.1
ENST00000305620.2 |
KRT74
|
keratin 74 |
| chr15_-_37393406 | 11.10 |
ENST00000338564.5
ENST00000558313.1 ENST00000340545.5 |
MEIS2
|
Meis homeobox 2 |
| chr7_+_134464414 | 10.12 |
ENST00000361901.2
|
CALD1
|
caldesmon 1 |
| chr7_-_107642348 | 10.08 |
ENST00000393561.1
|
LAMB1
|
laminin, beta 1 |
| chr7_+_77428149 | 9.60 |
ENST00000415251.2
ENST00000275575.7 |
PHTF2
|
putative homeodomain transcription factor 2 |
| chr3_-_141747950 | 9.20 |
ENST00000497579.1
|
TFDP2
|
transcription factor Dp-2 (E2F dimerization partner 2) |
| chrX_-_106243451 | 9.01 |
ENST00000355610.4
ENST00000535534.1 |
MORC4
|
MORC family CW-type zinc finger 4 |
| chr2_-_176046391 | 8.94 |
ENST00000392541.3
ENST00000409194.1 |
ATP5G3
|
ATP synthase, H+ transporting, mitochondrial Fo complex, subunit C3 (subunit 9) |
| chr3_+_130569429 | 8.90 |
ENST00000505330.1
ENST00000504381.1 ENST00000507488.2 ENST00000393221.4 |
ATP2C1
|
ATPase, Ca++ transporting, type 2C, member 1 |
| chr7_+_134464376 | 8.88 |
ENST00000454108.1
ENST00000361675.2 |
CALD1
|
caldesmon 1 |
| chr1_+_68150744 | 8.43 |
ENST00000370986.4
ENST00000370985.3 |
GADD45A
|
growth arrest and DNA-damage-inducible, alpha |
| chr9_+_12693336 | 8.18 |
ENST00000381137.2
ENST00000388918.5 |
TYRP1
|
tyrosinase-related protein 1 |
| chrX_-_10851762 | 7.43 |
ENST00000380785.1
ENST00000380787.1 |
MID1
|
midline 1 (Opitz/BBB syndrome) |
| chr15_+_80351910 | 7.11 |
ENST00000261749.6
ENST00000561060.1 |
ZFAND6
|
zinc finger, AN1-type domain 6 |
| chr7_+_77428066 | 6.56 |
ENST00000422959.2
ENST00000307305.8 ENST00000424760.1 |
PHTF2
|
putative homeodomain transcription factor 2 |
| chr17_+_47448102 | 6.48 |
ENST00000576461.1
|
RP11-81K2.1
|
Uncharacterized protein |
| chr17_-_77924627 | 6.41 |
ENST00000572862.1
ENST00000573782.1 ENST00000574427.1 ENST00000570373.1 ENST00000340848.7 ENST00000576768.1 |
TBC1D16
|
TBC1 domain family, member 16 |
| chr8_+_26150628 | 6.25 |
ENST00000523925.1
ENST00000315985.7 |
PPP2R2A
|
protein phosphatase 2, regulatory subunit B, alpha |
| chr3_-_149293990 | 6.10 |
ENST00000472417.1
|
WWTR1
|
WW domain containing transcription regulator 1 |
| chr4_+_169013666 | 5.89 |
ENST00000359299.3
|
ANXA10
|
annexin A10 |
| chr2_-_207023918 | 5.89 |
ENST00000455934.2
ENST00000449699.1 ENST00000454195.1 |
NDUFS1
|
NADH dehydrogenase (ubiquinone) Fe-S protein 1, 75kDa (NADH-coenzyme Q reductase) |
| chr3_-_49066811 | 5.69 |
ENST00000442157.1
ENST00000326739.4 |
IMPDH2
|
IMP (inosine 5'-monophosphate) dehydrogenase 2 |
| chr5_+_174151536 | 5.44 |
ENST00000239243.6
ENST00000507785.1 |
MSX2
|
msh homeobox 2 |
| chr2_-_207024134 | 5.31 |
ENST00000457011.1
ENST00000440274.1 ENST00000432169.1 |
NDUFS1
|
NADH dehydrogenase (ubiquinone) Fe-S protein 1, 75kDa (NADH-coenzyme Q reductase) |
| chr12_-_54653313 | 5.07 |
ENST00000550411.1
ENST00000439541.2 |
CBX5
|
chromobox homolog 5 |
| chr6_-_32157947 | 5.03 |
ENST00000375050.4
|
PBX2
|
pre-B-cell leukemia homeobox 2 |
| chr2_-_61697862 | 4.86 |
ENST00000398571.2
|
USP34
|
ubiquitin specific peptidase 34 |
| chr2_+_109204743 | 4.80 |
ENST00000332345.6
|
LIMS1
|
LIM and senescent cell antigen-like domains 1 |
| chr2_+_109237717 | 4.76 |
ENST00000409441.1
|
LIMS1
|
LIM and senescent cell antigen-like domains 1 |
| chr4_+_41614720 | 4.72 |
ENST00000509277.1
|
LIMCH1
|
LIM and calponin homology domains 1 |
| chr17_-_39191107 | 4.68 |
ENST00000344363.5
|
KRTAP1-3
|
keratin associated protein 1-3 |
| chr2_+_187454749 | 4.59 |
ENST00000261023.3
ENST00000374907.3 |
ITGAV
|
integrin, alpha V |
| chr17_-_64225508 | 4.36 |
ENST00000205948.6
|
APOH
|
apolipoprotein H (beta-2-glycoprotein I) |
| chr4_-_25865159 | 4.28 |
ENST00000502949.1
ENST00000264868.5 ENST00000513691.1 ENST00000514872.1 |
SEL1L3
|
sel-1 suppressor of lin-12-like 3 (C. elegans) |
| chrX_-_153602991 | 4.04 |
ENST00000369850.3
ENST00000422373.1 |
FLNA
|
filamin A, alpha |
| chr15_+_75080883 | 4.02 |
ENST00000567571.1
|
CSK
|
c-src tyrosine kinase |
| chr18_-_33709268 | 3.93 |
ENST00000269187.5
ENST00000590986.1 ENST00000440549.2 |
SLC39A6
|
solute carrier family 39 (zinc transporter), member 6 |
| chr1_-_149900122 | 3.79 |
ENST00000271628.8
|
SF3B4
|
splicing factor 3b, subunit 4, 49kDa |
| chr12_+_49621658 | 3.62 |
ENST00000541364.1
|
TUBA1C
|
tubulin, alpha 1c |
| chr7_-_25268104 | 3.57 |
ENST00000222674.2
|
NPVF
|
neuropeptide VF precursor |
| chr12_-_14133053 | 3.56 |
ENST00000609686.1
|
GRIN2B
|
glutamate receptor, ionotropic, N-methyl D-aspartate 2B |
| chr3_-_151034734 | 3.41 |
ENST00000260843.4
|
GPR87
|
G protein-coupled receptor 87 |
| chr7_-_27169801 | 3.40 |
ENST00000511914.1
|
HOXA4
|
homeobox A4 |
| chr12_-_28123206 | 3.25 |
ENST00000542963.1
ENST00000535992.1 |
PTHLH
|
parathyroid hormone-like hormone |
| chr4_-_139163491 | 3.23 |
ENST00000280612.5
|
SLC7A11
|
solute carrier family 7 (anionic amino acid transporter light chain, xc- system), member 11 |
| chr4_-_143227088 | 3.19 |
ENST00000511838.1
|
INPP4B
|
inositol polyphosphate-4-phosphatase, type II, 105kDa |
| chr2_-_207024233 | 3.17 |
ENST00000423725.1
ENST00000233190.6 |
NDUFS1
|
NADH dehydrogenase (ubiquinone) Fe-S protein 1, 75kDa (NADH-coenzyme Q reductase) |
| chr4_-_39979576 | 3.16 |
ENST00000303538.8
ENST00000503396.1 |
PDS5A
|
PDS5, regulator of cohesion maintenance, homolog A (S. cerevisiae) |
| chr7_-_23510086 | 3.11 |
ENST00000258729.3
|
IGF2BP3
|
insulin-like growth factor 2 mRNA binding protein 3 |
| chr12_-_28122980 | 3.05 |
ENST00000395868.3
ENST00000534890.1 |
PTHLH
|
parathyroid hormone-like hormone |
| chr12_+_20963647 | 3.04 |
ENST00000381545.3
|
SLCO1B3
|
solute carrier organic anion transporter family, member 1B3 |
| chr3_+_173116225 | 2.96 |
ENST00000457714.1
|
NLGN1
|
neuroligin 1 |
| chr12_+_20963632 | 2.96 |
ENST00000540853.1
ENST00000261196.2 |
SLCO1B3
|
solute carrier organic anion transporter family, member 1B3 |
| chr3_-_79816965 | 2.66 |
ENST00000464233.1
|
ROBO1
|
roundabout, axon guidance receptor, homolog 1 (Drosophila) |
| chrX_-_153599578 | 2.64 |
ENST00000360319.4
ENST00000344736.4 |
FLNA
|
filamin A, alpha |
| chr3_-_157824292 | 2.60 |
ENST00000483851.2
|
SHOX2
|
short stature homeobox 2 |
| chr1_+_154229547 | 2.60 |
ENST00000428595.1
|
UBAP2L
|
ubiquitin associated protein 2-like |
| chr15_+_44092784 | 2.60 |
ENST00000458412.1
|
HYPK
|
huntingtin interacting protein K |
| chr6_-_41039567 | 2.59 |
ENST00000468811.1
|
OARD1
|
O-acyl-ADP-ribose deacylase 1 |
| chr7_+_138145076 | 2.48 |
ENST00000343526.4
|
TRIM24
|
tripartite motif containing 24 |
| chr5_+_95066823 | 2.46 |
ENST00000506817.1
ENST00000379982.3 |
RHOBTB3
|
Rho-related BTB domain containing 3 |
| chr19_+_13049413 | 2.38 |
ENST00000316448.5
ENST00000588454.1 |
CALR
|
calreticulin |
| chr17_+_42634844 | 2.35 |
ENST00000315323.3
|
FZD2
|
frizzled family receptor 2 |
| chr19_+_48949030 | 2.31 |
ENST00000253237.5
|
GRWD1
|
glutamate-rich WD repeat containing 1 |
| chr13_-_95131923 | 2.30 |
ENST00000377028.5
ENST00000446125.1 |
DCT
|
dopachrome tautomerase |
| chr8_+_22424551 | 2.29 |
ENST00000523348.1
|
SORBS3
|
sorbin and SH3 domain containing 3 |
| chr4_+_41614909 | 2.28 |
ENST00000509454.1
ENST00000396595.3 ENST00000381753.4 |
LIMCH1
|
LIM and calponin homology domains 1 |
| chr21_-_35284635 | 2.26 |
ENST00000429238.1
|
AP000304.12
|
AP000304.12 |
| chr1_-_39347255 | 2.24 |
ENST00000454994.2
ENST00000357771.3 |
GJA9
|
gap junction protein, alpha 9, 59kDa |
| chrX_+_105937068 | 2.18 |
ENST00000324342.3
|
RNF128
|
ring finger protein 128, E3 ubiquitin protein ligase |
| chr12_-_86650077 | 2.18 |
ENST00000552808.2
ENST00000547225.1 |
MGAT4C
|
mannosyl (alpha-1,3-)-glycoprotein beta-1,4-N-acetylglucosaminyltransferase, isozyme C (putative) |
| chr7_-_99716952 | 2.15 |
ENST00000523306.1
ENST00000344095.4 ENST00000417349.1 ENST00000493322.1 ENST00000520135.1 ENST00000418432.2 ENST00000460673.2 ENST00000452041.1 ENST00000452438.2 ENST00000451699.1 ENST00000453269.2 |
TAF6
|
TAF6 RNA polymerase II, TATA box binding protein (TBP)-associated factor, 80kDa |
| chr18_-_71959159 | 2.14 |
ENST00000494131.2
ENST00000397914.4 ENST00000340533.4 |
CYB5A
|
cytochrome b5 type A (microsomal) |
| chr16_+_69345243 | 2.12 |
ENST00000254950.11
|
VPS4A
|
vacuolar protein sorting 4 homolog A (S. cerevisiae) |
| chr12_+_41831485 | 2.09 |
ENST00000539469.2
ENST00000298919.7 |
PDZRN4
|
PDZ domain containing ring finger 4 |
| chr4_+_169418255 | 2.08 |
ENST00000505667.1
ENST00000511948.1 |
PALLD
|
palladin, cytoskeletal associated protein |
| chrX_+_46771711 | 2.08 |
ENST00000424392.1
ENST00000397189.1 |
PHF16
|
jade family PHD finger 3 |
| chr1_-_68698197 | 2.06 |
ENST00000370973.2
ENST00000370971.1 |
WLS
|
wntless Wnt ligand secretion mediator |
| chr15_-_55563072 | 2.05 |
ENST00000567380.1
ENST00000565972.1 ENST00000569493.1 |
RAB27A
|
RAB27A, member RAS oncogene family |
| chr6_+_12290586 | 2.00 |
ENST00000379375.5
|
EDN1
|
endothelin 1 |
| chr7_+_55433131 | 1.96 |
ENST00000254770.2
|
LANCL2
|
LanC lantibiotic synthetase component C-like 2 (bacterial) |
| chr10_-_48416849 | 1.94 |
ENST00000249598.1
|
GDF2
|
growth differentiation factor 2 |
| chr4_-_143226979 | 1.93 |
ENST00000514525.1
|
INPP4B
|
inositol polyphosphate-4-phosphatase, type II, 105kDa |
| chr14_-_38064198 | 1.91 |
ENST00000250448.2
|
FOXA1
|
forkhead box A1 |
| chr17_+_39240459 | 1.86 |
ENST00000391417.4
|
KRTAP4-7
|
keratin associated protein 4-7 |
| chr14_-_51027838 | 1.82 |
ENST00000555216.1
|
MAP4K5
|
mitogen-activated protein kinase kinase kinase kinase 5 |
| chr3_+_141106643 | 1.79 |
ENST00000514251.1
|
ZBTB38
|
zinc finger and BTB domain containing 38 |
| chr4_-_105416039 | 1.79 |
ENST00000394767.2
|
CXXC4
|
CXXC finger protein 4 |
| chrX_-_18690210 | 1.71 |
ENST00000379984.3
|
RS1
|
retinoschisin 1 |
| chr5_+_176811431 | 1.69 |
ENST00000512593.1
ENST00000324417.5 |
SLC34A1
|
solute carrier family 34 (type II sodium/phosphate contransporter), member 1 |
| chr3_-_113897545 | 1.65 |
ENST00000467632.1
|
DRD3
|
dopamine receptor D3 |
| chr2_+_27440229 | 1.63 |
ENST00000264705.4
ENST00000403525.1 |
CAD
|
carbamoyl-phosphate synthetase 2, aspartate transcarbamylase, and dihydroorotase |
| chr5_+_119867159 | 1.61 |
ENST00000505123.1
|
PRR16
|
proline rich 16 |
| chr20_+_30697298 | 1.60 |
ENST00000398022.2
|
TM9SF4
|
transmembrane 9 superfamily protein member 4 |
| chr4_-_186696425 | 1.59 |
ENST00000430503.1
ENST00000319454.6 ENST00000450341.1 |
SORBS2
|
sorbin and SH3 domain containing 2 |
| chr15_+_80351977 | 1.57 |
ENST00000559157.1
ENST00000561012.1 ENST00000564367.1 ENST00000558494.1 |
ZFAND6
|
zinc finger, AN1-type domain 6 |
| chr3_-_167191814 | 1.55 |
ENST00000466903.1
ENST00000264677.4 |
SERPINI2
|
serpin peptidase inhibitor, clade I (pancpin), member 2 |
| chr1_-_101360331 | 1.52 |
ENST00000416479.1
ENST00000370113.3 |
EXTL2
|
exostosin-like glycosyltransferase 2 |
| chr15_-_55562479 | 1.52 |
ENST00000564609.1
|
RAB27A
|
RAB27A, member RAS oncogene family |
| chr5_+_125758865 | 1.43 |
ENST00000542322.1
ENST00000544396.1 |
GRAMD3
|
GRAM domain containing 3 |
| chr17_-_10372875 | 1.42 |
ENST00000255381.2
|
MYH4
|
myosin, heavy chain 4, skeletal muscle |
| chr3_-_108248169 | 1.40 |
ENST00000273353.3
|
MYH15
|
myosin, heavy chain 15 |
| chr12_-_56694142 | 1.39 |
ENST00000550655.1
ENST00000548567.1 ENST00000551430.2 ENST00000351328.3 |
CS
|
citrate synthase |
| chr6_-_87804815 | 1.36 |
ENST00000369582.2
|
CGA
|
glycoprotein hormones, alpha polypeptide |
| chrX_-_110655306 | 1.34 |
ENST00000371993.2
|
DCX
|
doublecortin |
| chr8_-_99129338 | 1.33 |
ENST00000520507.1
|
HRSP12
|
heat-responsive protein 12 |
| chr5_+_125758813 | 1.30 |
ENST00000285689.3
ENST00000515200.1 |
GRAMD3
|
GRAM domain containing 3 |
| chr4_+_37962018 | 1.29 |
ENST00000504686.1
|
PTTG2
|
pituitary tumor-transforming 2 |
| chr3_+_157827841 | 1.29 |
ENST00000295930.3
ENST00000471994.1 ENST00000464171.1 ENST00000312179.6 ENST00000475278.2 |
RSRC1
|
arginine/serine-rich coiled-coil 1 |
| chr1_-_190446759 | 1.27 |
ENST00000367462.3
|
BRINP3
|
bone morphogenetic protein/retinoic acid inducible neural-specific 3 |
| chr5_+_179159813 | 1.26 |
ENST00000292599.3
|
MAML1
|
mastermind-like 1 (Drosophila) |
| chr4_-_66536057 | 1.25 |
ENST00000273854.3
|
EPHA5
|
EPH receptor A5 |
| chr3_-_113897899 | 1.24 |
ENST00000383673.2
ENST00000295881.7 |
DRD3
|
dopamine receptor D3 |
| chr1_-_227505289 | 1.21 |
ENST00000366765.3
|
CDC42BPA
|
CDC42 binding protein kinase alpha (DMPK-like) |
| chr18_-_47018769 | 1.19 |
ENST00000583637.1
ENST00000578528.1 ENST00000578532.1 ENST00000580387.1 ENST00000579248.1 ENST00000581373.1 |
RPL17
|
ribosomal protein L17 |
| chr1_-_237167718 | 1.19 |
ENST00000464121.2
|
MT1HL1
|
metallothionein 1H-like 1 |
| chr17_-_60142609 | 1.19 |
ENST00000397786.2
|
MED13
|
mediator complex subunit 13 |
| chr7_+_23286182 | 1.17 |
ENST00000258733.4
ENST00000381990.2 ENST00000409458.3 ENST00000539136.1 ENST00000453162.2 |
GPNMB
|
glycoprotein (transmembrane) nmb |
| chr4_-_116034979 | 1.17 |
ENST00000264363.2
|
NDST4
|
N-deacetylase/N-sulfotransferase (heparan glucosaminyl) 4 |
| chr19_+_30433372 | 1.16 |
ENST00000312051.6
|
URI1
|
URI1, prefoldin-like chaperone |
| chr1_-_68698222 | 1.15 |
ENST00000370976.3
ENST00000354777.2 ENST00000262348.4 ENST00000540432.1 |
WLS
|
wntless Wnt ligand secretion mediator |
| chr1_-_94586651 | 1.11 |
ENST00000535735.1
ENST00000370225.3 |
ABCA4
|
ATP-binding cassette, sub-family A (ABC1), member 4 |
| chr4_+_88529681 | 1.10 |
ENST00000399271.1
|
DSPP
|
dentin sialophosphoprotein |
| chr18_-_3219847 | 1.08 |
ENST00000261606.7
|
MYOM1
|
myomesin 1 |
| chr4_-_66536196 | 1.08 |
ENST00000511294.1
|
EPHA5
|
EPH receptor A5 |
| chr17_-_56296580 | 1.07 |
ENST00000313863.6
ENST00000546108.1 ENST00000337050.7 ENST00000393119.2 |
MKS1
|
Meckel syndrome, type 1 |
| chr2_-_216946500 | 1.05 |
ENST00000265322.7
|
PECR
|
peroxisomal trans-2-enoyl-CoA reductase |
| chr7_-_5998714 | 1.02 |
ENST00000539903.1
|
RSPH10B
|
radial spoke head 10 homolog B (Chlamydomonas) |
| chr18_-_47018869 | 1.02 |
ENST00000583036.1
ENST00000580261.1 |
RPL17
|
ribosomal protein L17 |
| chr14_-_78083112 | 0.99 |
ENST00000216484.2
|
SPTLC2
|
serine palmitoyltransferase, long chain base subunit 2 |
| chr14_-_25479811 | 0.99 |
ENST00000550887.1
|
STXBP6
|
syntaxin binding protein 6 (amisyn) |
| chr13_+_53602894 | 0.99 |
ENST00000219022.2
|
OLFM4
|
olfactomedin 4 |
| chr12_-_10955226 | 0.97 |
ENST00000240687.2
|
TAS2R7
|
taste receptor, type 2, member 7 |
| chr12_-_10978957 | 0.95 |
ENST00000240619.2
|
TAS2R10
|
taste receptor, type 2, member 10 |
| chr18_-_47018897 | 0.95 |
ENST00000418495.1
|
RPL17
|
ribosomal protein L17 |
| chr15_-_31393910 | 0.92 |
ENST00000397795.2
ENST00000256552.6 ENST00000559179.1 |
TRPM1
|
transient receptor potential cation channel, subfamily M, member 1 |
| chrX_+_78003204 | 0.90 |
ENST00000435339.3
ENST00000514744.1 |
LPAR4
|
lysophosphatidic acid receptor 4 |
| chr8_-_93107696 | 0.89 |
ENST00000436581.2
ENST00000520583.1 ENST00000519061.1 |
RUNX1T1
|
runt-related transcription factor 1; translocated to, 1 (cyclin D-related) |
| chr12_-_14849470 | 0.86 |
ENST00000261170.3
|
GUCY2C
|
guanylate cyclase 2C (heat stable enterotoxin receptor) |
| chr12_-_86650045 | 0.85 |
ENST00000604798.1
|
MGAT4C
|
mannosyl (alpha-1,3-)-glycoprotein beta-1,4-N-acetylglucosaminyltransferase, isozyme C (putative) |
| chr14_-_36988882 | 0.85 |
ENST00000498187.2
|
NKX2-1
|
NK2 homeobox 1 |
| chr7_-_87342564 | 0.85 |
ENST00000265724.3
ENST00000416177.1 |
ABCB1
|
ATP-binding cassette, sub-family B (MDR/TAP), member 1 |
| chr6_+_46761118 | 0.85 |
ENST00000230588.4
|
MEP1A
|
meprin A, alpha (PABA peptide hydrolase) |
| chr12_-_91398796 | 0.85 |
ENST00000261172.3
ENST00000551767.1 |
EPYC
|
epiphycan |
| chr7_-_14029283 | 0.84 |
ENST00000433547.1
ENST00000405192.2 |
ETV1
|
ets variant 1 |
| chr6_-_111927449 | 0.84 |
ENST00000368761.5
ENST00000392556.4 ENST00000340026.6 |
TRAF3IP2
|
TRAF3 interacting protein 2 |
| chr19_-_51522955 | 0.83 |
ENST00000358789.3
|
KLK10
|
kallikrein-related peptidase 10 |
| chr6_+_151646800 | 0.83 |
ENST00000354675.6
|
AKAP12
|
A kinase (PRKA) anchor protein 12 |
| chr1_+_62439037 | 0.82 |
ENST00000545929.1
|
INADL
|
InaD-like (Drosophila) |
| chr2_-_190927447 | 0.80 |
ENST00000260950.4
|
MSTN
|
myostatin |
| chr1_-_204135450 | 0.80 |
ENST00000272190.8
ENST00000367195.2 |
REN
|
renin |
| chr11_-_30608413 | 0.77 |
ENST00000528686.1
|
MPPED2
|
metallophosphoesterase domain containing 2 |
| chr14_+_72052983 | 0.77 |
ENST00000358550.2
|
SIPA1L1
|
signal-induced proliferation-associated 1 like 1 |
| chr7_-_99717463 | 0.76 |
ENST00000437822.2
|
TAF6
|
TAF6 RNA polymerase II, TATA box binding protein (TBP)-associated factor, 80kDa |
| chr5_+_31193847 | 0.74 |
ENST00000514738.1
ENST00000265071.2 |
CDH6
|
cadherin 6, type 2, K-cadherin (fetal kidney) |
| chr1_+_74701062 | 0.73 |
ENST00000326637.3
|
TNNI3K
|
TNNI3 interacting kinase |
| chr20_+_18447771 | 0.69 |
ENST00000377603.4
|
POLR3F
|
polymerase (RNA) III (DNA directed) polypeptide F, 39 kDa |
| chrX_+_99839799 | 0.68 |
ENST00000373031.4
|
TNMD
|
tenomodulin |
| chr12_-_53171128 | 0.67 |
ENST00000332411.2
|
KRT76
|
keratin 76 |
| chr18_-_3220106 | 0.67 |
ENST00000356443.4
ENST00000400569.3 |
MYOM1
|
myomesin 1 |
| chr1_-_186430222 | 0.65 |
ENST00000391997.2
|
PDC
|
phosducin |
| chr14_+_22739823 | 0.63 |
ENST00000390464.2
|
TRAV38-1
|
T cell receptor alpha variable 38-1 |
| chrX_-_71458802 | 0.61 |
ENST00000373657.1
ENST00000334463.3 |
ERCC6L
|
excision repair cross-complementing rodent repair deficiency, complementation group 6-like |
| chr15_+_69452959 | 0.60 |
ENST00000261858.2
|
GLCE
|
glucuronic acid epimerase |
| chr1_+_160160346 | 0.56 |
ENST00000368078.3
|
CASQ1
|
calsequestrin 1 (fast-twitch, skeletal muscle) |
| chr17_-_79876010 | 0.55 |
ENST00000328666.6
|
SIRT7
|
sirtuin 7 |
| chr13_-_44735393 | 0.55 |
ENST00000400419.1
|
SMIM2
|
small integral membrane protein 2 |
| chr5_-_145562147 | 0.53 |
ENST00000545646.1
ENST00000274562.9 ENST00000510191.1 ENST00000394434.2 |
LARS
|
leucyl-tRNA synthetase |
| chr15_-_55562582 | 0.53 |
ENST00000396307.2
|
RAB27A
|
RAB27A, member RAS oncogene family |
| chr1_-_24469602 | 0.51 |
ENST00000270800.1
|
IL22RA1
|
interleukin 22 receptor, alpha 1 |
| chr4_+_69313145 | 0.50 |
ENST00000305363.4
|
TMPRSS11E
|
transmembrane protease, serine 11E |
| chr17_-_38859996 | 0.49 |
ENST00000264651.2
|
KRT24
|
keratin 24 |
| chr8_+_24298531 | 0.48 |
ENST00000175238.6
|
ADAM7
|
ADAM metallopeptidase domain 7 |
| chr8_-_42234745 | 0.47 |
ENST00000220812.2
|
DKK4
|
dickkopf WNT signaling pathway inhibitor 4 |
| chr13_-_36050819 | 0.46 |
ENST00000379919.4
|
MAB21L1
|
mab-21-like 1 (C. elegans) |
| chr15_-_68497657 | 0.45 |
ENST00000448060.2
ENST00000467889.1 |
CALML4
|
calmodulin-like 4 |
| chr17_+_72427477 | 0.45 |
ENST00000342648.5
ENST00000481232.1 |
GPRC5C
|
G protein-coupled receptor, family C, group 5, member C |
| chr3_-_52090461 | 0.43 |
ENST00000296483.6
ENST00000495880.1 |
DUSP7
|
dual specificity phosphatase 7 |
| chr10_-_96829246 | 0.41 |
ENST00000371270.3
ENST00000535898.1 ENST00000539050.1 |
CYP2C8
|
cytochrome P450, family 2, subfamily C, polypeptide 8 |
| chr1_+_210501589 | 0.41 |
ENST00000413764.2
ENST00000541565.1 |
HHAT
|
hedgehog acyltransferase |
| chr2_-_145278475 | 0.40 |
ENST00000558170.2
|
ZEB2
|
zinc finger E-box binding homeobox 2 |
| chr1_+_155023757 | 0.40 |
ENST00000356955.2
ENST00000449910.2 ENST00000359280.4 ENST00000360674.4 ENST00000368412.3 ENST00000355956.2 ENST00000368410.2 ENST00000271836.6 ENST00000368413.1 ENST00000531455.1 ENST00000447332.3 |
ADAM15
|
ADAM metallopeptidase domain 15 |
| chr2_-_163008903 | 0.40 |
ENST00000418842.2
ENST00000375497.3 |
GCG
|
glucagon |
| chr8_-_99129384 | 0.40 |
ENST00000521560.1
ENST00000254878.3 |
HRSP12
|
heat-responsive protein 12 |
| chr6_+_153071925 | 0.39 |
ENST00000367244.3
ENST00000367243.3 |
VIP
|
vasoactive intestinal peptide |
| chr12_-_53994805 | 0.37 |
ENST00000328463.7
|
ATF7
|
activating transcription factor 7 |
| chr8_+_101170563 | 0.37 |
ENST00000520508.1
ENST00000388798.2 |
SPAG1
|
sperm associated antigen 1 |
| chr1_+_214161272 | 0.35 |
ENST00000498508.2
ENST00000366958.4 |
PROX1
|
prospero homeobox 1 |
| chr11_+_33061543 | 0.34 |
ENST00000432887.1
ENST00000528898.1 ENST00000531632.2 |
TCP11L1
|
t-complex 11, testis-specific-like 1 |
| chr16_+_57279004 | 0.33 |
ENST00000219204.3
|
ARL2BP
|
ADP-ribosylation factor-like 2 binding protein |
| chr17_-_39623681 | 0.33 |
ENST00000225899.3
|
KRT32
|
keratin 32 |
| chr8_+_24298597 | 0.33 |
ENST00000380789.1
|
ADAM7
|
ADAM metallopeptidase domain 7 |
| chr3_+_158787041 | 0.31 |
ENST00000471575.1
ENST00000476809.1 ENST00000485419.1 |
IQCJ-SCHIP1
|
IQCJ-SCHIP1 readthrough |
| chr2_-_100987007 | 0.31 |
ENST00000595083.1
|
AC012493.2
|
Uncharacterized protein |
| chr3_+_15045419 | 0.31 |
ENST00000406272.2
|
NR2C2
|
nuclear receptor subfamily 2, group C, member 2 |
| chr19_+_1440838 | 0.30 |
ENST00000594262.1
|
AC027307.3
|
Uncharacterized protein |
| chr19_-_46088068 | 0.30 |
ENST00000263275.4
ENST00000323060.3 |
OPA3
|
optic atrophy 3 (autosomal recessive, with chorea and spastic paraplegia) |
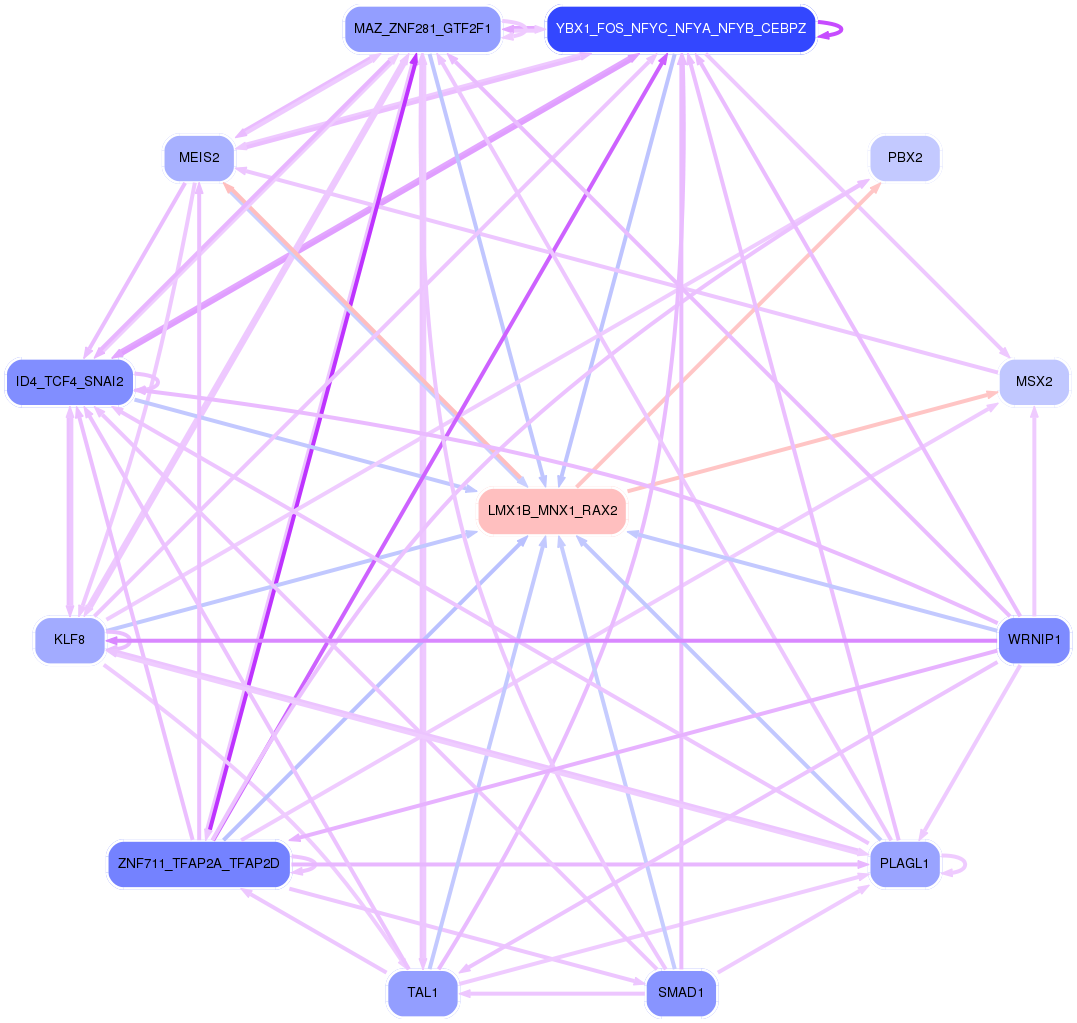
Network of associatons between targets according to the STRING database.

First level regulatory network of LMX1B_MNX1_RAX2
Gene Ontology Analysis
Gene overrepresentation in biological_process category:
| Log-likelihood per target | Total log-likelihood | Term | Description |
|---|---|---|---|
| 5.3 | 16.0 | GO:0006422 | aspartyl-tRNA aminoacylation(GO:0006422) |
| 2.5 | 10.1 | GO:0021812 | neuronal-glial interaction involved in cerebral cortex radial glia guided migration(GO:0021812) |
| 1.8 | 5.4 | GO:0051795 | positive regulation of catagen(GO:0051795) activation of meiosis(GO:0090427) |
| 1.5 | 8.9 | GO:0032468 | Golgi calcium ion homeostasis(GO:0032468) |
| 1.3 | 15.1 | GO:0090160 | Golgi to lysosome transport(GO:0090160) |
| 1.2 | 28.1 | GO:0003334 | keratinocyte development(GO:0003334) |
| 1.1 | 4.6 | GO:0045715 | negative regulation of low-density lipoprotein particle receptor biosynthetic process(GO:0045715) |
| 1.1 | 6.7 | GO:0016479 | negative regulation of transcription from RNA polymerase I promoter(GO:0016479) |
| 1.1 | 3.2 | GO:0061357 | positive regulation of Wnt protein secretion(GO:0061357) |
| 1.0 | 3.0 | GO:0098923 | retrograde trans-synaptic signaling by soluble gas(GO:0098923) trans-synaptic signaling by soluble gas(GO:0099543) trans-synaptic signaling by trans-synaptic complex(GO:0099545) |
| 0.9 | 5.7 | GO:0006177 | GMP biosynthetic process(GO:0006177) |
| 0.9 | 8.5 | GO:1900378 | positive regulation of melanin biosynthetic process(GO:0048023) positive regulation of secondary metabolite biosynthetic process(GO:1900378) |
| 0.9 | 2.7 | GO:0021823 | cerebral cortex tangential migration using cell-cell interactions(GO:0021823) postnatal olfactory bulb interneuron migration(GO:0021827) chemorepulsion involved in postnatal olfactory bulb interneuron migration(GO:0021836) regulation of negative chemotaxis(GO:0050923) |
| 0.8 | 4.0 | GO:0042997 | negative regulation of Golgi to plasma membrane protein transport(GO:0042997) |
| 0.7 | 2.9 | GO:0050883 | negative regulation of sodium:proton antiporter activity(GO:0032416) gastric motility(GO:0035482) gastric emptying(GO:0035483) musculoskeletal movement, spinal reflex action(GO:0050883) |
| 0.7 | 2.1 | GO:0044878 | mitotic cytokinesis checkpoint(GO:0044878) ubiquitin-independent protein catabolic process via the multivesicular body sorting pathway(GO:0090611) |
| 0.7 | 4.1 | GO:1903435 | positive regulation of constitutive secretory pathway(GO:1903435) |
| 0.7 | 0.7 | GO:0035992 | tendon cell differentiation(GO:0035990) tendon formation(GO:0035992) |
| 0.7 | 2.0 | GO:0060585 | regulation of prostaglandin-endoperoxide synthase activity(GO:0060584) positive regulation of prostaglandin-endoperoxide synthase activity(GO:0060585) |
| 0.6 | 4.4 | GO:1901419 | regulation of response to alcohol(GO:1901419) |
| 0.6 | 6.1 | GO:0035414 | negative regulation of catenin import into nucleus(GO:0035414) |
| 0.6 | 7.4 | GO:0035372 | protein localization to microtubule(GO:0035372) |
| 0.6 | 1.7 | GO:2000118 | regulation of sodium-dependent phosphate transport(GO:2000118) |
| 0.5 | 1.6 | GO:0044205 | 'de novo' UMP biosynthetic process(GO:0044205) |
| 0.5 | 1.9 | GO:0060743 | epithelial cell maturation involved in prostate gland development(GO:0060743) |
| 0.4 | 10.2 | GO:0000185 | activation of MAPKKK activity(GO:0000185) |
| 0.4 | 2.6 | GO:0061484 | hematopoietic stem cell homeostasis(GO:0061484) |
| 0.4 | 1.3 | GO:0060920 | atrioventricular node development(GO:0003162) cardiac pacemaker cell differentiation(GO:0060920) cardiac pacemaker cell development(GO:0060926) |
| 0.4 | 2.4 | GO:0002501 | peptide antigen assembly with MHC protein complex(GO:0002501) |
| 0.4 | 4.4 | GO:0051918 | negative regulation of fibrinolysis(GO:0051918) |
| 0.4 | 3.9 | GO:0071578 | zinc II ion transmembrane import(GO:0071578) |
| 0.4 | 1.5 | GO:0019276 | UDP-N-acetylgalactosamine metabolic process(GO:0019276) |
| 0.4 | 3.6 | GO:0032277 | negative regulation of gonadotropin secretion(GO:0032277) |
| 0.3 | 6.2 | GO:0007084 | mitotic nuclear envelope reassembly(GO:0007084) |
| 0.3 | 2.3 | GO:0003150 | muscular septum morphogenesis(GO:0003150) |
| 0.3 | 8.7 | GO:0072663 | protein targeting to peroxisome(GO:0006625) protein localization to peroxisome(GO:0072662) establishment of protein localization to peroxisome(GO:0072663) |
| 0.3 | 2.3 | GO:0021847 | ventricular zone neuroblast division(GO:0021847) |
| 0.3 | 1.8 | GO:0007352 | zygotic specification of dorsal/ventral axis(GO:0007352) |
| 0.3 | 8.9 | GO:0042776 | mitochondrial ATP synthesis coupled proton transport(GO:0042776) |
| 0.3 | 13.1 | GO:0045104 | intermediate filament cytoskeleton organization(GO:0045104) |
| 0.3 | 0.8 | GO:0014816 | skeletal muscle satellite cell differentiation(GO:0014816) negative regulation of skeletal muscle cell proliferation(GO:0014859) regulation of skeletal muscle tissue growth(GO:0048631) negative regulation of skeletal muscle satellite cell proliferation(GO:1902723) |
| 0.3 | 6.3 | GO:0032331 | negative regulation of chondrocyte differentiation(GO:0032331) |
| 0.2 | 1.0 | GO:1904502 | regulation of lipophagy(GO:1904502) positive regulation of lipophagy(GO:1904504) |
| 0.2 | 2.2 | GO:1904352 | positive regulation of protein catabolic process in the vacuole(GO:1904352) |
| 0.2 | 2.6 | GO:2000172 | regulation of branching morphogenesis of a nerve(GO:2000172) |
| 0.2 | 0.5 | GO:0051799 | negative regulation of hair follicle development(GO:0051799) |
| 0.2 | 9.6 | GO:0051894 | positive regulation of focal adhesion assembly(GO:0051894) |
| 0.2 | 1.7 | GO:0002074 | extraocular skeletal muscle development(GO:0002074) |
| 0.2 | 0.8 | GO:1901529 | positive regulation of anion channel activity(GO:1901529) |
| 0.2 | 1.8 | GO:0030202 | heparin metabolic process(GO:0030202) heparin biosynthetic process(GO:0030210) |
| 0.2 | 12.6 | GO:0006120 | mitochondrial electron transport, NADH to ubiquinone(GO:0006120) |
| 0.2 | 4.9 | GO:0071108 | protein K48-linked deubiquitination(GO:0071108) |
| 0.2 | 3.2 | GO:0007064 | mitotic sister chromatid cohesion(GO:0007064) |
| 0.2 | 0.6 | GO:0045897 | positive regulation of transcription during mitosis(GO:0045897) |
| 0.2 | 3.8 | GO:0048026 | positive regulation of mRNA splicing, via spliceosome(GO:0048026) |
| 0.2 | 0.5 | GO:0006425 | glutaminyl-tRNA aminoacylation(GO:0006425) valyl-tRNA aminoacylation(GO:0006438) |
| 0.2 | 9.2 | GO:1900739 | regulation of protein insertion into mitochondrial membrane involved in apoptotic signaling pathway(GO:1900739) positive regulation of protein insertion into mitochondrial membrane involved in apoptotic signaling pathway(GO:1900740) |
| 0.2 | 3.4 | GO:0035589 | G-protein coupled purinergic nucleotide receptor signaling pathway(GO:0035589) |
| 0.2 | 0.8 | GO:0021759 | globus pallidus development(GO:0021759) |
| 0.2 | 4.7 | GO:0009954 | proximal/distal pattern formation(GO:0009954) |
| 0.2 | 0.6 | GO:0046116 | queuosine biosynthetic process(GO:0008616) queuosine metabolic process(GO:0046116) |
| 0.2 | 3.2 | GO:0089711 | L-glutamate transmembrane transport(GO:0089711) |
| 0.2 | 1.7 | GO:0009642 | response to light intensity(GO:0009642) |
| 0.2 | 1.1 | GO:1990403 | embryonic brain development(GO:1990403) |
| 0.2 | 11.1 | GO:0008542 | visual learning(GO:0008542) |
| 0.1 | 6.0 | GO:0001919 | regulation of receptor recycling(GO:0001919) |
| 0.1 | 2.1 | GO:0019852 | L-ascorbic acid metabolic process(GO:0019852) |
| 0.1 | 1.0 | GO:2000389 | regulation of neutrophil extravasation(GO:2000389) |
| 0.1 | 6.0 | GO:0043252 | sodium-independent organic anion transport(GO:0043252) |
| 0.1 | 0.4 | GO:0035948 | positive regulation of gluconeogenesis by positive regulation of transcription from RNA polymerase II promoter(GO:0035948) |
| 0.1 | 1.6 | GO:0070070 | proton-transporting V-type ATPase complex assembly(GO:0070070) vacuolar proton-transporting V-type ATPase complex assembly(GO:0070072) |
| 0.1 | 0.8 | GO:0002018 | renin-angiotensin regulation of aldosterone production(GO:0002018) |
| 0.1 | 2.3 | GO:0032793 | positive regulation of CREB transcription factor activity(GO:0032793) |
| 0.1 | 1.1 | GO:0001561 | fatty acid alpha-oxidation(GO:0001561) |
| 0.1 | 1.9 | GO:0045603 | positive regulation of endothelial cell differentiation(GO:0045603) |
| 0.1 | 1.0 | GO:0035542 | regulation of SNARE complex assembly(GO:0035542) |
| 0.1 | 0.3 | GO:0060298 | positive regulation of sarcomere organization(GO:0060298) |
| 0.1 | 0.3 | GO:1990637 | response to prolactin(GO:1990637) |
| 0.1 | 3.6 | GO:0035235 | ionotropic glutamate receptor signaling pathway(GO:0035235) |
| 0.1 | 2.3 | GO:0006337 | nucleosome disassembly(GO:0006337) |
| 0.1 | 0.7 | GO:0048733 | sebaceous gland development(GO:0048733) |
| 0.1 | 0.2 | GO:0021529 | spinal cord oligodendrocyte cell differentiation(GO:0021529) spinal cord oligodendrocyte cell fate specification(GO:0021530) oligodendrocyte cell fate specification(GO:0021778) oligodendrocyte cell fate commitment(GO:0021779) glial cell fate specification(GO:0021780) |
| 0.1 | 0.7 | GO:0014809 | regulation of skeletal muscle contraction by regulation of release of sequestered calcium ion(GO:0014809) |
| 0.1 | 0.4 | GO:0010578 | regulation of adenylate cyclase activity involved in G-protein coupled receptor signaling pathway(GO:0010578) positive regulation of adenylate cyclase activity involved in G-protein coupled receptor signaling pathway(GO:0010579) |
| 0.1 | 0.9 | GO:0007168 | receptor guanylyl cyclase signaling pathway(GO:0007168) |
| 0.1 | 0.2 | GO:1900133 | regulation of renin secretion into blood stream(GO:1900133) |
| 0.1 | 1.9 | GO:0001580 | detection of chemical stimulus involved in sensory perception of bitter taste(GO:0001580) |
| 0.1 | 0.8 | GO:0010739 | positive regulation of protein kinase A signaling(GO:0010739) |
| 0.1 | 5.1 | GO:0043647 | inositol phosphate metabolic process(GO:0043647) |
| 0.1 | 0.4 | GO:0002933 | lipid hydroxylation(GO:0002933) |
| 0.1 | 0.9 | GO:0046548 | retinal rod cell development(GO:0046548) |
| 0.1 | 6.1 | GO:0031424 | keratinization(GO:0031424) |
| 0.0 | 1.4 | GO:0006099 | tricarboxylic acid cycle(GO:0006099) |
| 0.0 | 0.7 | GO:0086069 | bundle of His cell to Purkinje myocyte communication(GO:0086069) |
| 0.0 | 1.1 | GO:0034204 | lipid translocation(GO:0034204) phospholipid translocation(GO:0045332) |
| 0.0 | 1.3 | GO:0016486 | peptide hormone processing(GO:0016486) |
| 0.0 | 1.2 | GO:0031954 | positive regulation of protein autophosphorylation(GO:0031954) |
| 0.0 | 0.8 | GO:0002230 | positive regulation of defense response to virus by host(GO:0002230) |
| 0.0 | 0.5 | GO:0043010 | camera-type eye development(GO:0043010) |
| 0.0 | 0.9 | GO:0035025 | positive regulation of Rho protein signal transduction(GO:0035025) |
| 0.0 | 0.1 | GO:0006651 | diacylglycerol biosynthetic process(GO:0006651) |
| 0.0 | 2.9 | GO:0042795 | snRNA transcription(GO:0009301) snRNA transcription from RNA polymerase II promoter(GO:0042795) |
| 0.0 | 0.4 | GO:1900121 | negative regulation of receptor binding(GO:1900121) |
| 0.0 | 1.2 | GO:2000272 | negative regulation of receptor activity(GO:2000272) |
| 0.0 | 1.2 | GO:0045599 | negative regulation of fat cell differentiation(GO:0045599) |
| 0.0 | 0.8 | GO:0003298 | physiological muscle hypertrophy(GO:0003298) physiological cardiac muscle hypertrophy(GO:0003301) cell growth involved in cardiac muscle cell development(GO:0061049) |
| 0.0 | 0.7 | GO:0006359 | regulation of transcription from RNA polymerase III promoter(GO:0006359) |
| 0.0 | 1.3 | GO:0045143 | homologous chromosome segregation(GO:0045143) |
| 0.0 | 0.2 | GO:0010735 | positive regulation of transcription via serum response element binding(GO:0010735) |
| 0.0 | 0.4 | GO:0018345 | protein palmitoylation(GO:0018345) |
| 0.0 | 11.6 | GO:0006936 | muscle contraction(GO:0006936) |
| 0.0 | 0.3 | GO:0045793 | positive regulation of cell size(GO:0045793) |
| 0.0 | 0.8 | GO:0061001 | regulation of dendritic spine morphogenesis(GO:0061001) |
| 0.0 | 3.6 | GO:0030705 | cytoskeleton-dependent intracellular transport(GO:0030705) |
| 0.0 | 1.9 | GO:0042035 | regulation of cytokine biosynthetic process(GO:0042035) |
| 0.0 | 3.2 | GO:0006614 | SRP-dependent cotranslational protein targeting to membrane(GO:0006614) |
| 0.0 | 0.4 | GO:0070286 | axonemal dynein complex assembly(GO:0070286) |
| 0.0 | 1.3 | GO:0000380 | alternative mRNA splicing, via spliceosome(GO:0000380) |
| 0.0 | 0.3 | GO:0051457 | maintenance of protein location in nucleus(GO:0051457) |
| 0.0 | 0.3 | GO:0070584 | mitochondrion morphogenesis(GO:0070584) |
| 0.0 | 2.5 | GO:0008584 | male gonad development(GO:0008584) development of primary male sexual characteristics(GO:0046546) |
| 0.0 | 1.2 | GO:0010923 | negative regulation of phosphatase activity(GO:0010923) |
| 0.0 | 2.5 | GO:0031032 | actomyosin structure organization(GO:0031032) |
| 0.0 | 1.9 | GO:0050821 | protein stabilization(GO:0050821) |
| 0.0 | 0.3 | GO:0046337 | phosphatidylethanolamine metabolic process(GO:0046337) |
Gene overrepresentation in cellular_component category:
| Log-likelihood per target | Total log-likelihood | Term | Description |
|---|---|---|---|
| 3.4 | 10.1 | GO:0005607 | laminin-2 complex(GO:0005607) |
| 2.9 | 14.4 | GO:0045272 | plasma membrane respiratory chain complex I(GO:0045272) |
| 2.2 | 6.7 | GO:0031523 | Myb complex(GO:0031523) |
| 1.5 | 4.6 | GO:0034686 | integrin alphav-beta6 complex(GO:0034685) integrin alphav-beta8 complex(GO:0034686) |
| 1.3 | 19.0 | GO:0030478 | actin cap(GO:0030478) |
| 0.8 | 14.6 | GO:0033162 | melanosome membrane(GO:0033162) chitosome(GO:0045009) |
| 0.8 | 16.5 | GO:0017101 | aminoacyl-tRNA synthetase multienzyme complex(GO:0017101) |
| 0.5 | 26.3 | GO:0002102 | podosome(GO:0002102) |
| 0.5 | 2.0 | GO:0048237 | rough endoplasmic reticulum lumen(GO:0048237) |
| 0.5 | 8.9 | GO:0000276 | mitochondrial proton-transporting ATP synthase complex, coupling factor F(o)(GO:0000276) |
| 0.5 | 2.5 | GO:0005726 | perichromatin fibrils(GO:0005726) |
| 0.4 | 1.7 | GO:0005863 | striated muscle myosin thick filament(GO:0005863) |
| 0.4 | 6.5 | GO:0017146 | NMDA selective glutamate receptor complex(GO:0017146) |
| 0.4 | 19.3 | GO:0045095 | keratin filament(GO:0045095) |
| 0.3 | 2.4 | GO:0042824 | MHC class I peptide loading complex(GO:0042824) |
| 0.3 | 1.3 | GO:0002193 | MAML1-RBP-Jkappa- ICN1 complex(GO:0002193) |
| 0.2 | 1.0 | GO:0017059 | serine C-palmitoyltransferase complex(GO:0017059) endoplasmic reticulum palmitoyltransferase complex(GO:0031211) |
| 0.2 | 4.4 | GO:0031089 | platelet dense granule lumen(GO:0031089) |
| 0.2 | 5.1 | GO:0010369 | chromocenter(GO:0010369) |
| 0.2 | 0.9 | GO:0035838 | growing cell tip(GO:0035838) |
| 0.2 | 6.2 | GO:0000159 | protein phosphatase type 2A complex(GO:0000159) |
| 0.2 | 2.1 | GO:0000815 | ESCRT III complex(GO:0000815) |
| 0.2 | 2.6 | GO:0005671 | Ada2/Gcn5/Ada3 transcription activator complex(GO:0005671) |
| 0.1 | 3.8 | GO:0005689 | U12-type spliceosomal complex(GO:0005689) |
| 0.1 | 2.9 | GO:0033276 | transcription factor TFTC complex(GO:0033276) |
| 0.1 | 2.9 | GO:0032982 | myosin filament(GO:0032982) |
| 0.1 | 2.2 | GO:0005922 | connexon complex(GO:0005922) |
| 0.1 | 7.4 | GO:0005881 | cytoplasmic microtubule(GO:0005881) |
| 0.1 | 28.2 | GO:0005802 | trans-Golgi network(GO:0005802) |
| 0.1 | 3.9 | GO:0031258 | lamellipodium membrane(GO:0031258) |
| 0.1 | 0.7 | GO:0014802 | terminal cisterna(GO:0014802) |
| 0.1 | 6.7 | GO:0005778 | peroxisomal membrane(GO:0005778) microbody membrane(GO:0031903) |
| 0.1 | 1.1 | GO:0036038 | MKS complex(GO:0036038) |
| 0.1 | 5.8 | GO:0005791 | rough endoplasmic reticulum(GO:0005791) |
| 0.1 | 2.3 | GO:0030669 | clathrin-coated endocytic vesicle membrane(GO:0030669) |
| 0.0 | 0.7 | GO:0005666 | DNA-directed RNA polymerase III complex(GO:0005666) |
| 0.0 | 1.0 | GO:0000145 | exocyst(GO:0000145) |
| 0.0 | 1.2 | GO:0016592 | mediator complex(GO:0016592) |
| 0.0 | 1.1 | GO:0097381 | photoreceptor disc membrane(GO:0097381) |
| 0.0 | 1.4 | GO:0005796 | Golgi lumen(GO:0005796) |
| 0.0 | 0.2 | GO:0005853 | eukaryotic translation elongation factor 1 complex(GO:0005853) |
| 0.0 | 1.2 | GO:0005665 | DNA-directed RNA polymerase II, core complex(GO:0005665) |
| 0.0 | 0.9 | GO:0008074 | guanylate cyclase complex, soluble(GO:0008074) |
| 0.0 | 15.2 | GO:0005667 | transcription factor complex(GO:0005667) |
| 0.0 | 14.2 | GO:0016607 | nuclear speck(GO:0016607) |
| 0.0 | 3.2 | GO:0022625 | cytosolic large ribosomal subunit(GO:0022625) |
| 0.0 | 1.3 | GO:0031526 | brush border membrane(GO:0031526) |
| 0.0 | 1.9 | GO:0005902 | microvillus(GO:0005902) |
| 0.0 | 2.0 | GO:0030864 | cortical actin cytoskeleton(GO:0030864) |
| 0.0 | 13.5 | GO:0005925 | focal adhesion(GO:0005925) |
| 0.0 | 7.0 | GO:0005769 | early endosome(GO:0005769) |
| 0.0 | 1.6 | GO:0043195 | terminal bouton(GO:0043195) |
| 0.0 | 0.6 | GO:0001917 | photoreceptor inner segment(GO:0001917) |
| 0.0 | 1.2 | GO:0042641 | actomyosin(GO:0042641) |
| 0.0 | 1.0 | GO:0005882 | intermediate filament(GO:0005882) |
| 0.0 | 0.1 | GO:0097129 | cyclin D2-CDK4 complex(GO:0097129) |
| 0.0 | 2.2 | GO:0005770 | late endosome(GO:0005770) |
| 0.0 | 2.8 | GO:0019897 | extrinsic component of plasma membrane(GO:0019897) |
| 0.0 | 1.2 | GO:0042470 | melanosome(GO:0042470) pigment granule(GO:0048770) |
| 0.0 | 0.1 | GO:0032311 | angiogenin-PRI complex(GO:0032311) |
| 0.0 | 2.6 | GO:0030139 | endocytic vesicle(GO:0030139) |
| 0.0 | 1.0 | GO:0035580 | specific granule lumen(GO:0035580) |
| 0.0 | 0.8 | GO:0043197 | dendritic spine(GO:0043197) neuron spine(GO:0044309) |
| 0.0 | 2.1 | GO:0005741 | mitochondrial outer membrane(GO:0005741) |
| 0.0 | 0.1 | GO:0016013 | syntrophin complex(GO:0016013) |
| 0.0 | 1.8 | GO:0072562 | blood microparticle(GO:0072562) |
Gene overrepresentation in molecular_function category:
| Log-likelihood per target | Total log-likelihood | Term | Description |
|---|---|---|---|
| 3.2 | 16.0 | GO:0004815 | aspartate-tRNA ligase activity(GO:0004815) |
| 2.2 | 13.1 | GO:1990254 | keratin filament binding(GO:1990254) |
| 1.7 | 6.7 | GO:0034988 | Fc-gamma receptor I complex binding(GO:0034988) |
| 1.4 | 5.7 | GO:0003938 | IMP dehydrogenase activity(GO:0003938) |
| 1.3 | 29.9 | GO:0051371 | muscle alpha-actinin binding(GO:0051371) |
| 1.0 | 5.1 | GO:0017161 | phosphatidylinositol-3,4-bisphosphate 4-phosphatase activity(GO:0016316) inositol-1,3,4-trisphosphate 4-phosphatase activity(GO:0017161) phosphatidylinositol-4,5-bisphosphate 4-phosphatase activity(GO:0034597) inositol-3,4-bisphosphate 4-phosphatase activity(GO:0052828) |
| 0.9 | 4.4 | GO:0060230 | lipoprotein lipase activator activity(GO:0060230) |
| 0.7 | 14.4 | GO:0051537 | 2 iron, 2 sulfur cluster binding(GO:0051537) |
| 0.7 | 19.0 | GO:0005523 | tropomyosin binding(GO:0005523) |
| 0.7 | 3.3 | GO:0005294 | neutral L-amino acid secondary active transmembrane transporter activity(GO:0005294) |
| 0.6 | 4.6 | GO:0019960 | C-X3-C chemokine binding(GO:0019960) |
| 0.5 | 1.6 | GO:0004088 | carbamoyl-phosphate synthase (ammonia) activity(GO:0004087) carbamoyl-phosphate synthase (glutamine-hydrolyzing) activity(GO:0004088) |
| 0.4 | 2.7 | GO:0008046 | axon guidance receptor activity(GO:0008046) |
| 0.4 | 3.0 | GO:0008454 | alpha-1,3-mannosylglycoprotein 4-beta-N-acetylglucosaminyltransferase activity(GO:0008454) |
| 0.4 | 2.9 | GO:0001591 | dopamine neurotransmitter receptor activity, coupled via Gi/Go(GO:0001591) |
| 0.4 | 2.0 | GO:0031708 | endothelin B receptor binding(GO:0031708) |
| 0.4 | 3.6 | GO:0004972 | NMDA glutamate receptor activity(GO:0004972) |
| 0.4 | 2.3 | GO:0004167 | dopachrome isomerase activity(GO:0004167) |
| 0.4 | 3.7 | GO:0010314 | phosphatidylinositol-5-phosphate binding(GO:0010314) |
| 0.4 | 4.9 | GO:0030280 | structural constituent of epidermis(GO:0030280) |
| 0.4 | 1.1 | GO:0019166 | trans-2-enoyl-CoA reductase (NADPH) activity(GO:0019166) |
| 0.3 | 1.0 | GO:0004758 | serine C-palmitoyltransferase activity(GO:0004758) C-palmitoyltransferase activity(GO:0016454) |
| 0.3 | 8.9 | GO:0046933 | proton-transporting ATP synthase activity, rotational mechanism(GO:0046933) |
| 0.3 | 6.2 | GO:0048156 | tau protein binding(GO:0048156) |
| 0.3 | 6.3 | GO:0051428 | peptide hormone receptor binding(GO:0051428) |
| 0.3 | 8.9 | GO:0005388 | calcium-transporting ATPase activity(GO:0005388) |
| 0.3 | 1.5 | GO:0047237 | glucuronylgalactosylproteoglycan 4-beta-N-acetylgalactosaminyltransferase activity(GO:0047237) |
| 0.3 | 2.4 | GO:0001849 | complement component C1q binding(GO:0001849) |
| 0.3 | 3.2 | GO:0031852 | mu-type opioid receptor binding(GO:0031852) |
| 0.3 | 1.4 | GO:0046912 | transferase activity, transferring acyl groups, acyl groups converted into alkyl on transfer(GO:0046912) |
| 0.3 | 6.0 | GO:0015125 | bile acid transmembrane transporter activity(GO:0015125) |
| 0.3 | 2.3 | GO:0005005 | transmembrane-ephrin receptor activity(GO:0005005) |
| 0.2 | 2.5 | GO:0034056 | estrogen response element binding(GO:0034056) |
| 0.2 | 3.0 | GO:0042043 | neurexin family protein binding(GO:0042043) |
| 0.2 | 1.7 | GO:0015321 | sodium-dependent phosphate transmembrane transporter activity(GO:0015321) |
| 0.2 | 2.9 | GO:0017162 | aryl hydrocarbon receptor binding(GO:0017162) |
| 0.2 | 3.9 | GO:0005385 | zinc ion transmembrane transporter activity(GO:0005385) |
| 0.2 | 8.7 | GO:0031593 | polyubiquitin binding(GO:0031593) |
| 0.2 | 1.2 | GO:0015016 | [heparan sulfate]-glucosamine N-sulfotransferase activity(GO:0015016) |
| 0.2 | 0.6 | GO:0034739 | histone deacetylase activity (H4-K16 specific)(GO:0034739) |
| 0.2 | 0.5 | GO:0004819 | glutamine-tRNA ligase activity(GO:0004819) valine-tRNA ligase activity(GO:0004832) |
| 0.2 | 1.9 | GO:0033038 | bitter taste receptor activity(GO:0033038) |
| 0.2 | 3.4 | GO:0001608 | G-protein coupled nucleotide receptor activity(GO:0001608) G-protein coupled purinergic nucleotide receptor activity(GO:0045028) |
| 0.2 | 0.8 | GO:0090554 | phosphatidylcholine-translocating ATPase activity(GO:0090554) |
| 0.2 | 0.5 | GO:0042015 | interleukin-20 binding(GO:0042015) |
| 0.2 | 4.0 | GO:0034236 | protein kinase A catalytic subunit binding(GO:0034236) |
| 0.2 | 4.1 | GO:0031489 | myosin V binding(GO:0031489) |
| 0.1 | 0.7 | GO:0031013 | troponin I binding(GO:0031013) |
| 0.1 | 2.3 | GO:0003688 | DNA replication origin binding(GO:0003688) |
| 0.1 | 0.6 | GO:0008479 | queuine tRNA-ribosyltransferase activity(GO:0008479) |
| 0.1 | 1.2 | GO:0045545 | syndecan binding(GO:0045545) |
| 0.1 | 5.9 | GO:0005544 | calcium-dependent phospholipid binding(GO:0005544) |
| 0.1 | 2.3 | GO:0042813 | Wnt-activated receptor activity(GO:0042813) |
| 0.1 | 1.8 | GO:0008349 | MAP kinase kinase kinase kinase activity(GO:0008349) |
| 0.1 | 0.9 | GO:0070915 | lysophosphatidic acid receptor activity(GO:0070915) |
| 0.1 | 7.0 | GO:0005507 | copper ion binding(GO:0005507) |
| 0.1 | 2.3 | GO:0017166 | vinculin binding(GO:0017166) |
| 0.1 | 3.1 | GO:0048027 | mRNA 5'-UTR binding(GO:0048027) |
| 0.1 | 8.9 | GO:0005201 | extracellular matrix structural constituent(GO:0005201) |
| 0.1 | 0.4 | GO:0034875 | oxidoreductase activity, acting on CH or CH2 groups, quinone or similar compound as acceptor(GO:0033695) caffeine oxidase activity(GO:0034875) |
| 0.1 | 1.2 | GO:0042809 | vitamin D receptor binding(GO:0042809) |
| 0.1 | 0.9 | GO:0015643 | toxic substance binding(GO:0015643) |
| 0.1 | 2.1 | GO:0004129 | cytochrome-c oxidase activity(GO:0004129) heme-copper terminal oxidase activity(GO:0015002) oxidoreductase activity, acting on a heme group of donors, oxygen as acceptor(GO:0016676) |
| 0.1 | 5.1 | GO:0035064 | methylated histone binding(GO:0035064) |
| 0.1 | 1.8 | GO:0008327 | methyl-CpG binding(GO:0008327) |
| 0.1 | 0.2 | GO:0008502 | melatonin receptor activity(GO:0008502) |
| 0.1 | 1.6 | GO:0008093 | cytoskeletal adaptor activity(GO:0008093) |
| 0.1 | 4.9 | GO:0004843 | thiol-dependent ubiquitin-specific protease activity(GO:0004843) |
| 0.1 | 0.8 | GO:0001161 | intronic transcription regulatory region sequence-specific DNA binding(GO:0001161) intronic transcription regulatory region DNA binding(GO:0044213) |
| 0.1 | 2.6 | GO:0019213 | deacetylase activity(GO:0019213) |
| 0.1 | 1.1 | GO:0004012 | phospholipid-translocating ATPase activity(GO:0004012) |
| 0.1 | 2.6 | GO:0047485 | protein N-terminus binding(GO:0047485) |
| 0.1 | 1.0 | GO:0017049 | GTP-Rho binding(GO:0017049) |
| 0.1 | 0.6 | GO:0016857 | racemase and epimerase activity, acting on carbohydrates and derivatives(GO:0016857) |
| 0.0 | 5.8 | GO:0051219 | phosphoprotein binding(GO:0051219) |
| 0.0 | 0.3 | GO:0050692 | DBD domain binding(GO:0050692) |
| 0.0 | 0.8 | GO:0005539 | glycosaminoglycan binding(GO:0005539) |
| 0.0 | 12.5 | GO:0003714 | transcription corepressor activity(GO:0003714) |
| 0.0 | 2.7 | GO:0005160 | transforming growth factor beta receptor binding(GO:0005160) |
| 0.0 | 1.4 | GO:0000146 | microfilament motor activity(GO:0000146) |
| 0.0 | 6.2 | GO:0017137 | Rab GTPase binding(GO:0017137) |
| 0.0 | 0.8 | GO:0070001 | aspartic-type endopeptidase activity(GO:0004190) aspartic-type peptidase activity(GO:0070001) |
| 0.0 | 13.8 | GO:0003712 | transcription cofactor activity(GO:0003712) |
| 0.0 | 0.3 | GO:0047499 | calcium-independent phospholipase A2 activity(GO:0047499) |
| 0.0 | 0.8 | GO:0046875 | ephrin receptor binding(GO:0046875) |
| 0.0 | 0.7 | GO:0001056 | RNA polymerase III activity(GO:0001056) |
| 0.0 | 0.1 | GO:0050309 | glucose-6-phosphatase activity(GO:0004346) sugar-terminal-phosphatase activity(GO:0050309) |
| 0.0 | 5.3 | GO:0001047 | core promoter binding(GO:0001047) |
| 0.0 | 1.2 | GO:0004222 | metalloendopeptidase activity(GO:0004222) |
| 0.0 | 15.7 | GO:0008270 | zinc ion binding(GO:0008270) |
| 0.0 | 0.2 | GO:0003707 | steroid hormone receptor activity(GO:0003707) |
| 0.0 | 0.4 | GO:0016409 | palmitoyltransferase activity(GO:0016409) |
| 0.0 | 1.8 | GO:0005179 | hormone activity(GO:0005179) |
| 0.0 | 6.3 | GO:0008134 | transcription factor binding(GO:0008134) |
| 0.0 | 3.2 | GO:0003735 | structural constituent of ribosome(GO:0003735) |
| 0.0 | 0.3 | GO:0001205 | transcriptional activator activity, RNA polymerase II distal enhancer sequence-specific binding(GO:0001205) |
| 0.0 | 0.1 | GO:0016812 | hydrolase activity, acting on carbon-nitrogen (but not peptide) bonds, in cyclic amides(GO:0016812) |
| 0.0 | 2.2 | GO:0061630 | ubiquitin protein ligase activity(GO:0061630) ubiquitin-like protein ligase activity(GO:0061659) |
| 0.0 | 2.2 | GO:0030414 | peptidase inhibitor activity(GO:0030414) |
| 0.0 | 2.2 | GO:0008022 | protein C-terminus binding(GO:0008022) |
Gene overrepresentation in C2:CP category:
| Log-likelihood per target | Total log-likelihood | Term | Description |
|---|---|---|---|
| 0.4 | 10.1 | PID INTEGRIN4 PATHWAY | Alpha6 beta4 integrin-ligand interactions |
| 0.2 | 4.6 | PID INTEGRIN5 PATHWAY | Beta5 beta6 beta7 and beta8 integrin cell surface interactions |
| 0.1 | 8.4 | PID AURORA A PATHWAY | Aurora A signaling |
| 0.1 | 6.7 | PID WNT NONCANONICAL PATHWAY | Noncanonical Wnt signaling pathway |
| 0.1 | 4.0 | PID HEDGEHOG 2PATHWAY | Signaling events mediated by the Hedgehog family |
| 0.1 | 9.6 | PID ILK PATHWAY | Integrin-linked kinase signaling |
| 0.1 | 13.5 | PID E2F PATHWAY | E2F transcription factor network |
| 0.1 | 3.6 | PID REELIN PATHWAY | Reelin signaling pathway |
| 0.1 | 1.9 | PID ALK1 PATHWAY | ALK1 signaling events |
| 0.1 | 4.0 | ST B CELL ANTIGEN RECEPTOR | B Cell Antigen Receptor |
| 0.1 | 6.2 | PID TGFBR PATHWAY | TGF-beta receptor signaling |
| 0.1 | 2.2 | ST WNT BETA CATENIN PATHWAY | Wnt/beta-catenin Pathway |
| 0.1 | 2.3 | PID EPHA FWDPATHWAY | EPHA forward signaling |
| 0.1 | 1.3 | PID LIS1 PATHWAY | Lissencephaly gene (LIS1) in neuronal migration and development |
| 0.1 | 0.3 | PID AR NONGENOMIC PATHWAY | Nongenotropic Androgen signaling |
| 0.1 | 0.9 | PID LPA4 PATHWAY | LPA4-mediated signaling events |
| 0.1 | 10.1 | PID P53 DOWNSTREAM PATHWAY | Direct p53 effectors |
| 0.0 | 2.7 | PID AJDISS 2PATHWAY | Posttranslational regulation of adherens junction stability and dissassembly |
| 0.0 | 2.8 | PID AR TF PATHWAY | Regulation of Androgen receptor activity |
| 0.0 | 2.0 | PID ENDOTHELIN PATHWAY | Endothelins |
| 0.0 | 1.6 | ST FAS SIGNALING PATHWAY | Fas Signaling Pathway |
| 0.0 | 1.8 | PID TNF PATHWAY | TNF receptor signaling pathway |
| 0.0 | 4.8 | NABA ECM AFFILIATED | Genes encoding proteins affiliated structurally or functionally to extracellular matrix proteins |
| 0.0 | 2.1 | PID CXCR4 PATHWAY | CXCR4-mediated signaling events |
| 0.0 | 1.2 | PID CDC42 PATHWAY | CDC42 signaling events |
| 0.0 | 0.6 | PID HDAC CLASSIII PATHWAY | Signaling events mediated by HDAC Class III |
| 0.0 | 0.4 | PID HNF3A PATHWAY | FOXA1 transcription factor network |
| 0.0 | 0.8 | PID HNF3B PATHWAY | FOXA2 and FOXA3 transcription factor networks |
| 0.0 | 0.4 | PID INTEGRIN A9B1 PATHWAY | Alpha9 beta1 integrin signaling events |
| 0.0 | 0.5 | PID HES HEY PATHWAY | Notch-mediated HES/HEY network |
| 0.0 | 0.6 | PID PLK1 PATHWAY | PLK1 signaling events |
| 0.0 | 0.8 | PID REG GR PATHWAY | Glucocorticoid receptor regulatory network |
| 0.0 | 0.8 | PID HIF1 TFPATHWAY | HIF-1-alpha transcription factor network |
Gene overrepresentation in C2:CP:REACTOME category:
| Log-likelihood per target | Total log-likelihood | Term | Description |
|---|---|---|---|
| 0.5 | 16.5 | REACTOME CYTOSOLIC TRNA AMINOACYLATION | Genes involved in Cytosolic tRNA aminoacylation |
| 0.4 | 6.0 | REACTOME RECYCLING OF BILE ACIDS AND SALTS | Genes involved in Recycling of bile acids and salts |
| 0.3 | 9.6 | REACTOME CELL EXTRACELLULAR MATRIX INTERACTIONS | Genes involved in Cell-extracellular matrix interactions |
| 0.3 | 5.1 | REACTOME SYNTHESIS OF PIPS AT THE EARLY ENDOSOME MEMBRANE | Genes involved in Synthesis of PIPs at the early endosome membrane |
| 0.3 | 5.7 | REACTOME PURINE RIBONUCLEOSIDE MONOPHOSPHATE BIOSYNTHESIS | Genes involved in Purine ribonucleoside monophosphate biosynthesis |
| 0.3 | 21.3 | REACTOME SMOOTH MUSCLE CONTRACTION | Genes involved in Smooth Muscle Contraction |
| 0.3 | 3.6 | REACTOME RAS ACTIVATION UOPN CA2 INFUX THROUGH NMDA RECEPTOR | Genes involved in Ras activation uopn Ca2+ infux through NMDA receptor |
| 0.2 | 3.9 | REACTOME ZINC TRANSPORTERS | Genes involved in Zinc transporters |
| 0.2 | 4.6 | REACTOME PECAM1 INTERACTIONS | Genes involved in PECAM1 interactions |
| 0.2 | 6.1 | REACTOME SIGNALING BY HIPPO | Genes involved in Signaling by Hippo |
| 0.2 | 2.4 | REACTOME ACTIVATION OF CHAPERONE GENES BY ATF6 ALPHA | Genes involved in Activation of Chaperone Genes by ATF6-alpha |
| 0.2 | 4.0 | REACTOME PHOSPHORYLATION OF CD3 AND TCR ZETA CHAINS | Genes involved in Phosphorylation of CD3 and TCR zeta chains |
| 0.2 | 4.1 | REACTOME INSULIN SYNTHESIS AND PROCESSING | Genes involved in Insulin Synthesis and Processing |
| 0.1 | 12.6 | REACTOME RESPIRATORY ELECTRON TRANSPORT | Genes involved in Respiratory electron transport |
| 0.1 | 7.6 | REACTOME ION TRANSPORT BY P TYPE ATPASES | Genes involved in Ion transport by P-type ATPases |
| 0.1 | 3.6 | REACTOME POST CHAPERONIN TUBULIN FOLDING PATHWAY | Genes involved in Post-chaperonin tubulin folding pathway |
| 0.1 | 3.0 | REACTOME N GLYCAN ANTENNAE ELONGATION | Genes involved in N-Glycan antennae elongation |
| 0.1 | 2.2 | REACTOME GAP JUNCTION ASSEMBLY | Genes involved in Gap junction assembly |
| 0.1 | 2.7 | REACTOME ACTIVATION OF RAC | Genes involved in Activation of Rac |
| 0.1 | 1.3 | REACTOME NOTCH HLH TRANSCRIPTION PATHWAY | Genes involved in Notch-HLH transcription pathway |
| 0.1 | 1.6 | REACTOME HORMONE LIGAND BINDING RECEPTORS | Genes involved in Hormone ligand-binding receptors |
| 0.1 | 2.1 | REACTOME ENDOSOMAL SORTING COMPLEX REQUIRED FOR TRANSPORT ESCRT | Genes involved in Endosomal Sorting Complex Required For Transport (ESCRT) |
| 0.1 | 6.3 | REACTOME G1 PHASE | Genes involved in G1 Phase |
| 0.1 | 2.9 | REACTOME RNA POL II TRANSCRIPTION PRE INITIATION AND PROMOTER OPENING | Genes involved in RNA Polymerase II Transcription Pre-Initiation And Promoter Opening |
| 0.1 | 3.2 | REACTOME BASIGIN INTERACTIONS | Genes involved in Basigin interactions |
| 0.1 | 11.4 | REACTOME L1CAM INTERACTIONS | Genes involved in L1CAM interactions |
| 0.1 | 1.4 | REACTOME CITRIC ACID CYCLE TCA CYCLE | Genes involved in Citric acid cycle (TCA cycle) |
| 0.1 | 2.9 | REACTOME AMINE LIGAND BINDING RECEPTORS | Genes involved in Amine ligand-binding receptors |
| 0.1 | 0.8 | REACTOME ABACAVIR TRANSPORT AND METABOLISM | Genes involved in Abacavir transport and metabolism |
| 0.1 | 3.8 | REACTOME MRNA SPLICING MINOR PATHWAY | Genes involved in mRNA Splicing - Minor Pathway |
| 0.1 | 7.3 | REACTOME CLASS B 2 SECRETIN FAMILY RECEPTORS | Genes involved in Class B/2 (Secretin family receptors) |
| 0.1 | 0.7 | REACTOME RNA POL III CHAIN ELONGATION | Genes involved in RNA Polymerase III Chain Elongation |
| 0.1 | 1.8 | REACTOME HS GAG BIOSYNTHESIS | Genes involved in HS-GAG biosynthesis |
| 0.0 | 0.9 | REACTOME P2Y RECEPTORS | Genes involved in P2Y receptors |
| 0.0 | 1.6 | REACTOME PYRIMIDINE METABOLISM | Genes involved in Pyrimidine metabolism |
| 0.0 | 2.1 | REACTOME METABOLISM OF VITAMINS AND COFACTORS | Genes involved in Metabolism of vitamins and cofactors |
| 0.0 | 1.0 | REACTOME SPHINGOLIPID DE NOVO BIOSYNTHESIS | Genes involved in Sphingolipid de novo biosynthesis |
| 0.0 | 3.9 | REACTOME FACTORS INVOLVED IN MEGAKARYOCYTE DEVELOPMENT AND PLATELET PRODUCTION | Genes involved in Factors involved in megakaryocyte development and platelet production |
| 0.0 | 0.4 | REACTOME XENOBIOTICS | Genes involved in Xenobiotics |
| 0.0 | 3.2 | REACTOME PEPTIDE CHAIN ELONGATION | Genes involved in Peptide chain elongation |
| 0.0 | 0.7 | REACTOME TIGHT JUNCTION INTERACTIONS | Genes involved in Tight junction interactions |
| 0.0 | 2.6 | REACTOME DIABETES PATHWAYS | Genes involved in Diabetes pathways |
| 0.0 | 1.3 | REACTOME TRANSPORT OF INORGANIC CATIONS ANIONS AND AMINO ACIDS OLIGOPEPTIDES | Genes involved in Transport of inorganic cations/anions and amino acids/oligopeptides |
| 0.0 | 0.5 | REACTOME ABC FAMILY PROTEINS MEDIATED TRANSPORT | Genes involved in ABC-family proteins mediated transport |