Project
GNF SymAtlas + NCI-60 cancer cell lines, comparison of cancers vs non-cancers, human (Su, 2004; Ross, 2000)
Navigation
Downloads
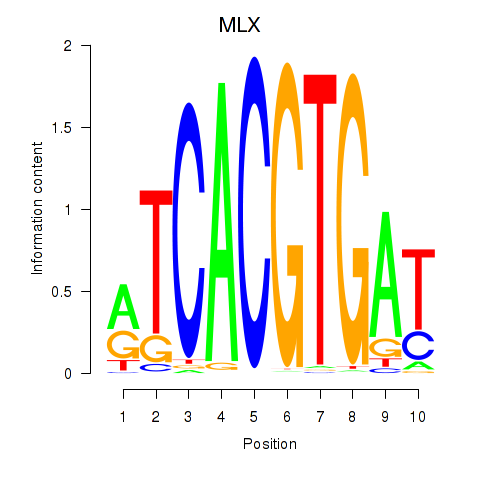
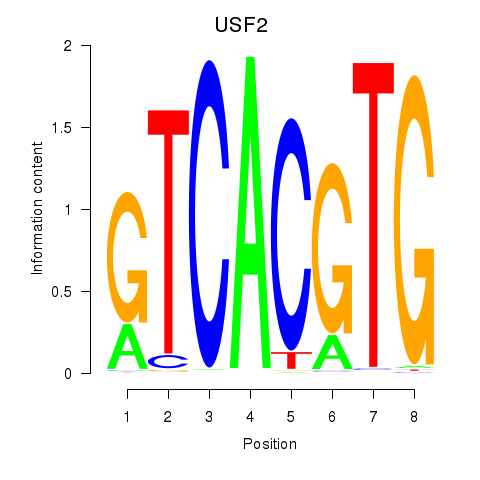
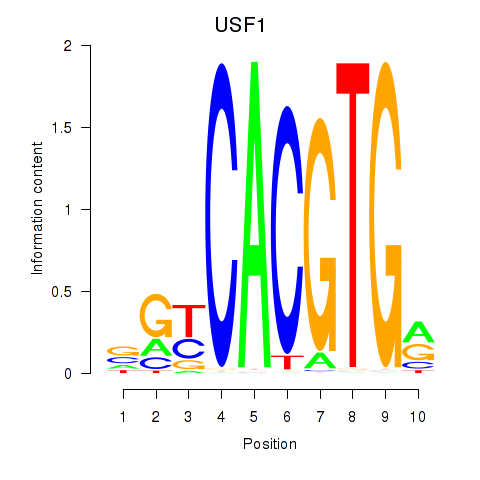
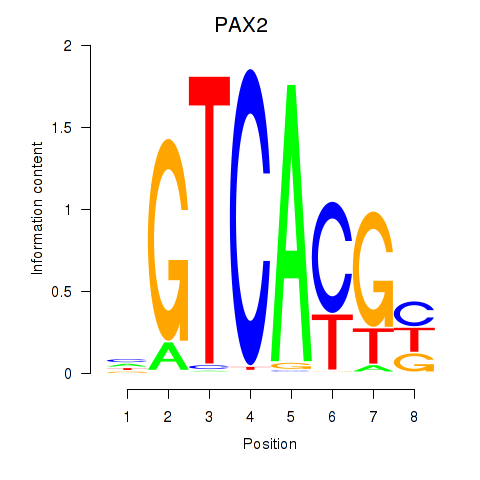
Results for MLX_USF2_USF1_PAX2
Z-value: 0.60
Motif logo
Transcription factors associated with MLX_USF2_USF1_PAX2
| Gene Symbol | Gene ID | Gene Info |
|---|---|---|
|
MLX
|
ENSG00000108788.7 | MAX dimerization protein MLX |
|
USF2
|
ENSG00000105698.11 | upstream transcription factor 2, c-fos interacting |
|
USF1
|
ENSG00000158773.10 | upstream transcription factor 1 |
|
PAX2
|
ENSG00000075891.17 | paired box 2 |
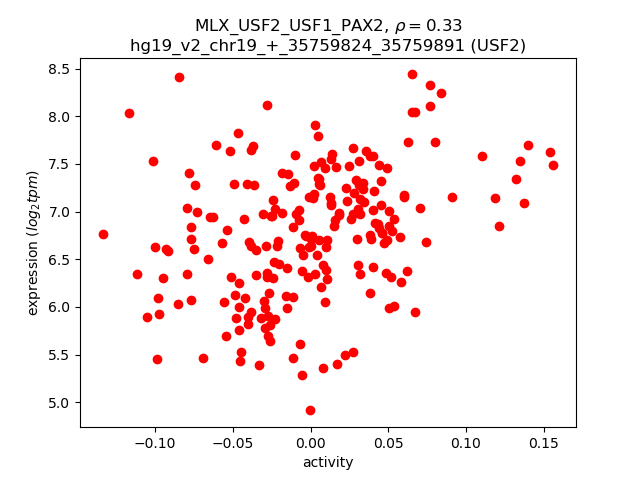
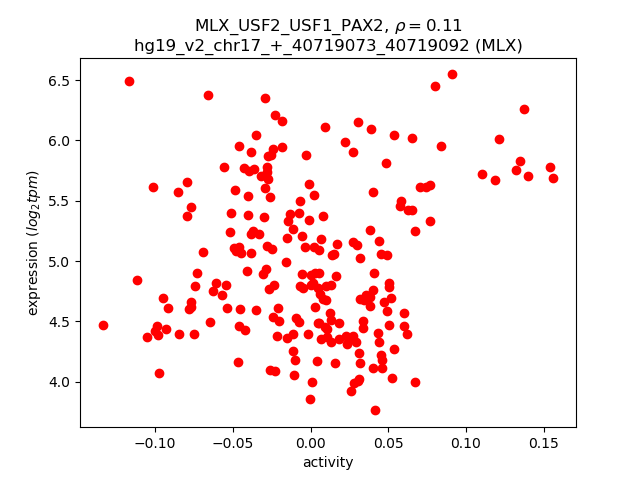
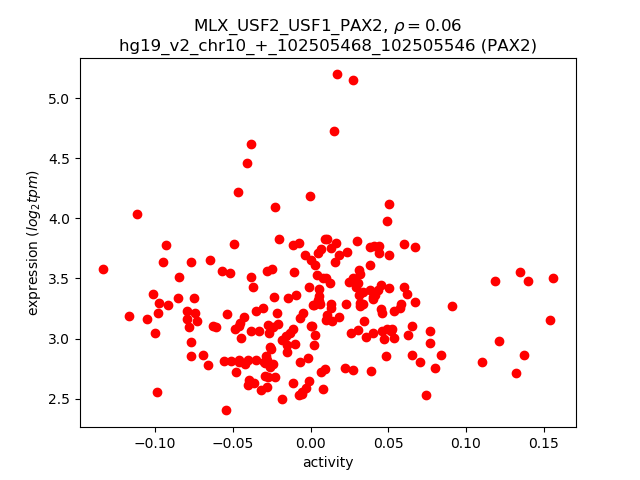
Activity-expression correlation:
| Gene | Promoter | Pearson corr. coef. | P-value | Plot |
|---|---|---|---|---|
| USF2 | hg19_v2_chr19_+_35759824_35759891 | 0.33 | 8.5e-07 | Click! |
| MLX | hg19_v2_chr17_+_40719073_40719092 | 0.11 | 1.0e-01 | Click! |
| PAX2 | hg19_v2_chr10_+_102505468_102505546 | 0.06 | 3.6e-01 | Click! |
Activity profile of MLX_USF2_USF1_PAX2 motif
Sorted Z-values of MLX_USF2_USF1_PAX2 motif
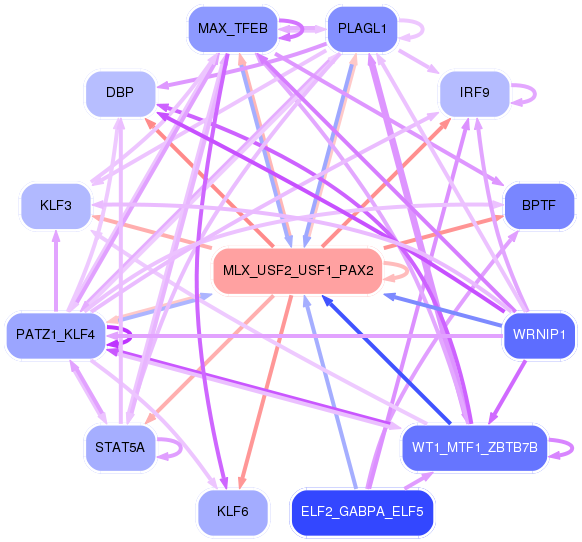
Network of associatons between targets according to the STRING database.

First level regulatory network of MLX_USF2_USF1_PAX2
Gene Ontology Analysis
Gene overrepresentation in biological_process category:
| Log-likelihood per target | Total log-likelihood | Term | Description |
|---|---|---|---|
| 14.8 | 59.2 | GO:0043323 | regulation of natural killer cell degranulation(GO:0043321) positive regulation of natural killer cell degranulation(GO:0043323) |
| 9.3 | 28.0 | GO:1902997 | regulation of choline O-acetyltransferase activity(GO:1902769) positive regulation of choline O-acetyltransferase activity(GO:1902771) negative regulation of tau-protein kinase activity(GO:1902948) positive regulation of early endosome to recycling endosome transport(GO:1902955) negative regulation of aspartic-type endopeptidase activity involved in amyloid precursor protein catabolic process(GO:1902960) negative regulation of neurofibrillary tangle assembly(GO:1902997) negative regulation of aspartic-type peptidase activity(GO:1905246) |
| 7.3 | 36.5 | GO:0070829 | response to vitamin B2(GO:0033274) heterochromatin maintenance(GO:0070829) |
| 7.1 | 21.4 | GO:0043311 | positive regulation of eosinophil degranulation(GO:0043311) positive regulation of eosinophil activation(GO:1902568) |
| 6.7 | 20.1 | GO:1990519 | pyrimidine nucleotide transport(GO:0006864) mitochondrial pyrimidine nucleotide import(GO:1990519) |
| 6.4 | 32.0 | GO:0051610 | negative regulation of neurotransmitter uptake(GO:0051581) serotonin uptake(GO:0051610) regulation of serotonin uptake(GO:0051611) negative regulation of serotonin uptake(GO:0051612) |
| 5.9 | 23.8 | GO:0035752 | lysosomal lumen pH elevation(GO:0035752) |
| 5.7 | 17.2 | GO:0002949 | tRNA threonylcarbamoyladenosine modification(GO:0002949) |
| 5.7 | 17.1 | GO:0022007 | neural plate elongation(GO:0014022) convergent extension involved in neural plate elongation(GO:0022007) |
| 5.2 | 21.0 | GO:0019859 | pyrimidine nucleobase catabolic process(GO:0006208) thymine catabolic process(GO:0006210) thymine metabolic process(GO:0019859) |
| 5.1 | 15.2 | GO:0090291 | negative regulation of osteoclast proliferation(GO:0090291) |
| 5.0 | 14.9 | GO:0050902 | leukocyte adhesive activation(GO:0050902) |
| 4.8 | 14.3 | GO:2000854 | positive regulation of corticosterone secretion(GO:2000854) |
| 4.3 | 38.8 | GO:1904715 | negative regulation of chaperone-mediated autophagy(GO:1904715) |
| 4.3 | 17.1 | GO:1902962 | regulation of metalloendopeptidase activity involved in amyloid precursor protein catabolic process(GO:1902962) negative regulation of metalloendopeptidase activity involved in amyloid precursor protein catabolic process(GO:1902963) |
| 4.2 | 8.5 | GO:0032687 | negative regulation of interferon-alpha production(GO:0032687) |
| 4.1 | 29.0 | GO:0090204 | protein localization to nuclear pore(GO:0090204) |
| 4.1 | 36.5 | GO:0035542 | regulation of SNARE complex assembly(GO:0035542) |
| 4.0 | 11.9 | GO:0000738 | DNA catabolic process, exonucleolytic(GO:0000738) |
| 3.8 | 15.4 | GO:0002904 | positive regulation of B cell apoptotic process(GO:0002904) |
| 3.6 | 3.6 | GO:0045347 | MHC class II biosynthetic process(GO:0045342) regulation of MHC class II biosynthetic process(GO:0045346) negative regulation of MHC class II biosynthetic process(GO:0045347) |
| 3.4 | 10.1 | GO:0071557 | histone H3-K27 demethylation(GO:0071557) |
| 3.3 | 26.7 | GO:1900113 | negative regulation of histone H3-K9 trimethylation(GO:1900113) |
| 3.3 | 23.1 | GO:0044800 | fusion of virus membrane with host plasma membrane(GO:0019064) membrane fusion involved in viral entry into host cell(GO:0039663) multi-organism membrane fusion(GO:0044800) |
| 3.2 | 16.0 | GO:0010807 | regulation of synaptic vesicle priming(GO:0010807) |
| 3.1 | 31.1 | GO:0033299 | secretion of lysosomal enzymes(GO:0033299) |
| 3.1 | 24.7 | GO:0060155 | platelet dense granule organization(GO:0060155) |
| 3.0 | 18.1 | GO:1903756 | regulation of transcription from RNA polymerase II promoter by histone modification(GO:1903756) negative regulation of transcription from RNA polymerase II promoter by histone modification(GO:1903758) |
| 3.0 | 12.0 | GO:1904029 | regulation of cyclin-dependent protein serine/threonine kinase activity(GO:0000079) regulation of cyclin-dependent protein kinase activity(GO:1904029) |
| 3.0 | 8.9 | GO:0051066 | dihydrobiopterin metabolic process(GO:0051066) |
| 3.0 | 11.8 | GO:0030242 | pexophagy(GO:0030242) |
| 2.9 | 11.6 | GO:0002572 | pro-T cell differentiation(GO:0002572) |
| 2.9 | 11.5 | GO:0030037 | actin filament reorganization involved in cell cycle(GO:0030037) |
| 2.7 | 5.5 | GO:1902593 | nuclear import(GO:0051170) single-organism nuclear import(GO:1902593) |
| 2.7 | 21.8 | GO:0090160 | Golgi to lysosome transport(GO:0090160) |
| 2.6 | 13.0 | GO:0006740 | NADPH regeneration(GO:0006740) |
| 2.6 | 10.3 | GO:0015808 | L-alanine transport(GO:0015808) |
| 2.6 | 40.8 | GO:0035970 | peptidyl-threonine dephosphorylation(GO:0035970) |
| 2.4 | 69.7 | GO:0006884 | cell volume homeostasis(GO:0006884) |
| 2.4 | 2.4 | GO:0015917 | aminophospholipid transport(GO:0015917) |
| 2.4 | 44.9 | GO:0042340 | keratan sulfate catabolic process(GO:0042340) |
| 2.3 | 7.0 | GO:1900075 | regulation of neuromuscular synaptic transmission(GO:1900073) positive regulation of neuromuscular synaptic transmission(GO:1900075) |
| 2.3 | 13.8 | GO:0098535 | de novo centriole assembly(GO:0098535) |
| 2.2 | 13.4 | GO:0019262 | N-acetylneuraminate catabolic process(GO:0019262) |
| 2.1 | 8.6 | GO:1902544 | oxidative DNA demethylation(GO:0035511) regulation of DNA N-glycosylase activity(GO:1902544) |
| 2.1 | 6.3 | GO:0051684 | maintenance of Golgi location(GO:0051684) |
| 2.0 | 8.1 | GO:0048698 | negative regulation of collateral sprouting in absence of injury(GO:0048698) |
| 2.0 | 6.0 | GO:1903028 | positive regulation of opsonization(GO:1903028) |
| 2.0 | 8.0 | GO:0006072 | glycerol-3-phosphate metabolic process(GO:0006072) |
| 2.0 | 9.8 | GO:1901252 | regulation of intracellular transport of viral material(GO:1901252) |
| 1.9 | 9.6 | GO:0097338 | response to clozapine(GO:0097338) |
| 1.9 | 62.0 | GO:0090383 | phagosome acidification(GO:0090383) |
| 1.9 | 9.3 | GO:1903564 | regulation of protein localization to cilium(GO:1903564) |
| 1.9 | 5.6 | GO:1903697 | negative regulation of microvillus assembly(GO:1903697) |
| 1.9 | 5.6 | GO:0006258 | UDP-glucose catabolic process(GO:0006258) galactose catabolic process via UDP-galactose(GO:0033499) |
| 1.8 | 5.3 | GO:1905205 | positive regulation of connective tissue replacement(GO:1905205) |
| 1.8 | 5.3 | GO:1990168 | protein K33-linked deubiquitination(GO:1990168) |
| 1.7 | 12.1 | GO:0034058 | endosomal vesicle fusion(GO:0034058) |
| 1.7 | 13.6 | GO:0097116 | gephyrin clustering involved in postsynaptic density assembly(GO:0097116) |
| 1.7 | 10.2 | GO:0044791 | modulation by host of viral release from host cell(GO:0044789) positive regulation by host of viral release from host cell(GO:0044791) |
| 1.7 | 5.1 | GO:0071409 | cellular response to cycloheximide(GO:0071409) |
| 1.7 | 11.6 | GO:2000286 | receptor internalization involved in canonical Wnt signaling pathway(GO:2000286) |
| 1.7 | 5.0 | GO:0035408 | histone H3-T6 phosphorylation(GO:0035408) |
| 1.6 | 3.2 | GO:0002384 | hepatic immune response(GO:0002384) |
| 1.6 | 6.4 | GO:1904379 | protein localization to cytosolic proteasome complex(GO:1904327) protein localization to cytosolic proteasome complex involved in ERAD pathway(GO:1904379) |
| 1.6 | 8.0 | GO:1990034 | calcium ion export from cell(GO:1990034) |
| 1.6 | 8.0 | GO:0009609 | response to symbiont(GO:0009608) response to symbiotic bacterium(GO:0009609) |
| 1.5 | 4.6 | GO:0048170 | positive regulation of long-term neuronal synaptic plasticity(GO:0048170) |
| 1.5 | 6.1 | GO:0032049 | cardiolipin biosynthetic process(GO:0032049) |
| 1.5 | 4.6 | GO:0051088 | PMA-inducible membrane protein ectodomain proteolysis(GO:0051088) |
| 1.5 | 4.4 | GO:0061394 | regulation of transcription from RNA polymerase II promoter in response to arsenic-containing substance(GO:0061394) response to manganese-induced endoplasmic reticulum stress(GO:1990737) |
| 1.4 | 5.8 | GO:0000255 | allantoin metabolic process(GO:0000255) |
| 1.4 | 8.6 | GO:0051012 | microtubule sliding(GO:0051012) |
| 1.4 | 2.8 | GO:0099553 | trans-synaptic signaling by lipid, modulating synaptic transmission(GO:0099552) trans-synaptic signaling by endocannabinoid, modulating synaptic transmission(GO:0099553) |
| 1.4 | 4.2 | GO:0090149 | mitochondrial membrane fission(GO:0090149) |
| 1.4 | 4.2 | GO:0061034 | olfactory bulb mitral cell layer development(GO:0061034) |
| 1.4 | 5.4 | GO:0022027 | interkinetic nuclear migration(GO:0022027) |
| 1.4 | 10.8 | GO:0070235 | regulation of activation-induced cell death of T cells(GO:0070235) negative regulation of activation-induced cell death of T cells(GO:0070236) |
| 1.4 | 4.1 | GO:0001207 | histone displacement(GO:0001207) regulation of transcription involved in meiotic cell cycle(GO:0051037) positive regulation of transcription involved in meiotic cell cycle(GO:0051039) |
| 1.3 | 4.0 | GO:0033364 | mast cell secretory granule organization(GO:0033364) |
| 1.3 | 2.7 | GO:0030220 | platelet formation(GO:0030220) |
| 1.3 | 4.0 | GO:1900169 | regulation of glucocorticoid mediated signaling pathway(GO:1900169) |
| 1.3 | 3.9 | GO:0071284 | cellular response to lead ion(GO:0071284) |
| 1.3 | 5.2 | GO:0097010 | eukaryotic translation initiation factor 4F complex assembly(GO:0097010) |
| 1.3 | 3.8 | GO:1900368 | regulation of RNA interference(GO:1900368) negative regulation of RNA interference(GO:1900369) |
| 1.3 | 12.5 | GO:0032264 | IMP salvage(GO:0032264) |
| 1.2 | 9.8 | GO:0031087 | deadenylation-independent decapping of nuclear-transcribed mRNA(GO:0031087) |
| 1.2 | 7.3 | GO:0036444 | calcium ion transmembrane import into mitochondrion(GO:0036444) |
| 1.2 | 14.5 | GO:0070459 | prolactin secretion(GO:0070459) |
| 1.2 | 23.0 | GO:0002726 | positive regulation of T cell cytokine production(GO:0002726) |
| 1.2 | 8.1 | GO:0090382 | phagosome maturation(GO:0090382) |
| 1.1 | 6.9 | GO:1903435 | positive regulation of constitutive secretory pathway(GO:1903435) |
| 1.1 | 8.0 | GO:1903715 | regulation of aerobic respiration(GO:1903715) |
| 1.1 | 6.8 | GO:0090170 | regulation of Golgi inheritance(GO:0090170) |
| 1.1 | 5.6 | GO:0090650 | rRNA transport(GO:0051029) response to oxygen-glucose deprivation(GO:0090649) cellular response to oxygen-glucose deprivation(GO:0090650) |
| 1.1 | 4.5 | GO:0010730 | negative regulation of hydrogen peroxide biosynthetic process(GO:0010730) |
| 1.1 | 4.5 | GO:0061762 | CAMKK-AMPK signaling cascade(GO:0061762) |
| 1.1 | 3.3 | GO:1904933 | regulation of cell proliferation in midbrain(GO:1904933) |
| 1.1 | 3.3 | GO:0036371 | protein localization to M-band(GO:0036309) protein localization to T-tubule(GO:0036371) |
| 1.1 | 3.3 | GO:0072434 | signal transduction involved in G2 DNA damage checkpoint(GO:0072425) signal transduction involved in mitotic G2 DNA damage checkpoint(GO:0072434) telomerase catalytic core complex assembly(GO:1904868) regulation of telomerase catalytic core complex assembly(GO:1904882) positive regulation of telomerase catalytic core complex assembly(GO:1904884) |
| 1.1 | 5.5 | GO:0071442 | positive regulation of histone H3-K14 acetylation(GO:0071442) |
| 1.1 | 5.5 | GO:0032929 | negative regulation of superoxide anion generation(GO:0032929) |
| 1.1 | 3.2 | GO:0045645 | regulation of eosinophil differentiation(GO:0045643) positive regulation of eosinophil differentiation(GO:0045645) |
| 1.1 | 6.4 | GO:1903232 | melanosome assembly(GO:1903232) |
| 1.1 | 3.2 | GO:0070602 | regulation of centromeric sister chromatid cohesion(GO:0070602) |
| 1.1 | 3.2 | GO:0008626 | granzyme-mediated apoptotic signaling pathway(GO:0008626) |
| 1.1 | 8.4 | GO:1901525 | negative regulation of macromitophagy(GO:1901525) |
| 1.0 | 3.1 | GO:1904530 | negative regulation of actin filament binding(GO:1904530) negative regulation of actin binding(GO:1904617) |
| 1.0 | 7.2 | GO:1904885 | beta-catenin destruction complex assembly(GO:1904885) |
| 1.0 | 4.0 | GO:0046833 | positive regulation of RNA export from nucleus(GO:0046833) |
| 1.0 | 3.0 | GO:0002025 | vasodilation by norepinephrine-epinephrine involved in regulation of systemic arterial blood pressure(GO:0002025) |
| 1.0 | 3.9 | GO:0045065 | cytotoxic T cell differentiation(GO:0045065) |
| 1.0 | 2.9 | GO:0006014 | D-ribose metabolic process(GO:0006014) |
| 1.0 | 4.8 | GO:0034350 | regulation of glial cell apoptotic process(GO:0034350) negative regulation of glial cell apoptotic process(GO:0034351) |
| 1.0 | 2.9 | GO:0033693 | neurofilament bundle assembly(GO:0033693) |
| 0.9 | 5.6 | GO:0036111 | very long-chain fatty-acyl-CoA metabolic process(GO:0036111) |
| 0.9 | 6.6 | GO:0000160 | phosphorelay signal transduction system(GO:0000160) |
| 0.9 | 6.5 | GO:1902746 | regulation of lens fiber cell differentiation(GO:1902746) |
| 0.9 | 3.7 | GO:1902231 | positive regulation of intrinsic apoptotic signaling pathway in response to DNA damage(GO:1902231) |
| 0.9 | 12.0 | GO:2000427 | positive regulation of apoptotic cell clearance(GO:2000427) |
| 0.9 | 2.8 | GO:2000182 | regulation of progesterone biosynthetic process(GO:2000182) |
| 0.9 | 19.9 | GO:0006895 | Golgi to endosome transport(GO:0006895) |
| 0.9 | 11.6 | GO:2000271 | positive regulation of fibroblast apoptotic process(GO:2000271) |
| 0.9 | 5.3 | GO:0010746 | regulation of plasma membrane long-chain fatty acid transport(GO:0010746) negative regulation of plasma membrane long-chain fatty acid transport(GO:0010748) |
| 0.9 | 3.4 | GO:0043335 | protein unfolding(GO:0043335) |
| 0.9 | 5.1 | GO:0006003 | fructose 2,6-bisphosphate metabolic process(GO:0006003) |
| 0.8 | 5.9 | GO:0040032 | post-embryonic body morphogenesis(GO:0040032) |
| 0.8 | 4.1 | GO:0060800 | regulation of cell differentiation involved in embryonic placenta development(GO:0060800) |
| 0.8 | 2.4 | GO:1903347 | negative regulation of bicellular tight junction assembly(GO:1903347) |
| 0.8 | 3.2 | GO:0051533 | positive regulation of NFAT protein import into nucleus(GO:0051533) |
| 0.8 | 2.4 | GO:1903691 | positive regulation of wound healing, spreading of epidermal cells(GO:1903691) |
| 0.8 | 2.4 | GO:1900063 | regulation of peroxisome organization(GO:1900063) |
| 0.8 | 3.1 | GO:0007538 | primary sex determination(GO:0007538) |
| 0.8 | 1.6 | GO:0006288 | base-excision repair, DNA ligation(GO:0006288) |
| 0.8 | 5.4 | GO:1990253 | cellular response to leucine starvation(GO:1990253) |
| 0.8 | 2.3 | GO:0060915 | fibroblast growth factor receptor signaling pathway involved in negative regulation of apoptotic process in bone marrow(GO:0035602) fibroblast growth factor receptor signaling pathway involved in hemopoiesis(GO:0035603) fibroblast growth factor receptor signaling pathway involved in positive regulation of cell proliferation in bone marrow(GO:0035604) squamous basal epithelial stem cell differentiation involved in prostate gland acinus development(GO:0060529) fibroblast growth factor receptor signaling pathway involved in mammary gland specification(GO:0060595) mammary gland bud formation(GO:0060615) branch elongation involved in salivary gland morphogenesis(GO:0060667) mesenchymal cell differentiation involved in lung development(GO:0060915) |
| 0.8 | 4.5 | GO:0090435 | protein localization to nuclear envelope(GO:0090435) |
| 0.7 | 2.2 | GO:0006286 | base-excision repair, base-free sugar-phosphate removal(GO:0006286) |
| 0.7 | 3.0 | GO:0060010 | Sertoli cell fate commitment(GO:0060010) |
| 0.7 | 1.5 | GO:0061052 | negative regulation of cell growth involved in cardiac muscle cell development(GO:0061052) |
| 0.7 | 2.2 | GO:0043320 | natural killer cell degranulation(GO:0043320) |
| 0.7 | 5.9 | GO:0051388 | positive regulation of neurotrophin TRK receptor signaling pathway(GO:0051388) |
| 0.7 | 5.1 | GO:0043654 | recognition of apoptotic cell(GO:0043654) |
| 0.7 | 5.8 | GO:0000395 | mRNA 5'-splice site recognition(GO:0000395) |
| 0.7 | 2.2 | GO:0002276 | basophil activation involved in immune response(GO:0002276) |
| 0.7 | 13.7 | GO:0033148 | positive regulation of intracellular estrogen receptor signaling pathway(GO:0033148) |
| 0.7 | 6.5 | GO:0048386 | positive regulation of retinoic acid receptor signaling pathway(GO:0048386) |
| 0.7 | 11.4 | GO:0000244 | spliceosomal tri-snRNP complex assembly(GO:0000244) |
| 0.7 | 6.3 | GO:0006685 | sphingomyelin catabolic process(GO:0006685) |
| 0.7 | 2.1 | GO:1901339 | regulation of store-operated calcium channel activity(GO:1901339) |
| 0.7 | 6.3 | GO:0035434 | copper ion transmembrane transport(GO:0035434) |
| 0.7 | 1.4 | GO:0032241 | positive regulation of nucleobase-containing compound transport(GO:0032241) |
| 0.7 | 4.9 | GO:0021769 | orbitofrontal cortex development(GO:0021769) |
| 0.7 | 11.1 | GO:2000574 | regulation of microtubule motor activity(GO:2000574) |
| 0.7 | 19.3 | GO:0080171 | lysosome organization(GO:0007040) lytic vacuole organization(GO:0080171) |
| 0.7 | 7.6 | GO:1902894 | negative regulation of pri-miRNA transcription from RNA polymerase II promoter(GO:1902894) |
| 0.7 | 14.4 | GO:0015937 | coenzyme A biosynthetic process(GO:0015937) |
| 0.7 | 5.5 | GO:0051601 | exocyst localization(GO:0051601) |
| 0.7 | 2.7 | GO:0071651 | positive regulation of chemokine (C-C motif) ligand 5 production(GO:0071651) |
| 0.7 | 2.7 | GO:0061084 | regulation of protein refolding(GO:0061083) negative regulation of protein refolding(GO:0061084) |
| 0.7 | 4.7 | GO:0006054 | N-acetylneuraminate metabolic process(GO:0006054) |
| 0.7 | 2.7 | GO:0030644 | cellular chloride ion homeostasis(GO:0030644) |
| 0.7 | 0.7 | GO:1903056 | regulation of melanosome organization(GO:1903056) |
| 0.7 | 2.0 | GO:0039650 | modulation by virus of host molecular function(GO:0039506) suppression by virus of host molecular function(GO:0039507) suppression by virus of host catalytic activity(GO:0039513) modulation by virus of host catalytic activity(GO:0039516) suppression by virus of host cysteine-type endopeptidase activity involved in apoptotic process(GO:0039650) negative regulation by symbiont of host catalytic activity(GO:0052053) negative regulation by symbiont of host molecular function(GO:0052056) modulation by symbiont of host catalytic activity(GO:0052148) |
| 0.6 | 1.3 | GO:0010040 | response to iron(II) ion(GO:0010040) |
| 0.6 | 11.8 | GO:0032012 | regulation of ARF protein signal transduction(GO:0032012) |
| 0.6 | 0.6 | GO:0061055 | myotome development(GO:0061055) |
| 0.6 | 4.2 | GO:2000643 | positive regulation of early endosome to late endosome transport(GO:2000643) |
| 0.6 | 4.2 | GO:0002478 | antigen processing and presentation of exogenous peptide antigen(GO:0002478) antigen processing and presentation of exogenous antigen(GO:0019884) |
| 0.6 | 1.8 | GO:0010212 | response to ionizing radiation(GO:0010212) |
| 0.6 | 2.9 | GO:0036369 | transcription factor catabolic process(GO:0036369) |
| 0.6 | 11.1 | GO:0032703 | negative regulation of interleukin-2 production(GO:0032703) |
| 0.6 | 3.5 | GO:0090154 | positive regulation of sphingolipid biosynthetic process(GO:0090154) positive regulation of ceramide biosynthetic process(GO:2000304) |
| 0.6 | 2.3 | GO:0005985 | sucrose metabolic process(GO:0005985) sucrose biosynthetic process(GO:0005986) |
| 0.6 | 4.6 | GO:2000049 | positive regulation of cell-cell adhesion mediated by cadherin(GO:2000049) |
| 0.6 | 5.1 | GO:0060742 | epithelial cell differentiation involved in prostate gland development(GO:0060742) |
| 0.6 | 5.1 | GO:0019509 | L-methionine biosynthetic process from methylthioadenosine(GO:0019509) |
| 0.6 | 8.9 | GO:0045161 | neuronal ion channel clustering(GO:0045161) |
| 0.6 | 2.2 | GO:0044375 | regulation of peroxisome size(GO:0044375) |
| 0.5 | 3.8 | GO:0045007 | depurination(GO:0045007) |
| 0.5 | 5.5 | GO:0044341 | sodium-dependent phosphate transport(GO:0044341) |
| 0.5 | 2.2 | GO:0032914 | positive regulation of transforming growth factor beta1 production(GO:0032914) |
| 0.5 | 5.9 | GO:0046185 | aldehyde catabolic process(GO:0046185) |
| 0.5 | 9.1 | GO:0033572 | transferrin transport(GO:0033572) |
| 0.5 | 0.5 | GO:0035378 | carbon dioxide transmembrane transport(GO:0035378) |
| 0.5 | 3.2 | GO:0019532 | oxalate transport(GO:0019532) |
| 0.5 | 2.1 | GO:1904338 | regulation of dopaminergic neuron differentiation(GO:1904338) |
| 0.5 | 2.1 | GO:1902044 | regulation of Fas signaling pathway(GO:1902044) |
| 0.5 | 0.5 | GO:0021847 | ventricular zone neuroblast division(GO:0021847) |
| 0.5 | 1.0 | GO:0046533 | negative regulation of photoreceptor cell differentiation(GO:0046533) |
| 0.5 | 2.5 | GO:2000348 | regulation of CD40 signaling pathway(GO:2000348) |
| 0.5 | 1.5 | GO:0061624 | fructose catabolic process(GO:0006001) fructose catabolic process to hydroxyacetone phosphate and glyceraldehyde-3-phosphate(GO:0061624) |
| 0.5 | 5.0 | GO:1903753 | negative regulation of p38MAPK cascade(GO:1903753) |
| 0.5 | 6.9 | GO:0010510 | regulation of acetyl-CoA biosynthetic process from pyruvate(GO:0010510) regulation of acyl-CoA biosynthetic process(GO:0050812) |
| 0.5 | 2.4 | GO:0044387 | negative regulation of protein kinase activity by regulation of protein phosphorylation(GO:0044387) |
| 0.5 | 1.5 | GO:0090219 | negative regulation of lipid kinase activity(GO:0090219) |
| 0.5 | 7.8 | GO:0039703 | viral RNA genome replication(GO:0039694) RNA replication(GO:0039703) |
| 0.5 | 2.9 | GO:1901538 | DNA methylation involved in embryo development(GO:0043045) C-5 methylation of cytosine(GO:0090116) changes to DNA methylation involved in embryo development(GO:1901538) |
| 0.5 | 7.1 | GO:0043982 | histone H4-K5 acetylation(GO:0043981) histone H4-K8 acetylation(GO:0043982) |
| 0.5 | 4.3 | GO:0046513 | ceramide biosynthetic process(GO:0046513) |
| 0.5 | 4.7 | GO:0040016 | embryonic cleavage(GO:0040016) |
| 0.5 | 5.6 | GO:0007097 | nuclear migration(GO:0007097) |
| 0.5 | 2.8 | GO:0051106 | positive regulation of DNA ligation(GO:0051106) |
| 0.5 | 6.0 | GO:0006265 | DNA topological change(GO:0006265) |
| 0.5 | 5.5 | GO:0002315 | marginal zone B cell differentiation(GO:0002315) |
| 0.5 | 5.0 | GO:0008612 | peptidyl-lysine modification to peptidyl-hypusine(GO:0008612) |
| 0.5 | 2.3 | GO:0060052 | neurofilament cytoskeleton organization(GO:0060052) |
| 0.5 | 2.3 | GO:0035694 | mitochondrial protein catabolic process(GO:0035694) |
| 0.4 | 0.9 | GO:0060525 | prostate glandular acinus development(GO:0060525) prostate glandular acinus morphogenesis(GO:0060526) prostate epithelial cord arborization involved in prostate glandular acinus morphogenesis(GO:0060527) |
| 0.4 | 2.2 | GO:0070417 | cellular response to cold(GO:0070417) |
| 0.4 | 6.6 | GO:0002021 | response to dietary excess(GO:0002021) |
| 0.4 | 1.3 | GO:1900224 | positive regulation of nodal signaling pathway involved in determination of lateral mesoderm left/right asymmetry(GO:1900224) |
| 0.4 | 2.2 | GO:0045471 | response to ethanol(GO:0045471) |
| 0.4 | 4.3 | GO:0005981 | regulation of glycogen catabolic process(GO:0005981) |
| 0.4 | 2.1 | GO:0032383 | regulation of intracellular lipid transport(GO:0032377) regulation of intracellular sterol transport(GO:0032380) regulation of intracellular cholesterol transport(GO:0032383) |
| 0.4 | 1.7 | GO:0097091 | synaptic vesicle clustering(GO:0097091) |
| 0.4 | 2.1 | GO:1904764 | clathrin coat disassembly(GO:0072318) negative regulation of fibril organization(GO:1902904) chaperone-mediated autophagy translocation complex disassembly(GO:1904764) |
| 0.4 | 1.3 | GO:1904247 | regulation of polynucleotide adenylyltransferase activity(GO:1904245) positive regulation of polynucleotide adenylyltransferase activity(GO:1904247) |
| 0.4 | 3.4 | GO:0050859 | negative regulation of B cell receptor signaling pathway(GO:0050859) |
| 0.4 | 1.3 | GO:0006788 | heme oxidation(GO:0006788) smooth muscle hyperplasia(GO:0014806) |
| 0.4 | 1.7 | GO:0070544 | histone H3-K36 demethylation(GO:0070544) |
| 0.4 | 1.2 | GO:0060748 | tertiary branching involved in mammary gland duct morphogenesis(GO:0060748) |
| 0.4 | 3.7 | GO:0008343 | adult feeding behavior(GO:0008343) |
| 0.4 | 0.4 | GO:0042986 | positive regulation of amyloid precursor protein biosynthetic process(GO:0042986) |
| 0.4 | 1.6 | GO:0006556 | S-adenosylmethionine biosynthetic process(GO:0006556) |
| 0.4 | 2.4 | GO:2000766 | negative regulation of cytoplasmic translation(GO:2000766) |
| 0.4 | 2.0 | GO:2000769 | regulation of unidimensional cell growth(GO:0051510) negative regulation of unidimensional cell growth(GO:0051511) establishment of cell polarity regulating cell shape(GO:0071964) regulation of establishment or maintenance of cell polarity regulating cell shape(GO:2000769) positive regulation of establishment or maintenance of cell polarity regulating cell shape(GO:2000771) regulation of establishment of cell polarity regulating cell shape(GO:2000782) positive regulation of establishment of cell polarity regulating cell shape(GO:2000784) regulation of barbed-end actin filament capping(GO:2000812) positive regulation of barbed-end actin filament capping(GO:2000814) |
| 0.4 | 1.6 | GO:0033123 | positive regulation of cyclic nucleotide catabolic process(GO:0030807) positive regulation of cAMP catabolic process(GO:0030822) positive regulation of purine nucleotide catabolic process(GO:0033123) |
| 0.4 | 30.8 | GO:0045071 | negative regulation of viral genome replication(GO:0045071) |
| 0.4 | 3.1 | GO:0036109 | alpha-linolenic acid metabolic process(GO:0036109) |
| 0.4 | 2.3 | GO:0044351 | macropinocytosis(GO:0044351) |
| 0.4 | 5.4 | GO:0097031 | NADH dehydrogenase complex assembly(GO:0010257) mitochondrial respiratory chain complex I assembly(GO:0032981) mitochondrial respiratory chain complex I biogenesis(GO:0097031) |
| 0.4 | 4.2 | GO:0035414 | negative regulation of catenin import into nucleus(GO:0035414) |
| 0.4 | 1.9 | GO:0051941 | regulation of amino acid uptake involved in synaptic transmission(GO:0051941) regulation of glutamate uptake involved in transmission of nerve impulse(GO:0051946) regulation of L-glutamate import(GO:1900920) |
| 0.4 | 1.9 | GO:0006620 | posttranslational protein targeting to membrane(GO:0006620) |
| 0.4 | 1.1 | GO:0021555 | midbrain-hindbrain boundary morphogenesis(GO:0021555) |
| 0.4 | 25.3 | GO:0070936 | protein K48-linked ubiquitination(GO:0070936) |
| 0.4 | 3.0 | GO:1904417 | regulation of xenophagy(GO:1904415) positive regulation of xenophagy(GO:1904417) |
| 0.4 | 2.6 | GO:0001731 | formation of translation preinitiation complex(GO:0001731) |
| 0.4 | 10.6 | GO:0070987 | error-free translesion synthesis(GO:0070987) |
| 0.4 | 4.6 | GO:0035278 | miRNA mediated inhibition of translation(GO:0035278) negative regulation of translation, ncRNA-mediated(GO:0040033) regulation of translation, ncRNA-mediated(GO:0045974) |
| 0.4 | 1.1 | GO:1904430 | negative regulation of t-circle formation(GO:1904430) |
| 0.3 | 2.1 | GO:0032510 | endosome to lysosome transport via multivesicular body sorting pathway(GO:0032510) |
| 0.3 | 2.4 | GO:0097577 | intracellular sequestering of iron ion(GO:0006880) sequestering of iron ion(GO:0097577) |
| 0.3 | 2.4 | GO:0050893 | sensory processing(GO:0050893) |
| 0.3 | 15.1 | GO:0006735 | NADH regeneration(GO:0006735) canonical glycolysis(GO:0061621) glucose catabolic process to pyruvate(GO:0061718) |
| 0.3 | 1.0 | GO:0070862 | negative regulation of protein exit from endoplasmic reticulum(GO:0070862) negative regulation of retrograde protein transport, ER to cytosol(GO:1904153) |
| 0.3 | 12.0 | GO:0050690 | regulation of defense response to virus by virus(GO:0050690) |
| 0.3 | 1.0 | GO:0046066 | dGDP metabolic process(GO:0046066) |
| 0.3 | 1.0 | GO:1903070 | negative regulation of ER-associated ubiquitin-dependent protein catabolic process(GO:1903070) |
| 0.3 | 1.6 | GO:0034625 | fatty acid elongation, saturated fatty acid(GO:0019367) fatty acid elongation, unsaturated fatty acid(GO:0019368) fatty acid elongation, monounsaturated fatty acid(GO:0034625) fatty acid elongation, polyunsaturated fatty acid(GO:0034626) |
| 0.3 | 4.0 | GO:0042759 | long-chain fatty acid biosynthetic process(GO:0042759) |
| 0.3 | 3.4 | GO:0009414 | response to water deprivation(GO:0009414) |
| 0.3 | 1.8 | GO:1902570 | protein localization to nucleolus(GO:1902570) |
| 0.3 | 17.7 | GO:1990090 | cellular response to nerve growth factor stimulus(GO:1990090) |
| 0.3 | 0.9 | GO:0019474 | L-lysine catabolic process to acetyl-CoA(GO:0019474) L-lysine catabolic process(GO:0019477) L-lysine metabolic process(GO:0046440) |
| 0.3 | 3.6 | GO:0010839 | negative regulation of keratinocyte proliferation(GO:0010839) |
| 0.3 | 3.9 | GO:2000394 | phosphatidylcholine catabolic process(GO:0034638) positive regulation of lamellipodium morphogenesis(GO:2000394) |
| 0.3 | 2.1 | GO:0031666 | positive regulation of lipopolysaccharide-mediated signaling pathway(GO:0031666) |
| 0.3 | 1.5 | GO:0072553 | terminal button organization(GO:0072553) |
| 0.3 | 1.7 | GO:0000480 | endonucleolytic cleavage in 5'-ETS of tricistronic rRNA transcript (SSU-rRNA, 5.8S rRNA, LSU-rRNA)(GO:0000480) |
| 0.3 | 1.4 | GO:0010936 | negative regulation of macrophage cytokine production(GO:0010936) |
| 0.3 | 0.9 | GO:0001555 | oocyte growth(GO:0001555) regulation of progesterone secretion(GO:2000870) |
| 0.3 | 9.9 | GO:0006607 | NLS-bearing protein import into nucleus(GO:0006607) |
| 0.3 | 4.8 | GO:0043302 | positive regulation of leukocyte degranulation(GO:0043302) |
| 0.3 | 1.1 | GO:0032287 | peripheral nervous system myelin maintenance(GO:0032287) |
| 0.3 | 3.9 | GO:0097067 | cellular response to thyroid hormone stimulus(GO:0097067) |
| 0.3 | 8.7 | GO:1903959 | regulation of anion transmembrane transport(GO:1903959) |
| 0.3 | 3.5 | GO:0010623 | programmed cell death involved in cell development(GO:0010623) |
| 0.3 | 1.1 | GO:1901978 | positive regulation of cell cycle checkpoint(GO:1901978) |
| 0.3 | 8.0 | GO:0040019 | positive regulation of embryonic development(GO:0040019) |
| 0.3 | 2.6 | GO:0045898 | regulation of RNA polymerase II transcriptional preinitiation complex assembly(GO:0045898) |
| 0.3 | 2.6 | GO:0015701 | bicarbonate transport(GO:0015701) |
| 0.3 | 0.3 | GO:0019046 | release from viral latency(GO:0019046) |
| 0.2 | 3.0 | GO:0021924 | cell proliferation in external granule layer(GO:0021924) cerebellar granule cell precursor proliferation(GO:0021930) |
| 0.2 | 0.7 | GO:0021571 | rhombomere 5 development(GO:0021571) |
| 0.2 | 0.2 | GO:0044861 | protein localization to plasma membrane raft(GO:0044860) protein transport into plasma membrane raft(GO:0044861) |
| 0.2 | 2.0 | GO:0007258 | JUN phosphorylation(GO:0007258) |
| 0.2 | 4.2 | GO:0050858 | negative regulation of antigen receptor-mediated signaling pathway(GO:0050858) |
| 0.2 | 2.4 | GO:0042908 | xenobiotic transport(GO:0042908) |
| 0.2 | 18.1 | GO:0060337 | type I interferon signaling pathway(GO:0060337) cellular response to type I interferon(GO:0071357) |
| 0.2 | 14.7 | GO:0000245 | spliceosomal complex assembly(GO:0000245) |
| 0.2 | 0.5 | GO:0034127 | regulation of MyD88-independent toll-like receptor signaling pathway(GO:0034127) negative regulation of MyD88-independent toll-like receptor signaling pathway(GO:0034128) |
| 0.2 | 5.0 | GO:0070734 | histone H3-K27 methylation(GO:0070734) |
| 0.2 | 13.1 | GO:0007157 | heterophilic cell-cell adhesion via plasma membrane cell adhesion molecules(GO:0007157) |
| 0.2 | 1.2 | GO:0010499 | proteasomal ubiquitin-independent protein catabolic process(GO:0010499) |
| 0.2 | 5.3 | GO:0048873 | homeostasis of number of cells within a tissue(GO:0048873) |
| 0.2 | 1.6 | GO:0061635 | regulation of protein complex stability(GO:0061635) |
| 0.2 | 1.8 | GO:0006907 | pinocytosis(GO:0006907) |
| 0.2 | 2.5 | GO:0048484 | enteric nervous system development(GO:0048484) |
| 0.2 | 0.5 | GO:1903348 | positive regulation of bicellular tight junction assembly(GO:1903348) |
| 0.2 | 0.4 | GO:2001137 | positive regulation of endocytic recycling(GO:2001137) |
| 0.2 | 0.7 | GO:2001245 | regulation of phosphatidylcholine biosynthetic process(GO:2001245) |
| 0.2 | 1.5 | GO:0044266 | angiotensin catabolic process in blood(GO:0002005) multicellular organismal protein catabolic process(GO:0044254) protein digestion(GO:0044256) multicellular organismal macromolecule catabolic process(GO:0044266) multicellular organismal protein metabolic process(GO:0044268) |
| 0.2 | 3.5 | GO:0035855 | megakaryocyte development(GO:0035855) |
| 0.2 | 1.1 | GO:0000075 | cell cycle checkpoint(GO:0000075) |
| 0.2 | 1.7 | GO:0002759 | regulation of antimicrobial humoral response(GO:0002759) |
| 0.2 | 1.9 | GO:1901838 | positive regulation of transcription of nuclear large rRNA transcript from RNA polymerase I promoter(GO:1901838) |
| 0.2 | 2.1 | GO:0002634 | regulation of germinal center formation(GO:0002634) |
| 0.2 | 1.2 | GO:0097151 | positive regulation of inhibitory postsynaptic potential(GO:0097151) modulation of inhibitory postsynaptic potential(GO:0098828) |
| 0.2 | 6.4 | GO:0071173 | mitotic spindle assembly checkpoint(GO:0007094) spindle assembly checkpoint(GO:0071173) |
| 0.2 | 19.4 | GO:0030183 | B cell differentiation(GO:0030183) |
| 0.2 | 0.4 | GO:0051754 | meiotic sister chromatid cohesion, centromeric(GO:0051754) |
| 0.2 | 1.4 | GO:0033089 | positive regulation of T cell differentiation in thymus(GO:0033089) positive regulation of thymocyte aggregation(GO:2000400) |
| 0.2 | 1.6 | GO:0015074 | DNA integration(GO:0015074) |
| 0.2 | 1.2 | GO:2000074 | regulation of type B pancreatic cell development(GO:2000074) |
| 0.2 | 7.4 | GO:0007223 | Wnt signaling pathway, calcium modulating pathway(GO:0007223) |
| 0.2 | 7.0 | GO:0001844 | protein insertion into mitochondrial membrane involved in apoptotic signaling pathway(GO:0001844) |
| 0.2 | 4.0 | GO:0016180 | snRNA processing(GO:0016180) |
| 0.2 | 4.3 | GO:0000185 | activation of MAPKKK activity(GO:0000185) |
| 0.2 | 0.6 | GO:0048200 | COPI-coated vesicle budding(GO:0035964) Golgi transport vesicle coating(GO:0048200) COPI coating of Golgi vesicle(GO:0048205) |
| 0.2 | 1.9 | GO:0032876 | negative regulation of DNA endoreduplication(GO:0032876) |
| 0.2 | 1.9 | GO:0045945 | positive regulation of transcription from RNA polymerase III promoter(GO:0045945) |
| 0.2 | 4.9 | GO:0090659 | adult walking behavior(GO:0007628) walking behavior(GO:0090659) |
| 0.2 | 2.6 | GO:0015812 | gamma-aminobutyric acid transport(GO:0015812) |
| 0.2 | 2.4 | GO:0006995 | cellular response to nitrogen starvation(GO:0006995) cellular response to nitrogen levels(GO:0043562) |
| 0.2 | 1.1 | GO:0048312 | intracellular distribution of mitochondria(GO:0048312) |
| 0.2 | 1.5 | GO:1903069 | regulation of ER-associated ubiquitin-dependent protein catabolic process(GO:1903069) positive regulation of ER-associated ubiquitin-dependent protein catabolic process(GO:1903071) |
| 0.2 | 13.0 | GO:0031338 | regulation of vesicle fusion(GO:0031338) |
| 0.2 | 1.8 | GO:0035437 | protein retention in ER lumen(GO:0006621) maintenance of protein localization in endoplasmic reticulum(GO:0035437) |
| 0.2 | 2.9 | GO:0000338 | protein deneddylation(GO:0000338) |
| 0.2 | 2.3 | GO:1903432 | regulation of TORC1 signaling(GO:1903432) |
| 0.2 | 2.5 | GO:0000083 | regulation of transcription involved in G1/S transition of mitotic cell cycle(GO:0000083) |
| 0.2 | 2.5 | GO:2001234 | negative regulation of apoptotic signaling pathway(GO:2001234) |
| 0.2 | 10.9 | GO:0055072 | iron ion homeostasis(GO:0055072) |
| 0.2 | 0.2 | GO:0016078 | tRNA catabolic process(GO:0016078) |
| 0.2 | 0.2 | GO:0060648 | mammary gland bud morphogenesis(GO:0060648) |
| 0.2 | 0.9 | GO:0001771 | immunological synapse formation(GO:0001771) |
| 0.2 | 0.7 | GO:0045872 | positive regulation of rhodopsin gene expression(GO:0045872) |
| 0.2 | 1.6 | GO:0043374 | CD8-positive, alpha-beta T cell differentiation(GO:0043374) |
| 0.2 | 1.4 | GO:0010737 | protein kinase A signaling(GO:0010737) regulation of protein kinase A signaling(GO:0010738) |
| 0.2 | 1.2 | GO:0070973 | protein localization to endoplasmic reticulum exit site(GO:0070973) |
| 0.2 | 3.7 | GO:0007257 | activation of JUN kinase activity(GO:0007257) |
| 0.2 | 2.0 | GO:0035372 | protein localization to microtubule(GO:0035372) |
| 0.2 | 9.2 | GO:0030433 | ER-associated ubiquitin-dependent protein catabolic process(GO:0030433) |
| 0.2 | 2.1 | GO:0046007 | negative regulation of meiotic nuclear division(GO:0045835) negative regulation of activated T cell proliferation(GO:0046007) |
| 0.2 | 3.1 | GO:0051560 | mitochondrial calcium ion homeostasis(GO:0051560) |
| 0.2 | 1.5 | GO:0036066 | protein O-linked fucosylation(GO:0036066) |
| 0.2 | 1.1 | GO:0099612 | protein localization to axon(GO:0099612) |
| 0.2 | 3.5 | GO:0043011 | myeloid dendritic cell differentiation(GO:0043011) |
| 0.2 | 1.9 | GO:0070327 | thyroid hormone transport(GO:0070327) |
| 0.2 | 0.9 | GO:0070255 | regulation of mucus secretion(GO:0070255) positive regulation of mucus secretion(GO:0070257) |
| 0.2 | 11.1 | GO:0048678 | response to axon injury(GO:0048678) |
| 0.2 | 2.6 | GO:0006474 | N-terminal protein amino acid acetylation(GO:0006474) |
| 0.2 | 5.4 | GO:0045930 | negative regulation of mitotic cell cycle(GO:0045930) |
| 0.2 | 5.7 | GO:0007520 | myoblast fusion(GO:0007520) |
| 0.1 | 0.9 | GO:0090646 | mitochondrial tRNA processing(GO:0090646) |
| 0.1 | 1.3 | GO:0043435 | response to corticotropin-releasing hormone(GO:0043435) cellular response to corticotropin-releasing hormone stimulus(GO:0071376) |
| 0.1 | 1.5 | GO:0045943 | positive regulation of transcription from RNA polymerase I promoter(GO:0045943) |
| 0.1 | 3.2 | GO:0006397 | mRNA processing(GO:0006397) |
| 0.1 | 2.5 | GO:0044126 | regulation of growth of symbiont in host(GO:0044126) |
| 0.1 | 5.8 | GO:0043303 | mast cell activation involved in immune response(GO:0002279) mast cell degranulation(GO:0043303) |
| 0.1 | 10.3 | GO:0035308 | negative regulation of protein dephosphorylation(GO:0035308) |
| 0.1 | 5.1 | GO:0046928 | regulation of neurotransmitter secretion(GO:0046928) |
| 0.1 | 2.3 | GO:0046627 | negative regulation of insulin receptor signaling pathway(GO:0046627) negative regulation of cellular response to insulin stimulus(GO:1900077) |
| 0.1 | 1.0 | GO:0005984 | disaccharide metabolic process(GO:0005984) |
| 0.1 | 0.9 | GO:0071394 | cellular response to testosterone stimulus(GO:0071394) |
| 0.1 | 0.9 | GO:0006384 | transcription initiation from RNA polymerase III promoter(GO:0006384) tRNA transcription(GO:0009304) 5S class rRNA transcription from RNA polymerase III type 1 promoter(GO:0042791) tRNA transcription from RNA polymerase III promoter(GO:0042797) |
| 0.1 | 1.7 | GO:0014029 | neural crest formation(GO:0014029) |
| 0.1 | 0.4 | GO:0042822 | pyridoxal phosphate metabolic process(GO:0042822) pyridoxal phosphate biosynthetic process(GO:0042823) |
| 0.1 | 1.4 | GO:0090129 | positive regulation of synapse maturation(GO:0090129) |
| 0.1 | 1.8 | GO:0003094 | glomerular filtration(GO:0003094) |
| 0.1 | 2.1 | GO:0007095 | mitotic G2 DNA damage checkpoint(GO:0007095) |
| 0.1 | 0.3 | GO:0060535 | trachea cartilage morphogenesis(GO:0060535) |
| 0.1 | 0.3 | GO:0006659 | phosphatidylserine biosynthetic process(GO:0006659) |
| 0.1 | 1.5 | GO:0016446 | somatic diversification of immune receptors via somatic mutation(GO:0002566) somatic hypermutation of immunoglobulin genes(GO:0016446) |
| 0.1 | 5.6 | GO:0014047 | glutamate secretion(GO:0014047) |
| 0.1 | 4.6 | GO:0045776 | negative regulation of blood pressure(GO:0045776) |
| 0.1 | 1.5 | GO:0035878 | nail development(GO:0035878) |
| 0.1 | 2.7 | GO:0006099 | tricarboxylic acid cycle(GO:0006099) |
| 0.1 | 1.1 | GO:1904321 | response to forskolin(GO:1904321) cellular response to forskolin(GO:1904322) |
| 0.1 | 2.4 | GO:0031122 | cytoplasmic microtubule organization(GO:0031122) |
| 0.1 | 1.6 | GO:0016973 | poly(A)+ mRNA export from nucleus(GO:0016973) |
| 0.1 | 1.0 | GO:0003310 | pancreatic A cell differentiation(GO:0003310) |
| 0.1 | 1.6 | GO:0097178 | ruffle assembly(GO:0097178) |
| 0.1 | 0.6 | GO:0098810 | neurotransmitter reuptake(GO:0098810) |
| 0.1 | 0.8 | GO:0034244 | negative regulation of transcription elongation from RNA polymerase II promoter(GO:0034244) |
| 0.1 | 1.6 | GO:1900116 | extracellular regulation of signal transduction(GO:1900115) extracellular negative regulation of signal transduction(GO:1900116) |
| 0.1 | 2.6 | GO:0043928 | exonucleolytic nuclear-transcribed mRNA catabolic process involved in deadenylation-dependent decay(GO:0043928) |
| 0.1 | 0.5 | GO:0035914 | skeletal muscle cell differentiation(GO:0035914) |
| 0.1 | 0.4 | GO:0035376 | sterol import(GO:0035376) cholesterol import(GO:0070508) |
| 0.1 | 0.8 | GO:0002115 | store-operated calcium entry(GO:0002115) |
| 0.1 | 1.9 | GO:0033234 | negative regulation of protein sumoylation(GO:0033234) |
| 0.1 | 0.7 | GO:2000124 | regulation of endocannabinoid signaling pathway(GO:2000124) |
| 0.1 | 3.5 | GO:0050427 | purine ribonucleoside bisphosphate metabolic process(GO:0034035) 3'-phosphoadenosine 5'-phosphosulfate metabolic process(GO:0050427) |
| 0.1 | 3.0 | GO:0007274 | neuromuscular synaptic transmission(GO:0007274) |
| 0.1 | 1.4 | GO:0030282 | bone mineralization(GO:0030282) |
| 0.1 | 2.0 | GO:2000114 | regulation of establishment of cell polarity(GO:2000114) |
| 0.1 | 1.0 | GO:0001514 | selenocysteine incorporation(GO:0001514) translational readthrough(GO:0006451) |
| 0.1 | 3.3 | GO:0070884 | regulation of calcineurin-NFAT signaling cascade(GO:0070884) |
| 0.1 | 2.9 | GO:0051865 | protein autoubiquitination(GO:0051865) |
| 0.1 | 7.2 | GO:0031146 | SCF-dependent proteasomal ubiquitin-dependent protein catabolic process(GO:0031146) |
| 0.1 | 2.4 | GO:0008089 | anterograde axonal transport(GO:0008089) |
| 0.1 | 0.3 | GO:0009298 | GDP-mannose biosynthetic process(GO:0009298) |
| 0.1 | 3.3 | GO:0010501 | RNA secondary structure unwinding(GO:0010501) |
| 0.1 | 1.9 | GO:0001525 | angiogenesis(GO:0001525) |
| 0.1 | 3.2 | GO:1904837 | beta-catenin-TCF complex assembly(GO:1904837) |
| 0.1 | 0.7 | GO:0048147 | negative regulation of fibroblast proliferation(GO:0048147) |
| 0.1 | 1.0 | GO:0031167 | rRNA methylation(GO:0031167) |
| 0.1 | 11.2 | GO:0008643 | carbohydrate transport(GO:0008643) |
| 0.1 | 0.7 | GO:0015846 | polyamine transport(GO:0015846) |
| 0.1 | 0.5 | GO:0050915 | regulation of systemic arterial blood pressure by baroreceptor feedback(GO:0003025) sensory perception of sour taste(GO:0050915) |
| 0.1 | 0.4 | GO:0008582 | regulation of synaptic growth at neuromuscular junction(GO:0008582) |
| 0.1 | 1.7 | GO:0006465 | signal peptide processing(GO:0006465) |
| 0.1 | 1.2 | GO:0042755 | eating behavior(GO:0042755) |
| 0.1 | 1.3 | GO:0009650 | UV protection(GO:0009650) |
| 0.1 | 1.0 | GO:0006681 | galactosylceramide metabolic process(GO:0006681) galactolipid metabolic process(GO:0019374) |
| 0.1 | 2.0 | GO:0090630 | activation of GTPase activity(GO:0090630) |
| 0.1 | 1.4 | GO:1902475 | L-alpha-amino acid transmembrane transport(GO:1902475) |
| 0.1 | 2.7 | GO:0043252 | sodium-independent organic anion transport(GO:0043252) |
| 0.1 | 5.8 | GO:0002028 | regulation of sodium ion transport(GO:0002028) |
| 0.1 | 2.8 | GO:0043966 | histone H3 acetylation(GO:0043966) |
| 0.1 | 0.4 | GO:0045343 | MHC class I biosynthetic process(GO:0045341) regulation of MHC class I biosynthetic process(GO:0045343) positive regulation of MHC class I biosynthetic process(GO:0045345) |
| 0.1 | 0.2 | GO:0007221 | positive regulation of transcription of Notch receptor target(GO:0007221) |
| 0.1 | 3.0 | GO:0030818 | negative regulation of cAMP biosynthetic process(GO:0030818) |
| 0.1 | 0.9 | GO:2000369 | regulation of clathrin-mediated endocytosis(GO:2000369) |
| 0.1 | 4.0 | GO:0006811 | ion transport(GO:0006811) |
| 0.1 | 1.0 | GO:0009303 | rRNA transcription(GO:0009303) |
| 0.1 | 2.6 | GO:0006929 | substrate-dependent cell migration(GO:0006929) |
| 0.1 | 1.0 | GO:0006109 | regulation of carbohydrate metabolic process(GO:0006109) |
| 0.1 | 0.5 | GO:0034356 | NAD biosynthesis via nicotinamide riboside salvage pathway(GO:0034356) |
| 0.1 | 4.1 | GO:0007602 | phototransduction(GO:0007602) |
| 0.1 | 2.5 | GO:0042982 | amyloid precursor protein metabolic process(GO:0042982) |
| 0.1 | 1.0 | GO:0072348 | sulfur compound transport(GO:0072348) |
| 0.1 | 0.5 | GO:0001833 | inner cell mass cell proliferation(GO:0001833) |
| 0.1 | 0.2 | GO:0021637 | trigeminal nerve morphogenesis(GO:0021636) trigeminal nerve structural organization(GO:0021637) semaphorin-plexin signaling pathway involved in axon guidance(GO:1902287) |
| 0.1 | 1.0 | GO:0034453 | microtubule anchoring(GO:0034453) |
| 0.1 | 0.2 | GO:0002667 | lymphocyte anergy(GO:0002249) regulation of T cell anergy(GO:0002667) T cell anergy(GO:0002870) regulation of lymphocyte anergy(GO:0002911) |
| 0.1 | 0.1 | GO:0035524 | proline transmembrane transport(GO:0035524) |
| 0.1 | 0.2 | GO:0032438 | melanosome organization(GO:0032438) pigment granule organization(GO:0048753) |
| 0.1 | 1.4 | GO:0050982 | detection of mechanical stimulus(GO:0050982) |
| 0.1 | 0.3 | GO:1900028 | negative regulation of ruffle assembly(GO:1900028) |
| 0.1 | 1.3 | GO:0031663 | lipopolysaccharide-mediated signaling pathway(GO:0031663) |
| 0.1 | 0.4 | GO:0010818 | T cell chemotaxis(GO:0010818) |
| 0.1 | 0.4 | GO:0035865 | cellular response to potassium ion(GO:0035865) |
| 0.1 | 0.5 | GO:0032464 | positive regulation of protein homooligomerization(GO:0032464) |
| 0.1 | 0.3 | GO:0046831 | regulation of RNA export from nucleus(GO:0046831) |
| 0.1 | 0.4 | GO:0070995 | NADPH oxidation(GO:0070995) |
| 0.1 | 0.7 | GO:0016576 | histone dephosphorylation(GO:0016576) |
| 0.1 | 1.5 | GO:0007098 | centrosome cycle(GO:0007098) centrosome organization(GO:0051297) |
| 0.1 | 0.2 | GO:0032815 | negative regulation of natural killer cell activation(GO:0032815) |
| 0.0 | 1.4 | GO:0006699 | bile acid biosynthetic process(GO:0006699) |
| 0.0 | 4.3 | GO:0033209 | tumor necrosis factor-mediated signaling pathway(GO:0033209) |
| 0.0 | 1.0 | GO:0045948 | positive regulation of translational initiation(GO:0045948) |
| 0.0 | 0.8 | GO:0030511 | positive regulation of transforming growth factor beta receptor signaling pathway(GO:0030511) positive regulation of cellular response to transforming growth factor beta stimulus(GO:1903846) |
| 0.0 | 0.3 | GO:0051923 | sulfation(GO:0051923) |
| 0.0 | 1.9 | GO:0044070 | regulation of anion transport(GO:0044070) |
| 0.0 | 0.7 | GO:0033169 | histone H3-K9 demethylation(GO:0033169) |
| 0.0 | 0.9 | GO:0018126 | protein hydroxylation(GO:0018126) |
| 0.0 | 2.1 | GO:0006891 | intra-Golgi vesicle-mediated transport(GO:0006891) |
| 0.0 | 0.3 | GO:0035562 | negative regulation of chromatin binding(GO:0035562) |
| 0.0 | 1.1 | GO:0006491 | N-glycan processing(GO:0006491) |
| 0.0 | 1.1 | GO:0000188 | inactivation of MAPK activity(GO:0000188) |
| 0.0 | 0.4 | GO:0030322 | stabilization of membrane potential(GO:0030322) |
| 0.0 | 0.6 | GO:0006875 | cellular metal ion homeostasis(GO:0006875) |
| 0.0 | 0.2 | GO:0019086 | late viral transcription(GO:0019086) |
| 0.0 | 0.3 | GO:0010832 | negative regulation of myotube differentiation(GO:0010832) |
| 0.0 | 0.6 | GO:0032292 | myelination in peripheral nervous system(GO:0022011) peripheral nervous system axon ensheathment(GO:0032292) |
| 0.0 | 2.6 | GO:0030574 | collagen catabolic process(GO:0030574) |
| 0.0 | 0.4 | GO:0048026 | positive regulation of mRNA splicing, via spliceosome(GO:0048026) |
| 0.0 | 0.5 | GO:0021542 | dentate gyrus development(GO:0021542) |
| 0.0 | 0.1 | GO:0070105 | regulation of interleukin-6-mediated signaling pathway(GO:0070103) positive regulation of interleukin-6-mediated signaling pathway(GO:0070105) |
| 0.0 | 10.4 | GO:0043687 | post-translational protein modification(GO:0043687) |
| 0.0 | 0.5 | GO:0030514 | negative regulation of BMP signaling pathway(GO:0030514) |
| 0.0 | 0.1 | GO:0002763 | positive regulation of myeloid leukocyte differentiation(GO:0002763) |
| 0.0 | 1.1 | GO:0032024 | positive regulation of insulin secretion(GO:0032024) |
| 0.0 | 0.2 | GO:0043923 | positive regulation by host of viral transcription(GO:0043923) |
| 0.0 | 0.5 | GO:0048246 | macrophage chemotaxis(GO:0048246) |
| 0.0 | 0.7 | GO:0010669 | epithelial structure maintenance(GO:0010669) |
| 0.0 | 0.5 | GO:0048265 | response to pain(GO:0048265) |
| 0.0 | 0.4 | GO:0006703 | estrogen biosynthetic process(GO:0006703) |
| 0.0 | 1.8 | GO:0003279 | cardiac septum development(GO:0003279) |
| 0.0 | 1.8 | GO:0006968 | cellular defense response(GO:0006968) |
| 0.0 | 0.7 | GO:0043001 | Golgi to plasma membrane protein transport(GO:0043001) |
| 0.0 | 0.6 | GO:0045494 | photoreceptor cell maintenance(GO:0045494) |
| 0.0 | 2.3 | GO:0019722 | calcium-mediated signaling(GO:0019722) |
| 0.0 | 1.6 | GO:0043647 | inositol phosphate metabolic process(GO:0043647) |
| 0.0 | 0.2 | GO:0007379 | segment specification(GO:0007379) |
| 0.0 | 0.4 | GO:0014912 | negative regulation of smooth muscle cell migration(GO:0014912) |
| 0.0 | 0.8 | GO:0032411 | positive regulation of transporter activity(GO:0032411) |
| 0.0 | 0.6 | GO:0000186 | activation of MAPKK activity(GO:0000186) |
| 0.0 | 0.3 | GO:0001755 | neural crest cell migration(GO:0001755) |
| 0.0 | 0.6 | GO:0032467 | positive regulation of cytokinesis(GO:0032467) |
| 0.0 | 11.8 | GO:0043547 | positive regulation of GTPase activity(GO:0043547) |
| 0.0 | 0.2 | GO:0090161 | Golgi ribbon formation(GO:0090161) |
| 0.0 | 0.2 | GO:1990118 | sodium ion import(GO:0097369) sodium ion import across plasma membrane(GO:0098719) sodium ion import into cell(GO:1990118) |
| 0.0 | 0.1 | GO:0097056 | seryl-tRNA aminoacylation(GO:0006434) selenocysteinyl-tRNA(Sec) biosynthetic process(GO:0097056) |
| 0.0 | 1.2 | GO:0048024 | regulation of mRNA splicing, via spliceosome(GO:0048024) |
| 0.0 | 0.2 | GO:0048546 | digestive tract morphogenesis(GO:0048546) |
| 0.0 | 0.3 | GO:0032211 | negative regulation of telomere maintenance via telomerase(GO:0032211) |
| 0.0 | 0.3 | GO:0006633 | fatty acid biosynthetic process(GO:0006633) |
| 0.0 | 0.4 | GO:0000028 | ribosomal small subunit assembly(GO:0000028) |
| 0.0 | 0.9 | GO:0050852 | T cell receptor signaling pathway(GO:0050852) |
| 0.0 | 0.1 | GO:0002517 | T cell tolerance induction(GO:0002517) |
| 0.0 | 0.2 | GO:0010811 | positive regulation of cell-substrate adhesion(GO:0010811) |
| 0.0 | 0.1 | GO:1902260 | negative regulation of delayed rectifier potassium channel activity(GO:1902260) negative regulation of voltage-gated potassium channel activity(GO:1903817) |
| 0.0 | 0.2 | GO:0051784 | negative regulation of nuclear division(GO:0051784) |
Gene overrepresentation in cellular_component category:
| Log-likelihood per target | Total log-likelihood | Term | Description |
|---|---|---|---|
| 7.5 | 59.7 | GO:0097208 | alveolar lamellar body(GO:0097208) |
| 5.5 | 38.4 | GO:0098575 | lumenal side of lysosomal membrane(GO:0098575) |
| 5.4 | 16.1 | GO:0019034 | viral replication complex(GO:0019034) |
| 5.3 | 26.7 | GO:0000221 | vacuolar proton-transporting V-type ATPase, V1 domain(GO:0000221) |
| 4.6 | 18.2 | GO:0070044 | synaptobrevin 2-SNAP-25-syntaxin-1a complex(GO:0070044) |
| 3.5 | 14.0 | GO:0033596 | TSC1-TSC2 complex(GO:0033596) |
| 3.5 | 24.5 | GO:0030121 | AP-1 adaptor complex(GO:0030121) |
| 3.4 | 17.2 | GO:0000408 | EKC/KEOPS complex(GO:0000408) |
| 3.3 | 13.4 | GO:0032777 | Piccolo NuA4 histone acetyltransferase complex(GO:0032777) |
| 3.1 | 18.6 | GO:0000015 | phosphopyruvate hydratase complex(GO:0000015) |
| 3.0 | 42.5 | GO:0030897 | HOPS complex(GO:0030897) |
| 3.0 | 12.1 | GO:0033263 | CORVET complex(GO:0033263) |
| 2.9 | 17.1 | GO:0070381 | endosome to plasma membrane transport vesicle(GO:0070381) |
| 2.7 | 21.4 | GO:0000322 | storage vacuole(GO:0000322) |
| 1.9 | 14.9 | GO:1990111 | spermatoproteasome complex(GO:1990111) |
| 1.8 | 16.5 | GO:0010009 | cytoplasmic side of endosome membrane(GO:0010009) |
| 1.8 | 7.3 | GO:1990246 | uniplex complex(GO:1990246) |
| 1.7 | 10.5 | GO:0000138 | Golgi trans cisterna(GO:0000138) |
| 1.5 | 26.5 | GO:0031083 | BLOC-1 complex(GO:0031083) |
| 1.4 | 13.9 | GO:0097413 | Lewy body(GO:0097413) |
| 1.3 | 7.7 | GO:1990131 | EGO complex(GO:0034448) Gtr1-Gtr2 GTPase complex(GO:1990131) |
| 1.3 | 34.7 | GO:0033176 | proton-transporting V-type ATPase complex(GO:0033176) |
| 1.2 | 15.7 | GO:0048188 | Set1C/COMPASS complex(GO:0048188) |
| 1.2 | 8.3 | GO:0045252 | oxoglutarate dehydrogenase complex(GO:0045252) |
| 1.1 | 4.3 | GO:0098592 | cytoplasmic side of apical plasma membrane(GO:0098592) |
| 1.0 | 28.0 | GO:0034362 | low-density lipoprotein particle(GO:0034362) |
| 1.0 | 52.9 | GO:0005834 | heterotrimeric G-protein complex(GO:0005834) |
| 1.0 | 30.6 | GO:0035371 | microtubule plus-end(GO:0035371) |
| 0.9 | 3.8 | GO:0032144 | 4-aminobutyrate transaminase complex(GO:0032144) |
| 0.9 | 2.7 | GO:0005879 | axonemal microtubule(GO:0005879) |
| 0.9 | 8.2 | GO:0005827 | polar microtubule(GO:0005827) |
| 0.9 | 19.6 | GO:0071004 | U2-type prespliceosome(GO:0071004) |
| 0.8 | 3.3 | GO:0055087 | Ski complex(GO:0055087) |
| 0.8 | 1.6 | GO:1903349 | omegasome membrane(GO:1903349) |
| 0.8 | 3.2 | GO:0005896 | interleukin-6 receptor complex(GO:0005896) |
| 0.8 | 5.6 | GO:1990635 | proximal dendrite(GO:1990635) |
| 0.8 | 4.8 | GO:1990316 | ATG1/ULK1 kinase complex(GO:1990316) |
| 0.8 | 11.6 | GO:0005662 | DNA replication factor A complex(GO:0005662) |
| 0.8 | 3.8 | GO:0044530 | supraspliceosomal complex(GO:0044530) |
| 0.8 | 20.7 | GO:0005721 | pericentric heterochromatin(GO:0005721) |
| 0.8 | 10.6 | GO:0031616 | spindle pole centrosome(GO:0031616) |
| 0.7 | 8.8 | GO:0030008 | TRAPP complex(GO:0030008) |
| 0.7 | 3.6 | GO:0033553 | rDNA heterochromatin(GO:0033553) |
| 0.7 | 7.9 | GO:0005869 | dynactin complex(GO:0005869) |
| 0.7 | 14.9 | GO:0031254 | uropod(GO:0001931) cell trailing edge(GO:0031254) |
| 0.7 | 5.5 | GO:0044666 | MLL3/4 complex(GO:0044666) |
| 0.6 | 20.7 | GO:0080008 | Cul4-RING E3 ubiquitin ligase complex(GO:0080008) |
| 0.6 | 2.4 | GO:0070288 | intracellular ferritin complex(GO:0008043) ferritin complex(GO:0070288) |
| 0.6 | 7.2 | GO:1990909 | catenin complex(GO:0016342) Wnt signalosome(GO:1990909) |
| 0.6 | 5.3 | GO:0005955 | calcineurin complex(GO:0005955) |
| 0.6 | 2.9 | GO:0030870 | Mre11 complex(GO:0030870) |
| 0.6 | 11.7 | GO:0005952 | cAMP-dependent protein kinase complex(GO:0005952) |
| 0.6 | 7.0 | GO:0099634 | postsynaptic specialization membrane(GO:0099634) |
| 0.6 | 6.9 | GO:0033093 | Weibel-Palade body(GO:0033093) |
| 0.6 | 3.4 | GO:0009331 | glycerol-3-phosphate dehydrogenase complex(GO:0009331) |
| 0.6 | 2.3 | GO:0005967 | mitochondrial pyruvate dehydrogenase complex(GO:0005967) |
| 0.6 | 1.7 | GO:0038039 | G-protein coupled receptor heterodimeric complex(GO:0038039) |
| 0.6 | 3.9 | GO:0036021 | endolysosome lumen(GO:0036021) |
| 0.6 | 10.5 | GO:0032591 | dendritic spine membrane(GO:0032591) |
| 0.5 | 4.4 | GO:0030130 | clathrin coat of trans-Golgi network vesicle(GO:0030130) |
| 0.5 | 1.6 | GO:0048269 | methionine adenosyltransferase complex(GO:0048269) |
| 0.5 | 1.6 | GO:0000346 | transcription export complex(GO:0000346) |
| 0.5 | 8.0 | GO:0042405 | nuclear inclusion body(GO:0042405) |
| 0.5 | 4.2 | GO:0005672 | transcription factor TFIIA complex(GO:0005672) |
| 0.5 | 4.6 | GO:0097197 | tetraspanin-enriched microdomain(GO:0097197) |
| 0.5 | 8.6 | GO:0098563 | integral component of synaptic vesicle membrane(GO:0030285) intrinsic component of synaptic vesicle membrane(GO:0098563) |
| 0.5 | 5.9 | GO:0060077 | inhibitory synapse(GO:0060077) |
| 0.5 | 21.7 | GO:0043198 | dendritic shaft(GO:0043198) |
| 0.5 | 11.2 | GO:0071141 | SMAD protein complex(GO:0071141) |
| 0.5 | 1.9 | GO:0005638 | lamin filament(GO:0005638) |
| 0.5 | 44.3 | GO:0032580 | Golgi cisterna membrane(GO:0032580) |
| 0.5 | 168.4 | GO:0098852 | lysosomal membrane(GO:0005765) lytic vacuole membrane(GO:0098852) |
| 0.5 | 4.7 | GO:0035253 | ciliary rootlet(GO:0035253) |
| 0.5 | 4.6 | GO:0070775 | H3 histone acetyltransferase complex(GO:0070775) MOZ/MORF histone acetyltransferase complex(GO:0070776) |
| 0.5 | 17.0 | GO:0045334 | clathrin-coated endocytic vesicle(GO:0045334) |
| 0.4 | 38.7 | GO:0070821 | tertiary granule membrane(GO:0070821) |
| 0.4 | 3.9 | GO:0030119 | AP-type membrane coat adaptor complex(GO:0030119) |
| 0.4 | 4.3 | GO:0016461 | unconventional myosin complex(GO:0016461) |
| 0.4 | 4.3 | GO:0042587 | glycogen granule(GO:0042587) |
| 0.4 | 2.9 | GO:0001741 | XY body(GO:0001741) |
| 0.4 | 10.2 | GO:0046540 | U4/U6 x U5 tri-snRNP complex(GO:0046540) |
| 0.4 | 5.6 | GO:0005875 | microtubule associated complex(GO:0005875) |
| 0.4 | 10.5 | GO:0031307 | integral component of mitochondrial outer membrane(GO:0031307) |
| 0.4 | 1.6 | GO:0005853 | eukaryotic translation elongation factor 1 complex(GO:0005853) |
| 0.4 | 2.3 | GO:0071817 | MMXD complex(GO:0071817) |
| 0.4 | 1.8 | GO:0031313 | extrinsic component of endosome membrane(GO:0031313) |
| 0.4 | 5.1 | GO:0005883 | neurofilament(GO:0005883) |
| 0.4 | 1.1 | GO:0030896 | checkpoint clamp complex(GO:0030896) |
| 0.4 | 1.1 | GO:0008024 | cyclin/CDK positive transcription elongation factor complex(GO:0008024) |
| 0.4 | 1.1 | GO:0044609 | DBIRD complex(GO:0044609) |
| 0.4 | 1.1 | GO:0034657 | GID complex(GO:0034657) |
| 0.3 | 44.4 | GO:0016605 | PML body(GO:0016605) |
| 0.3 | 4.1 | GO:0071339 | MLL1/2 complex(GO:0044665) MLL1 complex(GO:0071339) |
| 0.3 | 0.7 | GO:0030120 | vesicle coat(GO:0030120) |
| 0.3 | 1.0 | GO:0009330 | DNA topoisomerase complex (ATP-hydrolyzing)(GO:0009330) |
| 0.3 | 5.0 | GO:0048786 | presynaptic active zone(GO:0048786) |
| 0.3 | 2.5 | GO:0097504 | Gemini of coiled bodies(GO:0097504) |
| 0.3 | 1.9 | GO:0000835 | ER ubiquitin ligase complex(GO:0000835) |
| 0.3 | 5.7 | GO:0005885 | Arp2/3 protein complex(GO:0005885) |
| 0.3 | 52.8 | GO:0005802 | trans-Golgi network(GO:0005802) |
| 0.3 | 3.9 | GO:0097470 | ribbon synapse(GO:0097470) |
| 0.3 | 34.3 | GO:0005604 | basement membrane(GO:0005604) |
| 0.3 | 4.1 | GO:0035861 | site of double-strand break(GO:0035861) |
| 0.3 | 4.0 | GO:0098797 | plasma membrane protein complex(GO:0098797) |
| 0.3 | 5.4 | GO:0000242 | pericentriolar material(GO:0000242) |
| 0.3 | 2.5 | GO:0032045 | guanyl-nucleotide exchange factor complex(GO:0032045) |
| 0.3 | 110.7 | GO:0016607 | nuclear speck(GO:0016607) |
| 0.3 | 10.0 | GO:0008180 | COP9 signalosome(GO:0008180) |
| 0.3 | 0.8 | GO:0005637 | nuclear inner membrane(GO:0005637) |
| 0.2 | 27.2 | GO:0043202 | lysosomal lumen(GO:0043202) |
| 0.2 | 17.8 | GO:0042734 | presynaptic membrane(GO:0042734) |
| 0.2 | 1.7 | GO:0005787 | signal peptidase complex(GO:0005787) |
| 0.2 | 4.1 | GO:0032059 | bleb(GO:0032059) |
| 0.2 | 1.9 | GO:0032039 | integrator complex(GO:0032039) |
| 0.2 | 4.8 | GO:0032839 | dendrite cytoplasm(GO:0032839) |
| 0.2 | 6.5 | GO:0044306 | neuron projection terminus(GO:0044306) |
| 0.2 | 10.1 | GO:0030133 | transport vesicle(GO:0030133) |
| 0.2 | 1.5 | GO:0032389 | MutLalpha complex(GO:0032389) |
| 0.2 | 1.7 | GO:0030126 | COPI vesicle coat(GO:0030126) |
| 0.2 | 2.3 | GO:0071682 | endocytic vesicle lumen(GO:0071682) |
| 0.2 | 3.6 | GO:1990124 | messenger ribonucleoprotein complex(GO:1990124) |
| 0.2 | 26.3 | GO:0005770 | late endosome(GO:0005770) |
| 0.2 | 1.4 | GO:0030914 | STAGA complex(GO:0030914) |
| 0.2 | 2.4 | GO:0008385 | IkappaB kinase complex(GO:0008385) |
| 0.2 | 1.0 | GO:0046581 | intercellular canaliculus(GO:0046581) |
| 0.2 | 1.1 | GO:1990769 | proximal neuron projection(GO:1990769) |
| 0.2 | 2.0 | GO:0097136 | Bcl-2 family protein complex(GO:0097136) |
| 0.2 | 1.1 | GO:0005927 | muscle tendon junction(GO:0005927) |
| 0.2 | 0.9 | GO:0030678 | mitochondrial ribonuclease P complex(GO:0030678) |
| 0.2 | 0.5 | GO:0097447 | dendritic tree(GO:0097447) |
| 0.2 | 0.5 | GO:0044233 | ER-mitochondrion membrane contact site(GO:0044233) |
| 0.2 | 8.5 | GO:0031463 | Cul3-RING ubiquitin ligase complex(GO:0031463) |
| 0.2 | 2.7 | GO:0005905 | clathrin-coated pit(GO:0005905) |
| 0.2 | 3.9 | GO:0042101 | T cell receptor complex(GO:0042101) |
| 0.2 | 4.4 | GO:0101003 | ficolin-1-rich granule membrane(GO:0101003) |
| 0.2 | 2.2 | GO:0005790 | smooth endoplasmic reticulum(GO:0005790) |
| 0.2 | 16.2 | GO:0030175 | filopodium(GO:0030175) |
| 0.2 | 8.8 | GO:0031907 | peroxisomal matrix(GO:0005782) microbody lumen(GO:0031907) |
| 0.1 | 3.0 | GO:0030665 | clathrin-coated vesicle membrane(GO:0030665) |
| 0.1 | 0.7 | GO:0046696 | lipopolysaccharide receptor complex(GO:0046696) |
| 0.1 | 0.7 | GO:0032281 | AMPA glutamate receptor complex(GO:0032281) |
| 0.1 | 3.0 | GO:0097381 | photoreceptor disc membrane(GO:0097381) |
| 0.1 | 14.6 | GO:0031234 | extrinsic component of cytoplasmic side of plasma membrane(GO:0031234) |
| 0.1 | 1.5 | GO:0000930 | gamma-tubulin complex(GO:0000930) |
| 0.1 | 0.9 | GO:0000127 | transcription factor TFIIIC complex(GO:0000127) |
| 0.1 | 4.2 | GO:0030136 | clathrin-coated vesicle(GO:0030136) |
| 0.1 | 0.7 | GO:0070847 | core mediator complex(GO:0070847) |
| 0.1 | 6.2 | GO:0019005 | SCF ubiquitin ligase complex(GO:0019005) |
| 0.1 | 0.5 | GO:0014731 | spectrin-associated cytoskeleton(GO:0014731) |
| 0.1 | 0.6 | GO:0097452 | GAIT complex(GO:0097452) |
| 0.1 | 11.4 | GO:0005777 | peroxisome(GO:0005777) microbody(GO:0042579) |
| 0.1 | 2.7 | GO:1904115 | axon cytoplasm(GO:1904115) |
| 0.1 | 1.8 | GO:0043235 | receptor complex(GO:0043235) |
| 0.1 | 88.2 | GO:0045202 | synapse(GO:0045202) |
| 0.1 | 13.6 | GO:0000922 | spindle pole(GO:0000922) |
| 0.1 | 2.0 | GO:0097342 | ripoptosome(GO:0097342) |
| 0.1 | 0.6 | GO:0030991 | intraciliary transport particle A(GO:0030991) |
| 0.1 | 16.1 | GO:0030424 | axon(GO:0030424) |
| 0.1 | 6.8 | GO:1904724 | tertiary granule lumen(GO:1904724) |
| 0.1 | 0.6 | GO:0005915 | zonula adherens(GO:0005915) |
| 0.1 | 3.5 | GO:0031461 | cullin-RING ubiquitin ligase complex(GO:0031461) |
| 0.1 | 0.6 | GO:0005854 | nascent polypeptide-associated complex(GO:0005854) |
| 0.1 | 1.8 | GO:0032391 | photoreceptor connecting cilium(GO:0032391) |
| 0.1 | 1.5 | GO:0031430 | M band(GO:0031430) |
| 0.1 | 3.3 | GO:1990391 | DNA repair complex(GO:1990391) |
| 0.1 | 1.6 | GO:0008074 | guanylate cyclase complex, soluble(GO:0008074) |
| 0.1 | 1.2 | GO:0000407 | pre-autophagosomal structure(GO:0000407) |
| 0.1 | 1.0 | GO:0030014 | CCR4-NOT complex(GO:0030014) |
| 0.1 | 4.3 | GO:0008076 | voltage-gated potassium channel complex(GO:0008076) potassium channel complex(GO:0034705) |
| 0.1 | 0.4 | GO:0097418 | neurofibrillary tangle(GO:0097418) |
| 0.1 | 3.6 | GO:0000932 | cytoplasmic mRNA processing body(GO:0000932) |
| 0.1 | 8.1 | GO:0005741 | mitochondrial outer membrane(GO:0005741) |
| 0.1 | 0.3 | GO:0045254 | pyruvate dehydrogenase complex(GO:0045254) |
| 0.1 | 1.6 | GO:0000792 | heterochromatin(GO:0000792) |
| 0.1 | 0.6 | GO:0000783 | telomere cap complex(GO:0000782) nuclear telomere cap complex(GO:0000783) |
| 0.1 | 3.1 | GO:0071013 | catalytic step 2 spliceosome(GO:0071013) |
| 0.1 | 0.7 | GO:0016528 | sarcoplasm(GO:0016528) |
| 0.0 | 3.2 | GO:0030027 | lamellipodium(GO:0030027) |
| 0.0 | 1.8 | GO:0035579 | specific granule membrane(GO:0035579) |
| 0.0 | 9.5 | GO:0005788 | endoplasmic reticulum lumen(GO:0005788) |
| 0.0 | 2.3 | GO:0036064 | ciliary basal body(GO:0036064) |
| 0.0 | 1.5 | GO:0005801 | cis-Golgi network(GO:0005801) |
| 0.0 | 0.4 | GO:0000176 | nuclear exosome (RNase complex)(GO:0000176) |
| 0.0 | 0.2 | GO:0002116 | semaphorin receptor complex(GO:0002116) |
| 0.0 | 11.7 | GO:0005768 | endosome(GO:0005768) |
| 0.0 | 4.7 | GO:0043025 | neuronal cell body(GO:0043025) |
| 0.0 | 2.4 | GO:0000151 | ubiquitin ligase complex(GO:0000151) |
| 0.0 | 0.6 | GO:0005719 | nuclear euchromatin(GO:0005719) |
| 0.0 | 3.7 | GO:0005874 | microtubule(GO:0005874) |
| 0.0 | 0.8 | GO:0031526 | brush border membrane(GO:0031526) |
| 0.0 | 0.5 | GO:0005876 | spindle microtubule(GO:0005876) |
| 0.0 | 0.4 | GO:0000159 | protein phosphatase type 2A complex(GO:0000159) |
| 0.0 | 0.7 | GO:0030426 | growth cone(GO:0030426) |
| 0.0 | 0.8 | GO:0036464 | cytoplasmic ribonucleoprotein granule(GO:0036464) |
| 0.0 | 2.4 | GO:0032993 | protein-DNA complex(GO:0032993) |
| 0.0 | 0.6 | GO:0005669 | transcription factor TFIID complex(GO:0005669) |
| 0.0 | 0.2 | GO:0005655 | nucleolar ribonuclease P complex(GO:0005655) |
| 0.0 | 0.5 | GO:0030173 | integral component of Golgi membrane(GO:0030173) |
| 0.0 | 2.5 | GO:0072562 | blood microparticle(GO:0072562) |
| 0.0 | 1.5 | GO:0045111 | intermediate filament cytoskeleton(GO:0045111) |
Gene overrepresentation in molecular_function category:
| Log-likelihood per target | Total log-likelihood | Term | Description |
|---|---|---|---|
| 7.3 | 36.5 | GO:0004489 | methylenetetrahydrofolate reductase (NAD(P)H) activity(GO:0004489) |
| 6.7 | 20.1 | GO:0015218 | pyrimidine nucleotide transmembrane transporter activity(GO:0015218) |
| 6.6 | 19.8 | GO:0008330 | protein tyrosine/threonine phosphatase activity(GO:0008330) |
| 6.2 | 24.9 | GO:0016230 | sphingomyelin phosphodiesterase activator activity(GO:0016230) |
| 4.4 | 35.0 | GO:0004308 | exo-alpha-sialidase activity(GO:0004308) alpha-sialidase activity(GO:0016997) |
| 4.3 | 47.1 | GO:0031681 | G-protein beta-subunit binding(GO:0031681) |
| 4.2 | 25.4 | GO:0004741 | [pyruvate dehydrogenase (lipoamide)] phosphatase activity(GO:0004741) |
| 4.0 | 11.9 | GO:0008859 | exoribonuclease II activity(GO:0008859) |
| 3.9 | 85.4 | GO:0005247 | voltage-gated chloride channel activity(GO:0005247) |
| 3.4 | 10.1 | GO:0071558 | histone demethylase activity (H3-K27 specific)(GO:0071558) |
| 3.3 | 13.3 | GO:0042030 | ATPase inhibitor activity(GO:0042030) |
| 3.3 | 9.9 | GO:0032422 | purine-rich negative regulatory element binding(GO:0032422) |
| 3.3 | 9.8 | GO:0004616 | phosphogluconate dehydrogenase (decarboxylating) activity(GO:0004616) |
| 3.2 | 22.4 | GO:0051864 | histone demethylase activity (H3-K36 specific)(GO:0051864) |
| 3.1 | 18.6 | GO:0004634 | phosphopyruvate hydratase activity(GO:0004634) |
| 3.1 | 12.4 | GO:0008449 | N-acetylglucosamine-6-sulfatase activity(GO:0008449) |
| 3.1 | 12.2 | GO:0070290 | N-acylphosphatidylethanolamine-specific phospholipase D activity(GO:0070290) |
| 2.9 | 8.6 | GO:0043739 | G/U mismatch-specific uracil-DNA glycosylase activity(GO:0043739) |
| 2.6 | 26.0 | GO:0061578 | Lys63-specific deubiquitinase activity(GO:0061578) |
| 2.6 | 10.3 | GO:0022858 | L-alanine transmembrane transporter activity(GO:0015180) alanine transmembrane transporter activity(GO:0022858) |
| 2.6 | 15.4 | GO:0008240 | tripeptidyl-peptidase activity(GO:0008240) |
| 2.1 | 23.5 | GO:0016494 | C-X-C chemokine receptor activity(GO:0016494) |
| 2.1 | 44.9 | GO:0015929 | hexosaminidase activity(GO:0015929) |
| 2.1 | 60.2 | GO:0036442 | hydrogen-exporting ATPase activity(GO:0036442) |
| 2.0 | 9.8 | GO:0034046 | poly(G) binding(GO:0034046) |
| 1.9 | 5.8 | GO:0030627 | pre-mRNA 5'-splice site binding(GO:0030627) |
| 1.8 | 28.0 | GO:0030306 | ADP-ribosylation factor binding(GO:0030306) |
| 1.7 | 10.4 | GO:0035500 | MH2 domain binding(GO:0035500) |
| 1.7 | 8.3 | GO:0004591 | oxoglutarate dehydrogenase (succinyl-transferring) activity(GO:0004591) |
| 1.7 | 5.0 | GO:0035403 | histone kinase activity (H3-T6 specific)(GO:0035403) |
| 1.7 | 5.0 | GO:0033149 | FFAT motif binding(GO:0033149) |
| 1.5 | 13.9 | GO:0047623 | AMP deaminase activity(GO:0003876) adenosine-phosphate deaminase activity(GO:0047623) |
| 1.5 | 13.8 | GO:0043426 | MRF binding(GO:0043426) |
| 1.5 | 6.0 | GO:0043398 | HLH domain binding(GO:0043398) |
| 1.5 | 29.9 | GO:0070273 | phosphatidylinositol-4-phosphate binding(GO:0070273) |
| 1.5 | 8.8 | GO:0003998 | acylphosphatase activity(GO:0003998) |
| 1.4 | 17.1 | GO:0032050 | clathrin heavy chain binding(GO:0032050) |
| 1.4 | 8.5 | GO:0004430 | 1-phosphatidylinositol 4-kinase activity(GO:0004430) |
| 1.4 | 109.8 | GO:0005507 | copper ion binding(GO:0005507) |
| 1.4 | 5.5 | GO:0015319 | sodium:inorganic phosphate symporter activity(GO:0015319) |
| 1.3 | 5.2 | GO:0034057 | RNA strand-exchange activity(GO:0034057) |
| 1.3 | 3.8 | GO:0008321 | Ral guanyl-nucleotide exchange factor activity(GO:0008321) |
| 1.2 | 21.1 | GO:0008484 | sulfuric ester hydrolase activity(GO:0008484) |
| 1.2 | 2.4 | GO:0008384 | IkappaB kinase activity(GO:0008384) |
| 1.2 | 53.2 | GO:0050699 | WW domain binding(GO:0050699) |
| 1.2 | 4.6 | GO:0005105 | type 1 fibroblast growth factor receptor binding(GO:0005105) |
| 1.1 | 3.3 | GO:0004677 | DNA-dependent protein kinase activity(GO:0004677) |
| 1.1 | 3.2 | GO:0004915 | interleukin-6 receptor activity(GO:0004915) interleukin-6 binding(GO:0019981) |
| 1.1 | 8.5 | GO:0035374 | chondroitin sulfate binding(GO:0035374) |
| 1.1 | 2.1 | GO:0070087 | chromo shadow domain binding(GO:0070087) |
| 1.0 | 4.1 | GO:0034988 | Fc-gamma receptor I complex binding(GO:0034988) |
| 1.0 | 6.1 | GO:0004528 | phosphodiesterase I activity(GO:0004528) |
| 1.0 | 5.1 | GO:0070815 | peptidyl-lysine 5-dioxygenase activity(GO:0070815) |
| 1.0 | 3.0 | GO:0004939 | beta-adrenergic receptor activity(GO:0004939) |
| 1.0 | 6.0 | GO:0003917 | DNA topoisomerase type I activity(GO:0003917) |
| 1.0 | 3.8 | GO:0032406 | MutLbeta complex binding(GO:0032406) MutSbeta complex binding(GO:0032408) |
| 1.0 | 3.8 | GO:0003726 | double-stranded RNA adenosine deaminase activity(GO:0003726) |
| 1.0 | 4.8 | GO:0004699 | calcium-independent protein kinase C activity(GO:0004699) |
| 0.9 | 2.8 | GO:0004949 | cannabinoid receptor activity(GO:0004949) |
| 0.9 | 2.8 | GO:0005137 | interleukin-5 receptor binding(GO:0005137) |
| 0.9 | 3.8 | GO:0032145 | 4-aminobutyrate transaminase activity(GO:0003867) succinate-semialdehyde dehydrogenase binding(GO:0032145) (S)-3-amino-2-methylpropionate transaminase activity(GO:0047298) |
| 0.9 | 5.6 | GO:0044594 | 3alpha,7alpha,12alpha-trihydroxy-5beta-cholest-24-enoyl-CoA hydratase activity(GO:0033989) 17-beta-hydroxysteroid dehydrogenase (NAD+) activity(GO:0044594) |
| 0.9 | 4.7 | GO:0070097 | delta-catenin binding(GO:0070097) |
| 0.9 | 0.9 | GO:0001031 | polymerase III regulatory region sequence-specific DNA binding(GO:0000992) RNA polymerase III type 1 promoter sequence-specific DNA binding(GO:0001002) RNA polymerase III type 2 promoter sequence-specific DNA binding(GO:0001003) RNA polymerase III type 1 promoter DNA binding(GO:0001030) RNA polymerase III type 2 promoter DNA binding(GO:0001031) 5S rDNA binding(GO:0080084) |
| 0.9 | 13.9 | GO:0005351 | sugar:proton symporter activity(GO:0005351) cation:sugar symporter activity(GO:0005402) |
| 0.9 | 17.4 | GO:0033130 | acetylcholine receptor binding(GO:0033130) |
| 0.9 | 3.7 | GO:0061628 | H3K27me3 modified histone binding(GO:0061628) |
| 0.9 | 3.6 | GO:0001025 | RNA polymerase III transcription factor binding(GO:0001025) |
| 0.9 | 6.3 | GO:0005375 | copper ion transmembrane transporter activity(GO:0005375) |
| 0.9 | 5.2 | GO:0004565 | beta-galactosidase activity(GO:0004565) |
| 0.9 | 5.1 | GO:0004331 | 6-phosphofructo-2-kinase activity(GO:0003873) fructose-2,6-bisphosphate 2-phosphatase activity(GO:0004331) |
| 0.8 | 21.2 | GO:0000062 | fatty-acyl-CoA binding(GO:0000062) |
| 0.8 | 1.6 | GO:0038052 | RNA polymerase II transcription factor activity, estrogen-activated sequence-specific DNA binding(GO:0038052) |
| 0.8 | 3.2 | GO:0042500 | aspartic endopeptidase activity, intramembrane cleaving(GO:0042500) |
| 0.7 | 4.3 | GO:0051033 | nucleic acid transmembrane transporter activity(GO:0051032) RNA transmembrane transporter activity(GO:0051033) |
| 0.7 | 11.5 | GO:0031702 | type 1 angiotensin receptor binding(GO:0031702) |
| 0.7 | 4.3 | GO:0050291 | sphingosine N-acyltransferase activity(GO:0050291) |
| 0.7 | 4.3 | GO:0000155 | phosphorelay sensor kinase activity(GO:0000155) |
| 0.7 | 2.8 | GO:0033829 | O-fucosylpeptide 3-beta-N-acetylglucosaminyltransferase activity(GO:0033829) |
| 0.7 | 8.9 | GO:0008199 | ferric iron binding(GO:0008199) |
| 0.7 | 68.4 | GO:0001618 | virus receptor activity(GO:0001618) |
| 0.7 | 24.8 | GO:0070577 | lysine-acetylated histone binding(GO:0070577) |
| 0.7 | 3.3 | GO:1990189 | peptide-serine-N-acetyltransferase activity(GO:1990189) |
| 0.7 | 0.7 | GO:0070538 | oleic acid binding(GO:0070538) |
| 0.7 | 2.0 | GO:0033867 | Fas-activated serine/threonine kinase activity(GO:0033867) |
| 0.6 | 19.5 | GO:0004298 | threonine-type endopeptidase activity(GO:0004298) threonine-type peptidase activity(GO:0070003) |
| 0.6 | 4.5 | GO:0016618 | hydroxypyruvate reductase activity(GO:0016618) glyoxylate reductase (NADP) activity(GO:0030267) |
| 0.6 | 6.3 | GO:0004767 | sphingomyelin phosphodiesterase activity(GO:0004767) |
| 0.6 | 1.3 | GO:0004630 | phospholipase D activity(GO:0004630) |
| 0.6 | 17.3 | GO:0008157 | protein phosphatase 1 binding(GO:0008157) |
| 0.6 | 11.6 | GO:0070530 | K63-linked polyubiquitin binding(GO:0070530) |
| 0.6 | 6.7 | GO:0046972 | histone acetyltransferase activity (H4-K5 specific)(GO:0043995) histone acetyltransferase activity (H4-K8 specific)(GO:0043996) histone acetyltransferase activity (H4-K16 specific)(GO:0046972) |
| 0.6 | 3.0 | GO:0070404 | NADH binding(GO:0070404) |
| 0.6 | 2.3 | GO:0042132 | fructose 1,6-bisphosphate 1-phosphatase activity(GO:0042132) |
| 0.6 | 2.3 | GO:0004740 | pyruvate dehydrogenase (acetyl-transferring) kinase activity(GO:0004740) |
| 0.6 | 1.7 | GO:0004965 | G-protein coupled GABA receptor activity(GO:0004965) |
| 0.6 | 5.0 | GO:0046976 | histone methyltransferase activity (H3-K27 specific)(GO:0046976) |
| 0.6 | 2.8 | GO:0008479 | queuine tRNA-ribosyltransferase activity(GO:0008479) |
| 0.6 | 11.1 | GO:0008603 | cAMP-dependent protein kinase regulator activity(GO:0008603) |
| 0.5 | 3.3 | GO:0008597 | calcium-dependent protein serine/threonine phosphatase regulator activity(GO:0008597) |
| 0.5 | 4.9 | GO:0001225 | RNA polymerase II transcription coactivator binding(GO:0001225) |
| 0.5 | 2.7 | GO:0033592 | RNA strand annealing activity(GO:0033592) |
| 0.5 | 5.9 | GO:0051429 | corticotropin-releasing hormone receptor binding(GO:0051429) corticotropin-releasing hormone receptor 1 binding(GO:0051430) |
| 0.5 | 5.3 | GO:0033192 | calmodulin-dependent protein phosphatase activity(GO:0033192) |
| 0.5 | 14.3 | GO:0071855 | neuropeptide receptor binding(GO:0071855) |
| 0.5 | 3.2 | GO:0019531 | oxalate transmembrane transporter activity(GO:0019531) |
| 0.5 | 2.6 | GO:0044729 | hemi-methylated DNA-binding(GO:0044729) |
| 0.5 | 27.7 | GO:0017112 | Rab guanyl-nucleotide exchange factor activity(GO:0017112) |
| 0.5 | 4.5 | GO:0047499 | calcium-independent phospholipase A2 activity(GO:0047499) |
| 0.5 | 5.6 | GO:0070569 | uridylyltransferase activity(GO:0070569) |
| 0.5 | 11.6 | GO:0016881 | acid-amino acid ligase activity(GO:0016881) |
| 0.5 | 5.5 | GO:0001206 | transcriptional repressor activity, RNA polymerase II distal enhancer sequence-specific binding(GO:0001206) |
| 0.5 | 3.0 | GO:0008142 | oxysterol binding(GO:0008142) |
| 0.5 | 2.9 | GO:0003886 | DNA (cytosine-5-)-methyltransferase activity(GO:0003886) |
| 0.5 | 1.8 | GO:0004809 | tRNA (guanine-N2-)-methyltransferase activity(GO:0004809) |
| 0.5 | 4.5 | GO:0004075 | biotin carboxylase activity(GO:0004075) biotin binding(GO:0009374) |
| 0.5 | 11.8 | GO:0005086 | ARF guanyl-nucleotide exchange factor activity(GO:0005086) |
| 0.4 | 4.5 | GO:0031730 | CCR5 chemokine receptor binding(GO:0031730) |
| 0.4 | 2.6 | GO:0015185 | gamma-aminobutyric acid:sodium symporter activity(GO:0005332) gamma-aminobutyric acid transmembrane transporter activity(GO:0015185) |
| 0.4 | 4.3 | GO:0003910 | DNA ligase (ATP) activity(GO:0003910) |
| 0.4 | 8.8 | GO:0015278 | calcium-release channel activity(GO:0015278) ligand-gated calcium channel activity(GO:0099604) |
| 0.4 | 7.3 | GO:0004861 | cyclin-dependent protein serine/threonine kinase inhibitor activity(GO:0004861) |
| 0.4 | 2.0 | GO:0001010 | transcription factor activity, sequence-specific DNA binding transcription factor recruiting(GO:0001010) |
| 0.4 | 2.4 | GO:0032558 | adenyl deoxyribonucleotide binding(GO:0032558) dATP binding(GO:0032564) |
| 0.4 | 3.1 | GO:0003997 | acyl-CoA oxidase activity(GO:0003997) |
| 0.4 | 2.0 | GO:0097199 | cysteine-type endopeptidase activity involved in apoptotic signaling pathway(GO:0097199) |
| 0.4 | 3.9 | GO:0030957 | Tat protein binding(GO:0030957) |
| 0.4 | 30.6 | GO:0019905 | syntaxin binding(GO:0019905) |
| 0.4 | 2.3 | GO:0008269 | JAK pathway signal transduction adaptor activity(GO:0008269) |
| 0.4 | 11.2 | GO:0004708 | MAP kinase kinase activity(GO:0004708) |
| 0.4 | 3.1 | GO:0070181 | small ribosomal subunit rRNA binding(GO:0070181) |
| 0.4 | 5.7 | GO:0035612 | AP-2 adaptor complex binding(GO:0035612) |
| 0.4 | 6.9 | GO:0005522 | profilin binding(GO:0005522) |
| 0.4 | 13.6 | GO:0005109 | frizzled binding(GO:0005109) |
| 0.4 | 1.9 | GO:0044547 | DNA topoisomerase binding(GO:0044547) |
| 0.4 | 3.0 | GO:0044323 | retinoic acid-responsive element binding(GO:0044323) |
| 0.4 | 9.2 | GO:0005184 | neuropeptide hormone activity(GO:0005184) |
| 0.4 | 5.1 | GO:0004185 | serine-type carboxypeptidase activity(GO:0004185) |
| 0.4 | 4.7 | GO:0003836 | beta-galactoside (CMP) alpha-2,3-sialyltransferase activity(GO:0003836) |
| 0.4 | 2.1 | GO:0055131 | C3HC4-type RING finger domain binding(GO:0055131) |
| 0.3 | 1.0 | GO:0016435 | rRNA (guanine) methyltransferase activity(GO:0016435) |
| 0.3 | 18.6 | GO:0004402 | histone acetyltransferase activity(GO:0004402) |
| 0.3 | 20.6 | GO:0030276 | clathrin binding(GO:0030276) |
| 0.3 | 3.7 | GO:0005314 | high-affinity glutamate transmembrane transporter activity(GO:0005314) |
| 0.3 | 4.0 | GO:0019911 | structural constituent of myelin sheath(GO:0019911) |
| 0.3 | 5.7 | GO:0045295 | gamma-catenin binding(GO:0045295) |
| 0.3 | 8.3 | GO:0005521 | lamin binding(GO:0005521) |
| 0.3 | 1.0 | GO:0051185 | coenzyme transporter activity(GO:0051185) |
| 0.3 | 3.6 | GO:0001042 | RNA polymerase I core binding(GO:0001042) |
| 0.3 | 1.6 | GO:0047184 | 1-acylglycerophosphocholine O-acyltransferase activity(GO:0047184) |
| 0.3 | 1.0 | GO:1904288 | BAT3 complex binding(GO:1904288) |
| 0.3 | 1.9 | GO:0005225 | volume-sensitive anion channel activity(GO:0005225) |
| 0.3 | 1.2 | GO:0004727 | prenylated protein tyrosine phosphatase activity(GO:0004727) |
| 0.3 | 2.4 | GO:0008559 | xenobiotic-transporting ATPase activity(GO:0008559) |
| 0.3 | 6.9 | GO:0031489 | myosin V binding(GO:0031489) |
| 0.3 | 10.6 | GO:0000983 | transcription factor activity, RNA polymerase II core promoter sequence-specific(GO:0000983) |
| 0.3 | 8.0 | GO:0005388 | calcium-transporting ATPase activity(GO:0005388) |
| 0.3 | 1.5 | GO:0000182 | rDNA binding(GO:0000182) |
| 0.3 | 3.2 | GO:0030274 | LIM domain binding(GO:0030274) |
| 0.3 | 1.4 | GO:0017159 | pantetheine hydrolase activity(GO:0017159) |
| 0.3 | 1.4 | GO:0032795 | heterotrimeric G-protein binding(GO:0032795) |
| 0.3 | 1.6 | GO:0008440 | inositol-1,4,5-trisphosphate 3-kinase activity(GO:0008440) |
| 0.3 | 3.4 | GO:0001087 | transcription factor activity, sequence-specific DNA binding, RNA polymerase recruiting(GO:0001011) transcription factor activity, TFIIB-class binding(GO:0001087) |
| 0.3 | 1.6 | GO:0102336 | fatty acid elongase activity(GO:0009922) 3-oxo-arachidoyl-CoA synthase activity(GO:0102336) 3-oxo-cerotoyl-CoA synthase activity(GO:0102337) 3-oxo-lignoceronyl-CoA synthase activity(GO:0102338) |
| 0.3 | 1.8 | GO:0034452 | dynactin binding(GO:0034452) |
| 0.3 | 5.2 | GO:0003756 | protein disulfide isomerase activity(GO:0003756) intramolecular oxidoreductase activity, transposing S-S bonds(GO:0016864) |
| 0.3 | 1.3 | GO:0070878 | primary miRNA binding(GO:0070878) |
| 0.3 | 4.2 | GO:0080025 | phosphatidylinositol-3,5-bisphosphate binding(GO:0080025) |
| 0.3 | 2.8 | GO:0004030 | aldehyde dehydrogenase [NAD(P)+] activity(GO:0004030) |
| 0.2 | 22.4 | GO:0003725 | double-stranded RNA binding(GO:0003725) |
| 0.2 | 15.9 | GO:0019003 | GDP binding(GO:0019003) |
| 0.2 | 4.2 | GO:0043522 | leucine zipper domain binding(GO:0043522) |
| 0.2 | 1.9 | GO:0015349 | thyroid hormone transmembrane transporter activity(GO:0015349) |
| 0.2 | 5.6 | GO:0030742 | GTP-dependent protein binding(GO:0030742) |
| 0.2 | 63.6 | GO:0008017 | microtubule binding(GO:0008017) |
| 0.2 | 0.7 | GO:0015439 | heme-transporting ATPase activity(GO:0015439) |
| 0.2 | 3.0 | GO:0043014 | alpha-tubulin binding(GO:0043014) |
| 0.2 | 2.8 | GO:0005078 | MAP-kinase scaffold activity(GO:0005078) |
| 0.2 | 6.7 | GO:0004602 | glutathione peroxidase activity(GO:0004602) |
| 0.2 | 0.9 | GO:0004594 | pantothenate kinase activity(GO:0004594) |
| 0.2 | 1.6 | GO:0017034 | Rap guanyl-nucleotide exchange factor activity(GO:0017034) |
| 0.2 | 2.3 | GO:0005007 | fibroblast growth factor-activated receptor activity(GO:0005007) |
| 0.2 | 0.4 | GO:0071535 | RING-like zinc finger domain binding(GO:0071535) |
| 0.2 | 1.5 | GO:0032138 | single base insertion or deletion binding(GO:0032138) |
| 0.2 | 3.0 | GO:0008097 | 5S rRNA binding(GO:0008097) |
| 0.2 | 4.1 | GO:0071889 | 14-3-3 protein binding(GO:0071889) |
| 0.2 | 3.7 | GO:0017081 | chloride channel regulator activity(GO:0017081) |
| 0.2 | 3.4 | GO:0004697 | protein kinase C activity(GO:0004697) |
| 0.2 | 6.3 | GO:0000149 | SNARE binding(GO:0000149) |
| 0.2 | 4.3 | GO:0001968 | fibronectin binding(GO:0001968) |
| 0.2 | 8.9 | GO:0004712 | protein serine/threonine/tyrosine kinase activity(GO:0004712) |
| 0.2 | 2.2 | GO:0022820 | potassium:chloride symporter activity(GO:0015379) potassium ion symporter activity(GO:0022820) |
| 0.2 | 1.0 | GO:0061665 | SUMO ligase activity(GO:0061665) |
| 0.2 | 4.7 | GO:0001102 | RNA polymerase II activating transcription factor binding(GO:0001102) |
| 0.2 | 2.1 | GO:0019870 | potassium channel inhibitor activity(GO:0019870) |
| 0.2 | 2.5 | GO:0070182 | DNA polymerase binding(GO:0070182) |
| 0.2 | 17.0 | GO:0051117 | ATPase binding(GO:0051117) |
| 0.2 | 12.5 | GO:0050661 | NADP binding(GO:0050661) |
| 0.2 | 2.0 | GO:0051434 | BH3 domain binding(GO:0051434) |
| 0.2 | 1.1 | GO:0008853 | exodeoxyribonuclease III activity(GO:0008853) |
| 0.2 | 0.5 | GO:0035379 | carbon dioxide transmembrane transporter activity(GO:0035379) |
| 0.2 | 5.6 | GO:0015026 | coreceptor activity(GO:0015026) |
| 0.2 | 6.2 | GO:0008139 | nuclear localization sequence binding(GO:0008139) |
| 0.2 | 2.2 | GO:0031005 | filamin binding(GO:0031005) |
| 0.2 | 1.0 | GO:0008430 | thyroxine 5'-deiodinase activity(GO:0004800) selenium binding(GO:0008430) |
| 0.2 | 11.6 | GO:0098811 | transcriptional activator activity, RNA polymerase II transcription factor binding(GO:0001190) transcriptional repressor activity, RNA polymerase II activating transcription factor binding(GO:0098811) |
| 0.2 | 10.1 | GO:0004004 | ATP-dependent RNA helicase activity(GO:0004004) |
| 0.2 | 0.7 | GO:0017018 | myosin phosphatase activity(GO:0017018) |
| 0.2 | 14.1 | GO:0008565 | protein transporter activity(GO:0008565) |
| 0.2 | 0.7 | GO:0036033 | mediator complex binding(GO:0036033) |
| 0.2 | 1.8 | GO:0097016 | L27 domain binding(GO:0097016) |
| 0.2 | 1.1 | GO:0042974 | retinoic acid receptor binding(GO:0042974) |
| 0.2 | 7.0 | GO:0005546 | phosphatidylinositol-4,5-bisphosphate binding(GO:0005546) |
| 0.2 | 66.7 | GO:0004842 | ubiquitin-protein transferase activity(GO:0004842) |
| 0.2 | 2.0 | GO:1902936 | phosphatidylinositol bisphosphate binding(GO:1902936) |
| 0.2 | 3.5 | GO:0004062 | aryl sulfotransferase activity(GO:0004062) |
| 0.2 | 2.6 | GO:0004089 | carbonate dehydratase activity(GO:0004089) |
| 0.2 | 1.8 | GO:0005391 | sodium:potassium-exchanging ATPase activity(GO:0005391) |
| 0.1 | 2.0 | GO:0098847 | sequence-specific single stranded DNA binding(GO:0098847) |
| 0.1 | 4.2 | GO:0017025 | TBP-class protein binding(GO:0017025) |
| 0.1 | 9.0 | GO:0050660 | flavin adenine dinucleotide binding(GO:0050660) |
| 0.1 | 2.6 | GO:0004181 | metallocarboxypeptidase activity(GO:0004181) |
| 0.1 | 15.1 | GO:0016747 | transferase activity, transferring acyl groups other than amino-acyl groups(GO:0016747) |
| 0.1 | 0.4 | GO:0016641 | oxidoreductase activity, acting on the CH-NH2 group of donors, oxygen as acceptor(GO:0016641) |
| 0.1 | 0.4 | GO:0004507 | steroid 11-beta-monooxygenase activity(GO:0004507) corticosterone 18-monooxygenase activity(GO:0047783) |
| 0.1 | 2.2 | GO:0008656 | cysteine-type endopeptidase activator activity involved in apoptotic process(GO:0008656) |
| 0.1 | 5.7 | GO:0043022 | ribosome binding(GO:0043022) |
| 0.1 | 3.4 | GO:0017080 | sodium channel regulator activity(GO:0017080) |
| 0.1 | 3.5 | GO:0019894 | kinesin binding(GO:0019894) |
| 0.1 | 1.3 | GO:0015271 | outward rectifier potassium channel activity(GO:0015271) |
| 0.1 | 3.0 | GO:0030159 | receptor signaling complex scaffold activity(GO:0030159) |
| 0.1 | 2.8 | GO:0016790 | thiolester hydrolase activity(GO:0016790) |
| 0.1 | 22.8 | GO:0051015 | actin filament binding(GO:0051015) |
| 0.1 | 1.4 | GO:0016857 | racemase and epimerase activity, acting on carbohydrates and derivatives(GO:0016857) |
| 0.1 | 2.8 | GO:0015248 | sterol transporter activity(GO:0015248) |
| 0.1 | 0.3 | GO:0050510 | N-acetylgalactosaminyl-proteoglycan 3-beta-glucuronosyltransferase activity(GO:0050510) |
| 0.1 | 4.1 | GO:0043539 | protein serine/threonine kinase activator activity(GO:0043539) |
| 0.1 | 2.4 | GO:0004012 | phospholipid-translocating ATPase activity(GO:0004012) |
| 0.1 | 0.8 | GO:0097371 | MDM2/MDM4 family protein binding(GO:0097371) |
| 0.1 | 10.7 | GO:0005070 | SH3/SH2 adaptor activity(GO:0005070) |
| 0.1 | 9.9 | GO:0047485 | protein N-terminus binding(GO:0047485) |
| 0.1 | 32.6 | GO:0001077 | transcriptional activator activity, RNA polymerase II core promoter proximal region sequence-specific binding(GO:0001077) |
| 0.1 | 2.2 | GO:0015149 | hexose transmembrane transporter activity(GO:0015149) |
| 0.1 | 0.8 | GO:0019534 | toxin transporter activity(GO:0019534) |
| 0.1 | 1.7 | GO:0004535 | poly(A)-specific ribonuclease activity(GO:0004535) |
| 0.1 | 1.0 | GO:0031386 | protein tag(GO:0031386) |
| 0.1 | 1.1 | GO:0005095 | GTPase inhibitor activity(GO:0005095) |
| 0.1 | 5.0 | GO:0005160 | transforming growth factor beta receptor binding(GO:0005160) |
| 0.1 | 3.3 | GO:0004683 | calmodulin-dependent protein kinase activity(GO:0004683) |
| 0.1 | 0.5 | GO:0044736 | acid-sensing ion channel activity(GO:0044736) |
| 0.1 | 2.3 | GO:0005544 | calcium-dependent phospholipid binding(GO:0005544) |
| 0.1 | 1.7 | GO:0030331 | estrogen receptor binding(GO:0030331) |
| 0.1 | 0.6 | GO:0097109 | neuroligin family protein binding(GO:0097109) |
| 0.1 | 0.8 | GO:0015279 | store-operated calcium channel activity(GO:0015279) |
| 0.1 | 0.5 | GO:0043225 | anion transmembrane-transporting ATPase activity(GO:0043225) |
| 0.1 | 1.5 | GO:0019200 | carbohydrate kinase activity(GO:0019200) |
| 0.1 | 1.2 | GO:0015125 | bile acid transmembrane transporter activity(GO:0015125) |
| 0.1 | 0.3 | GO:0004739 | pyruvate dehydrogenase (acetyl-transferring) activity(GO:0004739) |
| 0.1 | 1.2 | GO:0042923 | neuropeptide binding(GO:0042923) |
| 0.1 | 9.8 | GO:0000982 | transcription factor activity, RNA polymerase II core promoter proximal region sequence-specific binding(GO:0000982) |
| 0.1 | 1.4 | GO:0015175 | neutral amino acid transmembrane transporter activity(GO:0015175) |
| 0.1 | 0.4 | GO:0008312 | 7S RNA binding(GO:0008312) |
| 0.1 | 0.2 | GO:0004574 | oligo-1,6-glucosidase activity(GO:0004574) |
| 0.1 | 0.7 | GO:0070888 | E-box binding(GO:0070888) |
| 0.1 | 2.1 | GO:0047555 | 3',5'-cyclic-GMP phosphodiesterase activity(GO:0047555) |
| 0.1 | 1.2 | GO:0003746 | translation elongation factor activity(GO:0003746) |
| 0.1 | 1.5 | GO:0070006 | metalloaminopeptidase activity(GO:0070006) |
| 0.1 | 0.6 | GO:0036122 | BMP binding(GO:0036122) |
| 0.1 | 6.5 | GO:0017137 | Rab GTPase binding(GO:0017137) |
| 0.1 | 0.7 | GO:0035240 | dopamine binding(GO:0035240) |
| 0.1 | 6.2 | GO:0017124 | SH3 domain binding(GO:0017124) |
| 0.1 | 0.6 | GO:0030291 | protein serine/threonine kinase inhibitor activity(GO:0030291) |
| 0.1 | 1.6 | GO:0004016 | adenylate cyclase activity(GO:0004016) guanylate cyclase activity(GO:0004383) |
| 0.1 | 5.8 | GO:0044325 | ion channel binding(GO:0044325) |
| 0.1 | 0.4 | GO:0008467 | [heparan sulfate]-glucosamine 3-sulfotransferase 1 activity(GO:0008467) |
| 0.1 | 0.6 | GO:0003691 | double-stranded telomeric DNA binding(GO:0003691) |
| 0.1 | 0.9 | GO:0016646 | oxidoreductase activity, acting on the CH-NH group of donors, NAD or NADP as acceptor(GO:0016646) |
| 0.1 | 0.4 | GO:0097322 | 7SK snRNA binding(GO:0097322) |
| 0.1 | 0.7 | GO:0047372 | acylglycerol lipase activity(GO:0047372) |
| 0.1 | 0.1 | GO:0005138 | interleukin-6 receptor binding(GO:0005138) |
| 0.1 | 12.4 | GO:0005096 | GTPase activator activity(GO:0005096) |
| 0.1 | 1.6 | GO:0015171 | amino acid transmembrane transporter activity(GO:0015171) |
| 0.1 | 0.4 | GO:0042809 | vitamin D receptor binding(GO:0042809) |
| 0.0 | 0.5 | GO:0016861 | intramolecular oxidoreductase activity, interconverting aldoses and ketoses(GO:0016861) |
| 0.0 | 1.1 | GO:0004435 | phosphatidylinositol phospholipase C activity(GO:0004435) phospholipase C activity(GO:0004629) |
| 0.0 | 0.9 | GO:0001608 | G-protein coupled nucleotide receptor activity(GO:0001608) G-protein coupled purinergic nucleotide receptor activity(GO:0045028) |
| 0.0 | 7.2 | GO:0000287 | magnesium ion binding(GO:0000287) |
| 0.0 | 0.3 | GO:0016868 | intramolecular transferase activity, phosphotransferases(GO:0016868) |
| 0.0 | 0.4 | GO:0022842 | leak channel activity(GO:0022840) narrow pore channel activity(GO:0022842) |
| 0.0 | 0.9 | GO:0031210 | phosphatidylcholine binding(GO:0031210) |
| 0.0 | 0.4 | GO:0031434 | mitogen-activated protein kinase kinase binding(GO:0031434) |
| 0.0 | 1.3 | GO:0051213 | dioxygenase activity(GO:0051213) |
| 0.0 | 0.8 | GO:0015347 | sodium-independent organic anion transmembrane transporter activity(GO:0015347) |
| 0.0 | 0.4 | GO:0051787 | misfolded protein binding(GO:0051787) |
| 0.0 | 2.0 | GO:0003727 | single-stranded RNA binding(GO:0003727) |
| 0.0 | 0.5 | GO:0008331 | high voltage-gated calcium channel activity(GO:0008331) |
| 0.0 | 0.3 | GO:0050321 | tau-protein kinase activity(GO:0050321) |
| 0.0 | 0.1 | GO:0016812 | hydrolase activity, acting on carbon-nitrogen (but not peptide) bonds, in cyclic amides(GO:0016812) |
| 0.0 | 4.7 | GO:0030246 | carbohydrate binding(GO:0030246) |
| 0.0 | 0.7 | GO:0005528 | macrolide binding(GO:0005527) FK506 binding(GO:0005528) |
| 0.0 | 0.1 | GO:0019912 | cyclin-dependent protein kinase activating kinase activity(GO:0019912) |
| 0.0 | 0.2 | GO:0015385 | sodium:proton antiporter activity(GO:0015385) potassium:proton antiporter activity(GO:0015386) |
| 0.0 | 2.4 | GO:0004222 | metalloendopeptidase activity(GO:0004222) |
| 0.0 | 3.8 | GO:0004866 | endopeptidase inhibitor activity(GO:0004866) |
| 0.0 | 0.4 | GO:0019864 | IgG binding(GO:0019864) |
| 0.0 | 0.1 | GO:0004828 | serine-tRNA ligase activity(GO:0004828) |
| 0.0 | 0.1 | GO:0005502 | 11-cis retinal binding(GO:0005502) |
| 0.0 | 0.4 | GO:0004033 | aldo-keto reductase (NADP) activity(GO:0004033) |
| 0.0 | 0.2 | GO:0017154 | semaphorin receptor activity(GO:0017154) |
| 0.0 | 2.6 | GO:0004721 | phosphoprotein phosphatase activity(GO:0004721) |
| 0.0 | 0.1 | GO:0030215 | semaphorin receptor binding(GO:0030215) |
Gene overrepresentation in C2:CP category:
| Log-likelihood per target | Total log-likelihood | Term | Description |
|---|---|---|---|
| 0.9 | 12.0 | ST TYPE I INTERFERON PATHWAY | Type I Interferon (alpha/beta IFN) Pathway |
| 0.8 | 24.6 | PID BETA CATENIN DEG PATHWAY | Degradation of beta catenin |
| 0.6 | 8.6 | PID IL5 PATHWAY | IL5-mediated signaling events |
| 0.6 | 7.7 | ST STAT3 PATHWAY | STAT3 Pathway |
| 0.6 | 29.4 | SIG CD40PATHWAYMAP | Genes related to CD40 signaling |
| 0.6 | 20.6 | PID NFKAPPAB CANONICAL PATHWAY | Canonical NF-kappaB pathway |
| 0.6 | 22.3 | PID INSULIN GLUCOSE PATHWAY | Insulin-mediated glucose transport |
| 0.6 | 30.9 | PID EPHRINB REV PATHWAY | Ephrin B reverse signaling |
| 0.5 | 41.0 | PID LKB1 PATHWAY | LKB1 signaling events |
| 0.5 | 10.7 | PID TCR JNK PATHWAY | JNK signaling in the CD4+ TCR pathway |
| 0.5 | 25.1 | PID TCR CALCIUM PATHWAY | Calcium signaling in the CD4+ TCR pathway |
| 0.5 | 38.9 | PID AR TF PATHWAY | Regulation of Androgen receptor activity |
| 0.4 | 10.9 | PID MTOR 4PATHWAY | mTOR signaling pathway |
| 0.4 | 10.5 | PID SMAD2 3PATHWAY | Regulation of cytoplasmic and nuclear SMAD2/3 signaling |
| 0.4 | 14.2 | PID IL8 CXCR2 PATHWAY | IL8- and CXCR2-mediated signaling events |
| 0.4 | 11.2 | ST GAQ PATHWAY | G alpha q Pathway |
| 0.3 | 8.1 | PID NFAT 3PATHWAY | Role of Calcineurin-dependent NFAT signaling in lymphocytes |
| 0.3 | 6.5 | PID PI3KCI AKT PATHWAY | Class I PI3K signaling events mediated by Akt |
| 0.3 | 13.8 | PID AMB2 NEUTROPHILS PATHWAY | amb2 Integrin signaling |
| 0.3 | 7.3 | PID EPO PATHWAY | EPO signaling pathway |
| 0.3 | 18.6 | PID FAK PATHWAY | Signaling events mediated by focal adhesion kinase |
| 0.3 | 4.3 | PID PI3KCI PATHWAY | Class I PI3K signaling events |
| 0.2 | 5.0 | PID IL2 STAT5 PATHWAY | IL2 signaling events mediated by STAT5 |
| 0.2 | 9.5 | PID ATM PATHWAY | ATM pathway |
| 0.2 | 9.5 | PID ARF6 PATHWAY | Arf6 signaling events |
| 0.2 | 0.4 | ST JAK STAT PATHWAY | Jak-STAT Pathway |
| 0.2 | 19.6 | PID AR PATHWAY | Coregulation of Androgen receptor activity |
| 0.2 | 6.1 | PID TCR PATHWAY | TCR signaling in naïve CD4+ T cells |
| 0.2 | 2.3 | PID IL2 1PATHWAY | IL2-mediated signaling events |
| 0.2 | 4.4 | PID P38 MKK3 6PATHWAY | p38 MAPK signaling pathway |
| 0.2 | 7.3 | PID RHOA PATHWAY | RhoA signaling pathway |
| 0.2 | 6.8 | PID MYC PATHWAY | C-MYC pathway |
| 0.2 | 8.6 | PID CDC42 PATHWAY | CDC42 signaling events |
| 0.2 | 6.6 | PID HIF2PATHWAY | HIF-2-alpha transcription factor network |
| 0.2 | 6.7 | PID PDGFRB PATHWAY | PDGFR-beta signaling pathway |
| 0.2 | 2.7 | PID ERB GENOMIC PATHWAY | Validated nuclear estrogen receptor beta network |
| 0.2 | 5.6 | PID FCER1 PATHWAY | Fc-epsilon receptor I signaling in mast cells |
| 0.2 | 5.6 | PID BETA CATENIN NUC PATHWAY | Regulation of nuclear beta catenin signaling and target gene transcription |
| 0.1 | 0.4 | PID CXCR3 PATHWAY | CXCR3-mediated signaling events |
| 0.1 | 32.7 | NABA ECM REGULATORS | Genes encoding enzymes and their regulators involved in the remodeling of the extracellular matrix |
| 0.1 | 2.3 | PID P38 MK2 PATHWAY | p38 signaling mediated by MAPKAP kinases |
| 0.1 | 2.2 | PID RB 1PATHWAY | Regulation of retinoblastoma protein |
| 0.1 | 2.1 | PID MAPK TRK PATHWAY | Trk receptor signaling mediated by the MAPK pathway |
| 0.1 | 1.6 | ST G ALPHA S PATHWAY | G alpha s Pathway |
| 0.1 | 1.9 | PID UPA UPAR PATHWAY | Urokinase-type plasminogen activator (uPA) and uPAR-mediated signaling |
| 0.1 | 6.5 | PID AVB3 INTEGRIN PATHWAY | Integrins in angiogenesis |
| 0.1 | 1.1 | PID HIF1A PATHWAY | Hypoxic and oxygen homeostasis regulation of HIF-1-alpha |
| 0.1 | 7.1 | PID CMYB PATHWAY | C-MYB transcription factor network |
| 0.1 | 2.1 | ST WNT CA2 CYCLIC GMP PATHWAY | Wnt/Ca2+/cyclic GMP signaling. |
| 0.1 | 3.3 | PID TNF PATHWAY | TNF receptor signaling pathway |
| 0.1 | 1.2 | PID ANTHRAX PATHWAY | Cellular roles of Anthrax toxin |
| 0.1 | 5.0 | PID HIF1 TFPATHWAY | HIF-1-alpha transcription factor network |
| 0.1 | 2.1 | PID INTEGRIN A4B1 PATHWAY | Alpha4 beta1 integrin signaling events |
| 0.1 | 2.0 | PID RAC1 PATHWAY | RAC1 signaling pathway |
| 0.1 | 3.3 | PID IL12 2PATHWAY | IL12-mediated signaling events |
| 0.1 | 1.4 | PID IL1 PATHWAY | IL1-mediated signaling events |
| 0.1 | 1.1 | PID LPA4 PATHWAY | LPA4-mediated signaling events |
| 0.1 | 2.1 | PID AURORA A PATHWAY | Aurora A signaling |
| 0.1 | 0.8 | ST DIFFERENTIATION PATHWAY IN PC12 CELLS | Differentiation Pathway in PC12 Cells; this is a specific case of PAC1 Receptor Pathway. |
| 0.1 | 2.3 | PID FGF PATHWAY | FGF signaling pathway |
| 0.1 | 1.2 | PID PRL SIGNALING EVENTS PATHWAY | Signaling events mediated by PRL |
| 0.1 | 1.8 | PID WNT SIGNALING PATHWAY | Wnt signaling network |
| 0.1 | 5.0 | PID MYC REPRESS PATHWAY | Validated targets of C-MYC transcriptional repression |
| 0.1 | 1.2 | PID FAS PATHWAY | FAS (CD95) signaling pathway |
| 0.1 | 1.5 | PID NCADHERIN PATHWAY | N-cadherin signaling events |
| 0.1 | 2.6 | PID ERBB4 PATHWAY | ErbB4 signaling events |
| 0.0 | 0.9 | PID ERBB1 INTERNALIZATION PATHWAY | Internalization of ErbB1 |
| 0.0 | 1.1 | SA MMP CYTOKINE CONNECTION | Cytokines can induce activation of matrix metalloproteinases, which degrade extracellular matrix. |
| 0.0 | 0.7 | PID TOLL ENDOGENOUS PATHWAY | Endogenous TLR signaling |
| 0.0 | 2.6 | WNT SIGNALING | Genes related to Wnt-mediated signal transduction |
| 0.0 | 1.6 | PID RAC1 REG PATHWAY | Regulation of RAC1 activity |
| 0.0 | 0.4 | PID ATF2 PATHWAY | ATF-2 transcription factor network |
| 0.0 | 0.6 | PID BARD1 PATHWAY | BARD1 signaling events |
| 0.0 | 0.6 | PID INSULIN PATHWAY | Insulin Pathway |
| 0.0 | 0.9 | PID CXCR4 PATHWAY | CXCR4-mediated signaling events |
| 0.0 | 0.7 | PID HDAC CLASSII PATHWAY | Signaling events mediated by HDAC Class II |
| 0.0 | 0.7 | PID RXR VDR PATHWAY | RXR and RAR heterodimerization with other nuclear receptor |
| 0.0 | 0.7 | PID FRA PATHWAY | Validated transcriptional targets of AP1 family members Fra1 and Fra2 |
| 0.0 | 3.0 | NABA ECM AFFILIATED | Genes encoding proteins affiliated structurally or functionally to extracellular matrix proteins |
| 0.0 | 1.6 | PID P53 DOWNSTREAM PATHWAY | Direct p53 effectors |
| 0.0 | 0.2 | PID HDAC CLASSIII PATHWAY | Signaling events mediated by HDAC Class III |
| 0.0 | 3.9 | NABA SECRETED FACTORS | Genes encoding secreted soluble factors |
| 0.0 | 0.4 | NABA BASEMENT MEMBRANES | Genes encoding structural components of basement membranes |
Gene overrepresentation in C2:CP:REACTOME category:
| Log-likelihood per target | Total log-likelihood | Term | Description |
|---|---|---|---|
| 4.6 | 23.1 | REACTOME BINDING AND ENTRY OF HIV VIRION | Genes involved in Binding and entry of HIV virion |
| 2.0 | 64.2 | REACTOME TRANSFERRIN ENDOCYTOSIS AND RECYCLING | Genes involved in Transferrin endocytosis and recycling |
| 1.6 | 28.0 | REACTOME REGULATION OF PYRUVATE DEHYDROGENASE PDH COMPLEX | Genes involved in Regulation of pyruvate dehydrogenase (PDH) complex |
| 1.5 | 27.2 | REACTOME KERATAN SULFATE DEGRADATION | Genes involved in Keratan sulfate degradation |
| 1.0 | 14.4 | REACTOME VITAMIN B5 PANTOTHENATE METABOLISM | Genes involved in Vitamin B5 (pantothenate) metabolism |
| 1.0 | 40.5 | REACTOME LYSOSOME VESICLE BIOGENESIS | Genes involved in Lysosome Vesicle Biogenesis |
| 1.0 | 3.9 | REACTOME ENDOSOMAL VACUOLAR PATHWAY | Genes involved in Endosomal/Vacuolar pathway |
| 0.8 | 9.7 | REACTOME G ALPHA Z SIGNALLING EVENTS | Genes involved in G alpha (z) signalling events |
| 0.8 | 20.5 | REACTOME PROTEOLYTIC CLEAVAGE OF SNARE COMPLEX PROTEINS | Genes involved in Proteolytic cleavage of SNARE complex proteins |
| 0.8 | 20.3 | REACTOME BRANCHED CHAIN AMINO ACID CATABOLISM | Genes involved in Branched-chain amino acid catabolism |
| 0.8 | 14.6 | REACTOME AKT PHOSPHORYLATES TARGETS IN THE CYTOSOL | Genes involved in AKT phosphorylates targets in the cytosol |
| 0.7 | 7.8 | REACTOME RECEPTOR LIGAND BINDING INITIATES THE SECOND PROTEOLYTIC CLEAVAGE OF NOTCH RECEPTOR | Genes involved in Receptor-ligand binding initiates the second proteolytic cleavage of Notch receptor |
| 0.7 | 14.2 | REACTOME RESOLUTION OF AP SITES VIA THE SINGLE NUCLEOTIDE REPLACEMENT PATHWAY | Genes involved in Resolution of AP sites via the single-nucleotide replacement pathway |
| 0.7 | 15.7 | REACTOME CITRIC ACID CYCLE TCA CYCLE | Genes involved in Citric acid cycle (TCA cycle) |
| 0.7 | 4.0 | REACTOME PLATELET SENSITIZATION BY LDL | Genes involved in Platelet sensitization by LDL |
| 0.7 | 7.2 | REACTOME PURINE CATABOLISM | Genes involved in Purine catabolism |
| 0.6 | 5.8 | REACTOME REGULATION OF THE FANCONI ANEMIA PATHWAY | Genes involved in Regulation of the Fanconi anemia pathway |
| 0.6 | 24.2 | REACTOME GLYCOSPHINGOLIPID METABOLISM | Genes involved in Glycosphingolipid metabolism |
| 0.6 | 16.4 | REACTOME SIGNALING BY HIPPO | Genes involved in Signaling by Hippo |
| 0.6 | 1.7 | REACTOME DOPAMINE NEUROTRANSMITTER RELEASE CYCLE | Genes involved in Dopamine Neurotransmitter Release Cycle |
| 0.6 | 12.3 | REACTOME INSULIN SYNTHESIS AND PROCESSING | Genes involved in Insulin Synthesis and Processing |
| 0.5 | 28.3 | REACTOME BMAL1 CLOCK NPAS2 ACTIVATES CIRCADIAN EXPRESSION | Genes involved in BMAL1:CLOCK/NPAS2 Activates Circadian Expression |
| 0.5 | 95.6 | REACTOME SIGNALING BY RHO GTPASES | Genes involved in Signaling by Rho GTPases |
| 0.5 | 8.7 | REACTOME CTNNB1 PHOSPHORYLATION CASCADE | Genes involved in Beta-catenin phosphorylation cascade |
| 0.5 | 9.3 | REACTOME ALPHA LINOLENIC ACID ALA METABOLISM | Genes involved in alpha-linolenic acid (ALA) metabolism |
| 0.5 | 9.3 | REACTOME ACTIVATION OF THE AP1 FAMILY OF TRANSCRIPTION FACTORS | Genes involved in Activation of the AP-1 family of transcription factors |
| 0.5 | 3.2 | REACTOME IL 6 SIGNALING | Genes involved in Interleukin-6 signaling |
| 0.4 | 16.3 | REACTOME SIGNALING BY FGFR1 FUSION MUTANTS | Genes involved in Signaling by FGFR1 fusion mutants |
| 0.4 | 36.8 | REACTOME INTERFERON ALPHA BETA SIGNALING | Genes involved in Interferon alpha/beta signaling |
| 0.4 | 4.6 | REACTOME NFKB IS ACTIVATED AND SIGNALS SURVIVAL | Genes involved in NF-kB is activated and signals survival |
| 0.4 | 4.6 | REACTOME REGULATORY RNA PATHWAYS | Genes involved in Regulatory RNA pathways |
| 0.4 | 20.6 | REACTOME GLYCOLYSIS | Genes involved in Glycolysis |
| 0.4 | 18.7 | REACTOME NEGATIVE REGULATORS OF RIG I MDA5 SIGNALING | Genes involved in Negative regulators of RIG-I/MDA5 signaling |
| 0.4 | 12.8 | REACTOME PKA MEDIATED PHOSPHORYLATION OF CREB | Genes involved in PKA-mediated phosphorylation of CREB |
| 0.4 | 6.2 | REACTOME REGULATION OF RHEB GTPASE ACTIVITY BY AMPK | Genes involved in Regulation of Rheb GTPase activity by AMPK |
| 0.4 | 6.5 | REACTOME SYNTHESIS OF PIPS AT THE GOLGI MEMBRANE | Genes involved in Synthesis of PIPs at the Golgi membrane |
| 0.3 | 7.3 | REACTOME INITIAL TRIGGERING OF COMPLEMENT | Genes involved in Initial triggering of complement |
| 0.3 | 7.1 | REACTOME TETRAHYDROBIOPTERIN BH4 SYNTHESIS RECYCLING SALVAGE AND REGULATION | Genes involved in Tetrahydrobiopterin (BH4) synthesis, recycling, salvage and regulation |
| 0.3 | 5.0 | REACTOME MEIOSIS | Genes involved in Meiosis |
| 0.3 | 5.9 | REACTOME IONOTROPIC ACTIVITY OF KAINATE RECEPTORS | Genes involved in Ionotropic activity of Kainate Receptors |
| 0.3 | 17.6 | REACTOME METABOLISM OF VITAMINS AND COFACTORS | Genes involved in Metabolism of vitamins and cofactors |
| 0.3 | 3.7 | REACTOME GLUTAMATE NEUROTRANSMITTER RELEASE CYCLE | Genes involved in Glutamate Neurotransmitter Release Cycle |
| 0.3 | 1.5 | REACTOME ABORTIVE ELONGATION OF HIV1 TRANSCRIPT IN THE ABSENCE OF TAT | Genes involved in Abortive elongation of HIV-1 transcript in the absence of Tat |
| 0.2 | 13.2 | REACTOME GENERATION OF SECOND MESSENGER MOLECULES | Genes involved in Generation of second messenger molecules |
| 0.2 | 4.7 | REACTOME TERMINATION OF O GLYCAN BIOSYNTHESIS | Genes involved in Termination of O-glycan biosynthesis |
| 0.2 | 6.4 | REACTOME GABA SYNTHESIS RELEASE REUPTAKE AND DEGRADATION | Genes involved in GABA synthesis, release, reuptake and degradation |
| 0.2 | 5.8 | REACTOME PURINE SALVAGE | Genes involved in Purine salvage |
| 0.2 | 3.7 | REACTOME IRON UPTAKE AND TRANSPORT | Genes involved in Iron uptake and transport |
| 0.2 | 5.3 | REACTOME DARPP 32 EVENTS | Genes involved in DARPP-32 events |
| 0.2 | 49.8 | REACTOME G ALPHA I SIGNALLING EVENTS | Genes involved in G alpha (i) signalling events |
| 0.2 | 2.0 | REACTOME NFKB ACTIVATION THROUGH FADD RIP1 PATHWAY MEDIATED BY CASPASE 8 AND10 | Genes involved in NF-kB activation through FADD/RIP-1 pathway mediated by caspase-8 and -10 |
| 0.2 | 9.5 | REACTOME TRIGLYCERIDE BIOSYNTHESIS | Genes involved in Triglyceride Biosynthesis |
| 0.2 | 1.7 | REACTOME COPI MEDIATED TRANSPORT | Genes involved in COPI Mediated Transport |
| 0.2 | 4.5 | REACTOME ACYL CHAIN REMODELLING OF PE | Genes involved in Acyl chain remodelling of PE |
| 0.2 | 5.0 | REACTOME PTM GAMMA CARBOXYLATION HYPUSINE FORMATION AND ARYLSULFATASE ACTIVATION | Genes involved in PTM: gamma carboxylation, hypusine formation and arylsulfatase activation |
| 0.2 | 3.5 | REACTOME CYTOSOLIC SULFONATION OF SMALL MOLECULES | Genes involved in Cytosolic sulfonation of small molecules |
| 0.2 | 1.7 | REACTOME SEMA3A PAK DEPENDENT AXON REPULSION | Genes involved in Sema3A PAK dependent Axon repulsion |
| 0.2 | 0.9 | REACTOME PHOSPHORYLATION OF CD3 AND TCR ZETA CHAINS | Genes involved in Phosphorylation of CD3 and TCR zeta chains |
| 0.2 | 3.8 | REACTOME TRANSPORT OF ORGANIC ANIONS | Genes involved in Transport of organic anions |
| 0.2 | 6.5 | REACTOME RAP1 SIGNALLING | Genes involved in Rap1 signalling |
| 0.2 | 5.3 | REACTOME ACTIVATION OF GENES BY ATF4 | Genes involved in Activation of Genes by ATF4 |
| 0.2 | 15.4 | REACTOME PEPTIDE LIGAND BINDING RECEPTORS | Genes involved in Peptide ligand-binding receptors |
| 0.2 | 2.6 | REACTOME REVERSIBLE HYDRATION OF CARBON DIOXIDE | Genes involved in Reversible Hydration of Carbon Dioxide |
| 0.2 | 6.7 | REACTOME SULFUR AMINO ACID METABOLISM | Genes involved in Sulfur amino acid metabolism |
| 0.2 | 8.1 | REACTOME ION TRANSPORT BY P TYPE ATPASES | Genes involved in Ion transport by P-type ATPases |
| 0.2 | 3.0 | REACTOME HIGHLY CALCIUM PERMEABLE POSTSYNAPTIC NICOTINIC ACETYLCHOLINE RECEPTORS | Genes involved in Highly calcium permeable postsynaptic nicotinic acetylcholine receptors |
| 0.2 | 3.8 | REACTOME THE ROLE OF NEF IN HIV1 REPLICATION AND DISEASE PATHOGENESIS | Genes involved in The role of Nef in HIV-1 replication and disease pathogenesis |
| 0.2 | 6.0 | REACTOME AMINO ACID TRANSPORT ACROSS THE PLASMA MEMBRANE | Genes involved in Amino acid transport across the plasma membrane |
| 0.2 | 10.6 | REACTOME GLYCEROPHOSPHOLIPID BIOSYNTHESIS | Genes involved in Glycerophospholipid biosynthesis |
| 0.2 | 2.3 | REACTOME SYNTHESIS SECRETION AND DEACYLATION OF GHRELIN | Genes involved in Synthesis, Secretion, and Deacylation of Ghrelin |
| 0.2 | 6.9 | REACTOME MRNA 3 END PROCESSING | Genes involved in mRNA 3'-end processing |
| 0.1 | 2.8 | REACTOME PRE NOTCH PROCESSING IN GOLGI | Genes involved in Pre-NOTCH Processing in Golgi |
| 0.1 | 2.3 | REACTOME FGFR2C LIGAND BINDING AND ACTIVATION | Genes involved in FGFR2c ligand binding and activation |
| 0.1 | 8.9 | REACTOME ACTIVATION OF CHAPERONE GENES BY XBP1S | Genes involved in Activation of Chaperone Genes by XBP1(S) |
| 0.1 | 2.3 | REACTOME ACTIVATED TAK1 MEDIATES P38 MAPK ACTIVATION | Genes involved in activated TAK1 mediates p38 MAPK activation |
| 0.1 | 3.3 | REACTOME CRMPS IN SEMA3A SIGNALING | Genes involved in CRMPs in Sema3A signaling |
| 0.1 | 10.2 | REACTOME VIF MEDIATED DEGRADATION OF APOBEC3G | Genes involved in Vif-mediated degradation of APOBEC3G |
| 0.1 | 6.7 | REACTOME MRNA SPLICING MINOR PATHWAY | Genes involved in mRNA Splicing - Minor Pathway |
| 0.1 | 3.0 | REACTOME AMINE LIGAND BINDING RECEPTORS | Genes involved in Amine ligand-binding receptors |
| 0.1 | 12.6 | REACTOME MHC CLASS II ANTIGEN PRESENTATION | Genes involved in MHC class II antigen presentation |
| 0.1 | 6.1 | REACTOME VOLTAGE GATED POTASSIUM CHANNELS | Genes involved in Voltage gated Potassium channels |
| 0.1 | 2.3 | REACTOME GROWTH HORMONE RECEPTOR SIGNALING | Genes involved in Growth hormone receptor signaling |
| 0.1 | 2.5 | REACTOME ENDOSOMAL SORTING COMPLEX REQUIRED FOR TRANSPORT ESCRT | Genes involved in Endosomal Sorting Complex Required For Transport (ESCRT) |
| 0.1 | 1.1 | REACTOME SIGNAL ATTENUATION | Genes involved in Signal attenuation |
| 0.1 | 2.0 | REACTOME GPVI MEDIATED ACTIVATION CASCADE | Genes involved in GPVI-mediated activation cascade |
| 0.1 | 2.1 | REACTOME ABCA TRANSPORTERS IN LIPID HOMEOSTASIS | Genes involved in ABCA transporters in lipid homeostasis |
| 0.1 | 2.8 | REACTOME IL RECEPTOR SHC SIGNALING | Genes involved in Interleukin receptor SHC signaling |
| 0.1 | 0.7 | REACTOME ACTIVATION OF IRF3 IRF7 MEDIATED BY TBK1 IKK EPSILON | Genes involved in Activation of IRF3/IRF7 mediated by TBK1/IKK epsilon |
| 0.1 | 2.3 | REACTOME REGULATION OF GENE EXPRESSION IN BETA CELLS | Genes involved in Regulation of gene expression in beta cells |
| 0.1 | 1.1 | REACTOME TELOMERE MAINTENANCE | Genes involved in Telomere Maintenance |
| 0.1 | 1.6 | REACTOME PIP3 ACTIVATES AKT SIGNALING | Genes involved in PIP3 activates AKT signaling |
| 0.1 | 3.0 | REACTOME CGMP EFFECTS | Genes involved in cGMP effects |
| 0.1 | 1.5 | REACTOME ABC FAMILY PROTEINS MEDIATED TRANSPORT | Genes involved in ABC-family proteins mediated transport |
| 0.1 | 2.8 | REACTOME IL1 SIGNALING | Genes involved in Interleukin-1 signaling |
| 0.1 | 0.9 | REACTOME P2Y RECEPTORS | Genes involved in P2Y receptors |
| 0.1 | 0.3 | REACTOME G PROTEIN BETA GAMMA SIGNALLING | Genes involved in G-protein beta:gamma signalling |
| 0.1 | 2.9 | REACTOME INTEGRATION OF ENERGY METABOLISM | Genes involved in Integration of energy metabolism |
| 0.1 | 1.1 | REACTOME AMINE COMPOUND SLC TRANSPORTERS | Genes involved in Amine compound SLC transporters |
| 0.1 | 0.4 | REACTOME RAS ACTIVATION UOPN CA2 INFUX THROUGH NMDA RECEPTOR | Genes involved in Ras activation uopn Ca2+ infux through NMDA receptor |
| 0.1 | 1.8 | REACTOME SPHINGOLIPID DE NOVO BIOSYNTHESIS | Genes involved in Sphingolipid de novo biosynthesis |
| 0.1 | 3.9 | REACTOME IMMUNOREGULATORY INTERACTIONS BETWEEN A LYMPHOID AND A NON LYMPHOID CELL | Genes involved in Immunoregulatory interactions between a Lymphoid and a non-Lymphoid cell |
| 0.1 | 1.1 | REACTOME ADVANCED GLYCOSYLATION ENDPRODUCT RECEPTOR SIGNALING | Genes involved in Advanced glycosylation endproduct receptor signaling |
| 0.0 | 2.0 | REACTOME INTERFERON GAMMA SIGNALING | Genes involved in Interferon gamma signaling |
| 0.0 | 3.3 | REACTOME NUCLEAR RECEPTOR TRANSCRIPTION PATHWAY | Genes involved in Nuclear Receptor transcription pathway |
| 0.0 | 1.0 | REACTOME AMINE DERIVED HORMONES | Genes involved in Amine-derived hormones |
| 0.0 | 0.5 | REACTOME NITRIC OXIDE STIMULATES GUANYLATE CYCLASE | Genes involved in Nitric oxide stimulates guanylate cyclase |
| 0.0 | 0.4 | REACTOME ELONGATION ARREST AND RECOVERY | Genes involved in Elongation arrest and recovery |
| 0.0 | 0.5 | REACTOME AMINO ACID AND OLIGOPEPTIDE SLC TRANSPORTERS | Genes involved in Amino acid and oligopeptide SLC transporters |
| 0.0 | 0.3 | REACTOME CHONDROITIN SULFATE BIOSYNTHESIS | Genes involved in Chondroitin sulfate biosynthesis |
| 0.0 | 0.4 | REACTOME CIRCADIAN CLOCK | Genes involved in Circadian Clock |
| 0.0 | 1.7 | REACTOME FORMATION OF THE TERNARY COMPLEX AND SUBSEQUENTLY THE 43S COMPLEX | Genes involved in Formation of the ternary complex, and subsequently, the 43S complex |
| 0.0 | 0.3 | REACTOME HDL MEDIATED LIPID TRANSPORT | Genes involved in HDL-mediated lipid transport |
| 0.0 | 0.5 | REACTOME GOLGI ASSOCIATED VESICLE BIOGENESIS | Genes involved in Golgi Associated Vesicle Biogenesis |
| 0.0 | 0.2 | REACTOME TRANSLATION | Genes involved in Translation |
| 0.0 | 1.0 | REACTOME FACTORS INVOLVED IN MEGAKARYOCYTE DEVELOPMENT AND PLATELET PRODUCTION | Genes involved in Factors involved in megakaryocyte development and platelet production |