Project
GNF SymAtlas + NCI-60 cancer cell lines, comparison of cancers vs non-cancers, human (Su, 2004; Ross, 2000)
Navigation
Downloads
Results for MYF6
Z-value: 0.01
Motif logo

Transcription factors associated with MYF6
| Gene Symbol | Gene ID | Gene Info |
|---|---|---|
|
MYF6
|
ENSG00000111046.3 | myogenic factor 6 |
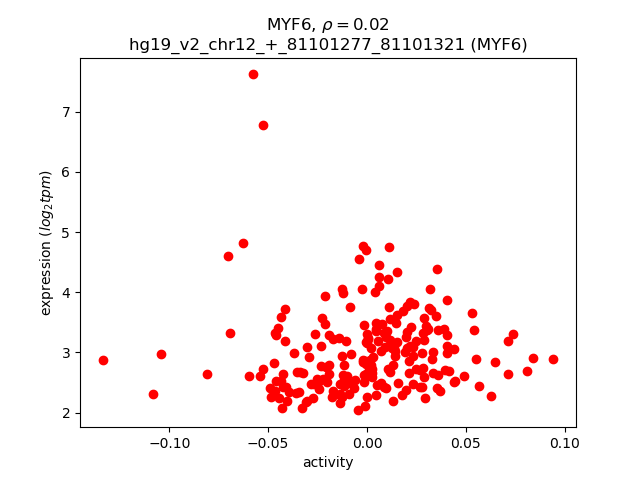
Activity-expression correlation:
| Gene | Promoter | Pearson corr. coef. | P-value | Plot |
|---|---|---|---|---|
| MYF6 | hg19_v2_chr12_+_81101277_81101321 | 0.02 | 7.4e-01 | Click! |
Activity profile of MYF6 motif
Sorted Z-values of MYF6 motif
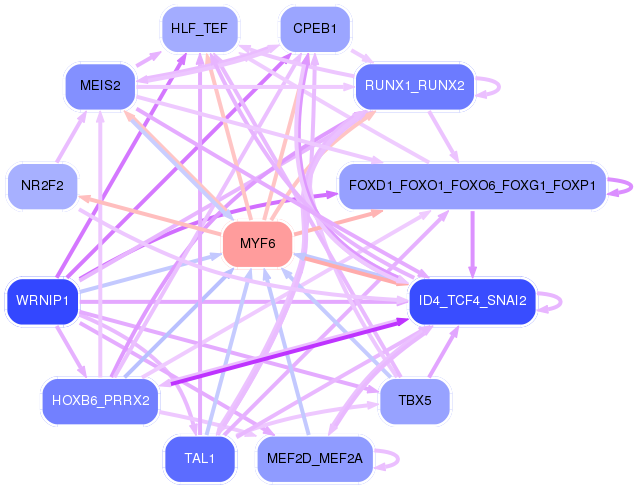
Network of associatons between targets according to the STRING database.

First level regulatory network of MYF6
Gene Ontology Analysis
Gene overrepresentation in biological_process category:
| Log-likelihood per target | Total log-likelihood | Term | Description |
|---|---|---|---|
| 5.6 | 16.8 | GO:1904395 | retinal rod cell differentiation(GO:0060221) positive regulation of skeletal muscle acetylcholine-gated channel clustering(GO:1904395) |
| 4.5 | 13.6 | GO:0033693 | neurofilament bundle assembly(GO:0033693) |
| 4.1 | 12.4 | GO:0098746 | fast, calcium ion-dependent exocytosis of neurotransmitter(GO:0098746) |
| 3.9 | 11.7 | GO:0097212 | cadmium ion homeostasis(GO:0055073) lysosomal membrane organization(GO:0097212) negative regulation of hydrogen peroxide catabolic process(GO:2000296) regulation of oxygen metabolic process(GO:2000374) |
| 3.2 | 12.9 | GO:1902460 | regulation of mesenchymal stem cell proliferation(GO:1902460) positive regulation of mesenchymal stem cell proliferation(GO:1902462) |
| 2.8 | 25.5 | GO:0071787 | endoplasmic reticulum tubular network assembly(GO:0071787) |
| 2.8 | 36.2 | GO:2000680 | rubidium ion transport(GO:0035826) regulation of rubidium ion transport(GO:2000680) |
| 2.8 | 8.3 | GO:0046947 | hydroxylysine metabolic process(GO:0046946) hydroxylysine biosynthetic process(GO:0046947) |
| 2.7 | 8.2 | GO:0021966 | corticospinal neuron axon guidance(GO:0021966) |
| 2.7 | 8.1 | GO:0045210 | FasL biosynthetic process(GO:0045210) |
| 2.6 | 7.8 | GO:0021577 | hindbrain structural organization(GO:0021577) cerebellum structural organization(GO:0021589) |
| 2.4 | 7.3 | GO:0002894 | positive regulation of type IIa hypersensitivity(GO:0001798) positive regulation of type II hypersensitivity(GO:0002894) |
| 2.4 | 7.1 | GO:0052047 | interaction with other organism via secreted substance involved in symbiotic interaction(GO:0052047) |
| 2.2 | 6.5 | GO:0017186 | peptidyl-pyroglutamic acid biosynthetic process, using glutaminyl-peptide cyclotransferase(GO:0017186) |
| 2.1 | 8.5 | GO:0009956 | radial pattern formation(GO:0009956) |
| 2.0 | 8.1 | GO:0044861 | protein transport into plasma membrane raft(GO:0044861) positive regulation of potassium ion import(GO:1903288) |
| 2.0 | 10.0 | GO:0090258 | negative regulation of mitochondrial fission(GO:0090258) |
| 1.9 | 5.6 | GO:0042264 | peptidyl-aspartic acid hydroxylation(GO:0042264) |
| 1.8 | 1.8 | GO:0090076 | relaxation of skeletal muscle(GO:0090076) |
| 1.8 | 10.8 | GO:0042866 | pyruvate biosynthetic process(GO:0042866) |
| 1.7 | 5.1 | GO:1990502 | dense core granule maturation(GO:1990502) |
| 1.6 | 4.8 | GO:1903697 | negative regulation of microvillus assembly(GO:1903697) |
| 1.6 | 12.6 | GO:0001845 | phagolysosome assembly(GO:0001845) |
| 1.6 | 4.7 | GO:1905205 | positive regulation of connective tissue replacement(GO:1905205) |
| 1.5 | 4.6 | GO:0015920 | lipopolysaccharide transport(GO:0015920) |
| 1.5 | 7.5 | GO:0016476 | regulation of embryonic cell shape(GO:0016476) |
| 1.5 | 3.0 | GO:0071260 | cellular response to mechanical stimulus(GO:0071260) |
| 1.4 | 25.1 | GO:0007021 | tubulin complex assembly(GO:0007021) |
| 1.4 | 5.5 | GO:0002317 | plasma cell differentiation(GO:0002317) |
| 1.3 | 7.8 | GO:1902847 | macrophage proliferation(GO:0061517) microglial cell proliferation(GO:0061518) regulation of neuronal signal transduction(GO:1902847) positive regulation of neurofibrillary tangle assembly(GO:1902998) |
| 1.3 | 8.9 | GO:0016127 | cholesterol catabolic process(GO:0006707) sterol catabolic process(GO:0016127) |
| 1.3 | 13.8 | GO:0001886 | endothelial cell morphogenesis(GO:0001886) |
| 1.2 | 5.0 | GO:0071492 | cellular response to UV-A(GO:0071492) |
| 1.2 | 10.6 | GO:0061302 | smooth muscle cell-matrix adhesion(GO:0061302) |
| 1.2 | 4.6 | GO:0008628 | hormone-mediated apoptotic signaling pathway(GO:0008628) |
| 1.1 | 6.8 | GO:1902766 | skeletal muscle satellite cell migration(GO:1902766) |
| 1.1 | 7.8 | GO:0021999 | neural plate anterior/posterior regionalization(GO:0021999) |
| 1.1 | 12.2 | GO:0030322 | stabilization of membrane potential(GO:0030322) |
| 1.0 | 3.1 | GO:0090341 | negative regulation of secretion of lysosomal enzymes(GO:0090341) |
| 1.0 | 4.1 | GO:0042271 | susceptibility to natural killer cell mediated cytotoxicity(GO:0042271) |
| 1.0 | 3.1 | GO:0006597 | spermine biosynthetic process(GO:0006597) |
| 1.0 | 9.2 | GO:0042659 | regulation of cell fate specification(GO:0042659) |
| 1.0 | 4.1 | GO:1905123 | regulation of endosome organization(GO:1904978) regulation of glucosylceramidase activity(GO:1905123) |
| 1.0 | 5.0 | GO:2000035 | regulation of stem cell division(GO:2000035) |
| 1.0 | 7.9 | GO:0007258 | JUN phosphorylation(GO:0007258) |
| 1.0 | 11.8 | GO:0002091 | negative regulation of receptor internalization(GO:0002091) |
| 1.0 | 67.7 | GO:2000649 | regulation of sodium ion transmembrane transporter activity(GO:2000649) |
| 0.9 | 0.9 | GO:1903526 | negative regulation of membrane tubulation(GO:1903526) |
| 0.9 | 3.8 | GO:0031443 | fast-twitch skeletal muscle fiber contraction(GO:0031443) |
| 0.9 | 3.5 | GO:2000542 | regulation of endodermal cell differentiation(GO:1903224) negative regulation of gastrulation(GO:2000542) |
| 0.8 | 2.5 | GO:1905167 | positive regulation of lysosomal protein catabolic process(GO:1905167) |
| 0.8 | 9.7 | GO:0022417 | protein maturation by protein folding(GO:0022417) |
| 0.8 | 2.4 | GO:0060447 | bud outgrowth involved in lung branching(GO:0060447) |
| 0.8 | 4.8 | GO:2000324 | positive regulation of glucocorticoid receptor signaling pathway(GO:2000324) |
| 0.8 | 2.4 | GO:0061110 | dense core granule biogenesis(GO:0061110) regulation of dense core granule biogenesis(GO:2000705) |
| 0.8 | 3.2 | GO:1900042 | positive regulation of interleukin-2 secretion(GO:1900042) |
| 0.8 | 8.7 | GO:0021942 | radial glia guided migration of Purkinje cell(GO:0021942) |
| 0.8 | 1.6 | GO:2000182 | regulation of progesterone biosynthetic process(GO:2000182) |
| 0.8 | 24.3 | GO:0090383 | phagosome acidification(GO:0090383) |
| 0.8 | 1.5 | GO:0070935 | 3'-UTR-mediated mRNA stabilization(GO:0070935) |
| 0.8 | 3.8 | GO:0032383 | regulation of intracellular lipid transport(GO:0032377) regulation of intracellular sterol transport(GO:0032380) regulation of intracellular cholesterol transport(GO:0032383) |
| 0.7 | 3.0 | GO:0000103 | sulfate assimilation(GO:0000103) |
| 0.7 | 2.2 | GO:0032596 | protein transport within lipid bilayer(GO:0032594) protein transport into membrane raft(GO:0032596) |
| 0.7 | 2.2 | GO:0007518 | myoblast fate determination(GO:0007518) |
| 0.7 | 5.1 | GO:0015693 | magnesium ion transport(GO:0015693) |
| 0.7 | 2.2 | GO:0002589 | regulation of antigen processing and presentation of peptide antigen via MHC class I(GO:0002589) negative regulation of antigen processing and presentation of peptide antigen via MHC class I(GO:0002590) regulation of T cell antigen processing and presentation(GO:0002625) positive regulation of iron ion transport(GO:0034758) positive regulation of iron ion transmembrane transport(GO:0034761) regulation of iron ion import(GO:1900390) regulation of ferrous iron import into cell(GO:1903989) positive regulation of ferrous iron import into cell(GO:1903991) regulation of ferrous iron binding(GO:1904432) positive regulation of ferrous iron binding(GO:1904434) regulation of transferrin receptor binding(GO:1904435) positive regulation of transferrin receptor binding(GO:1904437) regulation of ferrous iron import across plasma membrane(GO:1904438) positive regulation of ferrous iron import across plasma membrane(GO:1904440) response to iron ion starvation(GO:1990641) |
| 0.7 | 5.0 | GO:0003096 | renal sodium ion transport(GO:0003096) renal sodium ion absorption(GO:0070294) |
| 0.7 | 6.9 | GO:0006685 | sphingomyelin catabolic process(GO:0006685) |
| 0.7 | 2.8 | GO:0019470 | 4-hydroxyproline catabolic process(GO:0019470) |
| 0.7 | 2.1 | GO:1990168 | protein K33-linked deubiquitination(GO:1990168) |
| 0.7 | 6.8 | GO:0032000 | positive regulation of fatty acid beta-oxidation(GO:0032000) |
| 0.7 | 4.7 | GO:0048105 | establishment of body hair or bristle planar orientation(GO:0048104) establishment of body hair planar orientation(GO:0048105) |
| 0.7 | 2.0 | GO:0019072 | viral genome packaging(GO:0019072) viral RNA genome packaging(GO:0019074) |
| 0.6 | 2.5 | GO:0038195 | urokinase plasminogen activator signaling pathway(GO:0038195) |
| 0.6 | 6.2 | GO:0031580 | membrane raft polarization(GO:0001766) membrane raft distribution(GO:0031580) |
| 0.6 | 11.0 | GO:0030388 | fructose 1,6-bisphosphate metabolic process(GO:0030388) |
| 0.6 | 1.7 | GO:0000271 | polysaccharide biosynthetic process(GO:0000271) |
| 0.6 | 1.7 | GO:0060535 | trachea cartilage morphogenesis(GO:0060535) |
| 0.6 | 1.7 | GO:0033159 | negative regulation of protein import into nucleus, translocation(GO:0033159) renal protein absorption(GO:0097017) renal albumin absorption(GO:0097018) oligodendrocyte apoptotic process(GO:0097252) regulation of renal albumin absorption(GO:2000532) |
| 0.5 | 10.9 | GO:0034315 | regulation of Arp2/3 complex-mediated actin nucleation(GO:0034315) |
| 0.5 | 4.3 | GO:0048733 | sebaceous gland development(GO:0048733) |
| 0.5 | 1.6 | GO:1902309 | negative regulation of peptidyl-serine dephosphorylation(GO:1902309) |
| 0.5 | 2.1 | GO:0019087 | transformation of host cell by virus(GO:0019087) |
| 0.5 | 6.7 | GO:0060137 | maternal process involved in parturition(GO:0060137) |
| 0.5 | 1.5 | GO:0046521 | sphingoid catabolic process(GO:0046521) |
| 0.5 | 10.1 | GO:0070262 | peptidyl-serine dephosphorylation(GO:0070262) |
| 0.5 | 5.9 | GO:0034356 | NAD biosynthesis via nicotinamide riboside salvage pathway(GO:0034356) |
| 0.5 | 4.8 | GO:0045915 | positive regulation of catecholamine metabolic process(GO:0045915) positive regulation of dopamine metabolic process(GO:0045964) |
| 0.5 | 5.3 | GO:0001514 | selenocysteine incorporation(GO:0001514) translational readthrough(GO:0006451) |
| 0.5 | 4.3 | GO:0034465 | response to carbon monoxide(GO:0034465) |
| 0.5 | 2.8 | GO:1904879 | positive regulation of calcium ion transmembrane transport via high voltage-gated calcium channel(GO:1904879) |
| 0.5 | 3.6 | GO:0006689 | ganglioside catabolic process(GO:0006689) |
| 0.4 | 2.6 | GO:0042701 | progesterone secretion(GO:0042701) |
| 0.4 | 1.7 | GO:0061762 | CAMKK-AMPK signaling cascade(GO:0061762) |
| 0.4 | 3.0 | GO:0040032 | post-embryonic body morphogenesis(GO:0040032) regulation of parathyroid hormone secretion(GO:2000828) |
| 0.4 | 4.5 | GO:0035721 | intraciliary retrograde transport(GO:0035721) positive regulation of microtubule motor activity(GO:2000576) regulation of ATP-dependent microtubule motor activity, plus-end-directed(GO:2000580) positive regulation of ATP-dependent microtubule motor activity, plus-end-directed(GO:2000582) |
| 0.4 | 7.0 | GO:0090129 | positive regulation of synapse maturation(GO:0090129) |
| 0.4 | 3.7 | GO:0032224 | positive regulation of synaptic transmission, cholinergic(GO:0032224) |
| 0.4 | 2.4 | GO:2000676 | positive regulation of type B pancreatic cell apoptotic process(GO:2000676) |
| 0.4 | 1.2 | GO:0071409 | cellular response to cycloheximide(GO:0071409) |
| 0.4 | 0.8 | GO:0043449 | cellular alkene metabolic process(GO:0043449) |
| 0.4 | 3.6 | GO:0016080 | synaptic vesicle targeting(GO:0016080) |
| 0.4 | 2.0 | GO:0050668 | cellular response to phosphate starvation(GO:0016036) positive regulation of sulfur amino acid metabolic process(GO:0031337) positive regulation of homocysteine metabolic process(GO:0050668) |
| 0.4 | 2.8 | GO:2001137 | positive regulation of endocytic recycling(GO:2001137) |
| 0.4 | 2.7 | GO:0006537 | glutamate biosynthetic process(GO:0006537) |
| 0.4 | 0.8 | GO:0002232 | leukocyte chemotaxis involved in inflammatory response(GO:0002232) |
| 0.4 | 0.8 | GO:0060586 | multicellular organismal iron ion homeostasis(GO:0060586) |
| 0.4 | 10.0 | GO:0034755 | iron ion transmembrane transport(GO:0034755) |
| 0.4 | 1.2 | GO:1900107 | regulation of nodal signaling pathway(GO:1900107) |
| 0.4 | 3.0 | GO:0002051 | osteoblast fate commitment(GO:0002051) |
| 0.4 | 2.6 | GO:0032472 | Golgi calcium ion transport(GO:0032472) |
| 0.4 | 6.3 | GO:0070208 | protein heterotrimerization(GO:0070208) |
| 0.4 | 3.7 | GO:0000712 | resolution of meiotic recombination intermediates(GO:0000712) |
| 0.4 | 1.8 | GO:0035105 | sterol regulatory element binding protein import into nucleus(GO:0035105) |
| 0.4 | 1.5 | GO:1900738 | psychomotor behavior(GO:0036343) positive regulation of phospholipase C-activating G-protein coupled receptor signaling pathway(GO:1900738) |
| 0.4 | 5.3 | GO:1900364 | negative regulation of mRNA polyadenylation(GO:1900364) |
| 0.4 | 2.8 | GO:0035754 | B cell chemotaxis(GO:0035754) |
| 0.3 | 2.8 | GO:2000766 | negative regulation of cytoplasmic translation(GO:2000766) |
| 0.3 | 1.7 | GO:1990034 | calcium ion export from cell(GO:1990034) |
| 0.3 | 0.7 | GO:0035880 | embryonic nail plate morphogenesis(GO:0035880) |
| 0.3 | 5.8 | GO:0007158 | neuron cell-cell adhesion(GO:0007158) |
| 0.3 | 1.0 | GO:0002184 | cytoplasmic translational termination(GO:0002184) |
| 0.3 | 5.4 | GO:0032836 | glomerular basement membrane development(GO:0032836) |
| 0.3 | 0.7 | GO:0009608 | response to symbiont(GO:0009608) response to symbiotic bacterium(GO:0009609) |
| 0.3 | 1.7 | GO:1902268 | negative regulation of polyamine transmembrane transport(GO:1902268) |
| 0.3 | 1.3 | GO:0006432 | phenylalanyl-tRNA aminoacylation(GO:0006432) |
| 0.3 | 2.9 | GO:1904715 | negative regulation of chaperone-mediated autophagy(GO:1904715) |
| 0.3 | 2.0 | GO:0055064 | chloride ion homeostasis(GO:0055064) |
| 0.3 | 2.3 | GO:0061469 | regulation of type B pancreatic cell proliferation(GO:0061469) |
| 0.3 | 6.4 | GO:0071420 | cellular response to histamine(GO:0071420) |
| 0.3 | 4.4 | GO:0016081 | synaptic vesicle docking(GO:0016081) |
| 0.3 | 3.1 | GO:0060666 | dichotomous subdivision of terminal units involved in salivary gland branching(GO:0060666) |
| 0.3 | 5.7 | GO:0035493 | SNARE complex assembly(GO:0035493) |
| 0.3 | 3.0 | GO:0042373 | vitamin K metabolic process(GO:0042373) |
| 0.3 | 1.2 | GO:0021539 | subthalamus development(GO:0021539) |
| 0.3 | 5.3 | GO:0001921 | positive regulation of receptor recycling(GO:0001921) |
| 0.3 | 2.1 | GO:0010756 | positive regulation of plasminogen activation(GO:0010756) |
| 0.3 | 0.8 | GO:1903423 | positive regulation of synaptic vesicle endocytosis(GO:1900244) positive regulation of synaptic vesicle transport(GO:1902805) positive regulation of synaptic vesicle recycling(GO:1903423) |
| 0.3 | 1.4 | GO:0070829 | response to vitamin B2(GO:0033274) heterochromatin maintenance(GO:0070829) |
| 0.3 | 0.8 | GO:0072076 | nephrogenic mesenchyme development(GO:0072076) |
| 0.3 | 1.1 | GO:0060025 | primary heart field specification(GO:0003138) sinoatrial valve development(GO:0003172) sinoatrial valve morphogenesis(GO:0003185) regulation of synaptic activity(GO:0060025) |
| 0.3 | 0.3 | GO:1900019 | regulation of protein kinase C activity(GO:1900019) positive regulation of protein kinase C activity(GO:1900020) |
| 0.3 | 3.0 | GO:0030050 | vesicle transport along actin filament(GO:0030050) |
| 0.3 | 0.3 | GO:0060734 | regulation of endoplasmic reticulum stress-induced eIF2 alpha phosphorylation(GO:0060734) |
| 0.3 | 1.0 | GO:1900194 | negative regulation of oocyte maturation(GO:1900194) |
| 0.3 | 1.3 | GO:2000382 | positive regulation of mesoderm development(GO:2000382) |
| 0.3 | 2.3 | GO:0006729 | tetrahydrobiopterin biosynthetic process(GO:0006729) tetrahydrobiopterin metabolic process(GO:0046146) |
| 0.3 | 6.6 | GO:0021952 | central nervous system projection neuron axonogenesis(GO:0021952) |
| 0.2 | 5.2 | GO:0006123 | mitochondrial electron transport, cytochrome c to oxygen(GO:0006123) |
| 0.2 | 2.2 | GO:0002911 | lymphocyte anergy(GO:0002249) regulation of T cell anergy(GO:0002667) T cell anergy(GO:0002870) regulation of lymphocyte anergy(GO:0002911) |
| 0.2 | 1.7 | GO:0006102 | isocitrate metabolic process(GO:0006102) |
| 0.2 | 2.2 | GO:0001672 | regulation of chromatin assembly or disassembly(GO:0001672) |
| 0.2 | 0.7 | GO:0042369 | vitamin D catabolic process(GO:0042369) |
| 0.2 | 0.2 | GO:0035801 | adrenal cortex development(GO:0035801) adrenal cortex formation(GO:0035802) |
| 0.2 | 4.9 | GO:0048268 | clathrin coat assembly(GO:0048268) |
| 0.2 | 0.7 | GO:0032802 | low-density lipoprotein particle receptor catabolic process(GO:0032802) |
| 0.2 | 1.2 | GO:0060022 | hard palate development(GO:0060022) |
| 0.2 | 2.4 | GO:0035437 | maintenance of protein localization in endoplasmic reticulum(GO:0035437) |
| 0.2 | 0.2 | GO:0030819 | positive regulation of cAMP metabolic process(GO:0030816) positive regulation of cAMP biosynthetic process(GO:0030819) |
| 0.2 | 0.6 | GO:0007217 | tachykinin receptor signaling pathway(GO:0007217) |
| 0.2 | 0.8 | GO:1902474 | positive regulation of protein localization to synapse(GO:1902474) |
| 0.2 | 0.6 | GO:0003358 | noradrenergic neuron development(GO:0003358) |
| 0.2 | 1.0 | GO:0060754 | regulation of mast cell chemotaxis(GO:0060753) positive regulation of mast cell chemotaxis(GO:0060754) |
| 0.2 | 2.2 | GO:0035269 | protein O-linked mannosylation(GO:0035269) |
| 0.2 | 5.8 | GO:0050912 | detection of chemical stimulus involved in sensory perception of taste(GO:0050912) |
| 0.2 | 6.6 | GO:0051642 | centrosome localization(GO:0051642) |
| 0.2 | 0.2 | GO:0042374 | phylloquinone metabolic process(GO:0042374) phylloquinone catabolic process(GO:0042376) quinone catabolic process(GO:1901662) |
| 0.2 | 7.6 | GO:0016486 | peptide hormone processing(GO:0016486) |
| 0.2 | 10.2 | GO:0000381 | regulation of alternative mRNA splicing, via spliceosome(GO:0000381) |
| 0.2 | 0.4 | GO:0060120 | auditory receptor cell fate commitment(GO:0009912) inner ear receptor cell fate commitment(GO:0060120) |
| 0.2 | 5.4 | GO:0007214 | gamma-aminobutyric acid signaling pathway(GO:0007214) |
| 0.2 | 0.6 | GO:0000379 | tRNA-type intron splice site recognition and cleavage(GO:0000379) |
| 0.2 | 1.8 | GO:0032808 | lacrimal gland development(GO:0032808) |
| 0.2 | 2.6 | GO:2000311 | regulation of alpha-amino-3-hydroxy-5-methyl-4-isoxazole propionate selective glutamate receptor activity(GO:2000311) |
| 0.2 | 4.7 | GO:0090023 | positive regulation of neutrophil chemotaxis(GO:0090023) |
| 0.2 | 0.9 | GO:1903301 | positive regulation of glucokinase activity(GO:0033133) positive regulation of hexokinase activity(GO:1903301) |
| 0.2 | 0.9 | GO:0048842 | positive regulation of axon extension involved in axon guidance(GO:0048842) |
| 0.2 | 0.9 | GO:0021707 | cerebellar granular layer formation(GO:0021684) cerebellar granule cell differentiation(GO:0021707) positive regulation of long term synaptic depression(GO:1900454) |
| 0.2 | 1.8 | GO:0030223 | neutrophil differentiation(GO:0030223) |
| 0.2 | 1.2 | GO:0042426 | choline catabolic process(GO:0042426) |
| 0.2 | 1.5 | GO:0019509 | L-methionine biosynthetic process from methylthioadenosine(GO:0019509) |
| 0.2 | 4.6 | GO:0097205 | renal filtration(GO:0097205) |
| 0.2 | 1.5 | GO:0015988 | energy coupled proton transmembrane transport, against electrochemical gradient(GO:0015988) ATP hydrolysis coupled proton transport(GO:0015991) |
| 0.2 | 2.0 | GO:0097084 | vascular smooth muscle cell development(GO:0097084) |
| 0.1 | 0.6 | GO:0061366 | axonogenesis involved in innervation(GO:0060385) behavioral response to chemical pain(GO:0061366) behavioral response to formalin induced pain(GO:0061368) |
| 0.1 | 0.6 | GO:0051291 | protein heterooligomerization(GO:0051291) |
| 0.1 | 1.0 | GO:0048014 | Tie signaling pathway(GO:0048014) |
| 0.1 | 1.3 | GO:0030856 | regulation of epithelial cell differentiation(GO:0030856) |
| 0.1 | 1.8 | GO:0070327 | thyroid hormone transport(GO:0070327) |
| 0.1 | 7.4 | GO:0018279 | peptidyl-asparagine modification(GO:0018196) protein N-linked glycosylation via asparagine(GO:0018279) |
| 0.1 | 2.0 | GO:0060445 | branching involved in salivary gland morphogenesis(GO:0060445) |
| 0.1 | 3.8 | GO:0008038 | neuron recognition(GO:0008038) |
| 0.1 | 1.7 | GO:0042354 | fucose catabolic process(GO:0019317) L-fucose metabolic process(GO:0042354) L-fucose catabolic process(GO:0042355) |
| 0.1 | 0.4 | GO:0021800 | cerebral cortex tangential migration(GO:0021800) |
| 0.1 | 7.2 | GO:0010862 | positive regulation of pathway-restricted SMAD protein phosphorylation(GO:0010862) |
| 0.1 | 0.3 | GO:1990418 | response to insulin-like growth factor stimulus(GO:1990418) |
| 0.1 | 21.7 | GO:0007156 | homophilic cell adhesion via plasma membrane adhesion molecules(GO:0007156) |
| 0.1 | 0.4 | GO:0038193 | thromboxane A2 signaling pathway(GO:0038193) |
| 0.1 | 0.7 | GO:0007197 | adenylate cyclase-inhibiting G-protein coupled acetylcholine receptor signaling pathway(GO:0007197) |
| 0.1 | 1.1 | GO:0006013 | mannose metabolic process(GO:0006013) |
| 0.1 | 2.2 | GO:0090051 | negative regulation of cell migration involved in sprouting angiogenesis(GO:0090051) |
| 0.1 | 4.9 | GO:0006509 | membrane protein ectodomain proteolysis(GO:0006509) |
| 0.1 | 6.6 | GO:0051489 | regulation of filopodium assembly(GO:0051489) |
| 0.1 | 1.2 | GO:1900025 | negative regulation of substrate adhesion-dependent cell spreading(GO:1900025) |
| 0.1 | 2.5 | GO:0089711 | L-glutamate transmembrane transport(GO:0089711) |
| 0.1 | 0.4 | GO:0050717 | positive regulation of interleukin-1 alpha secretion(GO:0050717) |
| 0.1 | 0.5 | GO:0038170 | somatostatin receptor signaling pathway(GO:0038169) somatostatin signaling pathway(GO:0038170) |
| 0.1 | 0.9 | GO:0033353 | S-adenosylmethionine cycle(GO:0033353) |
| 0.1 | 2.1 | GO:0031063 | regulation of histone deacetylation(GO:0031063) |
| 0.1 | 2.1 | GO:0006884 | cell volume homeostasis(GO:0006884) |
| 0.1 | 2.6 | GO:0046320 | regulation of fatty acid oxidation(GO:0046320) |
| 0.1 | 5.1 | GO:0072583 | clathrin-mediated endocytosis(GO:0072583) |
| 0.1 | 1.2 | GO:0051791 | medium-chain fatty acid metabolic process(GO:0051791) |
| 0.1 | 1.6 | GO:0071688 | striated muscle myosin thick filament assembly(GO:0071688) |
| 0.1 | 0.9 | GO:0034086 | maintenance of sister chromatid cohesion(GO:0034086) maintenance of mitotic sister chromatid cohesion(GO:0034088) |
| 0.1 | 4.5 | GO:0007223 | Wnt signaling pathway, calcium modulating pathway(GO:0007223) |
| 0.1 | 3.4 | GO:0042572 | retinol metabolic process(GO:0042572) |
| 0.1 | 0.2 | GO:0002879 | positive regulation of acute inflammatory response to non-antigenic stimulus(GO:0002879) |
| 0.1 | 0.3 | GO:0021648 | vestibulocochlear nerve morphogenesis(GO:0021648) vestibulocochlear nerve formation(GO:0021650) |
| 0.1 | 2.0 | GO:1901881 | positive regulation of protein depolymerization(GO:1901881) |
| 0.1 | 1.9 | GO:0033141 | positive regulation of peptidyl-serine phosphorylation of STAT protein(GO:0033141) |
| 0.1 | 1.3 | GO:0090084 | negative regulation of inclusion body assembly(GO:0090084) |
| 0.1 | 0.8 | GO:0070995 | NADPH oxidation(GO:0070995) |
| 0.1 | 1.5 | GO:2000121 | regulation of removal of superoxide radicals(GO:2000121) |
| 0.1 | 1.0 | GO:0035878 | nail development(GO:0035878) |
| 0.1 | 0.5 | GO:0071847 | TNFSF11-mediated signaling pathway(GO:0071847) |
| 0.1 | 3.3 | GO:0035735 | intraciliary transport involved in cilium morphogenesis(GO:0035735) |
| 0.1 | 1.7 | GO:0090557 | establishment of endothelial intestinal barrier(GO:0090557) |
| 0.1 | 0.6 | GO:0070172 | positive regulation of tooth mineralization(GO:0070172) |
| 0.1 | 1.2 | GO:0019321 | pentose metabolic process(GO:0019321) |
| 0.1 | 0.3 | GO:0060083 | smooth muscle contraction involved in micturition(GO:0060083) |
| 0.1 | 0.9 | GO:0090136 | epithelial cell-cell adhesion(GO:0090136) |
| 0.1 | 4.2 | GO:0045600 | positive regulation of fat cell differentiation(GO:0045600) |
| 0.1 | 0.3 | GO:0036269 | swimming behavior(GO:0036269) |
| 0.1 | 0.8 | GO:0086024 | adrenergic receptor signaling pathway involved in positive regulation of heart rate(GO:0086024) |
| 0.1 | 1.3 | GO:0031146 | SCF-dependent proteasomal ubiquitin-dependent protein catabolic process(GO:0031146) |
| 0.1 | 1.0 | GO:0046007 | negative regulation of activated T cell proliferation(GO:0046007) |
| 0.1 | 1.0 | GO:0008635 | activation of cysteine-type endopeptidase activity involved in apoptotic process by cytochrome c(GO:0008635) |
| 0.1 | 9.4 | GO:0072332 | intrinsic apoptotic signaling pathway by p53 class mediator(GO:0072332) |
| 0.1 | 3.1 | GO:1901379 | regulation of potassium ion transmembrane transport(GO:1901379) |
| 0.1 | 1.1 | GO:0050849 | negative regulation of calcium-mediated signaling(GO:0050849) |
| 0.1 | 1.9 | GO:0007216 | G-protein coupled glutamate receptor signaling pathway(GO:0007216) |
| 0.1 | 0.9 | GO:0008272 | sulfate transport(GO:0008272) |
| 0.1 | 0.7 | GO:0048010 | vascular endothelial growth factor receptor signaling pathway(GO:0048010) |
| 0.1 | 0.4 | GO:0070164 | negative regulation of adiponectin secretion(GO:0070164) |
| 0.1 | 0.7 | GO:1902083 | negative regulation of peptidyl-cysteine S-nitrosylation(GO:1902083) |
| 0.1 | 0.7 | GO:0006600 | creatine metabolic process(GO:0006600) |
| 0.1 | 1.4 | GO:0048934 | peripheral nervous system neuron differentiation(GO:0048934) peripheral nervous system neuron development(GO:0048935) |
| 0.1 | 2.8 | GO:0080171 | lysosome organization(GO:0007040) lytic vacuole organization(GO:0080171) |
| 0.1 | 0.4 | GO:0070459 | prolactin secretion(GO:0070459) |
| 0.1 | 2.3 | GO:0043252 | sodium-independent organic anion transport(GO:0043252) |
| 0.1 | 1.3 | GO:0050974 | detection of mechanical stimulus involved in sensory perception(GO:0050974) |
| 0.1 | 3.0 | GO:0007528 | neuromuscular junction development(GO:0007528) |
| 0.1 | 1.0 | GO:0000338 | protein deneddylation(GO:0000338) |
| 0.1 | 0.2 | GO:0006669 | sphinganine-1-phosphate biosynthetic process(GO:0006669) |
| 0.1 | 5.0 | GO:0006890 | retrograde vesicle-mediated transport, Golgi to ER(GO:0006890) |
| 0.1 | 0.8 | GO:0043508 | negative regulation of JUN kinase activity(GO:0043508) |
| 0.1 | 0.3 | GO:0061143 | alveolar primary septum development(GO:0061143) |
| 0.1 | 2.1 | GO:0030206 | chondroitin sulfate biosynthetic process(GO:0030206) |
| 0.1 | 0.3 | GO:0015860 | pyrimidine nucleobase transport(GO:0015855) purine nucleoside transmembrane transport(GO:0015860) purine nucleobase transmembrane transport(GO:1904823) |
| 0.1 | 0.2 | GO:0033572 | ferric iron transport(GO:0015682) transferrin transport(GO:0033572) trivalent inorganic cation transport(GO:0072512) |
| 0.1 | 0.3 | GO:1902731 | ovarian cumulus expansion(GO:0001550) fused antrum stage(GO:0048165) negative regulation of chondrocyte proliferation(GO:1902731) |
| 0.1 | 0.3 | GO:0008215 | spermine metabolic process(GO:0008215) |
| 0.1 | 0.2 | GO:0010269 | response to selenium ion(GO:0010269) |
| 0.1 | 14.1 | GO:0065004 | protein-DNA complex assembly(GO:0065004) |
| 0.1 | 0.6 | GO:0008212 | mineralocorticoid biosynthetic process(GO:0006705) mineralocorticoid metabolic process(GO:0008212) |
| 0.0 | 0.3 | GO:0031290 | retinal ganglion cell axon guidance(GO:0031290) |
| 0.0 | 0.4 | GO:0033234 | negative regulation of protein sumoylation(GO:0033234) |
| 0.0 | 2.1 | GO:0008542 | visual learning(GO:0008542) |
| 0.0 | 0.1 | GO:0050854 | regulation of antigen receptor-mediated signaling pathway(GO:0050854) regulation of B cell receptor signaling pathway(GO:0050855) |
| 0.0 | 2.8 | GO:0035773 | insulin secretion involved in cellular response to glucose stimulus(GO:0035773) |
| 0.0 | 2.0 | GO:0032330 | regulation of chondrocyte differentiation(GO:0032330) |
| 0.0 | 0.4 | GO:0006978 | DNA damage response, signal transduction by p53 class mediator resulting in transcription of p21 class mediator(GO:0006978) DNA damage response, signal transduction resulting in transcription(GO:0042772) |
| 0.0 | 3.9 | GO:0043473 | pigmentation(GO:0043473) |
| 0.0 | 0.9 | GO:0007618 | mating(GO:0007618) |
| 0.0 | 3.4 | GO:0007422 | peripheral nervous system development(GO:0007422) |
| 0.0 | 1.2 | GO:0007205 | protein kinase C-activating G-protein coupled receptor signaling pathway(GO:0007205) |
| 0.0 | 1.9 | GO:0007218 | neuropeptide signaling pathway(GO:0007218) |
| 0.0 | 0.6 | GO:0034030 | coenzyme A biosynthetic process(GO:0015937) nucleoside bisphosphate biosynthetic process(GO:0033866) ribonucleoside bisphosphate biosynthetic process(GO:0034030) purine nucleoside bisphosphate biosynthetic process(GO:0034033) |
| 0.0 | 0.3 | GO:0007175 | negative regulation of epidermal growth factor-activated receptor activity(GO:0007175) |
| 0.0 | 1.3 | GO:0035066 | positive regulation of histone acetylation(GO:0035066) |
| 0.0 | 1.3 | GO:0032007 | negative regulation of TOR signaling(GO:0032007) |
| 0.0 | 1.0 | GO:0021772 | olfactory bulb development(GO:0021772) |
| 0.0 | 1.1 | GO:0010738 | regulation of protein kinase A signaling(GO:0010738) |
| 0.0 | 0.2 | GO:0008589 | regulation of smoothened signaling pathway(GO:0008589) |
| 0.0 | 1.5 | GO:0038128 | ERBB2 signaling pathway(GO:0038128) |
| 0.0 | 8.7 | GO:0042787 | protein ubiquitination involved in ubiquitin-dependent protein catabolic process(GO:0042787) |
| 0.0 | 0.1 | GO:0061549 | sympathetic ganglion development(GO:0061549) |
| 0.0 | 8.1 | GO:0031032 | actomyosin structure organization(GO:0031032) |
| 0.0 | 0.6 | GO:0016242 | negative regulation of macroautophagy(GO:0016242) |
| 0.0 | 1.0 | GO:0000470 | maturation of LSU-rRNA(GO:0000470) |
| 0.0 | 0.2 | GO:0006686 | sphingomyelin biosynthetic process(GO:0006686) |
| 0.0 | 3.1 | GO:0007626 | locomotory behavior(GO:0007626) |
| 0.0 | 0.3 | GO:0033327 | Leydig cell differentiation(GO:0033327) |
| 0.0 | 1.0 | GO:0043171 | peptide catabolic process(GO:0043171) |
| 0.0 | 0.3 | GO:0010666 | positive regulation of striated muscle cell apoptotic process(GO:0010663) positive regulation of cardiac muscle cell apoptotic process(GO:0010666) |
| 0.0 | 0.8 | GO:0034394 | protein localization to cell surface(GO:0034394) |
| 0.0 | 6.9 | GO:0016042 | lipid catabolic process(GO:0016042) |
| 0.0 | 0.7 | GO:0043113 | receptor clustering(GO:0043113) |
| 0.0 | 0.4 | GO:0051131 | chaperone-mediated protein complex assembly(GO:0051131) |
| 0.0 | 0.8 | GO:0032259 | methylation(GO:0032259) |
| 0.0 | 0.7 | GO:0045026 | plasma membrane fusion(GO:0045026) |
| 0.0 | 0.1 | GO:1900368 | transcription, RNA-templated(GO:0001172) regulation of RNA interference(GO:1900368) negative regulation of RNA interference(GO:1900369) positive regulation of protein localization to nucleolus(GO:1904751) |
| 0.0 | 0.4 | GO:0071850 | mitotic cell cycle arrest(GO:0071850) |
| 0.0 | 0.5 | GO:0008089 | anterograde axonal transport(GO:0008089) |
| 0.0 | 0.8 | GO:0000060 | protein import into nucleus, translocation(GO:0000060) |
| 0.0 | 0.5 | GO:0045671 | negative regulation of osteoclast differentiation(GO:0045671) |
| 0.0 | 0.0 | GO:0036159 | inner dynein arm assembly(GO:0036159) |
| 0.0 | 4.4 | GO:0010038 | response to metal ion(GO:0010038) |
| 0.0 | 0.2 | GO:0015074 | DNA integration(GO:0015074) |
| 0.0 | 0.6 | GO:0050819 | negative regulation of coagulation(GO:0050819) |
| 0.0 | 0.2 | GO:0042340 | keratan sulfate catabolic process(GO:0042340) |
| 0.0 | 0.3 | GO:0046597 | negative regulation of viral entry into host cell(GO:0046597) |
| 0.0 | 0.2 | GO:0019388 | galactose catabolic process(GO:0019388) |
| 0.0 | 0.0 | GO:0006420 | arginyl-tRNA aminoacylation(GO:0006420) |
| 0.0 | 0.7 | GO:0043967 | histone H4 acetylation(GO:0043967) |
| 0.0 | 0.2 | GO:0030277 | maintenance of gastrointestinal epithelium(GO:0030277) |
| 0.0 | 0.6 | GO:0006040 | amino sugar metabolic process(GO:0006040) |
| 0.0 | 0.2 | GO:0035435 | phosphate ion transmembrane transport(GO:0035435) |
| 0.0 | 0.0 | GO:0097350 | neutrophil clearance(GO:0097350) |
| 0.0 | 0.9 | GO:0015698 | inorganic anion transport(GO:0015698) |
| 0.0 | 0.3 | GO:0003341 | cilium movement(GO:0003341) |
| 0.0 | 0.4 | GO:0000413 | protein peptidyl-prolyl isomerization(GO:0000413) |
Gene overrepresentation in cellular_component category:
| Log-likelihood per target | Total log-likelihood | Term | Description |
|---|---|---|---|
| 3.0 | 36.2 | GO:0097487 | multivesicular body, internal vesicle(GO:0097487) |
| 2.5 | 12.4 | GO:0060200 | clathrin-sculpted acetylcholine transport vesicle(GO:0060200) clathrin-sculpted acetylcholine transport vesicle membrane(GO:0060201) |
| 2.0 | 10.0 | GO:0045298 | tubulin complex(GO:0045298) |
| 1.9 | 5.7 | GO:0060187 | cell pole(GO:0060187) |
| 1.7 | 26.9 | GO:0097512 | cardiac myofibril(GO:0097512) |
| 1.6 | 21.3 | GO:0097418 | neurofibrillary tangle(GO:0097418) |
| 1.6 | 31.1 | GO:0071782 | endoplasmic reticulum tubular network(GO:0071782) |
| 1.3 | 3.8 | GO:0060053 | neurofilament cytoskeleton(GO:0060053) |
| 1.2 | 4.9 | GO:0032044 | DSIF complex(GO:0032044) |
| 1.2 | 11.9 | GO:0016011 | dystroglycan complex(GO:0016011) |
| 1.2 | 3.5 | GO:0005588 | collagen type V trimer(GO:0005588) |
| 1.2 | 11.7 | GO:0097449 | astrocyte projection(GO:0097449) |
| 1.1 | 10.0 | GO:0030868 | smooth endoplasmic reticulum membrane(GO:0030868) smooth endoplasmic reticulum part(GO:0097425) |
| 1.1 | 5.3 | GO:1902937 | inward rectifier potassium channel complex(GO:1902937) |
| 1.0 | 24.3 | GO:0016471 | vacuolar proton-transporting V-type ATPase complex(GO:0016471) |
| 0.9 | 2.6 | GO:0034667 | integrin alpha3-beta1 complex(GO:0034667) |
| 0.7 | 3.6 | GO:0005899 | insulin receptor complex(GO:0005899) |
| 0.6 | 8.3 | GO:0005577 | fibrinogen complex(GO:0005577) |
| 0.6 | 8.3 | GO:0098563 | integral component of synaptic vesicle membrane(GO:0030285) intrinsic component of synaptic vesicle membrane(GO:0098563) |
| 0.6 | 2.8 | GO:0005594 | collagen type IX trimer(GO:0005594) |
| 0.5 | 6.3 | GO:0008250 | oligosaccharyltransferase complex(GO:0008250) |
| 0.5 | 4.7 | GO:0005955 | calcineurin complex(GO:0005955) |
| 0.5 | 2.0 | GO:0043259 | laminin-10 complex(GO:0043259) laminin-11 complex(GO:0043260) |
| 0.5 | 8.2 | GO:0001518 | voltage-gated sodium channel complex(GO:0001518) |
| 0.5 | 3.8 | GO:0071438 | invadopodium membrane(GO:0071438) |
| 0.5 | 2.8 | GO:0009331 | glycerol-3-phosphate dehydrogenase complex(GO:0009331) |
| 0.5 | 14.2 | GO:0005790 | smooth endoplasmic reticulum(GO:0005790) |
| 0.4 | 2.9 | GO:0098575 | lumenal side of lysosomal membrane(GO:0098575) |
| 0.4 | 2.4 | GO:1990769 | proximal neuron projection(GO:1990769) |
| 0.4 | 4.9 | GO:0032585 | multivesicular body membrane(GO:0032585) |
| 0.4 | 11.2 | GO:0005868 | cytoplasmic dynein complex(GO:0005868) |
| 0.4 | 5.2 | GO:0005751 | mitochondrial respiratory chain complex IV(GO:0005751) |
| 0.4 | 2.6 | GO:0043240 | Fanconi anaemia nuclear complex(GO:0043240) |
| 0.4 | 6.6 | GO:0032433 | filopodium tip(GO:0032433) |
| 0.4 | 2.2 | GO:1990357 | terminal web(GO:1990357) |
| 0.3 | 3.8 | GO:0005614 | interstitial matrix(GO:0005614) |
| 0.3 | 1.0 | GO:0018444 | translation release factor complex(GO:0018444) |
| 0.3 | 1.0 | GO:0034676 | integrin alpha6-beta4 complex(GO:0034676) |
| 0.3 | 0.3 | GO:0034680 | integrin alpha10-beta1 complex(GO:0034680) |
| 0.3 | 1.6 | GO:1990393 | 3M complex(GO:1990393) |
| 0.3 | 4.4 | GO:0097227 | sperm annulus(GO:0097227) |
| 0.3 | 4.0 | GO:0031209 | SCAR complex(GO:0031209) |
| 0.3 | 6.0 | GO:0005890 | sodium:potassium-exchanging ATPase complex(GO:0005890) |
| 0.3 | 8.1 | GO:0030867 | rough endoplasmic reticulum membrane(GO:0030867) |
| 0.3 | 2.4 | GO:0044295 | axonal growth cone(GO:0044295) |
| 0.3 | 9.2 | GO:0000159 | protein phosphatase type 2A complex(GO:0000159) |
| 0.3 | 2.9 | GO:0002116 | semaphorin receptor complex(GO:0002116) |
| 0.3 | 1.8 | GO:0016272 | prefoldin complex(GO:0016272) |
| 0.3 | 26.9 | GO:0005604 | basement membrane(GO:0005604) |
| 0.2 | 3.7 | GO:0031594 | neuromuscular junction(GO:0031594) |
| 0.2 | 2.8 | GO:1990454 | L-type voltage-gated calcium channel complex(GO:1990454) |
| 0.2 | 4.8 | GO:0032281 | AMPA glutamate receptor complex(GO:0032281) |
| 0.2 | 1.9 | GO:0098839 | postsynaptic density membrane(GO:0098839) |
| 0.2 | 11.0 | GO:0014704 | intercalated disc(GO:0014704) |
| 0.2 | 1.8 | GO:0005638 | lamin filament(GO:0005638) |
| 0.2 | 0.8 | GO:1990031 | pinceau fiber(GO:1990031) |
| 0.2 | 1.6 | GO:0097208 | alveolar lamellar body(GO:0097208) |
| 0.2 | 2.8 | GO:0005589 | collagen type VI trimer(GO:0005589) collagen beaded filament(GO:0098647) |
| 0.2 | 1.3 | GO:0070852 | cell body fiber(GO:0070852) |
| 0.2 | 10.9 | GO:0005844 | polysome(GO:0005844) |
| 0.2 | 15.4 | GO:1904724 | tertiary granule lumen(GO:1904724) |
| 0.2 | 12.2 | GO:0030672 | synaptic vesicle membrane(GO:0030672) exocytic vesicle membrane(GO:0099501) |
| 0.2 | 0.8 | GO:0042406 | extrinsic component of endoplasmic reticulum membrane(GO:0042406) |
| 0.2 | 1.5 | GO:0071953 | elastic fiber(GO:0071953) |
| 0.2 | 2.0 | GO:0032591 | dendritic spine membrane(GO:0032591) |
| 0.2 | 1.0 | GO:0070545 | PeBoW complex(GO:0070545) |
| 0.2 | 5.6 | GO:0032420 | stereocilium(GO:0032420) |
| 0.2 | 1.1 | GO:0070522 | nucleotide-excision repair factor 1 complex(GO:0000110) ERCC4-ERCC1 complex(GO:0070522) |
| 0.1 | 3.4 | GO:0031528 | microvillus membrane(GO:0031528) |
| 0.1 | 5.9 | GO:0033017 | sarcoplasmic reticulum membrane(GO:0033017) |
| 0.1 | 6.9 | GO:0005902 | microvillus(GO:0005902) |
| 0.1 | 1.3 | GO:0033588 | Elongator holoenzyme complex(GO:0033588) |
| 0.1 | 7.8 | GO:0019005 | SCF ubiquitin ligase complex(GO:0019005) |
| 0.1 | 0.6 | GO:0000214 | tRNA-intron endonuclease complex(GO:0000214) |
| 0.1 | 6.9 | GO:0005834 | heterotrimeric G-protein complex(GO:0005834) |
| 0.1 | 1.7 | GO:0042622 | photoreceptor outer segment membrane(GO:0042622) |
| 0.1 | 1.2 | GO:0005750 | mitochondrial respiratory chain complex III(GO:0005750) respiratory chain complex III(GO:0045275) |
| 0.1 | 3.5 | GO:0043218 | compact myelin(GO:0043218) |
| 0.1 | 0.8 | GO:0005658 | alpha DNA polymerase:primase complex(GO:0005658) |
| 0.1 | 5.3 | GO:0043198 | dendritic shaft(GO:0043198) |
| 0.1 | 14.0 | GO:0030658 | transport vesicle membrane(GO:0030658) |
| 0.1 | 0.9 | GO:0042719 | mitochondrial intermembrane space protein transporter complex(GO:0042719) |
| 0.1 | 0.9 | GO:0043190 | ATP-binding cassette (ABC) transporter complex(GO:0043190) |
| 0.1 | 0.7 | GO:0097413 | Lewy body(GO:0097413) |
| 0.1 | 3.5 | GO:1902711 | GABA-A receptor complex(GO:1902711) |
| 0.1 | 11.7 | GO:0030176 | integral component of endoplasmic reticulum membrane(GO:0030176) |
| 0.1 | 11.7 | GO:0043204 | perikaryon(GO:0043204) |
| 0.1 | 10.4 | GO:0030136 | clathrin-coated vesicle(GO:0030136) |
| 0.1 | 2.9 | GO:0005771 | multivesicular body(GO:0005771) |
| 0.1 | 5.9 | GO:0005776 | autophagosome(GO:0005776) |
| 0.1 | 2.5 | GO:0035580 | specific granule lumen(GO:0035580) |
| 0.1 | 8.0 | GO:0042641 | actomyosin(GO:0042641) |
| 0.1 | 0.8 | GO:0030126 | COPI vesicle coat(GO:0030126) |
| 0.1 | 0.7 | GO:0060077 | inhibitory synapse(GO:0060077) |
| 0.1 | 14.2 | GO:0005802 | trans-Golgi network(GO:0005802) |
| 0.1 | 1.5 | GO:0000276 | mitochondrial proton-transporting ATP synthase complex, coupling factor F(o)(GO:0000276) |
| 0.1 | 5.1 | GO:0005881 | cytoplasmic microtubule(GO:0005881) |
| 0.1 | 1.4 | GO:0000145 | exocyst(GO:0000145) |
| 0.1 | 1.3 | GO:0030914 | STAGA complex(GO:0030914) |
| 0.1 | 2.9 | GO:0045211 | postsynaptic membrane(GO:0045211) |
| 0.1 | 16.2 | GO:0099572 | postsynaptic density(GO:0014069) postsynaptic specialization(GO:0099572) |
| 0.1 | 1.0 | GO:0035631 | CD40 receptor complex(GO:0035631) |
| 0.1 | 10.3 | GO:0055037 | recycling endosome(GO:0055037) |
| 0.1 | 0.9 | GO:0030478 | actin cap(GO:0030478) |
| 0.1 | 1.4 | GO:0031588 | nucleotide-activated protein kinase complex(GO:0031588) |
| 0.1 | 1.4 | GO:0005862 | muscle thin filament tropomyosin(GO:0005862) |
| 0.1 | 1.4 | GO:0000812 | Swr1 complex(GO:0000812) |
| 0.1 | 1.2 | GO:0031089 | platelet dense granule lumen(GO:0031089) |
| 0.1 | 3.4 | GO:0008021 | synaptic vesicle(GO:0008021) |
| 0.1 | 3.6 | GO:0043235 | receptor complex(GO:0043235) |
| 0.1 | 10.4 | GO:0043209 | myelin sheath(GO:0043209) |
| 0.1 | 1.2 | GO:0008180 | COP9 signalosome(GO:0008180) |
| 0.1 | 0.5 | GO:0098643 | fibrillar collagen trimer(GO:0005583) banded collagen fibril(GO:0098643) |
| 0.1 | 8.8 | GO:0000922 | spindle pole(GO:0000922) |
| 0.1 | 11.7 | GO:0032993 | protein-DNA complex(GO:0032993) |
| 0.1 | 3.8 | GO:0005758 | mitochondrial intermembrane space(GO:0005758) |
| 0.1 | 1.0 | GO:0030057 | desmosome(GO:0030057) |
| 0.1 | 2.5 | GO:0009897 | external side of plasma membrane(GO:0009897) |
| 0.1 | 0.8 | GO:0005640 | nuclear outer membrane(GO:0005640) |
| 0.0 | 11.4 | GO:0031965 | nuclear membrane(GO:0031965) |
| 0.0 | 0.3 | GO:1990712 | HFE-transferrin receptor complex(GO:1990712) |
| 0.0 | 0.2 | GO:0030137 | COPI-coated vesicle(GO:0030137) |
| 0.0 | 1.5 | GO:0097542 | ciliary tip(GO:0097542) |
| 0.0 | 0.9 | GO:0016010 | dystrophin-associated glycoprotein complex(GO:0016010) glycoprotein complex(GO:0090665) |
| 0.0 | 0.4 | GO:0030877 | beta-catenin destruction complex(GO:0030877) |
| 0.0 | 2.7 | GO:0005901 | caveola(GO:0005901) |
| 0.0 | 17.2 | GO:0031012 | extracellular matrix(GO:0031012) |
| 0.0 | 1.6 | GO:0005801 | cis-Golgi network(GO:0005801) |
| 0.0 | 27.9 | GO:0005789 | endoplasmic reticulum membrane(GO:0005789) |
| 0.0 | 1.2 | GO:0005791 | rough endoplasmic reticulum(GO:0005791) |
| 0.0 | 1.2 | GO:0016592 | mediator complex(GO:0016592) |
| 0.0 | 0.2 | GO:0044291 | cell-cell contact zone(GO:0044291) |
| 0.0 | 1.8 | GO:0032587 | ruffle membrane(GO:0032587) |
| 0.0 | 40.1 | GO:0005887 | integral component of plasma membrane(GO:0005887) |
| 0.0 | 0.5 | GO:1904115 | axon cytoplasm(GO:1904115) |
| 0.0 | 1.4 | GO:0032580 | Golgi cisterna membrane(GO:0032580) |
| 0.0 | 0.3 | GO:0005858 | axonemal dynein complex(GO:0005858) |
| 0.0 | 1.2 | GO:0031907 | peroxisomal matrix(GO:0005782) microbody lumen(GO:0031907) |
| 0.0 | 0.9 | GO:0005796 | Golgi lumen(GO:0005796) |
| 0.0 | 1.2 | GO:0005884 | actin filament(GO:0005884) |
| 0.0 | 1.4 | GO:0016324 | apical plasma membrane(GO:0016324) |
| 0.0 | 0.0 | GO:0005674 | transcription factor TFIIF complex(GO:0005674) |
| 0.0 | 0.3 | GO:0098857 | membrane raft(GO:0045121) membrane microdomain(GO:0098857) |
| 0.0 | 0.1 | GO:0072487 | MSL complex(GO:0072487) |
| 0.0 | 0.2 | GO:0030496 | midbody(GO:0030496) |
Gene overrepresentation in molecular_function category:
| Log-likelihood per target | Total log-likelihood | Term | Description |
|---|---|---|---|
| 4.2 | 16.8 | GO:0035373 | chondroitin sulfate proteoglycan binding(GO:0035373) |
| 3.5 | 14.1 | GO:0070290 | N-acylphosphatidylethanolamine-specific phospholipase D activity(GO:0070290) |
| 2.8 | 8.3 | GO:0033823 | procollagen-lysine 5-dioxygenase activity(GO:0008475) procollagen glucosyltransferase activity(GO:0033823) |
| 2.7 | 8.2 | GO:0086062 | voltage-gated sodium channel activity involved in Purkinje myocyte action potential(GO:0086062) |
| 2.7 | 10.8 | GO:0004743 | pyruvate kinase activity(GO:0004743) |
| 2.5 | 10.0 | GO:0099609 | microtubule lateral binding(GO:0099609) |
| 2.2 | 6.5 | GO:0016603 | glutaminyl-peptide cyclotransferase activity(GO:0016603) |
| 2.1 | 10.6 | GO:0038062 | protein tyrosine kinase collagen receptor activity(GO:0038062) |
| 1.8 | 5.5 | GO:0048030 | disaccharide binding(GO:0048030) |
| 1.8 | 23.9 | GO:0001011 | transcription factor activity, sequence-specific DNA binding, RNA polymerase recruiting(GO:0001011) transcription factor activity, TFIIB-class binding(GO:0001087) |
| 1.7 | 10.0 | GO:0072320 | volume-sensitive chloride channel activity(GO:0072320) |
| 1.6 | 3.3 | GO:0010314 | phosphatidylinositol-5-phosphate binding(GO:0010314) |
| 1.6 | 8.2 | GO:0030348 | syntaxin-3 binding(GO:0030348) |
| 1.6 | 4.9 | GO:0008798 | beta-aspartyl-peptidase activity(GO:0008798) |
| 1.4 | 5.6 | GO:0008112 | nicotinamide N-methyltransferase activity(GO:0008112) pyridine N-methyltransferase activity(GO:0030760) |
| 1.3 | 7.9 | GO:0004705 | JUN kinase activity(GO:0004705) SAP kinase activity(GO:0016909) |
| 1.3 | 68.6 | GO:0017080 | sodium channel regulator activity(GO:0017080) |
| 1.3 | 3.8 | GO:0030377 | urokinase plasminogen activator receptor activity(GO:0030377) |
| 1.2 | 12.2 | GO:0022841 | potassium ion leak channel activity(GO:0022841) |
| 1.2 | 7.2 | GO:0043237 | laminin-1 binding(GO:0043237) |
| 1.1 | 4.6 | GO:0034186 | apolipoprotein A-I binding(GO:0034186) |
| 1.1 | 14.7 | GO:0022851 | GABA-gated chloride ion channel activity(GO:0022851) |
| 1.0 | 11.4 | GO:0004332 | fructose-bisphosphate aldolase activity(GO:0004332) |
| 1.0 | 3.0 | GO:0004020 | adenylylsulfate kinase activity(GO:0004020) sulfate adenylyltransferase activity(GO:0004779) sulfate adenylyltransferase (ATP) activity(GO:0004781) |
| 1.0 | 11.7 | GO:0046870 | cadmium ion binding(GO:0046870) |
| 0.9 | 3.6 | GO:0052795 | exo-alpha-(2->3)-sialidase activity(GO:0052794) exo-alpha-(2->6)-sialidase activity(GO:0052795) exo-alpha-(2->8)-sialidase activity(GO:0052796) |
| 0.9 | 5.3 | GO:0035368 | selenocysteine insertion sequence binding(GO:0035368) |
| 0.9 | 26.9 | GO:0005212 | structural constituent of eye lens(GO:0005212) |
| 0.8 | 5.0 | GO:0050291 | sphingosine N-acyltransferase activity(GO:0050291) |
| 0.8 | 5.7 | GO:0043533 | inositol 1,3,4,5 tetrakisphosphate binding(GO:0043533) |
| 0.8 | 3.1 | GO:0032810 | sterol response element binding(GO:0032810) |
| 0.8 | 9.2 | GO:0019911 | structural constituent of myelin sheath(GO:0019911) |
| 0.7 | 14.8 | GO:0051787 | misfolded protein binding(GO:0051787) |
| 0.7 | 2.9 | GO:0016997 | exo-alpha-sialidase activity(GO:0004308) alpha-sialidase activity(GO:0016997) |
| 0.7 | 6.6 | GO:0060002 | plus-end directed microfilament motor activity(GO:0060002) |
| 0.7 | 6.9 | GO:0004767 | sphingomyelin phosphodiesterase activity(GO:0004767) |
| 0.7 | 2.8 | GO:0004657 | proline dehydrogenase activity(GO:0004657) |
| 0.7 | 7.4 | GO:0051429 | corticotropin-releasing hormone receptor binding(GO:0051429) corticotropin-releasing hormone receptor 1 binding(GO:0051430) |
| 0.7 | 8.1 | GO:0005391 | sodium:potassium-exchanging ATPase activity(GO:0005391) |
| 0.6 | 2.6 | GO:0005225 | volume-sensitive anion channel activity(GO:0005225) |
| 0.6 | 6.3 | GO:0004579 | dolichyl-diphosphooligosaccharide-protein glycotransferase activity(GO:0004579) |
| 0.6 | 3.2 | GO:0004090 | carbonyl reductase (NADPH) activity(GO:0004090) |
| 0.6 | 2.5 | GO:0042954 | lipoprotein transporter activity(GO:0042954) |
| 0.6 | 4.3 | GO:0060072 | large conductance calcium-activated potassium channel activity(GO:0060072) |
| 0.6 | 8.4 | GO:0048407 | platelet-derived growth factor binding(GO:0048407) |
| 0.6 | 1.8 | GO:0050510 | N-acetylgalactosaminyl-proteoglycan 3-beta-glucuronosyltransferase activity(GO:0050510) |
| 0.5 | 2.2 | GO:0001025 | RNA polymerase III transcription factor binding(GO:0001025) |
| 0.5 | 4.9 | GO:0032051 | clathrin light chain binding(GO:0032051) |
| 0.5 | 1.6 | GO:0004515 | nicotinate-nucleotide adenylyltransferase activity(GO:0004515) |
| 0.5 | 2.1 | GO:0033906 | protein tyrosine kinase inhibitor activity(GO:0030292) hyaluronoglucuronidase activity(GO:0033906) |
| 0.5 | 2.5 | GO:0005294 | neutral L-amino acid secondary active transmembrane transporter activity(GO:0005294) |
| 0.5 | 3.9 | GO:0008379 | thioredoxin peroxidase activity(GO:0008379) |
| 0.5 | 2.8 | GO:0030020 | extracellular matrix structural constituent conferring tensile strength(GO:0030020) |
| 0.4 | 4.7 | GO:0019215 | intermediate filament binding(GO:0019215) |
| 0.4 | 2.5 | GO:0017134 | fibroblast growth factor binding(GO:0017134) |
| 0.4 | 1.7 | GO:0004449 | isocitrate dehydrogenase (NAD+) activity(GO:0004449) |
| 0.4 | 1.7 | GO:0016639 | oxidoreductase activity, acting on the CH-NH2 group of donors, NAD or NADP as acceptor(GO:0016639) |
| 0.4 | 10.4 | GO:0016805 | dipeptidase activity(GO:0016805) |
| 0.4 | 7.9 | GO:0070273 | phosphatidylinositol-4-phosphate binding(GO:0070273) |
| 0.4 | 1.1 | GO:0031812 | G-protein coupled nucleotide receptor binding(GO:0031811) P2Y1 nucleotide receptor binding(GO:0031812) |
| 0.4 | 9.7 | GO:0017075 | syntaxin-1 binding(GO:0017075) |
| 0.4 | 1.1 | GO:0008267 | poly-glutamine tract binding(GO:0008267) |
| 0.4 | 12.4 | GO:0050431 | transforming growth factor beta binding(GO:0050431) |
| 0.4 | 2.8 | GO:0086056 | voltage-gated calcium channel activity involved in AV node cell action potential(GO:0086056) |
| 0.3 | 6.9 | GO:0045504 | dynein heavy chain binding(GO:0045504) |
| 0.3 | 11.7 | GO:0008395 | steroid hydroxylase activity(GO:0008395) |
| 0.3 | 3.4 | GO:0033192 | calmodulin-dependent protein phosphatase activity(GO:0033192) |
| 0.3 | 1.7 | GO:0008073 | ornithine decarboxylase inhibitor activity(GO:0008073) |
| 0.3 | 1.3 | GO:0004826 | phenylalanine-tRNA ligase activity(GO:0004826) |
| 0.3 | 1.6 | GO:0044729 | hemi-methylated DNA-binding(GO:0044729) |
| 0.3 | 2.2 | GO:1990459 | transferrin receptor binding(GO:1990459) |
| 0.3 | 1.7 | GO:0052650 | NADP-retinol dehydrogenase activity(GO:0052650) |
| 0.3 | 1.7 | GO:0008481 | sphinganine kinase activity(GO:0008481) D-erythro-sphingosine kinase activity(GO:0017050) |
| 0.3 | 2.0 | GO:0016206 | catechol O-methyltransferase activity(GO:0016206) |
| 0.3 | 1.4 | GO:0004489 | methylenetetrahydrofolate reductase (NAD(P)H) activity(GO:0004489) |
| 0.3 | 1.1 | GO:0015220 | choline transmembrane transporter activity(GO:0015220) |
| 0.3 | 2.7 | GO:0008607 | phosphorylase kinase regulator activity(GO:0008607) |
| 0.3 | 7.0 | GO:0019198 | transmembrane receptor protein tyrosine phosphatase activity(GO:0005001) transmembrane receptor protein phosphatase activity(GO:0019198) |
| 0.3 | 4.5 | GO:0008574 | ATP-dependent microtubule motor activity, plus-end-directed(GO:0008574) |
| 0.2 | 1.2 | GO:0042285 | UDP-xylosyltransferase activity(GO:0035252) xylosyltransferase activity(GO:0042285) |
| 0.2 | 2.7 | GO:0032050 | clathrin heavy chain binding(GO:0032050) |
| 0.2 | 0.7 | GO:0070576 | vitamin D 24-hydroxylase activity(GO:0070576) |
| 0.2 | 3.7 | GO:0045236 | CXCR chemokine receptor binding(GO:0045236) |
| 0.2 | 1.8 | GO:0015349 | thyroid hormone transmembrane transporter activity(GO:0015349) |
| 0.2 | 1.1 | GO:0004359 | glutaminase activity(GO:0004359) |
| 0.2 | 1.7 | GO:0046920 | alpha-(1->3)-fucosyltransferase activity(GO:0046920) |
| 0.2 | 0.6 | GO:0047696 | beta-adrenergic receptor kinase activity(GO:0047696) |
| 0.2 | 2.4 | GO:0031545 | peptidyl-proline 4-dioxygenase activity(GO:0031545) |
| 0.2 | 2.2 | GO:0001042 | RNA polymerase I core binding(GO:0001042) |
| 0.2 | 2.0 | GO:0004075 | biotin carboxylase activity(GO:0004075) biotin binding(GO:0009374) |
| 0.2 | 6.9 | GO:0017091 | AU-rich element binding(GO:0017091) |
| 0.2 | 0.4 | GO:0022842 | leak channel activity(GO:0022840) narrow pore channel activity(GO:0022842) |
| 0.2 | 0.2 | GO:0004614 | phosphoglucomutase activity(GO:0004614) |
| 0.2 | 3.2 | GO:0017154 | semaphorin receptor activity(GO:0017154) |
| 0.2 | 10.4 | GO:0005154 | epidermal growth factor receptor binding(GO:0005154) |
| 0.2 | 0.6 | GO:0000213 | tRNA-intron endonuclease activity(GO:0000213) |
| 0.2 | 15.7 | GO:0005518 | collagen binding(GO:0005518) |
| 0.2 | 0.9 | GO:0070095 | fructose-6-phosphate binding(GO:0070095) |
| 0.2 | 5.2 | GO:0015002 | cytochrome-c oxidase activity(GO:0004129) heme-copper terminal oxidase activity(GO:0015002) oxidoreductase activity, acting on a heme group of donors, oxygen as acceptor(GO:0016676) |
| 0.2 | 0.7 | GO:0034437 | glycoprotein transporter activity(GO:0034437) |
| 0.2 | 23.7 | GO:0016820 | hydrolase activity, acting on acid anhydrides, catalyzing transmembrane movement of substances(GO:0016820) |
| 0.2 | 1.0 | GO:0003747 | translation release factor activity(GO:0003747) translation termination factor activity(GO:0008079) |
| 0.2 | 5.6 | GO:0016706 | oxidoreductase activity, acting on paired donors, with incorporation or reduction of molecular oxygen, 2-oxoglutarate as one donor, and incorporation of one atom each of oxygen into both donors(GO:0016706) |
| 0.2 | 5.3 | GO:0043548 | phosphatidylinositol 3-kinase binding(GO:0043548) |
| 0.2 | 1.2 | GO:0016681 | ubiquinol-cytochrome-c reductase activity(GO:0008121) oxidoreductase activity, acting on diphenols and related substances as donors(GO:0016679) oxidoreductase activity, acting on diphenols and related substances as donors, cytochrome as acceptor(GO:0016681) |
| 0.2 | 0.8 | GO:1904315 | neurotransmitter receptor activity involved in regulation of postsynaptic membrane potential(GO:0099529) transmitter-gated ion channel activity involved in regulation of postsynaptic membrane potential(GO:1904315) |
| 0.2 | 5.1 | GO:0070840 | dynein complex binding(GO:0070840) |
| 0.2 | 8.4 | GO:0005160 | transforming growth factor beta receptor binding(GO:0005160) |
| 0.2 | 1.9 | GO:0035256 | G-protein coupled glutamate receptor binding(GO:0035256) |
| 0.2 | 0.6 | GO:0004140 | dephospho-CoA kinase activity(GO:0004140) |
| 0.2 | 1.1 | GO:1990599 | 3' overhang single-stranded DNA endodeoxyribonuclease activity(GO:1990599) |
| 0.2 | 4.3 | GO:0017147 | Wnt-protein binding(GO:0017147) |
| 0.2 | 0.6 | GO:0016971 | flavin-linked sulfhydryl oxidase activity(GO:0016971) thiol oxidase activity(GO:0016972) |
| 0.2 | 3.8 | GO:0016769 | transferase activity, transferring nitrogenous groups(GO:0016769) |
| 0.2 | 1.2 | GO:0051880 | G-quadruplex DNA binding(GO:0051880) |
| 0.1 | 0.6 | GO:0005166 | neurotrophin p75 receptor binding(GO:0005166) |
| 0.1 | 0.9 | GO:0016802 | adenosylhomocysteinase activity(GO:0004013) trialkylsulfonium hydrolase activity(GO:0016802) |
| 0.1 | 4.9 | GO:0008307 | structural constituent of muscle(GO:0008307) |
| 0.1 | 1.2 | GO:0016406 | carnitine O-acyltransferase activity(GO:0016406) |
| 0.1 | 0.4 | GO:0004960 | thromboxane receptor activity(GO:0004960) thromboxane A2 receptor activity(GO:0004961) |
| 0.1 | 4.8 | GO:0005245 | voltage-gated calcium channel activity(GO:0005245) |
| 0.1 | 0.7 | GO:0016907 | G-protein coupled acetylcholine receptor activity(GO:0016907) |
| 0.1 | 3.1 | GO:0051371 | muscle alpha-actinin binding(GO:0051371) |
| 0.1 | 1.9 | GO:0005132 | type I interferon receptor binding(GO:0005132) |
| 0.1 | 1.5 | GO:0016861 | intramolecular oxidoreductase activity, interconverting aldoses and ketoses(GO:0016861) |
| 0.1 | 0.7 | GO:0070097 | delta-catenin binding(GO:0070097) |
| 0.1 | 56.7 | GO:0005525 | GTP binding(GO:0005525) |
| 0.1 | 5.1 | GO:0030507 | spectrin binding(GO:0030507) |
| 0.1 | 4.1 | GO:0005184 | neuropeptide hormone activity(GO:0005184) |
| 0.1 | 2.1 | GO:0005247 | voltage-gated chloride channel activity(GO:0005247) |
| 0.1 | 4.7 | GO:0001972 | retinoic acid binding(GO:0001972) |
| 0.1 | 0.9 | GO:0008271 | secondary active sulfate transmembrane transporter activity(GO:0008271) |
| 0.1 | 0.8 | GO:0004035 | alkaline phosphatase activity(GO:0004035) |
| 0.1 | 0.3 | GO:0052895 | norspermine:oxygen oxidoreductase activity(GO:0052894) N1-acetylspermine:oxygen oxidoreductase (N1-acetylspermidine-forming) activity(GO:0052895) |
| 0.1 | 0.4 | GO:0008431 | vitamin E binding(GO:0008431) |
| 0.1 | 4.4 | GO:0005484 | SNAP receptor activity(GO:0005484) |
| 0.1 | 1.7 | GO:0031994 | insulin-like growth factor I binding(GO:0031994) |
| 0.1 | 0.5 | GO:0004994 | somatostatin receptor activity(GO:0004994) |
| 0.1 | 1.8 | GO:0015467 | G-protein activated inward rectifier potassium channel activity(GO:0015467) |
| 0.1 | 2.5 | GO:0008188 | neuropeptide receptor activity(GO:0008188) |
| 0.1 | 0.3 | GO:0015389 | pyrimidine- and adenine-specific:sodium symporter activity(GO:0015389) |
| 0.1 | 20.3 | GO:0004866 | endopeptidase inhibitor activity(GO:0004866) |
| 0.1 | 1.9 | GO:0008093 | cytoskeletal adaptor activity(GO:0008093) |
| 0.1 | 1.5 | GO:0015125 | bile acid transmembrane transporter activity(GO:0015125) |
| 0.1 | 10.4 | GO:0005200 | structural constituent of cytoskeleton(GO:0005200) |
| 0.1 | 0.4 | GO:0034481 | chondroitin sulfotransferase activity(GO:0034481) |
| 0.1 | 1.0 | GO:0005172 | vascular endothelial growth factor receptor binding(GO:0005172) |
| 0.1 | 7.9 | GO:0005179 | hormone activity(GO:0005179) |
| 0.1 | 1.2 | GO:0097109 | neuroligin family protein binding(GO:0097109) |
| 0.1 | 0.3 | GO:0004694 | eukaryotic translation initiation factor 2alpha kinase activity(GO:0004694) |
| 0.1 | 0.3 | GO:0016262 | protein N-acetylglucosaminyltransferase activity(GO:0016262) |
| 0.1 | 4.5 | GO:0004843 | thiol-dependent ubiquitin-specific protease activity(GO:0004843) |
| 0.1 | 0.3 | GO:0004740 | pyruvate dehydrogenase (acetyl-transferring) kinase activity(GO:0004740) |
| 0.1 | 8.6 | GO:0019888 | protein phosphatase regulator activity(GO:0019888) |
| 0.1 | 30.6 | GO:0031625 | ubiquitin protein ligase binding(GO:0031625) |
| 0.1 | 3.6 | GO:0005544 | calcium-dependent phospholipid binding(GO:0005544) |
| 0.1 | 3.8 | GO:0004364 | glutathione transferase activity(GO:0004364) |
| 0.1 | 0.1 | GO:0003968 | RNA-directed RNA polymerase activity(GO:0003968) |
| 0.1 | 3.8 | GO:0015459 | potassium channel regulator activity(GO:0015459) |
| 0.1 | 0.2 | GO:0070984 | SET domain binding(GO:0070984) |
| 0.1 | 0.3 | GO:0097603 | temperature-gated ion channel activity(GO:0097603) |
| 0.1 | 1.2 | GO:0004143 | diacylglycerol kinase activity(GO:0004143) |
| 0.1 | 2.8 | GO:0016765 | transferase activity, transferring alkyl or aryl (other than methyl) groups(GO:0016765) |
| 0.1 | 1.1 | GO:0004559 | alpha-mannosidase activity(GO:0004559) |
| 0.1 | 4.5 | GO:0005507 | copper ion binding(GO:0005507) |
| 0.1 | 0.3 | GO:0005025 | transforming growth factor beta receptor activity, type I(GO:0005025) |
| 0.1 | 0.2 | GO:0047493 | sphingomyelin synthase activity(GO:0033188) ceramide cholinephosphotransferase activity(GO:0047493) |
| 0.1 | 1.1 | GO:0035198 | miRNA binding(GO:0035198) |
| 0.1 | 1.1 | GO:0004089 | carbonate dehydratase activity(GO:0004089) |
| 0.1 | 0.9 | GO:0003993 | acid phosphatase activity(GO:0003993) |
| 0.1 | 0.8 | GO:0050750 | low-density lipoprotein particle receptor binding(GO:0050750) |
| 0.1 | 0.4 | GO:0097322 | 7SK snRNA binding(GO:0097322) |
| 0.1 | 0.8 | GO:0005251 | delayed rectifier potassium channel activity(GO:0005251) |
| 0.1 | 4.1 | GO:0001618 | virus receptor activity(GO:0001618) |
| 0.1 | 8.8 | GO:0061630 | ubiquitin protein ligase activity(GO:0061630) |
| 0.1 | 0.5 | GO:0086080 | protein binding involved in heterotypic cell-cell adhesion(GO:0086080) |
| 0.0 | 32.8 | GO:0005509 | calcium ion binding(GO:0005509) |
| 0.0 | 0.1 | GO:0034353 | RNA pyrophosphohydrolase activity(GO:0034353) |
| 0.0 | 0.7 | GO:0004602 | glutathione peroxidase activity(GO:0004602) |
| 0.0 | 0.3 | GO:0004749 | ribose phosphate diphosphokinase activity(GO:0004749) |
| 0.0 | 1.7 | GO:0050699 | WW domain binding(GO:0050699) |
| 0.0 | 0.3 | GO:1901612 | cardiolipin binding(GO:1901612) |
| 0.0 | 0.2 | GO:0042296 | ISG15 transferase activity(GO:0042296) |
| 0.0 | 2.3 | GO:0050661 | NADP binding(GO:0050661) |
| 0.0 | 0.8 | GO:0015347 | sodium-independent organic anion transmembrane transporter activity(GO:0015347) |
| 0.0 | 0.2 | GO:0005041 | low-density lipoprotein receptor activity(GO:0005041) |
| 0.0 | 0.2 | GO:0097493 | structural molecule activity conferring elasticity(GO:0097493) |
| 0.0 | 3.7 | GO:0004222 | metalloendopeptidase activity(GO:0004222) |
| 0.0 | 6.3 | GO:0000287 | magnesium ion binding(GO:0000287) |
| 0.0 | 0.5 | GO:0032266 | phosphatidylinositol-3-phosphate binding(GO:0032266) |
| 0.0 | 1.3 | GO:0001205 | transcriptional activator activity, RNA polymerase II distal enhancer sequence-specific binding(GO:0001205) |
| 0.0 | 1.7 | GO:0003730 | mRNA 3'-UTR binding(GO:0003730) |
| 0.0 | 0.3 | GO:0005112 | Notch binding(GO:0005112) |
| 0.0 | 1.2 | GO:0004984 | olfactory receptor activity(GO:0004984) |
| 0.0 | 0.5 | GO:0002020 | protease binding(GO:0002020) |
| 0.0 | 0.4 | GO:0005528 | macrolide binding(GO:0005527) FK506 binding(GO:0005528) |
| 0.0 | 0.2 | GO:0050693 | LBD domain binding(GO:0050693) |
| 0.0 | 0.3 | GO:0004653 | polypeptide N-acetylgalactosaminyltransferase activity(GO:0004653) |
| 0.0 | 3.7 | GO:0008022 | protein C-terminus binding(GO:0008022) |
| 0.0 | 1.0 | GO:0004714 | transmembrane receptor protein tyrosine kinase activity(GO:0004714) |
| 0.0 | 0.8 | GO:0097110 | scaffold protein binding(GO:0097110) |
| 0.0 | 1.6 | GO:0051082 | unfolded protein binding(GO:0051082) |
| 0.0 | 1.0 | GO:0004402 | histone acetyltransferase activity(GO:0004402) |
| 0.0 | 0.7 | GO:0030165 | PDZ domain binding(GO:0030165) |
| 0.0 | 0.2 | GO:0038191 | neuropilin binding(GO:0038191) |
| 0.0 | 0.0 | GO:0004814 | arginine-tRNA ligase activity(GO:0004814) |
| 0.0 | 1.3 | GO:0003707 | steroid hormone receptor activity(GO:0003707) |
| 0.0 | 0.4 | GO:0005546 | phosphatidylinositol-4,5-bisphosphate binding(GO:0005546) |
| 0.0 | 1.1 | GO:0047485 | protein N-terminus binding(GO:0047485) |
| 0.0 | 0.0 | GO:0019211 | phosphatase activator activity(GO:0019211) |
| 0.0 | 0.3 | GO:0051183 | vitamin transporter activity(GO:0051183) |
Gene overrepresentation in C2:CP category:
| Log-likelihood per target | Total log-likelihood | Term | Description |
|---|---|---|---|
| 0.6 | 10.0 | PID P38 GAMMA DELTA PATHWAY | Signaling mediated by p38-gamma and p38-delta |
| 0.5 | 17.1 | ST GAQ PATHWAY | G alpha q Pathway |
| 0.5 | 16.3 | PID SYNDECAN 3 PATHWAY | Syndecan-3-mediated signaling events |
| 0.4 | 41.2 | PID INTEGRIN1 PATHWAY | Beta1 integrin cell surface interactions |
| 0.4 | 19.1 | SIG CD40PATHWAYMAP | Genes related to CD40 signaling |
| 0.3 | 8.0 | PID S1P S1P2 PATHWAY | S1P2 pathway |
| 0.3 | 7.6 | PID ERB GENOMIC PATHWAY | Validated nuclear estrogen receptor beta network |
| 0.3 | 7.9 | PID ARF 3PATHWAY | Arf1 pathway |
| 0.3 | 30.4 | PID P75 NTR PATHWAY | p75(NTR)-mediated signaling |
| 0.3 | 8.4 | PID INSULIN GLUCOSE PATHWAY | Insulin-mediated glucose transport |
| 0.3 | 1.0 | PID PDGFRA PATHWAY | PDGFR-alpha signaling pathway |
| 0.2 | 5.9 | ST WNT CA2 CYCLIC GMP PATHWAY | Wnt/Ca2+/cyclic GMP signaling. |
| 0.2 | 6.1 | PID WNT SIGNALING PATHWAY | Wnt signaling network |
| 0.2 | 41.0 | NABA ECM GLYCOPROTEINS | Genes encoding structural ECM glycoproteins |
| 0.2 | 7.6 | PID NETRIN PATHWAY | Netrin-mediated signaling events |
| 0.2 | 21.2 | PID AR PATHWAY | Coregulation of Androgen receptor activity |
| 0.2 | 2.6 | PID VEGF VEGFR PATHWAY | VEGF and VEGFR signaling network |
| 0.2 | 3.3 | SA G1 AND S PHASES | Cdk2, 4, and 6 bind cyclin D in G1, while cdk2/cyclin E promotes the G1/S transition. |
| 0.1 | 1.4 | PID P38 MK2 PATHWAY | p38 signaling mediated by MAPKAP kinases |
| 0.1 | 2.4 | PID HEDGEHOG GLI PATHWAY | Hedgehog signaling events mediated by Gli proteins |
| 0.1 | 10.4 | PID ERA GENOMIC PATHWAY | Validated nuclear estrogen receptor alpha network |
| 0.1 | 1.7 | PID S1P META PATHWAY | Sphingosine 1-phosphate (S1P) pathway |
| 0.1 | 5.2 | PID HNF3A PATHWAY | FOXA1 transcription factor network |
| 0.1 | 2.8 | NABA COLLAGENS | Genes encoding collagen proteins |
| 0.1 | 1.5 | ST GA13 PATHWAY | G alpha 13 Pathway |
| 0.1 | 2.1 | PID IGF1 PATHWAY | IGF1 pathway |
| 0.1 | 3.2 | PID UPA UPAR PATHWAY | Urokinase-type plasminogen activator (uPA) and uPAR-mediated signaling |
| 0.1 | 4.2 | PID IL12 STAT4 PATHWAY | IL12 signaling mediated by STAT4 |
| 0.1 | 2.4 | PID SYNDECAN 4 PATHWAY | Syndecan-4-mediated signaling events |
| 0.1 | 1.2 | ST WNT BETA CATENIN PATHWAY | Wnt/beta-catenin Pathway |
| 0.1 | 3.3 | PID RXR VDR PATHWAY | RXR and RAR heterodimerization with other nuclear receptor |
| 0.1 | 19.1 | NABA ECM REGULATORS | Genes encoding enzymes and their regulators involved in the remodeling of the extracellular matrix |
| 0.1 | 11.8 | NABA ECM AFFILIATED | Genes encoding proteins affiliated structurally or functionally to extracellular matrix proteins |
| 0.1 | 0.5 | PID NECTIN PATHWAY | Nectin adhesion pathway |
| 0.1 | 1.3 | PID CDC42 PATHWAY | CDC42 signaling events |
| 0.0 | 0.6 | PID PRL SIGNALING EVENTS PATHWAY | Signaling events mediated by PRL |
| 0.0 | 0.5 | PID IL6 7 PATHWAY | IL6-mediated signaling events |
| 0.0 | 2.4 | PID RAC1 PATHWAY | RAC1 signaling pathway |
| 0.0 | 0.6 | PID EPHA FWDPATHWAY | EPHA forward signaling |
| 0.0 | 0.5 | PID ARF6 DOWNSTREAM PATHWAY | Arf6 downstream pathway |
| 0.0 | 1.2 | PID ECADHERIN STABILIZATION PATHWAY | Stabilization and expansion of the E-cadherin adherens junction |
| 0.0 | 1.6 | PID ATM PATHWAY | ATM pathway |
| 0.0 | 11.6 | NABA SECRETED FACTORS | Genes encoding secreted soluble factors |
| 0.0 | 1.3 | PID FGF PATHWAY | FGF signaling pathway |
| 0.0 | 1.5 | PID ALPHA SYNUCLEIN PATHWAY | Alpha-synuclein signaling |
| 0.0 | 0.3 | PID BMP PATHWAY | BMP receptor signaling |
| 0.0 | 1.0 | PID ATR PATHWAY | ATR signaling pathway |
| 0.0 | 1.2 | PID NOTCH PATHWAY | Notch signaling pathway |
| 0.0 | 0.3 | PID PI3K PLC TRK PATHWAY | Trk receptor signaling mediated by PI3K and PLC-gamma |
| 0.0 | 0.3 | PID AVB3 INTEGRIN PATHWAY | Integrins in angiogenesis |
| 0.0 | 1.4 | PID ERBB1 DOWNSTREAM PATHWAY | ErbB1 downstream signaling |
| 0.0 | 0.5 | PID CASPASE PATHWAY | Caspase cascade in apoptosis |
| 0.0 | 0.9 | PID HIF1 TFPATHWAY | HIF-1-alpha transcription factor network |
| 0.0 | 0.3 | PID CD40 PATHWAY | CD40/CD40L signaling |
| 0.0 | 0.1 | PID FAK PATHWAY | Signaling events mediated by focal adhesion kinase |
| 0.0 | 0.1 | PID ANGIOPOIETIN RECEPTOR PATHWAY | Angiopoietin receptor Tie2-mediated signaling |
Gene overrepresentation in C2:CP:REACTOME category:
| Log-likelihood per target | Total log-likelihood | Term | Description |
|---|---|---|---|
| 2.2 | 2.2 | REACTOME NEGATIVE REGULATION OF THE PI3K AKT NETWORK | Genes involved in Negative regulation of the PI3K/AKT network |
| 1.7 | 12.2 | REACTOME TANDEM PORE DOMAIN POTASSIUM CHANNELS | Genes involved in Tandem pore domain potassium channels |
| 1.2 | 24.4 | REACTOME RAS ACTIVATION UOPN CA2 INFUX THROUGH NMDA RECEPTOR | Genes involved in Ras activation uopn Ca2+ infux through NMDA receptor |
| 0.8 | 24.3 | REACTOME INSULIN RECEPTOR RECYCLING | Genes involved in Insulin receptor recycling |
| 0.7 | 6.7 | REACTOME SYNTHESIS OF BILE ACIDS AND BILE SALTS VIA 24 HYDROXYCHOLESTEROL | Genes involved in Synthesis of bile acids and bile salts via 24-hydroxycholesterol |
| 0.6 | 8.4 | REACTOME ACTIVATION OF CHAPERONE GENES BY ATF6 ALPHA | Genes involved in Activation of Chaperone Genes by ATF6-alpha |
| 0.6 | 18.9 | REACTOME SPHINGOLIPID DE NOVO BIOSYNTHESIS | Genes involved in Sphingolipid de novo biosynthesis |
| 0.5 | 7.9 | REACTOME ACTIVATION OF THE AP1 FAMILY OF TRANSCRIPTION FACTORS | Genes involved in Activation of the AP-1 family of transcription factors |
| 0.5 | 16.8 | REACTOME BOTULINUM NEUROTOXICITY | Genes involved in Botulinum neurotoxicity |
| 0.4 | 28.4 | REACTOME COLLAGEN FORMATION | Genes involved in Collagen formation |
| 0.4 | 23.5 | REACTOME MYOGENESIS | Genes involved in Myogenesis |
| 0.4 | 7.3 | REACTOME INITIAL TRIGGERING OF COMPLEMENT | Genes involved in Initial triggering of complement |
| 0.4 | 55.4 | REACTOME RESPONSE TO ELEVATED PLATELET CYTOSOLIC CA2 | Genes involved in Response to elevated platelet cytosolic Ca2+ |
| 0.4 | 11.8 | REACTOME GABA A RECEPTOR ACTIVATION | Genes involved in GABA A receptor activation |
| 0.4 | 3.0 | REACTOME PROSTACYCLIN SIGNALLING THROUGH PROSTACYCLIN RECEPTOR | Genes involved in Prostacyclin signalling through prostacyclin receptor |
| 0.3 | 11.2 | REACTOME CASPASE MEDIATED CLEAVAGE OF CYTOSKELETAL PROTEINS | Genes involved in Caspase-mediated cleavage of cytoskeletal proteins |
| 0.3 | 12.5 | REACTOME BASIGIN INTERACTIONS | Genes involved in Basigin interactions |
| 0.3 | 5.1 | REACTOME SOS MEDIATED SIGNALLING | Genes involved in SOS-mediated signalling |
| 0.3 | 1.2 | REACTOME SIGNALING BY NOTCH4 | Genes involved in Signaling by NOTCH4 |
| 0.3 | 4.6 | REACTOME HDL MEDIATED LIPID TRANSPORT | Genes involved in HDL-mediated lipid transport |
| 0.3 | 7.5 | REACTOME ASSOCIATION OF TRIC CCT WITH TARGET PROTEINS DURING BIOSYNTHESIS | Genes involved in Association of TriC/CCT with target proteins during biosynthesis |
| 0.2 | 5.3 | REACTOME TRAFFICKING OF GLUR2 CONTAINING AMPA RECEPTORS | Genes involved in Trafficking of GluR2-containing AMPA receptors |
| 0.2 | 7.3 | REACTOME INHIBITION OF INSULIN SECRETION BY ADRENALINE NORADRENALINE | Genes involved in Inhibition of Insulin Secretion by Adrenaline/Noradrenaline |
| 0.2 | 6.8 | REACTOME RECYCLING PATHWAY OF L1 | Genes involved in Recycling pathway of L1 |
| 0.2 | 4.1 | REACTOME SYNTHESIS OF PIPS AT THE GOLGI MEMBRANE | Genes involved in Synthesis of PIPs at the Golgi membrane |
| 0.2 | 2.8 | REACTOME SYNTHESIS OF BILE ACIDS AND BILE SALTS | Genes involved in Synthesis of bile acids and bile salts |
| 0.2 | 4.8 | REACTOME ADHERENS JUNCTIONS INTERACTIONS | Genes involved in Adherens junctions interactions |
| 0.2 | 6.1 | REACTOME KERATAN SULFATE BIOSYNTHESIS | Genes involved in Keratan sulfate biosynthesis |
| 0.2 | 7.4 | REACTOME GLYCOLYSIS | Genes involved in Glycolysis |
| 0.2 | 5.1 | REACTOME G ALPHA1213 SIGNALLING EVENTS | Genes involved in G alpha (12/13) signalling events |
| 0.2 | 3.3 | REACTOME TRAFFICKING OF AMPA RECEPTORS | Genes involved in Trafficking of AMPA receptors |
| 0.2 | 7.8 | REACTOME TRANSPORT TO THE GOLGI AND SUBSEQUENT MODIFICATION | Genes involved in Transport to the Golgi and subsequent modification |
| 0.1 | 3.3 | REACTOME ENOS ACTIVATION AND REGULATION | Genes involved in eNOS activation and regulation |
| 0.1 | 0.9 | REACTOME DSCAM INTERACTIONS | Genes involved in DSCAM interactions |
| 0.1 | 6.6 | REACTOME SPHINGOLIPID METABOLISM | Genes involved in Sphingolipid metabolism |
| 0.1 | 3.0 | REACTOME YAP1 AND WWTR1 TAZ STIMULATED GENE EXPRESSION | Genes involved in YAP1- and WWTR1 (TAZ)-stimulated gene expression |
| 0.1 | 2.1 | REACTOME HYALURONAN UPTAKE AND DEGRADATION | Genes involved in Hyaluronan uptake and degradation |
| 0.1 | 15.3 | REACTOME GLYCEROPHOSPHOLIPID BIOSYNTHESIS | Genes involved in Glycerophospholipid biosynthesis |
| 0.1 | 3.0 | REACTOME OTHER SEMAPHORIN INTERACTIONS | Genes involved in Other semaphorin interactions |
| 0.1 | 4.0 | REACTOME INTERACTION BETWEEN L1 AND ANKYRINS | Genes involved in Interaction between L1 and Ankyrins |
| 0.1 | 3.8 | REACTOME POST TRANSLATIONAL MODIFICATION SYNTHESIS OF GPI ANCHORED PROTEINS | Genes involved in Post-translational modification: synthesis of GPI-anchored proteins |
| 0.1 | 6.6 | REACTOME NETRIN1 SIGNALING | Genes involved in Netrin-1 signaling |
| 0.1 | 0.6 | REACTOME RETROGRADE NEUROTROPHIN SIGNALLING | Genes involved in Retrograde neurotrophin signalling |
| 0.1 | 11.8 | REACTOME P75 NTR RECEPTOR MEDIATED SIGNALLING | Genes involved in p75 NTR receptor-mediated signalling |
| 0.1 | 5.3 | REACTOME ACTIVATION OF CHAPERONE GENES BY XBP1S | Genes involved in Activation of Chaperone Genes by XBP1(S) |
| 0.1 | 5.7 | REACTOME ASPARAGINE N LINKED GLYCOSYLATION | Genes involved in Asparagine N-linked glycosylation |
| 0.1 | 3.0 | REACTOME CYTOSOLIC SULFONATION OF SMALL MOLECULES | Genes involved in Cytosolic sulfonation of small molecules |
| 0.1 | 10.5 | REACTOME MHC CLASS II ANTIGEN PRESENTATION | Genes involved in MHC class II antigen presentation |
| 0.1 | 7.5 | REACTOME INTEGRIN CELL SURFACE INTERACTIONS | Genes involved in Integrin cell surface interactions |
| 0.1 | 7.6 | REACTOME PHASE II CONJUGATION | Genes involved in Phase II conjugation |
| 0.1 | 1.8 | REACTOME INHIBITION OF VOLTAGE GATED CA2 CHANNELS VIA GBETA GAMMA SUBUNITS | Genes involved in Inhibition of voltage gated Ca2+ channels via Gbeta/gamma subunits |
| 0.1 | 7.6 | REACTOME TRANSCRIPTIONAL REGULATION OF WHITE ADIPOCYTE DIFFERENTIATION | Genes involved in Transcriptional Regulation of White Adipocyte Differentiation |
| 0.1 | 3.7 | REACTOME RAP1 SIGNALLING | Genes involved in Rap1 signalling |
| 0.1 | 2.3 | REACTOME SIGNALING BY NODAL | Genes involved in Signaling by NODAL |
| 0.1 | 1.5 | REACTOME SYNTHESIS SECRETION AND INACTIVATION OF GLP1 | Genes involved in Synthesis, Secretion, and Inactivation of Glucagon-like Peptide-1 (GLP-1) |
| 0.1 | 1.2 | REACTOME MRNA DECAY BY 5 TO 3 EXORIBONUCLEASE | Genes involved in mRNA Decay by 5' to 3' Exoribonuclease |
| 0.1 | 1.8 | REACTOME PREFOLDIN MEDIATED TRANSFER OF SUBSTRATE TO CCT TRIC | Genes involved in Prefoldin mediated transfer of substrate to CCT/TriC |
| 0.1 | 1.5 | REACTOME TRANSPORT OF ORGANIC ANIONS | Genes involved in Transport of organic anions |
| 0.1 | 1.1 | REACTOME REVERSIBLE HYDRATION OF CARBON DIOXIDE | Genes involved in Reversible Hydration of Carbon Dioxide |
| 0.1 | 1.4 | REACTOME REGULATION OF RHEB GTPASE ACTIVITY BY AMPK | Genes involved in Regulation of Rheb GTPase activity by AMPK |
| 0.1 | 2.1 | REACTOME CHONDROITIN SULFATE BIOSYNTHESIS | Genes involved in Chondroitin sulfate biosynthesis |
| 0.1 | 0.8 | REACTOME INHIBITION OF REPLICATION INITIATION OF DAMAGED DNA BY RB1 E2F1 | Genes involved in Inhibition of replication initiation of damaged DNA by RB1/E2F1 |
| 0.1 | 1.5 | REACTOME FORMATION OF ATP BY CHEMIOSMOTIC COUPLING | Genes involved in Formation of ATP by chemiosmotic coupling |
| 0.1 | 1.6 | REACTOME GLUCONEOGENESIS | Genes involved in Gluconeogenesis |
| 0.1 | 1.0 | REACTOME PD1 SIGNALING | Genes involved in PD-1 signaling |
| 0.1 | 0.7 | REACTOME IONOTROPIC ACTIVITY OF KAINATE RECEPTORS | Genes involved in Ionotropic activity of Kainate Receptors |
| 0.1 | 1.5 | REACTOME SULFUR AMINO ACID METABOLISM | Genes involved in Sulfur amino acid metabolism |
| 0.1 | 0.7 | REACTOME PURINE CATABOLISM | Genes involved in Purine catabolism |
| 0.1 | 1.2 | REACTOME PEROXISOMAL LIPID METABOLISM | Genes involved in Peroxisomal lipid metabolism |
| 0.1 | 3.7 | REACTOME CHEMOKINE RECEPTORS BIND CHEMOKINES | Genes involved in Chemokine receptors bind chemokines |
| 0.1 | 1.2 | REACTOME EFFECTS OF PIP2 HYDROLYSIS | Genes involved in Effects of PIP2 hydrolysis |
| 0.1 | 1.9 | REACTOME REGULATION OF IFNA SIGNALING | Genes involved in Regulation of IFNA signaling |
| 0.1 | 0.9 | REACTOME ABCA TRANSPORTERS IN LIPID HOMEOSTASIS | Genes involved in ABCA transporters in lipid homeostasis |
| 0.1 | 2.5 | REACTOME REGULATION OF INSULIN SECRETION | Genes involved in Regulation of Insulin Secretion |
| 0.1 | 1.7 | REACTOME SIGNALING BY ROBO RECEPTOR | Genes involved in Signaling by Robo receptor |
| 0.0 | 1.9 | REACTOME INTERFERON ALPHA BETA SIGNALING | Genes involved in Interferon alpha/beta signaling |
| 0.0 | 0.2 | REACTOME NEF MEDIATED DOWNREGULATION OF MHC CLASS I COMPLEX CELL SURFACE EXPRESSION | Genes involved in Nef mediated downregulation of MHC class I complex cell surface expression |
| 0.0 | 0.7 | REACTOME TIE2 SIGNALING | Genes involved in Tie2 Signaling |
| 0.0 | 1.1 | REACTOME AMINO ACID SYNTHESIS AND INTERCONVERSION TRANSAMINATION | Genes involved in Amino acid synthesis and interconversion (transamination) |
| 0.0 | 3.3 | REACTOME NUCLEAR RECEPTOR TRANSCRIPTION PATHWAY | Genes involved in Nuclear Receptor transcription pathway |
| 0.0 | 3.1 | REACTOME AMYLOIDS | Genes involved in Amyloids |
| 0.0 | 0.8 | REACTOME ORGANIC CATION ANION ZWITTERION TRANSPORT | Genes involved in Organic cation/anion/zwitterion transport |
| 0.0 | 1.1 | REACTOME FORMATION OF INCISION COMPLEX IN GG NER | Genes involved in Formation of incision complex in GG-NER |
| 0.0 | 1.7 | REACTOME MITOCHONDRIAL PROTEIN IMPORT | Genes involved in Mitochondrial Protein Import |
| 0.0 | 0.6 | REACTOME ENDOGENOUS STEROLS | Genes involved in Endogenous sterols |
| 0.0 | 0.7 | REACTOME REGULATION OF INSULIN LIKE GROWTH FACTOR IGF ACTIVITY BY INSULIN LIKE GROWTH FACTOR BINDING PROTEINS IGFBPS | Genes involved in Regulation of Insulin-like Growth Factor (IGF) Activity by Insulin-like Growth Factor Binding Proteins (IGFBPs) |
| 0.0 | 2.4 | REACTOME RESPIRATORY ELECTRON TRANSPORT | Genes involved in Respiratory electron transport |
| 0.0 | 1.7 | REACTOME G ALPHA Q SIGNALLING EVENTS | Genes involved in G alpha (q) signalling events |
| 0.0 | 1.4 | REACTOME SMOOTH MUSCLE CONTRACTION | Genes involved in Smooth Muscle Contraction |
| 0.0 | 0.4 | REACTOME ELONGATION ARREST AND RECOVERY | Genes involved in Elongation arrest and recovery |
| 0.0 | 2.6 | REACTOME PEPTIDE LIGAND BINDING RECEPTORS | Genes involved in Peptide ligand-binding receptors |
| 0.0 | 0.3 | REACTOME REGULATION OF PYRUVATE DEHYDROGENASE PDH COMPLEX | Genes involved in Regulation of pyruvate dehydrogenase (PDH) complex |
| 0.0 | 0.7 | REACTOME NOTCH1 INTRACELLULAR DOMAIN REGULATES TRANSCRIPTION | Genes involved in NOTCH1 Intracellular Domain Regulates Transcription |
| 0.0 | 0.2 | REACTOME TERMINATION OF O GLYCAN BIOSYNTHESIS | Genes involved in Termination of O-glycan biosynthesis |
| 0.0 | 0.9 | REACTOME METABOLISM OF VITAMINS AND COFACTORS | Genes involved in Metabolism of vitamins and cofactors |
| 0.0 | 0.3 | REACTOME SIGNALING BY BMP | Genes involved in Signaling by BMP |
| 0.0 | 0.1 | REACTOME VEGF LIGAND RECEPTOR INTERACTIONS | Genes involved in VEGF ligand-receptor interactions |