Project
GNF SymAtlas + NCI-60 cancer cell lines, comparison of cancers vs non-cancers, human (Su, 2004; Ross, 2000)
Navigation
Downloads
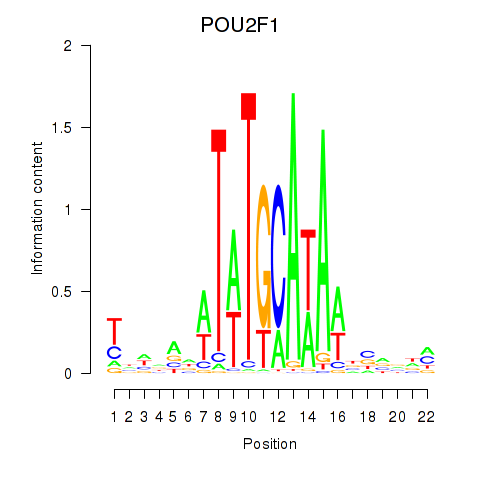
Results for POU2F1
Z-value: 0.17
Motif logo
Transcription factors associated with POU2F1
| Gene Symbol | Gene ID | Gene Info |
|---|---|---|
|
POU2F1
|
ENSG00000143190.17 | POU class 2 homeobox 1 |
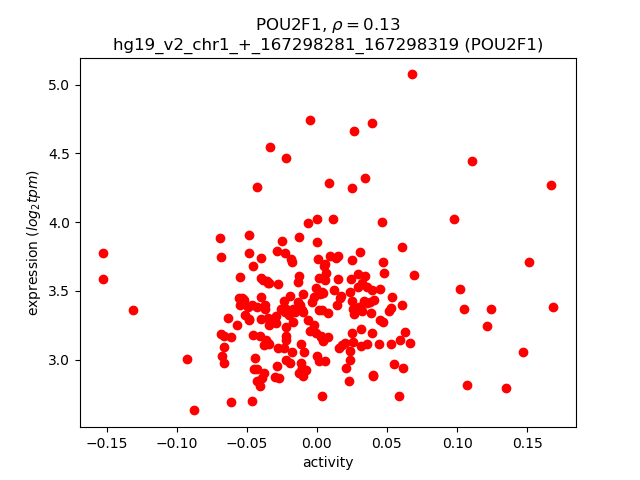
Activity-expression correlation:
| Gene | Promoter | Pearson corr. coef. | P-value | Plot |
|---|---|---|---|---|
| POU2F1 | hg19_v2_chr1_+_167298281_167298319 | 0.13 | 6.2e-02 | Click! |
Activity profile of POU2F1 motif
Sorted Z-values of POU2F1 motif
| Promoter | Log-likelihood | Transcript | Gene | Gene Info |
|---|---|---|---|---|
| chr2_+_90060377 | 25.11 |
ENST00000436451.2
|
IGKV6D-21
|
immunoglobulin kappa variable 6D-21 (non-functional) |
| chr2_-_89459813 | 23.84 |
ENST00000390256.2
|
IGKV6-21
|
immunoglobulin kappa variable 6-21 (non-functional) |
| chr2_+_90108504 | 22.98 |
ENST00000390271.2
|
IGKV6D-41
|
immunoglobulin kappa variable 6D-41 (non-functional) |
| chr11_-_58343319 | 17.46 |
ENST00000395074.2
|
LPXN
|
leupaxin |
| chr14_-_106642049 | 15.80 |
ENST00000390605.2
|
IGHV1-18
|
immunoglobulin heavy variable 1-18 |
| chr21_+_10862622 | 15.68 |
ENST00000302092.5
ENST00000559480.1 |
IGHV1OR21-1
|
immunoglobulin heavy variable 1/OR21-1 (non-functional) |
| chr2_+_89890533 | 15.16 |
ENST00000429992.2
|
IGKV2D-40
|
immunoglobulin kappa variable 2D-40 |
| chr14_-_106733624 | 14.72 |
ENST00000390610.2
|
IGHV1-24
|
immunoglobulin heavy variable 1-24 |
| chr14_-_106539557 | 14.57 |
ENST00000390599.2
|
IGHV1-8
|
immunoglobulin heavy variable 1-8 |
| chr3_-_121379739 | 14.00 |
ENST00000428394.2
ENST00000314583.3 |
HCLS1
|
hematopoietic cell-specific Lyn substrate 1 |
| chr2_-_89292422 | 13.12 |
ENST00000495489.1
|
IGKV1-8
|
immunoglobulin kappa variable 1-8 |
| chr3_-_107777208 | 12.39 |
ENST00000398258.3
|
CD47
|
CD47 molecule |
| chr3_-_155524049 | 12.34 |
ENST00000534941.1
ENST00000340171.2 |
C3orf33
|
chromosome 3 open reading frame 33 |
| chr2_-_89521942 | 12.00 |
ENST00000482769.1
|
IGKV2-28
|
immunoglobulin kappa variable 2-28 |
| chr2_+_89975669 | 11.43 |
ENST00000474213.1
|
IGKV2D-30
|
immunoglobulin kappa variable 2D-30 |
| chr1_-_160681593 | 11.12 |
ENST00000368045.3
ENST00000368046.3 |
CD48
|
CD48 molecule |
| chr14_-_107078851 | 10.85 |
ENST00000390628.2
|
IGHV1-58
|
immunoglobulin heavy variable 1-58 |
| chr2_-_89545079 | 10.65 |
ENST00000468494.1
|
IGKV2-30
|
immunoglobulin kappa variable 2-30 |
| chr2_-_88285309 | 10.51 |
ENST00000420840.2
|
RGPD2
|
RANBP2-like and GRIP domain containing 2 |
| chr15_-_22448819 | 10.01 |
ENST00000604066.1
|
IGHV1OR15-1
|
immunoglobulin heavy variable 1/OR15-1 (non-functional) |
| chr14_-_106453155 | 9.81 |
ENST00000390594.2
|
IGHV1-2
|
immunoglobulin heavy variable 1-2 |
| chr1_+_158801095 | 9.64 |
ENST00000368141.4
|
MNDA
|
myeloid cell nuclear differentiation antigen |
| chr1_-_25291475 | 9.18 |
ENST00000338888.3
ENST00000399916.1 |
RUNX3
|
runt-related transcription factor 3 |
| chr15_-_22473353 | 8.96 |
ENST00000557788.2
|
IGHV4OR15-8
|
immunoglobulin heavy variable 4/OR15-8 (non-functional) |
| chr8_-_117768023 | 8.27 |
ENST00000518949.1
ENST00000522453.1 ENST00000521861.1 ENST00000518995.1 |
EIF3H
|
eukaryotic translation initiation factor 3, subunit H |
| chr14_-_107283278 | 8.19 |
ENST00000390639.2
|
IGHV7-81
|
immunoglobulin heavy variable 7-81 (non-functional) |
| chr2_+_89999259 | 7.88 |
ENST00000558026.1
|
IGKV2D-28
|
immunoglobulin kappa variable 2D-28 |
| chr2_+_90458201 | 7.78 |
ENST00000603238.1
|
CH17-132F21.1
|
Uncharacterized protein |
| chr14_+_21249200 | 7.54 |
ENST00000304677.2
|
RNASE6
|
ribonuclease, RNase A family, k6 |
| chr6_+_135502408 | 7.03 |
ENST00000341911.5
ENST00000442647.2 ENST00000316528.8 |
MYB
|
v-myb avian myeloblastosis viral oncogene homolog |
| chr14_-_106967788 | 6.89 |
ENST00000390622.2
|
IGHV1-46
|
immunoglobulin heavy variable 1-46 |
| chr6_+_135502466 | 6.86 |
ENST00000367814.4
|
MYB
|
v-myb avian myeloblastosis viral oncogene homolog |
| chr14_-_106471723 | 6.65 |
ENST00000390595.2
|
IGHV1-3
|
immunoglobulin heavy variable 1-3 |
| chr3_+_133292574 | 6.45 |
ENST00000264993.3
|
CDV3
|
CDV3 homolog (mouse) |
| chrX_-_135962876 | 6.18 |
ENST00000431446.3
ENST00000570135.1 ENST00000320676.7 ENST00000562646.1 |
RBMX
|
RNA binding motif protein, X-linked |
| chr5_-_98262240 | 6.07 |
ENST00000284049.3
|
CHD1
|
chromodomain helicase DNA binding protein 1 |
| chr2_+_87135076 | 6.05 |
ENST00000409776.2
|
RGPD1
|
RANBP2-like and GRIP domain containing 1 |
| chr1_-_146082633 | 5.62 |
ENST00000605317.1
ENST00000604938.1 ENST00000339388.5 |
NBPF11
|
neuroblastoma breakpoint family, member 11 |
| chr15_-_55541227 | 5.38 |
ENST00000566877.1
|
RAB27A
|
RAB27A, member RAS oncogene family |
| chr4_+_68424434 | 5.34 |
ENST00000265404.2
ENST00000396225.1 |
STAP1
|
signal transducing adaptor family member 1 |
| chr15_+_48623208 | 5.32 |
ENST00000559935.1
ENST00000559416.1 |
DUT
|
deoxyuridine triphosphatase |
| chr22_+_23029188 | 5.10 |
ENST00000390305.2
|
IGLV3-25
|
immunoglobulin lambda variable 3-25 |
| chr10_+_79793518 | 5.08 |
ENST00000440692.1
ENST00000435275.1 ENST00000372360.3 ENST00000360830.4 |
RPS24
|
ribosomal protein S24 |
| chr11_-_14521379 | 5.06 |
ENST00000249923.3
ENST00000529866.1 ENST00000439561.2 ENST00000534771.1 |
COPB1
|
coatomer protein complex, subunit beta 1 |
| chr9_-_86593238 | 4.94 |
ENST00000351839.3
|
HNRNPK
|
heterogeneous nuclear ribonucleoprotein K |
| chr4_+_70861647 | 4.82 |
ENST00000246895.4
ENST00000381060.2 |
STATH
|
statherin |
| chr12_-_118797475 | 4.79 |
ENST00000541786.1
ENST00000419821.2 ENST00000541878.1 |
TAOK3
|
TAO kinase 3 |
| chr1_+_146373546 | 4.77 |
ENST00000446760.2
|
NBPF12
|
neuroblastoma breakpoint family, member 12 |
| chr1_+_104293028 | 4.62 |
ENST00000370079.3
|
AMY1C
|
amylase, alpha 1C (salivary) |
| chr15_+_80364901 | 4.58 |
ENST00000560228.1
ENST00000559835.1 ENST00000559775.1 ENST00000558688.1 ENST00000560392.1 ENST00000560976.1 ENST00000558272.1 ENST00000558390.1 |
ZFAND6
|
zinc finger, AN1-type domain 6 |
| chr22_+_23089870 | 4.46 |
ENST00000390311.2
|
IGLV3-16
|
immunoglobulin lambda variable 3-16 |
| chr2_-_152684977 | 4.30 |
ENST00000428992.2
ENST00000295087.8 |
ARL5A
|
ADP-ribosylation factor-like 5A |
| chr1_+_104159999 | 4.30 |
ENST00000414303.2
ENST00000423678.1 |
AMY2A
|
amylase, alpha 2A (pancreatic) |
| chr19_-_9731872 | 4.20 |
ENST00000424629.1
ENST00000326044.5 ENST00000354661.4 ENST00000435550.1 ENST00000444611.1 ENST00000421525.1 |
ZNF561
|
zinc finger protein 561 |
| chr7_+_64838786 | 3.96 |
ENST00000450302.2
|
ZNF92
|
zinc finger protein 92 |
| chr9_+_124088860 | 3.86 |
ENST00000373806.1
|
GSN
|
gelsolin |
| chr8_-_6837602 | 3.60 |
ENST00000382692.2
|
DEFA1
|
defensin, alpha 1 |
| chr12_-_91546926 | 3.57 |
ENST00000550758.1
|
DCN
|
decorin |
| chr3_-_58200398 | 3.51 |
ENST00000318316.3
ENST00000460422.1 ENST00000483681.1 |
DNASE1L3
|
deoxyribonuclease I-like 3 |
| chr7_+_64838712 | 3.51 |
ENST00000328747.7
ENST00000431504.1 ENST00000357512.2 |
ZNF92
|
zinc finger protein 92 |
| chr1_-_226926864 | 3.48 |
ENST00000429204.1
ENST00000366784.1 |
ITPKB
|
inositol-trisphosphate 3-kinase B |
| chr6_+_135502501 | 3.46 |
ENST00000527615.1
ENST00000420123.2 ENST00000525369.1 ENST00000528774.1 ENST00000534121.1 ENST00000534044.1 ENST00000533624.1 |
MYB
|
v-myb avian myeloblastosis viral oncogene homolog |
| chr3_-_3221358 | 2.99 |
ENST00000424814.1
ENST00000450014.1 ENST00000231948.4 ENST00000432408.2 |
CRBN
|
cereblon |
| chr6_-_152489484 | 2.99 |
ENST00000354674.4
ENST00000539504.1 |
SYNE1
|
spectrin repeat containing, nuclear envelope 1 |
| chr15_-_63448973 | 2.96 |
ENST00000462430.1
|
RPS27L
|
ribosomal protein S27-like |
| chr14_-_106791536 | 2.86 |
ENST00000390613.2
|
IGHV3-30
|
immunoglobulin heavy variable 3-30 |
| chr1_-_223308098 | 2.78 |
ENST00000342210.6
|
TLR5
|
toll-like receptor 5 |
| chr20_+_39657454 | 2.70 |
ENST00000361337.2
|
TOP1
|
topoisomerase (DNA) I |
| chr11_-_128457446 | 2.50 |
ENST00000392668.4
|
ETS1
|
v-ets avian erythroblastosis virus E26 oncogene homolog 1 |
| chr6_-_132834184 | 2.50 |
ENST00000367941.2
ENST00000367937.4 |
STX7
|
syntaxin 7 |
| chr2_+_162087577 | 2.49 |
ENST00000439442.1
|
TANK
|
TRAF family member-associated NFKB activator |
| chr5_-_176326333 | 2.49 |
ENST00000292432.5
|
HK3
|
hexokinase 3 (white cell) |
| chr20_+_36373032 | 2.48 |
ENST00000373473.1
|
CTNNBL1
|
catenin, beta like 1 |
| chr10_+_13628921 | 2.45 |
ENST00000378572.3
|
PRPF18
|
pre-mRNA processing factor 18 |
| chr8_+_86121448 | 2.42 |
ENST00000520225.1
|
E2F5
|
E2F transcription factor 5, p130-binding |
| chr5_+_67588391 | 2.41 |
ENST00000523872.1
|
PIK3R1
|
phosphoinositide-3-kinase, regulatory subunit 1 (alpha) |
| chr18_-_52989217 | 2.33 |
ENST00000570287.2
|
TCF4
|
transcription factor 4 |
| chr7_+_7606497 | 2.30 |
ENST00000340080.4
ENST00000405785.1 ENST00000433635.1 |
MIOS
|
missing oocyte, meiosis regulator, homolog (Drosophila) |
| chr21_-_33975547 | 2.28 |
ENST00000431599.1
|
C21orf59
|
chromosome 21 open reading frame 59 |
| chr19_+_17858547 | 2.01 |
ENST00000600676.1
ENST00000600209.1 ENST00000596309.1 ENST00000598539.1 ENST00000597474.1 ENST00000593385.1 ENST00000598067.1 ENST00000593833.1 |
FCHO1
|
FCH domain only 1 |
| chr2_-_74007193 | 1.85 |
ENST00000377706.4
ENST00000443070.1 ENST00000272444.3 |
DUSP11
|
dual specificity phosphatase 11 (RNA/RNP complex 1-interacting) |
| chr3_+_149530836 | 1.80 |
ENST00000466478.1
ENST00000491086.1 ENST00000467977.1 |
RNF13
|
ring finger protein 13 |
| chr1_+_28562617 | 1.75 |
ENST00000497986.1
ENST00000335514.5 ENST00000468425.2 ENST00000465645.1 |
ATPIF1
|
ATPase inhibitory factor 1 |
| chr8_-_49833978 | 1.58 |
ENST00000020945.1
|
SNAI2
|
snail family zinc finger 2 |
| chr6_+_26124373 | 1.55 |
ENST00000377791.2
ENST00000602637.1 |
HIST1H2AC
|
histone cluster 1, H2ac |
| chr4_-_153274078 | 1.51 |
ENST00000263981.5
|
FBXW7
|
F-box and WD repeat domain containing 7, E3 ubiquitin protein ligase |
| chr6_-_13621126 | 1.49 |
ENST00000600057.1
|
AL441883.1
|
Uncharacterized protein |
| chr3_+_196466710 | 1.42 |
ENST00000327134.3
|
PAK2
|
p21 protein (Cdc42/Rac)-activated kinase 2 |
| chr19_+_17858509 | 1.39 |
ENST00000594202.1
ENST00000252771.7 ENST00000389133.4 |
FCHO1
|
FCH domain only 1 |
| chr10_-_116286563 | 1.39 |
ENST00000369253.2
|
ABLIM1
|
actin binding LIM protein 1 |
| chr17_+_45728427 | 1.37 |
ENST00000540627.1
|
KPNB1
|
karyopherin (importin) beta 1 |
| chr8_-_93107827 | 1.33 |
ENST00000520724.1
ENST00000518844.1 |
RUNX1T1
|
runt-related transcription factor 1; translocated to, 1 (cyclin D-related) |
| chr12_-_111358372 | 1.31 |
ENST00000548438.1
ENST00000228841.8 |
MYL2
|
myosin, light chain 2, regulatory, cardiac, slow |
| chr18_+_3252206 | 1.19 |
ENST00000578562.2
|
MYL12A
|
myosin, light chain 12A, regulatory, non-sarcomeric |
| chr1_+_161736072 | 1.12 |
ENST00000367942.3
|
ATF6
|
activating transcription factor 6 |
| chr17_+_75181292 | 1.09 |
ENST00000431431.2
|
SEC14L1
|
SEC14-like 1 (S. cerevisiae) |
| chr4_+_74301880 | 0.98 |
ENST00000395792.2
ENST00000226359.2 |
AFP
|
alpha-fetoprotein |
| chr1_+_100436065 | 0.97 |
ENST00000370153.1
|
SLC35A3
|
solute carrier family 35 (UDP-N-acetylglucosamine (UDP-GlcNAc) transporter), member A3 |
| chr4_-_100356551 | 0.93 |
ENST00000209665.4
|
ADH7
|
alcohol dehydrogenase 7 (class IV), mu or sigma polypeptide |
| chr2_-_113594279 | 0.92 |
ENST00000416750.1
ENST00000418817.1 ENST00000263341.2 |
IL1B
|
interleukin 1, beta |
| chr15_-_55489097 | 0.87 |
ENST00000260443.4
|
RSL24D1
|
ribosomal L24 domain containing 1 |
| chr4_-_100356291 | 0.81 |
ENST00000476959.1
ENST00000482593.1 |
ADH7
|
alcohol dehydrogenase 7 (class IV), mu or sigma polypeptide |
| chr2_+_71205742 | 0.77 |
ENST00000360589.3
|
ANKRD53
|
ankyrin repeat domain 53 |
| chr9_+_135854091 | 0.72 |
ENST00000450530.1
ENST00000534944.1 |
GFI1B
|
growth factor independent 1B transcription repressor |
| chr9_+_12693336 | 0.72 |
ENST00000381137.2
ENST00000388918.5 |
TYRP1
|
tyrosinase-related protein 1 |
| chr7_-_14026063 | 0.70 |
ENST00000443608.1
ENST00000438956.1 |
ETV1
|
ets variant 1 |
| chr16_+_81070792 | 0.69 |
ENST00000564241.1
ENST00000565237.1 |
ATMIN
|
ATM interactor |
| chr16_-_18908196 | 0.60 |
ENST00000565324.1
ENST00000561947.1 |
SMG1
|
SMG1 phosphatidylinositol 3-kinase-related kinase |
| chr3_-_46249878 | 0.57 |
ENST00000296140.3
|
CCR1
|
chemokine (C-C motif) receptor 1 |
| chr17_+_34391625 | 0.56 |
ENST00000004921.3
|
CCL18
|
chemokine (C-C motif) ligand 18 (pulmonary and activation-regulated) |
| chrX_-_19988382 | 0.53 |
ENST00000356980.3
ENST00000379687.3 ENST00000379682.4 |
CXorf23
|
chromosome X open reading frame 23 |
| chr16_+_33629600 | 0.53 |
ENST00000562905.2
|
IGHV3OR16-13
|
immunoglobulin heavy variable 3/OR16-13 (non-functional) |
| chr5_-_111092873 | 0.51 |
ENST00000509025.1
ENST00000515855.1 |
NREP
|
neuronal regeneration related protein |
| chr3_+_101546827 | 0.50 |
ENST00000461724.1
ENST00000483180.1 ENST00000394054.2 |
NFKBIZ
|
nuclear factor of kappa light polypeptide gene enhancer in B-cells inhibitor, zeta |
| chr5_-_111093081 | 0.47 |
ENST00000453526.2
ENST00000509427.1 |
NREP
|
neuronal regeneration related protein |
| chr1_+_152975488 | 0.42 |
ENST00000542696.1
|
SPRR3
|
small proline-rich protein 3 |
| chr8_-_93107696 | 0.38 |
ENST00000436581.2
ENST00000520583.1 ENST00000519061.1 |
RUNX1T1
|
runt-related transcription factor 1; translocated to, 1 (cyclin D-related) |
| chr2_+_102615416 | 0.30 |
ENST00000393414.2
|
IL1R2
|
interleukin 1 receptor, type II |
| chr4_-_110723194 | 0.26 |
ENST00000394635.3
|
CFI
|
complement factor I |
| chr3_+_157154578 | 0.25 |
ENST00000295927.3
|
PTX3
|
pentraxin 3, long |
| chr10_-_115904361 | 0.21 |
ENST00000428953.1
ENST00000543782.1 |
C10orf118
|
chromosome 10 open reading frame 118 |
| chr18_+_616711 | 0.18 |
ENST00000579494.1
|
CLUL1
|
clusterin-like 1 (retinal) |
| chr2_+_219524379 | 0.15 |
ENST00000443791.1
ENST00000359273.3 ENST00000392109.1 ENST00000392110.2 ENST00000423377.1 ENST00000392111.2 ENST00000412366.1 |
BCS1L
|
BC1 (ubiquinol-cytochrome c reductase) synthesis-like |
| chr17_+_7387677 | 0.11 |
ENST00000322644.6
|
POLR2A
|
polymerase (RNA) II (DNA directed) polypeptide A, 220kDa |
| chr2_+_204571198 | 0.11 |
ENST00000374481.3
ENST00000458610.2 ENST00000324106.8 |
CD28
|
CD28 molecule |
| chr2_+_110551851 | 0.09 |
ENST00000272454.6
ENST00000430736.1 ENST00000016946.3 ENST00000441344.1 |
RGPD5
|
RANBP2-like and GRIP domain containing 5 |
| chr1_+_25598872 | 0.07 |
ENST00000328664.4
|
RHD
|
Rh blood group, D antigen |
| chrX_-_130423386 | 0.06 |
ENST00000370903.3
|
IGSF1
|
immunoglobulin superfamily, member 1 |
| chr2_-_113191096 | 0.05 |
ENST00000496537.1
ENST00000330575.5 ENST00000302558.3 |
RGPD8
|
RANBP2-like and GRIP domain containing 8 |
| chr4_-_110723335 | 0.04 |
ENST00000394634.2
|
CFI
|
complement factor I |
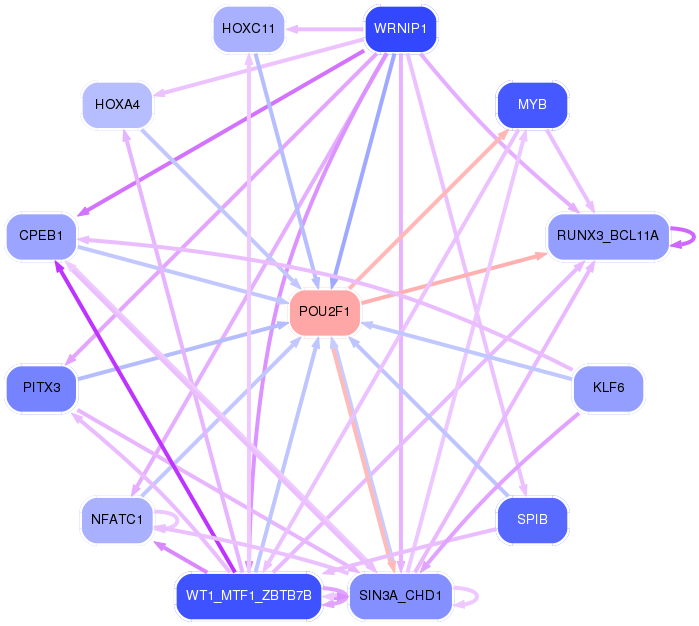
Network of associatons between targets according to the STRING database.

First level regulatory network of POU2F1
Gene Ontology Analysis
Gene overrepresentation in biological_process category:
| Log-likelihood per target | Total log-likelihood | Term | Description |
|---|---|---|---|
| 5.8 | 17.3 | GO:1904899 | regulation of hepatic stellate cell proliferation(GO:1904897) positive regulation of hepatic stellate cell proliferation(GO:1904899) hepatic stellate cell proliferation(GO:1990922) |
| 2.2 | 17.5 | GO:0050859 | negative regulation of B cell receptor signaling pathway(GO:0050859) |
| 1.8 | 5.3 | GO:1903973 | negative regulation of macrophage colony-stimulating factor signaling pathway(GO:1902227) negative regulation of response to macrophage colony-stimulating factor(GO:1903970) negative regulation of cellular response to macrophage colony-stimulating factor stimulus(GO:1903973) |
| 1.8 | 5.3 | GO:0046081 | dUTP metabolic process(GO:0046080) dUTP catabolic process(GO:0046081) |
| 1.2 | 4.9 | GO:0072369 | regulation of lipid transport by positive regulation of transcription from RNA polymerase II promoter(GO:0072369) |
| 1.2 | 3.6 | GO:0035915 | pore formation in membrane of other organism(GO:0035915) |
| 1.1 | 12.6 | GO:0008228 | opsonization(GO:0008228) |
| 1.0 | 143.0 | GO:0006958 | complement activation, classical pathway(GO:0006958) |
| 0.9 | 2.8 | GO:0034146 | toll-like receptor 5 signaling pathway(GO:0034146) |
| 0.9 | 0.9 | GO:0060559 | positive regulation of vitamin metabolic process(GO:0046136) positive regulation of vitamin D biosynthetic process(GO:0060557) positive regulation of calcidiol 1-monooxygenase activity(GO:0060559) |
| 0.9 | 5.4 | GO:1903435 | positive regulation of constitutive secretory pathway(GO:1903435) |
| 0.8 | 14.0 | GO:0045651 | positive regulation of granulocyte differentiation(GO:0030854) positive regulation of macrophage differentiation(GO:0045651) |
| 0.8 | 3.9 | GO:0044858 | plasma membrane raft distribution(GO:0044855) plasma membrane raft localization(GO:0044856) plasma membrane raft polarization(GO:0044858) regulation of plasma membrane raft polarization(GO:1903906) |
| 0.6 | 4.3 | GO:0044245 | polysaccharide digestion(GO:0044245) |
| 0.6 | 9.6 | GO:0030889 | negative regulation of B cell proliferation(GO:0030889) |
| 0.6 | 1.7 | GO:0010430 | fatty acid omega-oxidation(GO:0010430) |
| 0.6 | 16.7 | GO:0000042 | protein targeting to Golgi(GO:0000042) |
| 0.5 | 1.6 | GO:0070563 | negative regulation of vitamin D receptor signaling pathway(GO:0070563) |
| 0.5 | 1.6 | GO:0071030 | nuclear mRNA surveillance of spliceosomal pre-mRNA splicing(GO:0071030) nuclear retention of unspliced pre-mRNA at the site of transcription(GO:0071048) |
| 0.5 | 3.5 | GO:0033029 | regulation of neutrophil apoptotic process(GO:0033029) common myeloid progenitor cell proliferation(GO:0035726) |
| 0.5 | 78.6 | GO:0002377 | immunoglobulin production(GO:0002377) |
| 0.5 | 9.5 | GO:0048935 | peripheral nervous system neuron differentiation(GO:0048934) peripheral nervous system neuron development(GO:0048935) |
| 0.4 | 4.8 | GO:0046541 | saliva secretion(GO:0046541) |
| 0.4 | 2.5 | GO:2000158 | positive regulation of ubiquitin-specific protease activity(GO:2000158) |
| 0.4 | 6.1 | GO:0043923 | positive regulation by host of viral transcription(GO:0043923) |
| 0.4 | 1.1 | GO:0006990 | positive regulation of transcription from RNA polymerase II promoter involved in unfolded protein response(GO:0006990) |
| 0.4 | 1.9 | GO:0098501 | polynucleotide dephosphorylation(GO:0098501) |
| 0.4 | 1.4 | GO:2001271 | negative regulation of cysteine-type endopeptidase activity involved in execution phase of apoptosis(GO:2001271) |
| 0.3 | 1.4 | GO:0031291 | Ran protein signal transduction(GO:0031291) |
| 0.3 | 2.5 | GO:0030578 | PML body organization(GO:0030578) |
| 0.3 | 1.5 | GO:2000639 | regulation of SREBP signaling pathway(GO:2000638) negative regulation of SREBP signaling pathway(GO:2000639) |
| 0.3 | 3.0 | GO:0090292 | nuclear matrix anchoring at nuclear membrane(GO:0090292) |
| 0.3 | 3.6 | GO:1900747 | negative regulation of vascular endothelial growth factor signaling pathway(GO:1900747) |
| 0.3 | 6.2 | GO:0048026 | positive regulation of mRNA splicing, via spliceosome(GO:0048026) |
| 0.3 | 2.5 | GO:1902474 | positive regulation of protein localization to synapse(GO:1902474) |
| 0.3 | 3.0 | GO:0090073 | positive regulation of protein homodimerization activity(GO:0090073) |
| 0.2 | 1.7 | GO:1901526 | positive regulation of macromitophagy(GO:1901526) positive regulation of mitophagy in response to mitochondrial depolarization(GO:1904925) |
| 0.2 | 2.7 | GO:0040016 | embryonic cleavage(GO:0040016) |
| 0.2 | 0.9 | GO:1902626 | assembly of large subunit precursor of preribosome(GO:1902626) |
| 0.2 | 3.0 | GO:0000028 | ribosomal small subunit assembly(GO:0000028) |
| 0.2 | 3.5 | GO:0010623 | programmed cell death involved in cell development(GO:0010623) |
| 0.2 | 2.5 | GO:0033120 | positive regulation of RNA splicing(GO:0033120) |
| 0.2 | 4.6 | GO:0006625 | protein targeting to peroxisome(GO:0006625) protein localization to peroxisome(GO:0072662) establishment of protein localization to peroxisome(GO:0072663) |
| 0.2 | 5.1 | GO:0006891 | intra-Golgi vesicle-mediated transport(GO:0006891) |
| 0.2 | 1.3 | GO:0098735 | positive regulation of the force of heart contraction(GO:0098735) |
| 0.1 | 1.0 | GO:0090481 | pyrimidine nucleotide-sugar transmembrane transport(GO:0090481) |
| 0.1 | 2.8 | GO:0007095 | mitotic G2 DNA damage checkpoint(GO:0007095) |
| 0.1 | 5.1 | GO:0000462 | maturation of SSU-rRNA from tricistronic rRNA transcript (SSU-rRNA, 5.8S rRNA, LSU-rRNA)(GO:0000462) |
| 0.1 | 3.4 | GO:0048268 | clathrin coat assembly(GO:0048268) |
| 0.1 | 1.1 | GO:0039536 | negative regulation of RIG-I signaling pathway(GO:0039536) |
| 0.1 | 11.1 | GO:0002819 | regulation of adaptive immune response(GO:0002819) |
| 0.1 | 4.0 | GO:0019731 | antibacterial humoral response(GO:0019731) |
| 0.1 | 7.6 | GO:0070373 | negative regulation of ERK1 and ERK2 cascade(GO:0070373) |
| 0.1 | 1.7 | GO:0006091 | generation of precursor metabolites and energy(GO:0006091) |
| 0.1 | 0.7 | GO:0048023 | positive regulation of melanin biosynthetic process(GO:0048023) positive regulation of secondary metabolite biosynthetic process(GO:1900378) |
| 0.1 | 0.3 | GO:0032690 | negative regulation of interleukin-1 alpha production(GO:0032690) negative regulation of interleukin-1 alpha secretion(GO:0050712) |
| 0.1 | 2.5 | GO:0051156 | glucose 6-phosphate metabolic process(GO:0051156) |
| 0.1 | 8.3 | GO:0006446 | regulation of translational initiation(GO:0006446) |
| 0.1 | 0.6 | GO:1902412 | regulation of mitotic cytokinesis(GO:1902412) |
| 0.1 | 0.9 | GO:0001542 | ovulation from ovarian follicle(GO:0001542) |
| 0.1 | 2.3 | GO:0032008 | positive regulation of TOR signaling(GO:0032008) |
| 0.0 | 9.9 | GO:0002250 | adaptive immune response(GO:0002250) |
| 0.0 | 0.6 | GO:0090026 | dendritic cell chemotaxis(GO:0002407) positive regulation of monocyte chemotaxis(GO:0090026) |
| 0.0 | 0.7 | GO:1902857 | positive regulation of nonmotile primary cilium assembly(GO:1902857) |
| 0.0 | 0.7 | GO:0051569 | regulation of histone H3-K4 methylation(GO:0051569) |
| 0.0 | 1.8 | GO:0051865 | protein autoubiquitination(GO:0051865) |
| 0.0 | 0.9 | GO:0030032 | lamellipodium assembly(GO:0030032) |
| 0.0 | 0.1 | GO:0017062 | respiratory chain complex III assembly(GO:0017062) mitochondrial respiratory chain complex III assembly(GO:0034551) mitochondrial respiratory chain complex III biogenesis(GO:0097033) |
| 0.0 | 1.2 | GO:0070527 | platelet aggregation(GO:0070527) |
| 0.0 | 0.6 | GO:0048247 | lymphocyte chemotaxis(GO:0048247) |
Gene overrepresentation in cellular_component category:
| Log-likelihood per target | Total log-likelihood | Term | Description |
|---|---|---|---|
| 1.3 | 65.4 | GO:0042571 | immunoglobulin complex, circulating(GO:0042571) |
| 1.2 | 6.2 | GO:0044530 | supraspliceosomal complex(GO:0044530) |
| 0.9 | 8.3 | GO:0071541 | eukaryotic translation initiation factor 3 complex, eIF3m(GO:0071541) |
| 0.9 | 2.7 | GO:0009330 | DNA topoisomerase complex (ATP-hydrolyzing)(GO:0009330) |
| 0.6 | 2.4 | GO:1990578 | perinuclear endoplasmic reticulum membrane(GO:1990578) |
| 0.5 | 1.6 | GO:0071020 | post-spliceosomal complex(GO:0071020) |
| 0.5 | 5.1 | GO:0030126 | COPI vesicle coat(GO:0030126) |
| 0.4 | 5.4 | GO:0033093 | Weibel-Palade body(GO:0033093) |
| 0.4 | 22.4 | GO:0002102 | podosome(GO:0002102) |
| 0.3 | 2.3 | GO:0061700 | GATOR2 complex(GO:0061700) |
| 0.3 | 3.6 | GO:0098647 | collagen type VI trimer(GO:0005589) collagen beaded filament(GO:0098647) |
| 0.2 | 3.0 | GO:0034993 | microtubule organizing center attachment site(GO:0034992) LINC complex(GO:0034993) |
| 0.2 | 1.5 | GO:1990452 | Parkin-FBXW7-Cul1 ubiquitin ligase complex(GO:1990452) |
| 0.2 | 2.6 | GO:0000974 | Prp19 complex(GO:0000974) |
| 0.2 | 30.3 | GO:0072562 | blood microparticle(GO:0072562) |
| 0.2 | 2.0 | GO:0031464 | Cul4A-RING E3 ubiquitin ligase complex(GO:0031464) |
| 0.1 | 19.8 | GO:0016363 | nuclear matrix(GO:0016363) |
| 0.1 | 13.2 | GO:0035578 | azurophil granule lumen(GO:0035578) |
| 0.1 | 12.4 | GO:0070821 | tertiary granule membrane(GO:0070821) |
| 0.1 | 8.0 | GO:0022627 | cytosolic small ribosomal subunit(GO:0022627) |
| 0.1 | 11.1 | GO:0031225 | anchored component of membrane(GO:0031225) |
| 0.1 | 1.3 | GO:0097512 | cardiac myofibril(GO:0097512) |
| 0.1 | 1.4 | GO:0071782 | endoplasmic reticulum tubular network(GO:0071782) |
| 0.1 | 10.4 | GO:0001650 | fibrillar center(GO:0001650) |
| 0.1 | 0.7 | GO:0045009 | melanosome membrane(GO:0033162) chitosome(GO:0045009) |
| 0.1 | 1.7 | GO:0005753 | mitochondrial proton-transporting ATP synthase complex(GO:0005753) |
| 0.0 | 2.5 | GO:0031201 | SNARE complex(GO:0031201) |
| 0.0 | 56.1 | GO:0005615 | extracellular space(GO:0005615) |
| 0.0 | 8.8 | GO:0000790 | nuclear chromatin(GO:0000790) |
| 0.0 | 1.8 | GO:0005637 | nuclear inner membrane(GO:0005637) |
| 0.0 | 13.2 | GO:0005667 | transcription factor complex(GO:0005667) |
| 0.0 | 2.2 | GO:0005905 | clathrin-coated pit(GO:0005905) |
| 0.0 | 2.5 | GO:0101002 | ficolin-1-rich granule(GO:0101002) ficolin-1-rich granule lumen(GO:1904813) |
| 0.0 | 0.6 | GO:0009897 | external side of plasma membrane(GO:0009897) |
| 0.0 | 0.9 | GO:0022625 | cytosolic large ribosomal subunit(GO:0022625) |
| 0.0 | 0.1 | GO:0005750 | mitochondrial respiratory chain complex III(GO:0005750) respiratory chain complex III(GO:0045275) |
Gene overrepresentation in molecular_function category:
| Log-likelihood per target | Total log-likelihood | Term | Description |
|---|---|---|---|
| 1.8 | 5.3 | GO:0004170 | dUTP diphosphatase activity(GO:0004170) |
| 1.6 | 4.8 | GO:0046848 | hydroxyapatite binding(GO:0046848) |
| 1.6 | 17.3 | GO:0001135 | transcription factor activity, RNA polymerase II transcription factor recruiting(GO:0001135) |
| 1.2 | 12.4 | GO:0070053 | thrombospondin receptor activity(GO:0070053) |
| 1.2 | 65.4 | GO:0034987 | immunoglobulin receptor binding(GO:0034987) |
| 1.1 | 4.3 | GO:0016160 | amylase activity(GO:0016160) |
| 0.9 | 5.3 | GO:0005157 | macrophage colony-stimulating factor receptor binding(GO:0005157) |
| 0.9 | 162.9 | GO:0003823 | antigen binding(GO:0003823) |
| 0.6 | 1.9 | GO:0098519 | nucleotide phosphatase activity, acting on free nucleotides(GO:0098519) |
| 0.6 | 1.7 | GO:0030272 | 5-formyltetrahydrofolate cyclo-ligase activity(GO:0030272) |
| 0.6 | 3.5 | GO:0008440 | inositol-1,4,5-trisphosphate 3-kinase activity(GO:0008440) |
| 0.5 | 1.6 | GO:0000386 | second spliceosomal transesterification activity(GO:0000386) |
| 0.5 | 2.7 | GO:0003917 | DNA topoisomerase type I activity(GO:0003917) |
| 0.4 | 1.7 | GO:0035276 | aldehyde oxidase activity(GO:0004031) ethanol binding(GO:0035276) |
| 0.4 | 2.5 | GO:0035800 | deubiquitinase activator activity(GO:0035800) |
| 0.3 | 3.9 | GO:0045159 | myosin II binding(GO:0045159) |
| 0.3 | 2.5 | GO:0004340 | glucokinase activity(GO:0004340) hexokinase activity(GO:0004396) fructokinase activity(GO:0008865) mannokinase activity(GO:0019158) |
| 0.3 | 2.4 | GO:0043559 | insulin binding(GO:0043559) |
| 0.2 | 2.5 | GO:0019869 | chloride channel inhibitor activity(GO:0019869) |
| 0.2 | 3.4 | GO:0035612 | AP-2 adaptor complex binding(GO:0035612) |
| 0.2 | 5.4 | GO:0031489 | myosin V binding(GO:0031489) |
| 0.2 | 1.5 | GO:0050816 | phosphothreonine binding(GO:0050816) |
| 0.2 | 3.7 | GO:0005149 | interleukin-1 receptor binding(GO:0005149) |
| 0.2 | 1.1 | GO:0039552 | RIG-I binding(GO:0039552) |
| 0.2 | 2.3 | GO:0001087 | transcription factor activity, sequence-specific DNA binding, RNA polymerase recruiting(GO:0001011) transcription factor activity, TFIIB-class binding(GO:0001087) |
| 0.2 | 3.0 | GO:0008494 | translation activator activity(GO:0008494) |
| 0.2 | 8.3 | GO:0003743 | translation initiation factor activity(GO:0003743) |
| 0.1 | 6.1 | GO:0004003 | ATP-dependent DNA helicase activity(GO:0004003) |
| 0.1 | 1.0 | GO:0015165 | pyrimidine nucleotide-sugar transmembrane transporter activity(GO:0015165) |
| 0.1 | 5.1 | GO:0031369 | translation initiation factor binding(GO:0031369) |
| 0.1 | 1.3 | GO:0032036 | myosin heavy chain binding(GO:0032036) |
| 0.1 | 3.0 | GO:0005521 | lamin binding(GO:0005521) |
| 0.1 | 4.6 | GO:0031593 | polyubiquitin binding(GO:0031593) |
| 0.1 | 14.7 | GO:0001085 | RNA polymerase II transcription factor binding(GO:0001085) |
| 0.1 | 1.1 | GO:0035497 | cAMP response element binding(GO:0035497) |
| 0.1 | 2.5 | GO:0035035 | histone acetyltransferase binding(GO:0035035) |
| 0.1 | 3.5 | GO:0004520 | endodeoxyribonuclease activity(GO:0004520) |
| 0.1 | 0.3 | GO:0004910 | interleukin-1, Type II, blocking receptor activity(GO:0004910) |
| 0.1 | 6.4 | GO:0004860 | protein kinase inhibitor activity(GO:0004860) |
| 0.0 | 1.4 | GO:0030296 | protein tyrosine kinase activator activity(GO:0030296) |
| 0.0 | 4.9 | GO:0003697 | single-stranded DNA binding(GO:0003697) |
| 0.0 | 0.6 | GO:0019957 | C-C chemokine binding(GO:0019957) |
| 0.0 | 0.1 | GO:0003968 | RNA-directed RNA polymerase activity(GO:0003968) |
| 0.0 | 2.6 | GO:0004519 | endonuclease activity(GO:0004519) |
| 0.0 | 1.4 | GO:0008139 | nuclear localization sequence binding(GO:0008139) |
| 0.0 | 0.2 | GO:0046790 | virion binding(GO:0046790) |
| 0.0 | 5.2 | GO:0001047 | core promoter binding(GO:0001047) |
| 0.0 | 0.7 | GO:0070840 | dynein complex binding(GO:0070840) |
| 0.0 | 0.6 | GO:0042162 | telomeric DNA binding(GO:0042162) |
| 0.0 | 1.6 | GO:0003705 | transcription factor activity, RNA polymerase II distal enhancer sequence-specific binding(GO:0003705) |
| 0.0 | 6.2 | GO:0003712 | transcription cofactor activity(GO:0003712) |
| 0.0 | 0.6 | GO:0048020 | CCR chemokine receptor binding(GO:0048020) |
| 0.0 | 13.5 | GO:0003700 | nucleic acid binding transcription factor activity(GO:0001071) transcription factor activity, sequence-specific DNA binding(GO:0003700) |
Gene overrepresentation in C2:CP category:
| Log-likelihood per target | Total log-likelihood | Term | Description |
|---|---|---|---|
| 0.3 | 3.5 | ST PAC1 RECEPTOR PATHWAY | PAC1 Receptor Pathway |
| 0.3 | 19.7 | PID IL2 PI3K PATHWAY | IL2 signaling events mediated by PI3K |
| 0.2 | 15.4 | PID FCER1 PATHWAY | Fc-epsilon receptor I signaling in mast cells |
| 0.1 | 6.9 | PID KIT PATHWAY | Signaling events mediated by Stem cell factor receptor (c-Kit) |
| 0.1 | 5.2 | PID NCADHERIN PATHWAY | N-cadherin signaling events |
| 0.1 | 11.6 | PID SMAD2 3NUCLEAR PATHWAY | Regulation of nuclear SMAD2/3 signaling |
| 0.1 | 1.4 | PID SMAD2 3PATHWAY | Regulation of cytoplasmic and nuclear SMAD2/3 signaling |
| 0.1 | 2.8 | PID P38 MKK3 6PATHWAY | p38 MAPK signaling pathway |
| 0.1 | 3.6 | NABA PROTEOGLYCANS | Genes encoding proteoglycans |
| 0.1 | 0.9 | PID ANTHRAX PATHWAY | Cellular roles of Anthrax toxin |
| 0.1 | 2.5 | PID HIF2PATHWAY | HIF-2-alpha transcription factor network |
| 0.0 | 1.5 | PID MYC PATHWAY | C-MYC pathway |
| 0.0 | 3.7 | PID P53 DOWNSTREAM PATHWAY | Direct p53 effectors |
| 0.0 | 2.7 | PID CASPASE PATHWAY | Caspase cascade in apoptosis |
| 0.0 | 1.1 | PID P38 ALPHA BETA DOWNSTREAM PATHWAY | Signaling mediated by p38-alpha and p38-beta |
| 0.0 | 1.0 | PID HNF3B PATHWAY | FOXA2 and FOXA3 transcription factor networks |
| 0.0 | 0.3 | PID P38 MK2 PATHWAY | p38 signaling mediated by MAPKAP kinases |
| 0.0 | 0.3 | PID IL1 PATHWAY | IL1-mediated signaling events |
Gene overrepresentation in C2:CP:REACTOME category:
| Log-likelihood per target | Total log-likelihood | Term | Description |
|---|---|---|---|
| 0.8 | 8.9 | REACTOME DIGESTION OF DIETARY CARBOHYDRATE | Genes involved in Digestion of dietary carbohydrate |
| 0.5 | 5.1 | REACTOME COPI MEDIATED TRANSPORT | Genes involved in COPI Mediated Transport |
| 0.4 | 12.4 | REACTOME SIGNAL REGULATORY PROTEIN SIRP FAMILY INTERACTIONS | Genes involved in Signal regulatory protein (SIRP) family interactions |
| 0.2 | 1.7 | REACTOME ETHANOL OXIDATION | Genes involved in Ethanol oxidation |
| 0.2 | 5.4 | REACTOME INSULIN SYNTHESIS AND PROCESSING | Genes involved in Insulin Synthesis and Processing |
| 0.2 | 3.6 | REACTOME DEFENSINS | Genes involved in Defensins |
| 0.2 | 13.4 | REACTOME FORMATION OF THE TERNARY COMPLEX AND SUBSEQUENTLY THE 43S COMPLEX | Genes involved in Formation of the ternary complex, and subsequently, the 43S complex |
| 0.2 | 5.3 | REACTOME PYRIMIDINE METABOLISM | Genes involved in Pyrimidine metabolism |
| 0.1 | 2.5 | REACTOME TRAF6 MEDIATED IRF7 ACTIVATION | Genes involved in TRAF6 mediated IRF7 activation |
| 0.1 | 3.6 | REACTOME CS DS DEGRADATION | Genes involved in CS/DS degradation |
| 0.1 | 2.4 | REACTOME IL 7 SIGNALING | Genes involved in Interleukin-7 signaling |
| 0.1 | 3.9 | REACTOME CASPASE MEDIATED CLEAVAGE OF CYTOSKELETAL PROTEINS | Genes involved in Caspase-mediated cleavage of cytoskeletal proteins |
| 0.1 | 2.5 | REACTOME PROTEOLYTIC CLEAVAGE OF SNARE COMPLEX PROTEINS | Genes involved in Proteolytic cleavage of SNARE complex proteins |
| 0.1 | 11.1 | REACTOME CELL SURFACE INTERACTIONS AT THE VASCULAR WALL | Genes involved in Cell surface interactions at the vascular wall |
| 0.1 | 2.4 | REACTOME G0 AND EARLY G1 | Genes involved in G0 and Early G1 |
| 0.1 | 1.1 | REACTOME ACTIVATION OF CHAPERONE GENES BY ATF6 ALPHA | Genes involved in Activation of Chaperone Genes by ATF6-alpha |
| 0.1 | 1.2 | REACTOME CD28 DEPENDENT VAV1 PATHWAY | Genes involved in CD28 dependent Vav1 pathway |
| 0.1 | 1.4 | REACTOME APOPTOSIS INDUCED DNA FRAGMENTATION | Genes involved in Apoptosis induced DNA fragmentation |
| 0.1 | 11.2 | REACTOME MRNA SPLICING | Genes involved in mRNA Splicing |
| 0.1 | 0.9 | REACTOME DCC MEDIATED ATTRACTIVE SIGNALING | Genes involved in DCC mediated attractive signaling |
| 0.0 | 2.5 | REACTOME GLUCOSE TRANSPORT | Genes involved in Glucose transport |
| 0.0 | 1.5 | REACTOME ASSOCIATION OF TRIC CCT WITH TARGET PROTEINS DURING BIOSYNTHESIS | Genes involved in Association of TriC/CCT with target proteins during biosynthesis |
| 0.0 | 2.3 | REACTOME MYOGENESIS | Genes involved in Myogenesis |
| 0.0 | 1.0 | REACTOME TRANSPORT OF VITAMINS NUCLEOSIDES AND RELATED MOLECULES | Genes involved in Transport of vitamins, nucleosides, and related molecules |
| 0.0 | 5.9 | REACTOME GENERIC TRANSCRIPTION PATHWAY | Genes involved in Generic Transcription Pathway |
| 0.0 | 0.9 | REACTOME STRIATED MUSCLE CONTRACTION | Genes involved in Striated Muscle Contraction |