Project
GNF SymAtlas + NCI-60 cancer cell lines, comparison of cancers vs non-cancers, human (Su, 2004; Ross, 2000)
Navigation
Downloads
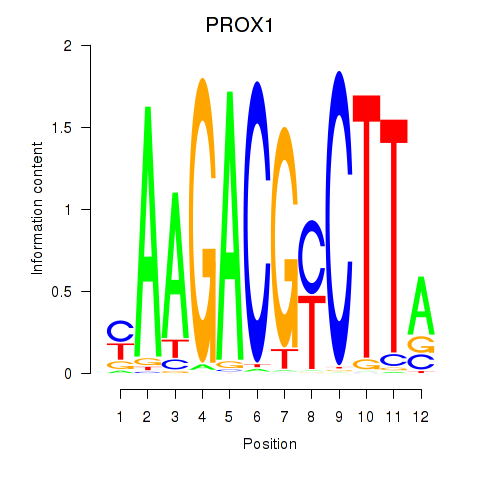
Results for PROX1
Z-value: 0.52
Motif logo
Transcription factors associated with PROX1
| Gene Symbol | Gene ID | Gene Info |
|---|---|---|
|
PROX1
|
ENSG00000117707.11 | prospero homeobox 1 |
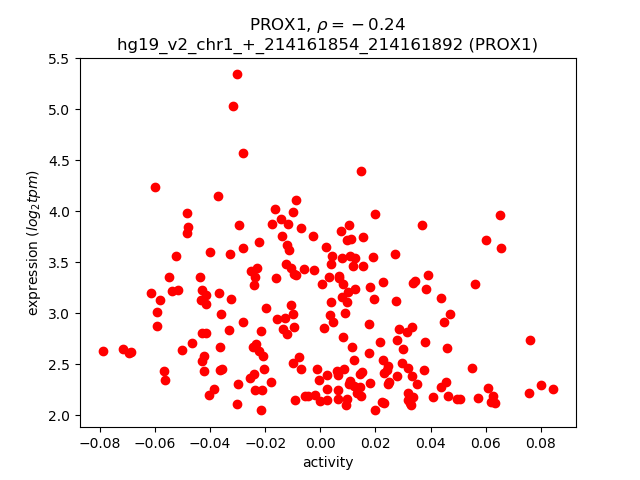
Activity-expression correlation:
| Gene | Promoter | Pearson corr. coef. | P-value | Plot |
|---|---|---|---|---|
| PROX1 | hg19_v2_chr1_+_214161854_214161892 | -0.24 | 4.4e-04 | Click! |
Activity profile of PROX1 motif
Sorted Z-values of PROX1 motif
| Promoter | Log-likelihood | Transcript | Gene | Gene Info |
|---|---|---|---|---|
| chr2_-_225434538 | 13.98 |
ENST00000409096.1
|
CUL3
|
cullin 3 |
| chr6_-_8102279 | 13.09 |
ENST00000488226.2
|
EEF1E1
|
eukaryotic translation elongation factor 1 epsilon 1 |
| chr19_+_6361754 | 9.19 |
ENST00000597326.1
|
CLPP
|
caseinolytic mitochondrial matrix peptidase proteolytic subunit |
| chr11_-_82997371 | 8.51 |
ENST00000525503.1
|
CCDC90B
|
coiled-coil domain containing 90B |
| chr21_-_26979786 | 8.29 |
ENST00000419219.1
ENST00000352957.4 ENST00000307301.7 |
MRPL39
|
mitochondrial ribosomal protein L39 |
| chr7_-_25164969 | 7.99 |
ENST00000305786.2
|
CYCS
|
cytochrome c, somatic |
| chrX_+_118602363 | 7.91 |
ENST00000317881.8
|
SLC25A5
|
solute carrier family 25 (mitochondrial carrier; adenine nucleotide translocator), member 5 |
| chr11_-_82997013 | 7.75 |
ENST00000529073.1
ENST00000529611.1 |
CCDC90B
|
coiled-coil domain containing 90B |
| chr1_+_165864821 | 7.12 |
ENST00000470820.1
|
UCK2
|
uridine-cytidine kinase 2 |
| chr15_-_91537723 | 7.08 |
ENST00000394249.3
ENST00000559811.1 ENST00000442656.2 ENST00000557905.1 ENST00000361919.3 |
PRC1
|
protein regulator of cytokinesis 1 |
| chr1_+_10459111 | 7.08 |
ENST00000541529.1
ENST00000270776.8 ENST00000483936.1 ENST00000538557.1 |
PGD
|
phosphogluconate dehydrogenase |
| chr10_-_121296045 | 7.06 |
ENST00000392865.1
|
RGS10
|
regulator of G-protein signaling 10 |
| chr17_+_66243715 | 6.98 |
ENST00000359904.3
|
AMZ2
|
archaelysin family metallopeptidase 2 |
| chr1_+_165864800 | 6.69 |
ENST00000469256.2
|
UCK2
|
uridine-cytidine kinase 2 |
| chr13_+_37581115 | 6.69 |
ENST00000481013.1
|
EXOSC8
|
exosome component 8 |
| chr5_+_154320623 | 6.42 |
ENST00000523037.1
ENST00000265229.8 ENST00000439747.3 ENST00000522038.1 |
MRPL22
|
mitochondrial ribosomal protein L22 |
| chr4_-_103747011 | 6.38 |
ENST00000350435.7
|
UBE2D3
|
ubiquitin-conjugating enzyme E2D 3 |
| chr16_-_28857677 | 6.24 |
ENST00000313511.3
|
TUFM
|
Tu translation elongation factor, mitochondrial |
| chr1_-_225616515 | 5.74 |
ENST00000338179.2
ENST00000425080.1 |
LBR
|
lamin B receptor |
| chr16_-_23607598 | 5.60 |
ENST00000562133.1
ENST00000570319.1 ENST00000007516.3 |
NDUFAB1
|
NADH dehydrogenase (ubiquinone) 1, alpha/beta subcomplex, 1, 8kDa |
| chr6_+_34725263 | 5.57 |
ENST00000374018.1
ENST00000374017.3 |
SNRPC
|
small nuclear ribonucleoprotein polypeptide C |
| chr5_-_157002775 | 5.30 |
ENST00000257527.4
|
ADAM19
|
ADAM metallopeptidase domain 19 |
| chr4_-_103746683 | 5.23 |
ENST00000504211.1
ENST00000508476.1 |
UBE2D3
|
ubiquitin-conjugating enzyme E2D 3 |
| chr2_-_42588338 | 5.10 |
ENST00000234301.2
|
COX7A2L
|
cytochrome c oxidase subunit VIIa polypeptide 2 like |
| chr11_+_60609537 | 4.94 |
ENST00000227520.5
|
CCDC86
|
coiled-coil domain containing 86 |
| chr4_-_103746924 | 4.91 |
ENST00000505207.1
ENST00000502404.1 ENST00000507845.1 |
UBE2D3
|
ubiquitin-conjugating enzyme E2D 3 |
| chr10_+_60028818 | 4.79 |
ENST00000333926.5
|
CISD1
|
CDGSH iron sulfur domain 1 |
| chr15_-_101835110 | 4.72 |
ENST00000560496.1
|
SNRPA1
|
small nuclear ribonucleoprotein polypeptide A' |
| chr2_+_108443388 | 4.45 |
ENST00000354986.4
ENST00000408999.3 |
RGPD4
|
RANBP2-like and GRIP domain containing 4 |
| chr10_+_54074033 | 4.31 |
ENST00000373970.3
|
DKK1
|
dickkopf WNT signaling pathway inhibitor 1 |
| chr4_-_69215467 | 4.27 |
ENST00000579690.1
|
YTHDC1
|
YTH domain containing 1 |
| chr1_+_203830703 | 4.19 |
ENST00000414487.2
|
SNRPE
|
small nuclear ribonucleoprotein polypeptide E |
| chr5_+_162930114 | 4.19 |
ENST00000280969.5
|
MAT2B
|
methionine adenosyltransferase II, beta |
| chr5_+_145826867 | 4.13 |
ENST00000296702.5
ENST00000394421.2 |
TCERG1
|
transcription elongation regulator 1 |
| chr1_+_171454659 | 4.01 |
ENST00000367742.3
ENST00000338920.4 |
PRRC2C
|
proline-rich coiled-coil 2C |
| chr1_-_28241226 | 4.00 |
ENST00000373912.3
ENST00000373909.3 |
RPA2
|
replication protein A2, 32kDa |
| chrX_-_152486108 | 3.76 |
ENST00000356661.5
|
MAGEA1
|
melanoma antigen family A, 1 (directs expression of antigen MZ2-E) |
| chr16_+_85832146 | 3.76 |
ENST00000565078.1
|
COX4I1
|
cytochrome c oxidase subunit IV isoform 1 |
| chr18_+_2571510 | 3.72 |
ENST00000261597.4
ENST00000575515.1 |
NDC80
|
NDC80 kinetochore complex component |
| chr4_-_69215699 | 3.70 |
ENST00000510746.1
ENST00000344157.4 ENST00000355665.3 |
YTHDC1
|
YTH domain containing 1 |
| chr17_+_26646121 | 3.63 |
ENST00000226230.6
|
TMEM97
|
transmembrane protein 97 |
| chr7_+_48128194 | 3.58 |
ENST00000416681.1
ENST00000331803.4 ENST00000432131.1 |
UPP1
|
uridine phosphorylase 1 |
| chr7_-_25164868 | 3.52 |
ENST00000409409.1
ENST00000409764.1 ENST00000413447.1 |
CYCS
|
cytochrome c, somatic |
| chr17_+_16593539 | 3.52 |
ENST00000340621.5
ENST00000399273.1 ENST00000443444.2 ENST00000360524.8 ENST00000456009.1 |
CCDC144A
|
coiled-coil domain containing 144A |
| chr7_+_48128316 | 3.48 |
ENST00000341253.4
|
UPP1
|
uridine phosphorylase 1 |
| chr17_+_36908984 | 3.46 |
ENST00000225426.4
ENST00000579088.1 |
PSMB3
|
proteasome (prosome, macropain) subunit, beta type, 3 |
| chr6_+_37321823 | 3.45 |
ENST00000487950.1
ENST00000469731.1 |
RNF8
|
ring finger protein 8, E3 ubiquitin protein ligase |
| chr12_-_117628333 | 3.23 |
ENST00000427718.2
|
FBXO21
|
F-box protein 21 |
| chr12_+_98987369 | 3.22 |
ENST00000401722.3
ENST00000188376.5 ENST00000228318.3 ENST00000551917.1 ENST00000548046.1 ENST00000552981.1 ENST00000551265.1 ENST00000550695.1 ENST00000547534.1 ENST00000549338.1 ENST00000548847.1 |
SLC25A3
|
solute carrier family 25 (mitochondrial carrier; phosphate carrier), member 3 |
| chr2_+_97001491 | 3.21 |
ENST00000240423.4
ENST00000427946.1 ENST00000435975.1 ENST00000456906.1 ENST00000455200.1 |
NCAPH
|
non-SMC condensin I complex, subunit H |
| chr22_-_32058166 | 3.12 |
ENST00000435900.1
ENST00000336566.4 |
PISD
|
phosphatidylserine decarboxylase |
| chr18_-_21166841 | 3.09 |
ENST00000269228.5
|
NPC1
|
Niemann-Pick disease, type C1 |
| chr3_-_48723268 | 3.03 |
ENST00000439518.1
ENST00000416649.2 ENST00000341520.4 ENST00000294129.2 |
NCKIPSD
|
NCK interacting protein with SH3 domain |
| chr19_-_9546177 | 2.99 |
ENST00000592292.1
ENST00000588221.1 |
ZNF266
|
zinc finger protein 266 |
| chr3_-_33138286 | 2.98 |
ENST00000416695.2
ENST00000342462.4 ENST00000399402.3 |
TMPPE
GLB1
|
transmembrane protein with metallophosphoesterase domain galactosidase, beta 1 |
| chr2_-_107084826 | 2.95 |
ENST00000304514.7
ENST00000409886.3 |
RGPD3
|
RANBP2-like and GRIP domain containing 3 |
| chr6_-_7911042 | 2.94 |
ENST00000379757.4
|
TXNDC5
|
thioredoxin domain containing 5 (endoplasmic reticulum) |
| chr7_+_150759634 | 2.91 |
ENST00000392826.2
ENST00000461735.1 |
SLC4A2
|
solute carrier family 4 (anion exchanger), member 2 |
| chr11_-_57298187 | 2.85 |
ENST00000525158.1
ENST00000257245.4 ENST00000525587.1 |
TIMM10
|
translocase of inner mitochondrial membrane 10 homolog (yeast) |
| chr14_-_23426322 | 2.78 |
ENST00000555367.1
|
HAUS4
|
HAUS augmin-like complex, subunit 4 |
| chr1_+_161719552 | 2.75 |
ENST00000367943.4
|
DUSP12
|
dual specificity phosphatase 12 |
| chr8_+_91013577 | 2.73 |
ENST00000220764.2
|
DECR1
|
2,4-dienoyl CoA reductase 1, mitochondrial |
| chr10_+_112327425 | 2.70 |
ENST00000361804.4
|
SMC3
|
structural maintenance of chromosomes 3 |
| chr3_-_33138624 | 2.59 |
ENST00000445488.2
ENST00000307377.8 ENST00000440656.1 ENST00000436768.1 ENST00000307363.5 |
GLB1
|
galactosidase, beta 1 |
| chr14_-_23426270 | 2.59 |
ENST00000557591.1
ENST00000397409.4 ENST00000490506.1 ENST00000554406.1 |
HAUS4
|
HAUS augmin-like complex, subunit 4 |
| chr19_+_23945768 | 2.59 |
ENST00000486528.1
ENST00000496398.1 |
RPSAP58
|
ribosomal protein SA pseudogene 58 |
| chr19_-_9546227 | 2.52 |
ENST00000361451.2
ENST00000361151.1 |
ZNF266
|
zinc finger protein 266 |
| chr3_+_9839335 | 2.44 |
ENST00000453882.1
|
ARPC4-TTLL3
|
ARPC4-TTLL3 readthrough |
| chr19_+_6361440 | 2.43 |
ENST00000245816.4
|
CLPP
|
caseinolytic mitochondrial matrix peptidase proteolytic subunit |
| chr14_-_23426337 | 2.42 |
ENST00000342454.8
ENST00000555986.1 ENST00000541587.1 ENST00000554516.1 ENST00000347758.2 ENST00000206474.7 ENST00000555040.1 |
HAUS4
|
HAUS augmin-like complex, subunit 4 |
| chr1_-_28241024 | 2.38 |
ENST00000313433.7
ENST00000444045.1 |
RPA2
|
replication protein A2, 32kDa |
| chr9_+_131218698 | 2.37 |
ENST00000434106.3
ENST00000546203.1 ENST00000446274.1 ENST00000421776.2 ENST00000432065.2 |
ODF2
|
outer dense fiber of sperm tails 2 |
| chr10_-_96122682 | 2.26 |
ENST00000371361.3
|
NOC3L
|
nucleolar complex associated 3 homolog (S. cerevisiae) |
| chr5_-_156569754 | 2.17 |
ENST00000420343.1
|
MED7
|
mediator complex subunit 7 |
| chr6_-_25042231 | 2.15 |
ENST00000510784.2
|
FAM65B
|
family with sequence similarity 65, member B |
| chr15_+_85523671 | 2.14 |
ENST00000310298.4
ENST00000557957.1 |
PDE8A
|
phosphodiesterase 8A |
| chr17_+_55183261 | 2.14 |
ENST00000576295.1
|
AKAP1
|
A kinase (PRKA) anchor protein 1 |
| chr1_+_179050512 | 2.09 |
ENST00000367627.3
|
TOR3A
|
torsin family 3, member A |
| chr10_+_71075552 | 2.08 |
ENST00000298649.3
|
HK1
|
hexokinase 1 |
| chr12_-_117628253 | 2.07 |
ENST00000330622.5
|
FBXO21
|
F-box protein 21 |
| chr5_+_156693159 | 2.05 |
ENST00000347377.6
|
CYFIP2
|
cytoplasmic FMR1 interacting protein 2 |
| chr19_+_45754505 | 2.02 |
ENST00000262891.4
ENST00000300843.4 |
MARK4
|
MAP/microtubule affinity-regulating kinase 4 |
| chr16_+_50300427 | 1.99 |
ENST00000394697.2
ENST00000566433.2 ENST00000538642.1 |
ADCY7
|
adenylate cyclase 7 |
| chr1_+_171454639 | 1.89 |
ENST00000392078.3
ENST00000426496.2 |
PRRC2C
|
proline-rich coiled-coil 2C |
| chr14_+_73603126 | 1.89 |
ENST00000557356.1
ENST00000556864.1 ENST00000556533.1 ENST00000556951.1 ENST00000557293.1 ENST00000553719.1 ENST00000553599.1 ENST00000556011.1 ENST00000394157.3 ENST00000357710.4 ENST00000324501.5 ENST00000560005.2 ENST00000555254.1 ENST00000261970.3 ENST00000344094.3 ENST00000554131.1 ENST00000557037.1 |
PSEN1
|
presenilin 1 |
| chr8_+_145064215 | 1.86 |
ENST00000313269.5
|
GRINA
|
glutamate receptor, ionotropic, N-methyl D-aspartate-associated protein 1 (glutamate binding) |
| chr1_-_108735440 | 1.82 |
ENST00000370041.4
|
SLC25A24
|
solute carrier family 25 (mitochondrial carrier; phosphate carrier), member 24 |
| chr16_+_29817399 | 1.75 |
ENST00000545521.1
|
MAZ
|
MYC-associated zinc finger protein (purine-binding transcription factor) |
| chr1_+_93297622 | 1.72 |
ENST00000315741.5
|
RPL5
|
ribosomal protein L5 |
| chr14_+_24563262 | 1.70 |
ENST00000559250.1
ENST00000216780.4 ENST00000560736.1 ENST00000396973.4 ENST00000559837.1 |
PCK2
|
phosphoenolpyruvate carboxykinase 2 (mitochondrial) |
| chr1_-_151431909 | 1.70 |
ENST00000361398.3
ENST00000271715.2 |
POGZ
|
pogo transposable element with ZNF domain |
| chrX_-_53461305 | 1.68 |
ENST00000168216.6
|
HSD17B10
|
hydroxysteroid (17-beta) dehydrogenase 10 |
| chr20_+_56964253 | 1.64 |
ENST00000395802.3
|
VAPB
|
VAMP (vesicle-associated membrane protein)-associated protein B and C |
| chr20_-_7921090 | 1.64 |
ENST00000378789.3
|
HAO1
|
hydroxyacid oxidase (glycolate oxidase) 1 |
| chr6_-_90529418 | 1.59 |
ENST00000439638.1
ENST00000369393.3 ENST00000428876.1 |
MDN1
|
MDN1, midasin homolog (yeast) |
| chr2_+_131862872 | 1.54 |
ENST00000439822.2
|
PLEKHB2
|
pleckstrin homology domain containing, family B (evectins) member 2 |
| chr2_+_101179152 | 1.54 |
ENST00000264254.6
|
PDCL3
|
phosducin-like 3 |
| chr8_+_145064233 | 1.53 |
ENST00000529301.1
ENST00000395068.4 |
GRINA
|
glutamate receptor, ionotropic, N-methyl D-aspartate-associated protein 1 (glutamate binding) |
| chr1_-_246729544 | 1.52 |
ENST00000544618.1
ENST00000366514.4 |
TFB2M
|
transcription factor B2, mitochondrial |
| chr3_-_197025447 | 1.50 |
ENST00000346964.2
ENST00000357674.4 ENST00000314062.3 ENST00000448528.2 ENST00000419553.1 |
DLG1
|
discs, large homolog 1 (Drosophila) |
| chr13_-_36788718 | 1.47 |
ENST00000317764.6
ENST00000379881.3 |
SOHLH2
|
spermatogenesis and oogenesis specific basic helix-loop-helix 2 |
| chr14_-_68141535 | 1.46 |
ENST00000554659.1
|
VTI1B
|
vesicle transport through interaction with t-SNAREs 1B |
| chr11_+_73882311 | 1.44 |
ENST00000398427.4
ENST00000544401.1 |
PPME1
|
protein phosphatase methylesterase 1 |
| chr9_+_71789133 | 1.44 |
ENST00000348208.4
ENST00000265384.7 |
TJP2
|
tight junction protein 2 |
| chr19_+_36119929 | 1.42 |
ENST00000588161.1
ENST00000262633.4 ENST00000592202.1 ENST00000586618.1 |
RBM42
|
RNA binding motif protein 42 |
| chr9_-_130890662 | 1.35 |
ENST00000277462.5
ENST00000338961.6 |
PTGES2
|
prostaglandin E synthase 2 |
| chr8_+_110552831 | 1.33 |
ENST00000530629.1
|
EBAG9
|
estrogen receptor binding site associated, antigen, 9 |
| chr3_-_47950745 | 1.33 |
ENST00000429422.1
|
MAP4
|
microtubule-associated protein 4 |
| chr11_+_73882144 | 1.29 |
ENST00000328257.8
|
PPME1
|
protein phosphatase methylesterase 1 |
| chr12_-_46766577 | 1.28 |
ENST00000256689.5
|
SLC38A2
|
solute carrier family 38, member 2 |
| chr5_+_179125368 | 1.27 |
ENST00000502296.1
ENST00000504734.1 ENST00000415618.2 |
CANX
|
calnexin |
| chr8_-_143696833 | 1.25 |
ENST00000356613.2
|
ARC
|
activity-regulated cytoskeleton-associated protein |
| chr9_+_131267052 | 1.22 |
ENST00000539582.1
|
GLE1
|
GLE1 RNA export mediator |
| chr19_+_36120009 | 1.22 |
ENST00000589871.1
|
RBM42
|
RNA binding motif protein 42 |
| chr17_-_40273348 | 1.21 |
ENST00000225916.5
|
KAT2A
|
K(lysine) acetyltransferase 2A |
| chr16_+_57279004 | 1.20 |
ENST00000219204.3
|
ARL2BP
|
ADP-ribosylation factor-like 2 binding protein |
| chr16_+_57279248 | 1.19 |
ENST00000562023.1
ENST00000563234.1 |
ARL2BP
|
ADP-ribosylation factor-like 2 binding protein |
| chr1_-_154909329 | 1.14 |
ENST00000368467.3
|
PMVK
|
phosphomevalonate kinase |
| chr16_+_28722809 | 1.13 |
ENST00000566866.1
|
EIF3C
|
eukaryotic translation initiation factor 3, subunit C |
| chrX_+_151883090 | 1.08 |
ENST00000370293.2
ENST00000423993.1 ENST00000447530.1 ENST00000458057.1 ENST00000331220.2 ENST00000422085.1 ENST00000453150.1 ENST00000409560.1 |
MAGEA2B
|
melanoma antigen family A, 2B |
| chr12_-_58240470 | 1.08 |
ENST00000548823.1
ENST00000398073.2 |
CTDSP2
|
CTD (carboxy-terminal domain, RNA polymerase II, polypeptide A) small phosphatase 2 |
| chr7_-_99716952 | 1.05 |
ENST00000523306.1
ENST00000344095.4 ENST00000417349.1 ENST00000493322.1 ENST00000520135.1 ENST00000418432.2 ENST00000460673.2 ENST00000452041.1 ENST00000452438.2 ENST00000451699.1 ENST00000453269.2 |
TAF6
|
TAF6 RNA polymerase II, TATA box binding protein (TBP)-associated factor, 80kDa |
| chr14_+_22320634 | 1.05 |
ENST00000390435.1
|
TRAV8-3
|
T cell receptor alpha variable 8-3 |
| chr8_+_110552046 | 1.04 |
ENST00000529931.1
|
EBAG9
|
estrogen receptor binding site associated, antigen, 9 |
| chr1_+_93297582 | 1.01 |
ENST00000370321.3
|
RPL5
|
ribosomal protein L5 |
| chr9_+_34990219 | 0.98 |
ENST00000541010.1
ENST00000454002.2 ENST00000545841.1 |
DNAJB5
|
DnaJ (Hsp40) homolog, subfamily B, member 5 |
| chr3_+_12525931 | 0.98 |
ENST00000446004.1
ENST00000314571.7 ENST00000454502.2 ENST00000383797.5 ENST00000402228.3 ENST00000284995.6 ENST00000444864.1 |
TSEN2
|
TSEN2 tRNA splicing endonuclease subunit |
| chrX_-_151922340 | 0.90 |
ENST00000370284.1
ENST00000543232.1 ENST00000393876.1 ENST00000393872.3 |
MAGEA2
|
melanoma antigen family A, 2 |
| chr1_-_94050668 | 0.87 |
ENST00000539242.1
|
BCAR3
|
breast cancer anti-estrogen resistance 3 |
| chr6_+_37321748 | 0.87 |
ENST00000373479.4
ENST00000394443.4 |
RNF8
|
ring finger protein 8, E3 ubiquitin protein ligase |
| chr11_+_64009072 | 0.82 |
ENST00000535135.1
ENST00000394540.3 |
FKBP2
|
FK506 binding protein 2, 13kDa |
| chr2_+_163175394 | 0.81 |
ENST00000446271.1
ENST00000429691.2 |
GCA
|
grancalcin, EF-hand calcium binding protein |
| chr14_-_105420241 | 0.77 |
ENST00000557457.1
|
AHNAK2
|
AHNAK nucleoprotein 2 |
| chr15_+_81489213 | 0.73 |
ENST00000559383.1
ENST00000394660.2 |
IL16
|
interleukin 16 |
| chr16_+_28722684 | 0.71 |
ENST00000331666.6
ENST00000395587.1 ENST00000569690.1 ENST00000564243.1 |
EIF3C
|
eukaryotic translation initiation factor 3, subunit C |
| chr19_+_49535169 | 0.69 |
ENST00000474913.1
ENST00000359342.6 |
CGB2
|
chorionic gonadotropin, beta polypeptide 2 |
| chr5_-_132113083 | 0.67 |
ENST00000296873.7
|
SEPT8
|
septin 8 |
| chr10_+_104005272 | 0.65 |
ENST00000369983.3
|
GBF1
|
golgi brefeldin A resistant guanine nucleotide exchange factor 1 |
| chr19_+_36119975 | 0.63 |
ENST00000589559.1
ENST00000360475.4 |
RBM42
|
RNA binding motif protein 42 |
| chr19_-_46234119 | 0.63 |
ENST00000317683.3
|
FBXO46
|
F-box protein 46 |
| chr2_+_131862900 | 0.63 |
ENST00000438882.2
ENST00000538982.1 ENST00000404460.1 |
PLEKHB2
|
pleckstrin homology domain containing, family B (evectins) member 2 |
| chr3_+_190105909 | 0.62 |
ENST00000456423.1
|
CLDN16
|
claudin 16 |
| chr7_+_66093851 | 0.59 |
ENST00000275532.3
|
KCTD7
|
potassium channel tetramerization domain containing 7 |
| chr15_-_75249793 | 0.58 |
ENST00000322177.5
|
RPP25
|
ribonuclease P/MRP 25kDa subunit |
| chr5_+_64859066 | 0.57 |
ENST00000261308.5
ENST00000535264.1 ENST00000538977.1 |
PPWD1
|
peptidylprolyl isomerase domain and WD repeat containing 1 |
| chr12_+_113229737 | 0.57 |
ENST00000551052.1
ENST00000415485.3 |
RPH3A
|
rabphilin 3A homolog (mouse) |
| chr10_-_92681033 | 0.53 |
ENST00000371697.3
|
ANKRD1
|
ankyrin repeat domain 1 (cardiac muscle) |
| chr10_+_16478942 | 0.53 |
ENST00000535784.2
ENST00000423462.2 ENST00000378000.1 |
PTER
|
phosphotriesterase related |
| chr2_+_128403720 | 0.52 |
ENST00000272644.3
|
GPR17
|
G protein-coupled receptor 17 |
| chr15_+_59279851 | 0.52 |
ENST00000348370.4
ENST00000434298.1 ENST00000559160.1 |
RNF111
|
ring finger protein 111 |
| chr16_-_18801643 | 0.50 |
ENST00000322989.4
ENST00000563390.1 |
RPS15A
|
ribosomal protein S15a |
| chr1_-_159046617 | 0.47 |
ENST00000368130.4
|
AIM2
|
absent in melanoma 2 |
| chr12_+_113229543 | 0.45 |
ENST00000447659.2
|
RPH3A
|
rabphilin 3A homolog (mouse) |
| chr2_+_128403439 | 0.44 |
ENST00000544369.1
|
GPR17
|
G protein-coupled receptor 17 |
| chr8_-_146176199 | 0.43 |
ENST00000532351.1
ENST00000276816.4 ENST00000394909.2 |
ZNF16
|
zinc finger protein 16 |
| chr9_+_72873837 | 0.43 |
ENST00000361138.5
|
SMC5
|
structural maintenance of chromosomes 5 |
| chr1_+_6640108 | 0.40 |
ENST00000377674.4
ENST00000488936.1 |
ZBTB48
|
zinc finger and BTB domain containing 48 |
| chr15_-_58357932 | 0.40 |
ENST00000347587.3
|
ALDH1A2
|
aldehyde dehydrogenase 1 family, member A2 |
| chr1_+_35544968 | 0.37 |
ENST00000359858.4
ENST00000373330.1 |
ZMYM1
|
zinc finger, MYM-type 1 |
| chr12_+_113229452 | 0.37 |
ENST00000389385.4
|
RPH3A
|
rabphilin 3A homolog (mouse) |
| chr17_-_48546232 | 0.35 |
ENST00000258969.4
|
CHAD
|
chondroadherin |
| chr2_-_89247338 | 0.34 |
ENST00000496168.1
|
IGKV1-5
|
immunoglobulin kappa variable 1-5 |
| chr10_-_69455873 | 0.32 |
ENST00000433211.2
|
CTNNA3
|
catenin (cadherin-associated protein), alpha 3 |
| chr2_-_163175133 | 0.30 |
ENST00000421365.2
ENST00000263642.2 |
IFIH1
|
interferon induced with helicase C domain 1 |
| chr18_+_33767473 | 0.29 |
ENST00000261326.5
|
MOCOS
|
molybdenum cofactor sulfurase |
| chr5_-_157002749 | 0.28 |
ENST00000517905.1
ENST00000430702.2 ENST00000394020.1 |
ADAM19
|
ADAM metallopeptidase domain 19 |
| chrX_+_117861535 | 0.25 |
ENST00000371666.3
ENST00000371642.1 |
IL13RA1
|
interleukin 13 receptor, alpha 1 |
| chr22_-_43539346 | 0.24 |
ENST00000327555.5
ENST00000290429.6 |
MCAT
|
malonyl CoA:ACP acyltransferase (mitochondrial) |
| chr18_+_60190226 | 0.23 |
ENST00000269499.5
|
ZCCHC2
|
zinc finger, CCHC domain containing 2 |
| chr1_+_222817629 | 0.23 |
ENST00000340535.7
|
MIA3
|
melanoma inhibitory activity family, member 3 |
| chr6_-_31628512 | 0.19 |
ENST00000375911.1
|
C6orf47
|
chromosome 6 open reading frame 47 |
| chr11_+_61522844 | 0.18 |
ENST00000265460.5
|
MYRF
|
myelin regulatory factor |
| chr1_+_179262905 | 0.16 |
ENST00000539888.1
ENST00000540564.1 ENST00000535686.1 ENST00000367619.3 |
SOAT1
|
sterol O-acyltransferase 1 |
| chr5_-_132113036 | 0.14 |
ENST00000378706.1
|
SEPT8
|
septin 8 |
| chr4_-_38666430 | 0.10 |
ENST00000436901.1
|
AC021860.1
|
Uncharacterized protein |
| chr11_-_4719072 | 0.08 |
ENST00000396950.3
ENST00000532598.1 |
OR51E2
|
olfactory receptor, family 51, subfamily E, member 2 |
| chrX_+_16668278 | 0.06 |
ENST00000380200.3
|
S100G
|
S100 calcium binding protein G |
| chr6_-_134495992 | 0.04 |
ENST00000475719.2
ENST00000367857.5 ENST00000237305.7 |
SGK1
|
serum/glucocorticoid regulated kinase 1 |
| chr6_+_29141311 | 0.03 |
ENST00000377167.2
|
OR2J2
|
olfactory receptor, family 2, subfamily J, member 2 |
| chr17_-_7307358 | 0.01 |
ENST00000576017.1
ENST00000302422.3 ENST00000535512.1 |
TMEM256
TMEM256-PLSCR3
|
transmembrane protein 256 TMEM256-PLSCR3 readthrough (NMD candidate) |
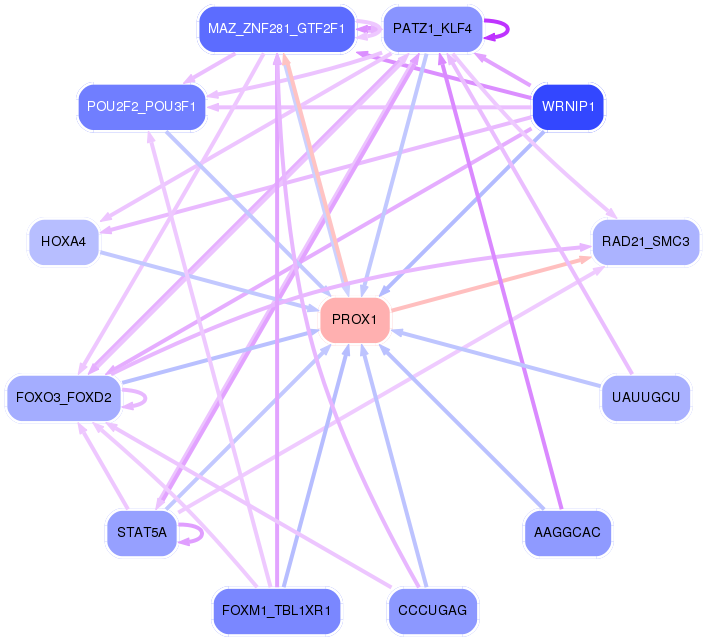
Network of associatons between targets according to the STRING database.

First level regulatory network of PROX1
Gene Ontology Analysis
Gene overrepresentation in biological_process category:
| Log-likelihood per target | Total log-likelihood | Term | Description |
|---|---|---|---|
| 3.5 | 14.0 | GO:0001831 | trophectodermal cellular morphogenesis(GO:0001831) |
| 3.5 | 13.8 | GO:0046035 | CMP salvage(GO:0006238) CMP biosynthetic process(GO:0009224) CMP metabolic process(GO:0046035) |
| 2.4 | 7.1 | GO:0009051 | pentose-phosphate shunt, oxidative branch(GO:0009051) |
| 1.8 | 7.1 | GO:0006218 | uridine catabolic process(GO:0006218) uridine metabolic process(GO:0046108) |
| 1.7 | 6.7 | GO:0034476 | U1 snRNA 3'-end processing(GO:0034473) U5 snRNA 3'-end processing(GO:0034476) |
| 1.4 | 4.3 | GO:0003308 | negative regulation of Wnt signaling pathway involved in heart development(GO:0003308) negative regulation of cell fate specification(GO:0009996) |
| 1.3 | 7.9 | GO:1901029 | adenine transport(GO:0015853) negative regulation of mitochondrial outer membrane permeabilization involved in apoptotic signaling pathway(GO:1901029) |
| 1.1 | 5.6 | GO:1904016 | response to Thyroglobulin triiodothyronine(GO:1904016) |
| 1.0 | 4.2 | GO:0006556 | S-adenosylmethionine biosynthetic process(GO:0006556) |
| 1.0 | 20.4 | GO:0006123 | mitochondrial electron transport, cytochrome c to oxygen(GO:0006123) |
| 0.8 | 12.5 | GO:0043517 | positive regulation of DNA damage response, signal transduction by p53 class mediator(GO:0043517) |
| 0.7 | 2.7 | GO:2000434 | regulation of protein neddylation(GO:2000434) negative regulation of protein neddylation(GO:2000435) |
| 0.6 | 4.4 | GO:0046604 | positive regulation of mitotic centrosome separation(GO:0046604) |
| 0.6 | 5.6 | GO:0000395 | mRNA 5'-splice site recognition(GO:0000395) |
| 0.6 | 4.3 | GO:0035093 | spermatogenesis, exchange of chromosomal proteins(GO:0035093) |
| 0.6 | 2.4 | GO:0018094 | protein polyglycylation(GO:0018094) |
| 0.6 | 1.7 | GO:0070901 | mitochondrial tRNA methylation(GO:0070901) |
| 0.6 | 5.6 | GO:0009249 | protein lipoylation(GO:0009249) |
| 0.5 | 2.7 | GO:1903301 | positive regulation of glucokinase activity(GO:0033133) positive regulation of hexokinase activity(GO:1903301) |
| 0.5 | 1.8 | GO:0015866 | ADP transport(GO:0015866) |
| 0.4 | 2.7 | GO:0044789 | modulation by host of viral release from host cell(GO:0044789) positive regulation by host of viral release from host cell(GO:0044791) |
| 0.4 | 1.2 | GO:0035948 | positive regulation of gluconeogenesis by positive regulation of transcription from RNA polymerase II promoter(GO:0035948) |
| 0.4 | 3.2 | GO:0010032 | meiotic chromosome condensation(GO:0010032) |
| 0.4 | 3.1 | GO:2000189 | positive regulation of cholesterol homeostasis(GO:2000189) |
| 0.4 | 1.5 | GO:0046116 | queuosine biosynthetic process(GO:0008616) queuosine metabolic process(GO:0046116) |
| 0.4 | 1.5 | GO:0006391 | transcription initiation from mitochondrial promoter(GO:0006391) |
| 0.4 | 1.1 | GO:0019287 | isopentenyl diphosphate biosynthetic process, mevalonate pathway(GO:0019287) |
| 0.4 | 7.1 | GO:0000022 | mitotic spindle elongation(GO:0000022) |
| 0.4 | 5.4 | GO:0051383 | kinetochore organization(GO:0051383) |
| 0.4 | 16.5 | GO:0070979 | protein K11-linked ubiquitination(GO:0070979) |
| 0.3 | 1.0 | GO:0000379 | tRNA-type intron splice site recognition and cleavage(GO:0000379) |
| 0.3 | 2.9 | GO:0045039 | protein import into mitochondrial inner membrane(GO:0045039) |
| 0.3 | 1.9 | GO:0051563 | smooth endoplasmic reticulum calcium ion homeostasis(GO:0051563) |
| 0.3 | 1.2 | GO:2000969 | positive regulation of alpha-amino-3-hydroxy-5-methyl-4-isoxazole propionate selective glutamate receptor activity(GO:2000969) |
| 0.3 | 6.4 | GO:2000001 | regulation of DNA damage checkpoint(GO:2000001) |
| 0.3 | 7.4 | GO:0006376 | mRNA splice site selection(GO:0006376) |
| 0.3 | 2.0 | GO:0051388 | positive regulation of neurotrophin TRK receptor signaling pathway(GO:0051388) |
| 0.2 | 1.3 | GO:0051012 | microtubule sliding(GO:0051012) |
| 0.2 | 1.3 | GO:0032328 | alanine transport(GO:0032328) |
| 0.2 | 1.7 | GO:0006116 | NADH oxidation(GO:0006116) |
| 0.2 | 3.8 | GO:0007213 | G-protein coupled acetylcholine receptor signaling pathway(GO:0007213) |
| 0.2 | 1.5 | GO:0048280 | vesicle fusion with Golgi apparatus(GO:0048280) |
| 0.2 | 2.1 | GO:0072656 | maintenance of protein location in mitochondrion(GO:0072656) |
| 0.2 | 4.8 | GO:0043457 | regulation of cellular respiration(GO:0043457) |
| 0.2 | 1.6 | GO:0009441 | fatty acid alpha-oxidation(GO:0001561) glycolate metabolic process(GO:0009441) |
| 0.2 | 1.8 | GO:1902416 | positive regulation of mRNA binding(GO:1902416) |
| 0.2 | 1.4 | GO:1903760 | regulation of voltage-gated potassium channel activity involved in ventricular cardiac muscle cell action potential repolarization(GO:1903760) |
| 0.2 | 1.6 | GO:0006987 | activation of signaling protein activity involved in unfolded protein response(GO:0006987) |
| 0.2 | 12.5 | GO:0070126 | mitochondrial translational elongation(GO:0070125) mitochondrial translational termination(GO:0070126) |
| 0.2 | 2.2 | GO:0045595 | regulation of cell differentiation(GO:0045595) |
| 0.2 | 0.7 | GO:0035964 | COPI-coated vesicle budding(GO:0035964) Golgi transport vesicle coating(GO:0048200) COPI coating of Golgi vesicle(GO:0048205) |
| 0.2 | 3.4 | GO:1902236 | negative regulation of endoplasmic reticulum stress-induced intrinsic apoptotic signaling pathway(GO:1902236) |
| 0.2 | 3.2 | GO:0035435 | phosphate ion transmembrane transport(GO:0035435) |
| 0.1 | 1.4 | GO:0071847 | TNFSF11-mediated signaling pathway(GO:0071847) |
| 0.1 | 0.4 | GO:0034093 | positive regulation of maintenance of sister chromatid cohesion(GO:0034093) positive regulation of maintenance of mitotic sister chromatid cohesion(GO:0034184) |
| 0.1 | 4.2 | GO:0008334 | histone mRNA metabolic process(GO:0008334) |
| 0.1 | 3.3 | GO:0048025 | negative regulation of mRNA splicing, via spliceosome(GO:0048025) |
| 0.1 | 5.6 | GO:0006509 | membrane protein ectodomain proteolysis(GO:0006509) |
| 0.1 | 0.6 | GO:0006449 | regulation of translational termination(GO:0006449) |
| 0.1 | 3.8 | GO:0045746 | negative regulation of Notch signaling pathway(GO:0045746) |
| 0.1 | 2.9 | GO:0000042 | protein targeting to Golgi(GO:0000042) |
| 0.1 | 4.9 | GO:0016032 | viral process(GO:0016032) |
| 0.1 | 6.2 | GO:0006414 | translational elongation(GO:0006414) |
| 0.1 | 1.3 | GO:0034975 | protein folding in endoplasmic reticulum(GO:0034975) |
| 0.1 | 2.0 | GO:0071361 | cellular response to ethanol(GO:0071361) |
| 0.1 | 2.1 | GO:1903206 | negative regulation of hydrogen peroxide-induced cell death(GO:1903206) |
| 0.1 | 3.0 | GO:0006607 | NLS-bearing protein import into nucleus(GO:0006607) |
| 0.1 | 0.3 | GO:0034344 | type III interferon production(GO:0034343) regulation of type III interferon production(GO:0034344) |
| 0.1 | 2.4 | GO:0051457 | maintenance of protein location in nucleus(GO:0051457) |
| 0.1 | 7.8 | GO:0051225 | spindle assembly(GO:0051225) |
| 0.1 | 2.7 | GO:0006482 | protein demethylation(GO:0006482) protein dealkylation(GO:0008214) |
| 0.1 | 0.5 | GO:0070269 | pyroptosis(GO:0070269) |
| 0.1 | 5.7 | GO:0006695 | cholesterol biosynthetic process(GO:0006695) |
| 0.1 | 0.5 | GO:0030579 | ubiquitin-dependent SMAD protein catabolic process(GO:0030579) |
| 0.1 | 0.8 | GO:0001778 | plasma membrane repair(GO:0001778) |
| 0.1 | 4.3 | GO:0045454 | cell redox homeostasis(GO:0045454) |
| 0.1 | 4.7 | GO:0035722 | interleukin-12-mediated signaling pathway(GO:0035722) cellular response to interleukin-12(GO:0071349) |
| 0.1 | 0.2 | GO:1900154 | regulation of bone trabecula formation(GO:1900154) negative regulation of bone trabecula formation(GO:1900155) |
| 0.1 | 0.4 | GO:0045654 | positive regulation of megakaryocyte differentiation(GO:0045654) |
| 0.1 | 3.7 | GO:0055092 | cholesterol homeostasis(GO:0042632) sterol homeostasis(GO:0055092) |
| 0.1 | 0.9 | GO:0033234 | negative regulation of protein sumoylation(GO:0033234) |
| 0.0 | 1.6 | GO:0000027 | ribosomal large subunit assembly(GO:0000027) |
| 0.0 | 0.4 | GO:0035799 | ureter maturation(GO:0035799) |
| 0.0 | 0.6 | GO:1903830 | magnesium ion transmembrane transport(GO:1903830) |
| 0.0 | 1.5 | GO:0010738 | regulation of protein kinase A signaling(GO:0010738) |
| 0.0 | 0.6 | GO:0001682 | tRNA 5'-leader removal(GO:0001682) |
| 0.0 | 3.5 | GO:0006521 | regulation of cellular amino acid metabolic process(GO:0006521) |
| 0.0 | 2.0 | GO:0001578 | microtubule bundle formation(GO:0001578) |
| 0.0 | 0.3 | GO:0006777 | Mo-molybdopterin cofactor biosynthetic process(GO:0006777) Mo-molybdopterin cofactor metabolic process(GO:0019720) |
| 0.0 | 0.3 | GO:0086042 | cardiac muscle cell-cardiac muscle cell adhesion(GO:0086042) bundle of His cell-Purkinje myocyte adhesion involved in cell communication(GO:0086073) |
| 0.0 | 3.0 | GO:0006635 | fatty acid beta-oxidation(GO:0006635) |
| 0.0 | 1.4 | GO:0048791 | calcium ion-regulated exocytosis of neurotransmitter(GO:0048791) |
| 0.0 | 1.7 | GO:0006369 | termination of RNA polymerase II transcription(GO:0006369) |
| 0.0 | 0.9 | GO:0002089 | lens morphogenesis in camera-type eye(GO:0002089) |
| 0.0 | 0.7 | GO:0050930 | induction of positive chemotaxis(GO:0050930) |
| 0.0 | 1.0 | GO:0035025 | positive regulation of Rho protein signal transduction(GO:0035025) |
| 0.0 | 2.9 | GO:0051453 | regulation of intracellular pH(GO:0051453) |
| 0.0 | 0.7 | GO:0030728 | ovulation(GO:0030728) |
| 0.0 | 2.4 | GO:0007286 | spermatid development(GO:0007286) |
| 0.0 | 0.2 | GO:0032286 | central nervous system myelin maintenance(GO:0032286) |
| 0.0 | 0.1 | GO:1900133 | regulation of renin secretion into blood stream(GO:1900133) |
| 0.0 | 0.2 | GO:0090110 | cargo loading into COPII-coated vesicle(GO:0090110) |
| 0.0 | 6.7 | GO:0051260 | protein homooligomerization(GO:0051260) |
| 0.0 | 1.1 | GO:0036498 | IRE1-mediated unfolded protein response(GO:0036498) |
| 0.0 | 1.1 | GO:0042795 | snRNA transcription(GO:0009301) snRNA transcription from RNA polymerase II promoter(GO:0042795) |
| 0.0 | 2.7 | GO:0000209 | protein polyubiquitination(GO:0000209) |
| 0.0 | 0.6 | GO:0048477 | oogenesis(GO:0048477) |
Gene overrepresentation in cellular_component category:
| Log-likelihood per target | Total log-likelihood | Term | Description |
|---|---|---|---|
| 2.3 | 11.6 | GO:0009368 | endopeptidase Clp complex(GO:0009368) |
| 1.6 | 14.0 | GO:0005827 | polar microtubule(GO:0005827) |
| 1.4 | 4.2 | GO:0048269 | methionine adenosyltransferase complex(GO:0048269) |
| 1.3 | 7.9 | GO:0071817 | MMXD complex(GO:0071817) |
| 1.2 | 3.7 | GO:0031262 | Ndc80 complex(GO:0031262) |
| 0.9 | 2.7 | GO:0034991 | nuclear meiotic cohesin complex(GO:0034991) |
| 0.9 | 7.8 | GO:0070652 | HAUS complex(GO:0070652) |
| 0.8 | 3.2 | GO:0000799 | nuclear condensin complex(GO:0000799) |
| 0.7 | 7.1 | GO:0070938 | contractile ring(GO:0070938) |
| 0.6 | 13.1 | GO:0017101 | aminoacyl-tRNA synthetase multienzyme complex(GO:0017101) |
| 0.6 | 6.7 | GO:0000176 | nuclear exosome (RNase complex)(GO:0000176) |
| 0.6 | 5.6 | GO:0000243 | commitment complex(GO:0000243) |
| 0.5 | 4.2 | GO:0005683 | U7 snRNP(GO:0005683) pICln-Sm protein complex(GO:0034715) |
| 0.4 | 6.4 | GO:0005662 | DNA replication factor A complex(GO:0005662) |
| 0.4 | 14.7 | GO:0005762 | organellar large ribosomal subunit(GO:0000315) mitochondrial large ribosomal subunit(GO:0005762) |
| 0.4 | 2.9 | GO:0042719 | mitochondrial intermembrane space protein transporter complex(GO:0042719) |
| 0.3 | 2.4 | GO:0001520 | outer dense fiber(GO:0001520) |
| 0.3 | 11.5 | GO:0000159 | protein phosphatase type 2A complex(GO:0000159) |
| 0.3 | 1.7 | GO:0030678 | mitochondrial ribonuclease P complex(GO:0030678) |
| 0.3 | 4.7 | GO:0005686 | U2 snRNP(GO:0005686) |
| 0.3 | 5.7 | GO:0044453 | integral component of nuclear inner membrane(GO:0005639) intrinsic component of nuclear inner membrane(GO:0031229) nuclear membrane part(GO:0044453) |
| 0.3 | 3.8 | GO:0005751 | mitochondrial respiratory chain complex IV(GO:0005751) |
| 0.2 | 1.0 | GO:0000214 | tRNA-intron endonuclease complex(GO:0000214) |
| 0.2 | 3.5 | GO:0019774 | proteasome core complex, beta-subunit complex(GO:0019774) |
| 0.2 | 4.5 | GO:0035861 | site of double-strand break(GO:0035861) |
| 0.2 | 1.9 | GO:0070765 | gamma-secretase complex(GO:0070765) |
| 0.1 | 7.8 | GO:0009295 | nucleoid(GO:0009295) mitochondrial nucleoid(GO:0042645) |
| 0.1 | 2.4 | GO:0005885 | Arp2/3 protein complex(GO:0005885) |
| 0.1 | 10.7 | GO:0005746 | mitochondrial respiratory chain(GO:0005746) |
| 0.1 | 1.3 | GO:0044233 | ER-mitochondrion membrane contact site(GO:0044233) |
| 0.1 | 1.4 | GO:0097025 | lateral loop(GO:0043219) MPP7-DLG1-LIN7 complex(GO:0097025) |
| 0.1 | 2.3 | GO:0033276 | transcription factor TFTC complex(GO:0033276) |
| 0.1 | 10.7 | GO:0035578 | azurophil granule lumen(GO:0035578) |
| 0.1 | 0.6 | GO:0044614 | nuclear pore cytoplasmic filaments(GO:0044614) |
| 0.1 | 0.6 | GO:0000172 | ribonuclease MRP complex(GO:0000172) |
| 0.1 | 2.0 | GO:0008074 | guanylate cyclase complex, soluble(GO:0008074) |
| 0.1 | 2.1 | GO:0097228 | sperm principal piece(GO:0097228) |
| 0.1 | 1.8 | GO:0005852 | eukaryotic translation initiation factor 3 complex(GO:0005852) |
| 0.1 | 0.5 | GO:0097169 | AIM2 inflammasome complex(GO:0097169) |
| 0.1 | 1.9 | GO:0070971 | endoplasmic reticulum exit site(GO:0070971) |
| 0.1 | 3.0 | GO:0008180 | COP9 signalosome(GO:0008180) |
| 0.1 | 2.2 | GO:0016592 | mediator complex(GO:0016592) |
| 0.1 | 1.6 | GO:0030687 | preribosome, large subunit precursor(GO:0030687) |
| 0.0 | 3.6 | GO:0055038 | recycling endosome membrane(GO:0055038) |
| 0.0 | 22.0 | GO:0010008 | endosome membrane(GO:0010008) |
| 0.0 | 3.6 | GO:0005791 | rough endoplasmic reticulum(GO:0005791) |
| 0.0 | 8.3 | GO:0044309 | dendritic spine(GO:0043197) neuron spine(GO:0044309) |
| 0.0 | 22.2 | GO:0005740 | mitochondrial envelope(GO:0005740) |
| 0.0 | 1.6 | GO:0005782 | peroxisomal matrix(GO:0005782) microbody lumen(GO:0031907) |
| 0.0 | 2.7 | GO:0022625 | cytosolic large ribosomal subunit(GO:0022625) |
| 0.0 | 1.8 | GO:0042579 | peroxisome(GO:0005777) microbody(GO:0042579) |
| 0.0 | 0.3 | GO:0005916 | fascia adherens(GO:0005916) |
| 0.0 | 9.5 | GO:0016607 | nuclear speck(GO:0016607) |
| 0.0 | 1.4 | GO:0099501 | synaptic vesicle membrane(GO:0030672) exocytic vesicle membrane(GO:0099501) |
| 0.0 | 0.8 | GO:0043034 | costamere(GO:0043034) |
| 0.0 | 1.3 | GO:0097014 | axoneme(GO:0005930) ciliary plasm(GO:0097014) |
| 0.0 | 2.1 | GO:0005923 | bicellular tight junction(GO:0005923) |
| 0.0 | 4.1 | GO:0000151 | ubiquitin ligase complex(GO:0000151) |
| 0.0 | 1.3 | GO:0005903 | brush border(GO:0005903) |
Gene overrepresentation in molecular_function category:
| Log-likelihood per target | Total log-likelihood | Term | Description |
|---|---|---|---|
| 3.8 | 11.5 | GO:0045155 | electron transporter, transferring electrons from CoQH2-cytochrome c reductase complex and cytochrome c oxidase complex activity(GO:0045155) |
| 3.5 | 14.0 | GO:0031208 | POZ domain binding(GO:0031208) |
| 2.4 | 7.1 | GO:0004616 | phosphogluconate dehydrogenase (decarboxylating) activity(GO:0004616) |
| 2.0 | 7.9 | GO:0015207 | ATP:ADP antiporter activity(GO:0005471) adenine transmembrane transporter activity(GO:0015207) |
| 2.0 | 13.8 | GO:0004849 | uridine kinase activity(GO:0004849) |
| 1.9 | 5.7 | GO:0050613 | delta14-sterol reductase activity(GO:0050613) |
| 1.9 | 5.6 | GO:0000035 | acyl binding(GO:0000035) phosphopantetheine binding(GO:0031177) |
| 1.9 | 5.6 | GO:0030627 | pre-mRNA 5'-splice site binding(GO:0030627) |
| 1.8 | 7.1 | GO:0004850 | uridine phosphorylase activity(GO:0004850) |
| 1.4 | 5.6 | GO:0016936 | galactoside binding(GO:0016936) |
| 1.0 | 3.1 | GO:0004609 | phosphatidylserine decarboxylase activity(GO:0004609) |
| 0.7 | 2.7 | GO:0008670 | 2,4-dienoyl-CoA reductase (NADPH) activity(GO:0008670) |
| 0.7 | 2.7 | GO:0036033 | mediator complex binding(GO:0036033) |
| 0.6 | 6.4 | GO:0098505 | G-rich strand telomeric DNA binding(GO:0098505) |
| 0.6 | 8.0 | GO:1990247 | N6-methyladenosine-containing RNA binding(GO:1990247) |
| 0.6 | 2.4 | GO:0070735 | protein-glycine ligase activity(GO:0070735) |
| 0.6 | 2.4 | GO:0016504 | peptidase activator activity(GO:0016504) peptidase activator activity involved in apoptotic process(GO:0016505) peptidase regulator activity(GO:0061134) |
| 0.6 | 4.7 | GO:0030620 | U2 snRNA binding(GO:0030620) |
| 0.6 | 1.7 | GO:0004613 | phosphoenolpyruvate carboxykinase activity(GO:0004611) phosphoenolpyruvate carboxykinase (GTP) activity(GO:0004613) |
| 0.5 | 1.6 | GO:0033149 | FFAT motif binding(GO:0033149) |
| 0.5 | 1.6 | GO:0016899 | oxidoreductase activity, acting on the CH-OH group of donors, oxygen as acceptor(GO:0016899) |
| 0.5 | 3.2 | GO:0044547 | DNA topoisomerase binding(GO:0044547) |
| 0.5 | 4.2 | GO:1990446 | U1 snRNP binding(GO:1990446) |
| 0.5 | 1.9 | GO:0042500 | aspartic endopeptidase activity, intramembrane cleaving(GO:0042500) |
| 0.5 | 1.8 | GO:0015217 | adenine nucleotide transmembrane transporter activity(GO:0000295) purine ribonucleotide transmembrane transporter activity(GO:0005346) ATP transmembrane transporter activity(GO:0005347) purine nucleotide transmembrane transporter activity(GO:0015216) ADP transmembrane transporter activity(GO:0015217) |
| 0.4 | 4.3 | GO:0039706 | co-receptor binding(GO:0039706) |
| 0.3 | 1.4 | GO:0050220 | prostaglandin-E synthase activity(GO:0050220) |
| 0.3 | 1.0 | GO:0000213 | tRNA-intron endonuclease activity(GO:0000213) |
| 0.3 | 1.5 | GO:0008479 | queuine tRNA-ribosyltransferase activity(GO:0008479) |
| 0.3 | 8.9 | GO:0015002 | cytochrome-c oxidase activity(GO:0004129) heme-copper terminal oxidase activity(GO:0015002) oxidoreductase activity, acting on a heme group of donors, oxygen as acceptor(GO:0016676) |
| 0.3 | 1.5 | GO:0000179 | rRNA (adenine-N6,N6-)-dimethyltransferase activity(GO:0000179) |
| 0.3 | 13.9 | GO:0061631 | ubiquitin conjugating enzyme activity(GO:0061631) |
| 0.3 | 2.7 | GO:1990948 | ligase inhibitor activity(GO:0055104) ubiquitin ligase inhibitor activity(GO:1990948) |
| 0.3 | 13.1 | GO:0004364 | glutathione transferase activity(GO:0004364) |
| 0.3 | 2.1 | GO:0004340 | glucokinase activity(GO:0004340) hexokinase activity(GO:0004396) fructokinase activity(GO:0008865) mannokinase activity(GO:0019158) |
| 0.2 | 6.2 | GO:0003746 | translation elongation factor activity(GO:0003746) |
| 0.2 | 1.2 | GO:0010484 | H3 histone acetyltransferase activity(GO:0010484) |
| 0.2 | 4.8 | GO:0051537 | 2 iron, 2 sulfur cluster binding(GO:0051537) |
| 0.2 | 7.1 | GO:0001965 | G-protein alpha-subunit binding(GO:0001965) |
| 0.2 | 1.1 | GO:0008420 | CTD phosphatase activity(GO:0008420) |
| 0.2 | 0.6 | GO:0000822 | inositol hexakisphosphate binding(GO:0000822) |
| 0.2 | 6.7 | GO:0017091 | AU-rich element binding(GO:0017091) |
| 0.2 | 0.5 | GO:0061629 | RNA polymerase II sequence-specific DNA binding transcription factor binding(GO:0061629) |
| 0.2 | 0.5 | GO:0032184 | SUMO polymer binding(GO:0032184) |
| 0.2 | 3.2 | GO:0015114 | phosphate ion transmembrane transporter activity(GO:0015114) |
| 0.2 | 2.9 | GO:0008510 | sodium:bicarbonate symporter activity(GO:0008510) |
| 0.2 | 2.9 | GO:0003756 | protein disulfide isomerase activity(GO:0003756) intramolecular oxidoreductase activity, transposing S-S bonds(GO:0016864) |
| 0.1 | 1.5 | GO:0019869 | chloride channel inhibitor activity(GO:0019869) |
| 0.1 | 4.1 | GO:0070064 | proline-rich region binding(GO:0070064) |
| 0.1 | 1.4 | GO:0008430 | selenium binding(GO:0008430) phosphate ion binding(GO:0042301) |
| 0.1 | 1.4 | GO:0097016 | L27 domain binding(GO:0097016) |
| 0.1 | 7.1 | GO:0019894 | kinesin binding(GO:0019894) |
| 0.1 | 3.5 | GO:0070003 | threonine-type endopeptidase activity(GO:0004298) threonine-type peptidase activity(GO:0070003) |
| 0.1 | 2.0 | GO:0050321 | tau-protein kinase activity(GO:0050321) |
| 0.1 | 4.3 | GO:0008536 | Ran GTPase binding(GO:0008536) |
| 0.1 | 1.7 | GO:0003857 | 3-hydroxyacyl-CoA dehydrogenase activity(GO:0003857) |
| 0.1 | 2.0 | GO:0004383 | guanylate cyclase activity(GO:0004383) |
| 0.1 | 1.3 | GO:0034185 | apolipoprotein binding(GO:0034185) |
| 0.1 | 1.1 | GO:0017162 | aryl hydrocarbon receptor binding(GO:0017162) |
| 0.1 | 0.2 | GO:0042954 | lipoprotein transporter activity(GO:0042954) |
| 0.1 | 2.7 | GO:0051721 | protein phosphatase 2A binding(GO:0051721) |
| 0.1 | 3.2 | GO:0015485 | cholesterol binding(GO:0015485) |
| 0.1 | 2.8 | GO:0005547 | phosphatidylinositol-3,4,5-trisphosphate binding(GO:0005547) |
| 0.1 | 0.3 | GO:0030151 | molybdenum ion binding(GO:0030151) |
| 0.1 | 11.2 | GO:0008237 | metallopeptidase activity(GO:0008237) |
| 0.0 | 1.2 | GO:0034237 | protein kinase A regulatory subunit binding(GO:0034237) |
| 0.0 | 1.4 | GO:0004385 | guanylate kinase activity(GO:0004385) |
| 0.0 | 0.6 | GO:0015095 | magnesium ion transmembrane transporter activity(GO:0015095) |
| 0.0 | 1.8 | GO:0031369 | translation initiation factor binding(GO:0031369) |
| 0.0 | 0.4 | GO:0003691 | double-stranded telomeric DNA binding(GO:0003691) |
| 0.0 | 4.7 | GO:0042826 | histone deacetylase binding(GO:0042826) |
| 0.0 | 0.6 | GO:0004526 | ribonuclease P activity(GO:0004526) |
| 0.0 | 3.8 | GO:0051087 | chaperone binding(GO:0051087) |
| 0.0 | 0.3 | GO:0086083 | cell adhesive protein binding involved in bundle of His cell-Purkinje myocyte communication(GO:0086083) |
| 0.0 | 0.4 | GO:0001758 | retinal dehydrogenase activity(GO:0001758) |
| 0.0 | 0.7 | GO:0042609 | CD4 receptor binding(GO:0042609) |
| 0.0 | 8.3 | GO:0004252 | serine-type endopeptidase activity(GO:0004252) |
| 0.0 | 0.9 | GO:0016776 | phosphotransferase activity, phosphate group as acceptor(GO:0016776) |
| 0.0 | 10.7 | GO:0004842 | ubiquitin-protein transferase activity(GO:0004842) |
| 0.0 | 0.6 | GO:0004115 | 3',5'-cyclic-AMP phosphodiesterase activity(GO:0004115) |
| 0.0 | 0.2 | GO:0004312 | fatty acid synthase activity(GO:0004312) |
| 0.0 | 1.0 | GO:0004950 | G-protein coupled chemoattractant receptor activity(GO:0001637) chemokine receptor activity(GO:0004950) |
| 0.0 | 3.7 | GO:0005200 | structural constituent of cytoskeleton(GO:0005200) |
| 0.0 | 0.8 | GO:0004198 | calcium-dependent cysteine-type endopeptidase activity(GO:0004198) |
| 0.0 | 3.2 | GO:0001046 | core promoter sequence-specific DNA binding(GO:0001046) |
| 0.0 | 2.9 | GO:0044325 | ion channel binding(GO:0044325) |
| 0.0 | 4.0 | GO:0008022 | protein C-terminus binding(GO:0008022) |
| 0.0 | 1.6 | GO:0051082 | unfolded protein binding(GO:0051082) |
| 0.0 | 0.6 | GO:0008138 | protein tyrosine/serine/threonine phosphatase activity(GO:0008138) |
| 0.0 | 2.7 | GO:0003735 | structural constituent of ribosome(GO:0003735) |
Gene overrepresentation in C2:CP category:
| Log-likelihood per target | Total log-likelihood | Term | Description |
|---|---|---|---|
| 0.4 | 14.0 | PID WNT CANONICAL PATHWAY | Canonical Wnt signaling pathway |
| 0.4 | 16.5 | PID NFKAPPAB CANONICAL PATHWAY | Canonical NF-kappaB pathway |
| 0.2 | 13.2 | PID PLK1 PATHWAY | PLK1 signaling events |
| 0.2 | 9.5 | PID HIV NEF PATHWAY | HIV-1 Nef: Negative effector of Fas and TNF-alpha |
| 0.2 | 6.4 | PID FANCONI PATHWAY | Fanconi anemia pathway |
| 0.1 | 4.1 | PID WNT SIGNALING PATHWAY | Wnt signaling network |
| 0.1 | 6.8 | PID ATM PATHWAY | ATM pathway |
| 0.1 | 2.0 | PID LPA4 PATHWAY | LPA4-mediated signaling events |
| 0.1 | 6.2 | ST FAS SIGNALING PATHWAY | Fas Signaling Pathway |
| 0.1 | 1.9 | PID SYNDECAN 3 PATHWAY | Syndecan-3-mediated signaling events |
| 0.1 | 3.2 | PID AURORA B PATHWAY | Aurora B signaling |
| 0.1 | 3.4 | PID ECADHERIN NASCENT AJ PATHWAY | E-cadherin signaling in the nascent adherens junction |
| 0.0 | 3.1 | PID HNF3A PATHWAY | FOXA1 transcription factor network |
| 0.0 | 0.7 | PID ARF 3PATHWAY | Arf1 pathway |
| 0.0 | 1.7 | PID REG GR PATHWAY | Glucocorticoid receptor regulatory network |
| 0.0 | 3.2 | PID CMYB PATHWAY | C-MYB transcription factor network |
| 0.0 | 2.0 | PID LKB1 PATHWAY | LKB1 signaling events |
| 0.0 | 1.2 | PID MYC PATHWAY | C-MYC pathway |
| 0.0 | 0.3 | ST IL 13 PATHWAY | Interleukin 13 (IL-13) Pathway |
| 0.0 | 2.1 | PID VEGFR1 2 PATHWAY | Signaling events mediated by VEGFR1 and VEGFR2 |
| 0.0 | 0.2 | ST JAK STAT PATHWAY | Jak-STAT Pathway |
| 0.0 | 2.1 | PID HIF1 TFPATHWAY | HIF-1-alpha transcription factor network |
| 0.0 | 1.1 | PID BMP PATHWAY | BMP receptor signaling |
| 0.0 | 0.9 | PID CDC42 REG PATHWAY | Regulation of CDC42 activity |
| 0.0 | 0.8 | PID ERA GENOMIC PATHWAY | Validated nuclear estrogen receptor alpha network |
| 0.0 | 3.3 | NABA ECM REGULATORS | Genes encoding enzymes and their regulators involved in the remodeling of the extracellular matrix |
| 0.0 | 0.2 | PID IFNG PATHWAY | IFN-gamma pathway |
Gene overrepresentation in C2:CP:REACTOME category:
| Log-likelihood per target | Total log-likelihood | Term | Description |
|---|---|---|---|
| 0.7 | 6.7 | REACTOME MRNA DECAY BY 3 TO 5 EXORIBONUCLEASE | Genes involved in mRNA Decay by 3' to 5' Exoribonuclease |
| 0.6 | 20.9 | REACTOME PYRIMIDINE METABOLISM | Genes involved in Pyrimidine metabolism |
| 0.5 | 6.4 | REACTOME REMOVAL OF THE FLAP INTERMEDIATE FROM THE C STRAND | Genes involved in Removal of the Flap Intermediate from the C-strand |
| 0.4 | 16.5 | REACTOME OXYGEN DEPENDENT PROLINE HYDROXYLATION OF HYPOXIA INDUCIBLE FACTOR ALPHA | Genes involved in Oxygen-dependent Proline Hydroxylation of Hypoxia-inducible Factor Alpha |
| 0.4 | 13.1 | REACTOME CYTOSOLIC TRNA AMINOACYLATION | Genes involved in Cytosolic tRNA aminoacylation |
| 0.3 | 5.6 | REACTOME KERATAN SULFATE DEGRADATION | Genes involved in Keratan sulfate degradation |
| 0.3 | 26.0 | REACTOME RESPIRATORY ELECTRON TRANSPORT | Genes involved in Respiratory electron transport |
| 0.3 | 4.2 | REACTOME SLBP DEPENDENT PROCESSING OF REPLICATION DEPENDENT HISTONE PRE MRNAS | Genes involved in SLBP Dependent Processing of Replication-Dependent Histone Pre-mRNAs |
| 0.2 | 6.9 | REACTOME CHOLESTEROL BIOSYNTHESIS | Genes involved in Cholesterol biosynthesis |
| 0.2 | 2.0 | REACTOME ADENYLATE CYCLASE ACTIVATING PATHWAY | Genes involved in Adenylate cyclase activating pathway |
| 0.2 | 7.8 | REACTOME INTERACTIONS OF VPR WITH HOST CELLULAR PROTEINS | Genes involved in Interactions of Vpr with host cellular proteins |
| 0.2 | 2.7 | REACTOME MITOCHONDRIAL FATTY ACID BETA OXIDATION | Genes involved in Mitochondrial Fatty Acid Beta-Oxidation |
| 0.1 | 1.2 | REACTOME NOTCH HLH TRANSCRIPTION PATHWAY | Genes involved in Notch-HLH transcription pathway |
| 0.1 | 1.9 | REACTOME SIGNALING BY NOTCH2 | Genes involved in Signaling by NOTCH2 |
| 0.1 | 2.1 | REACTOME GLUCOSE TRANSPORT | Genes involved in Glucose transport |
| 0.1 | 0.7 | REACTOME COPI MEDIATED TRANSPORT | Genes involved in COPI Mediated Transport |
| 0.1 | 1.4 | REACTOME APOPTOTIC CLEAVAGE OF CELL ADHESION PROTEINS | Genes involved in Apoptotic cleavage of cell adhesion proteins |
| 0.1 | 1.3 | REACTOME CALNEXIN CALRETICULIN CYCLE | Genes involved in Calnexin/calreticulin cycle |
| 0.1 | 2.9 | REACTOME LYSOSOME VESICLE BIOGENESIS | Genes involved in Lysosome Vesicle Biogenesis |
| 0.1 | 6.4 | REACTOME MITOTIC PROMETAPHASE | Genes involved in Mitotic Prometaphase |
| 0.1 | 16.4 | REACTOME ANTIGEN PROCESSING UBIQUITINATION PROTEASOME DEGRADATION | Genes involved in Antigen processing: Ubiquitination & Proteasome degradation |
| 0.1 | 1.7 | REACTOME BRANCHED CHAIN AMINO ACID CATABOLISM | Genes involved in Branched-chain amino acid catabolism |
| 0.1 | 1.4 | REACTOME IONOTROPIC ACTIVITY OF KAINATE RECEPTORS | Genes involved in Ionotropic activity of Kainate Receptors |
| 0.1 | 1.0 | REACTOME EICOSANOID LIGAND BINDING RECEPTORS | Genes involved in Eicosanoid ligand-binding receptors |
| 0.1 | 1.3 | REACTOME GLUTAMATE NEUROTRANSMITTER RELEASE CYCLE | Genes involved in Glutamate Neurotransmitter Release Cycle |
| 0.0 | 2.9 | REACTOME MITOCHONDRIAL PROTEIN IMPORT | Genes involved in Mitochondrial Protein Import |
| 0.0 | 4.2 | REACTOME PHASE II CONJUGATION | Genes involved in Phase II conjugation |
| 0.0 | 8.8 | REACTOME METABOLISM OF CARBOHYDRATES | Genes involved in Metabolism of carbohydrates |
| 0.0 | 2.3 | REACTOME FORMATION OF THE TERNARY COMPLEX AND SUBSEQUENTLY THE 43S COMPLEX | Genes involved in Formation of the ternary complex, and subsequently, the 43S complex |
| 0.0 | 4.2 | REACTOME MRNA SPLICING | Genes involved in mRNA Splicing |
| 0.0 | 2.9 | REACTOME TRANSPORT OF INORGANIC CATIONS ANIONS AND AMINO ACIDS OLIGOPEPTIDES | Genes involved in Transport of inorganic cations/anions and amino acids/oligopeptides |
| 0.0 | 2.4 | REACTOME PEPTIDE CHAIN ELONGATION | Genes involved in Peptide chain elongation |
| 0.0 | 2.2 | REACTOME TRANSCRIPTIONAL REGULATION OF WHITE ADIPOCYTE DIFFERENTIATION | Genes involved in Transcriptional Regulation of White Adipocyte Differentiation |
| 0.0 | 0.3 | REACTOME TRAF3 DEPENDENT IRF ACTIVATION PATHWAY | Genes involved in TRAF3-dependent IRF activation pathway |
| 0.0 | 1.1 | REACTOME ACTIVATION OF CHAPERONE GENES BY XBP1S | Genes involved in Activation of Chaperone Genes by XBP1(S) |
| 0.0 | 0.6 | REACTOME TIGHT JUNCTION INTERACTIONS | Genes involved in Tight junction interactions |
| 0.0 | 0.5 | REACTOME INFLAMMASOMES | Genes involved in Inflammasomes |