Project
GNF SymAtlas + NCI-60 cancer cell lines, comparison of cancers vs non-cancers, human (Su, 2004; Ross, 2000)
Navigation
Downloads
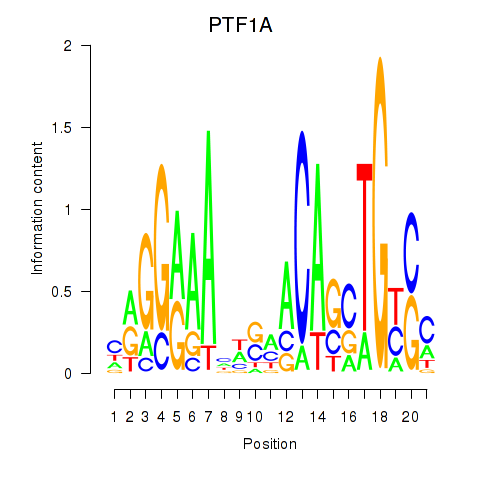
Results for PTF1A
Z-value: 1.15
Motif logo
Transcription factors associated with PTF1A
| Gene Symbol | Gene ID | Gene Info |
|---|---|---|
|
PTF1A
|
ENSG00000168267.5 | pancreas associated transcription factor 1a |
Activity profile of PTF1A motif
Sorted Z-values of PTF1A motif
| Promoter | Log-likelihood | Transcript | Gene | Gene Info |
|---|---|---|---|---|
| chr11_-_111794446 | 45.24 |
ENST00000527950.1
|
CRYAB
|
crystallin, alpha B |
| chrX_-_13956497 | 28.78 |
ENST00000398361.3
|
GPM6B
|
glycoprotein M6B |
| chrX_-_13956737 | 25.22 |
ENST00000454189.2
|
GPM6B
|
glycoprotein M6B |
| chr2_-_71454185 | 23.88 |
ENST00000244221.8
|
PAIP2B
|
poly(A) binding protein interacting protein 2B |
| chr8_-_22089845 | 23.69 |
ENST00000454243.2
|
PHYHIP
|
phytanoyl-CoA 2-hydroxylase interacting protein |
| chr8_-_22089533 | 22.62 |
ENST00000321613.3
|
PHYHIP
|
phytanoyl-CoA 2-hydroxylase interacting protein |
| chr5_-_118324200 | 22.45 |
ENST00000515439.3
ENST00000510708.1 |
DTWD2
|
DTW domain containing 2 |
| chr3_+_40518599 | 19.36 |
ENST00000314686.5
ENST00000447116.2 ENST00000429348.2 ENST00000456778.1 |
ZNF619
|
zinc finger protein 619 |
| chr2_-_136288113 | 19.35 |
ENST00000401392.1
|
ZRANB3
|
zinc finger, RAN-binding domain containing 3 |
| chr7_-_152373216 | 16.79 |
ENST00000359321.1
|
XRCC2
|
X-ray repair complementing defective repair in Chinese hamster cells 2 |
| chr8_-_99306564 | 16.24 |
ENST00000430223.2
|
NIPAL2
|
NIPA-like domain containing 2 |
| chr4_+_156588115 | 15.80 |
ENST00000455639.2
|
GUCY1A3
|
guanylate cyclase 1, soluble, alpha 3 |
| chr15_+_68924327 | 15.75 |
ENST00000543950.1
|
CORO2B
|
coronin, actin binding protein, 2B |
| chr3_+_49027308 | 15.74 |
ENST00000383729.4
ENST00000343546.4 |
P4HTM
|
prolyl 4-hydroxylase, transmembrane (endoplasmic reticulum) |
| chr4_+_156587979 | 15.54 |
ENST00000511507.1
|
GUCY1A3
|
guanylate cyclase 1, soluble, alpha 3 |
| chr17_-_34313685 | 15.47 |
ENST00000435911.2
ENST00000586216.1 ENST00000394509.4 |
CCL14
|
chemokine (C-C motif) ligand 14 |
| chr8_-_99306611 | 15.16 |
ENST00000341166.3
|
NIPAL2
|
NIPA-like domain containing 2 |
| chr22_+_23101182 | 15.01 |
ENST00000390312.2
|
IGLV2-14
|
immunoglobulin lambda variable 2-14 |
| chr3_+_35681081 | 14.72 |
ENST00000428373.1
|
ARPP21
|
cAMP-regulated phosphoprotein, 21kDa |
| chr4_+_156587853 | 14.45 |
ENST00000506455.1
ENST00000511108.1 |
GUCY1A3
|
guanylate cyclase 1, soluble, alpha 3 |
| chr3_+_167453493 | 14.37 |
ENST00000295777.5
ENST00000472747.2 |
SERPINI1
|
serpin peptidase inhibitor, clade I (neuroserpin), member 1 |
| chr22_-_50523760 | 14.12 |
ENST00000395876.2
|
MLC1
|
megalencephalic leukoencephalopathy with subcortical cysts 1 |
| chr3_+_101546827 | 12.95 |
ENST00000461724.1
ENST00000483180.1 ENST00000394054.2 |
NFKBIZ
|
nuclear factor of kappa light polypeptide gene enhancer in B-cells inhibitor, zeta |
| chr18_-_53177984 | 12.74 |
ENST00000543082.1
|
TCF4
|
transcription factor 4 |
| chr17_-_73892992 | 12.61 |
ENST00000540128.1
ENST00000269383.3 |
TRIM65
|
tripartite motif containing 65 |
| chr7_-_100844193 | 12.08 |
ENST00000440203.2
ENST00000379423.3 ENST00000223114.4 |
MOGAT3
|
monoacylglycerol O-acyltransferase 3 |
| chr16_-_75569068 | 10.71 |
ENST00000336257.3
ENST00000565039.1 |
CHST5
|
carbohydrate (N-acetylglucosamine 6-O) sulfotransferase 5 |
| chr18_+_5238549 | 10.58 |
ENST00000580684.1
|
LINC00667
|
long intergenic non-protein coding RNA 667 |
| chr6_-_62996066 | 9.99 |
ENST00000281156.4
|
KHDRBS2
|
KH domain containing, RNA binding, signal transduction associated 2 |
| chr2_-_196933536 | 9.76 |
ENST00000312428.6
ENST00000410072.1 |
DNAH7
|
dynein, axonemal, heavy chain 7 |
| chr17_+_53342311 | 9.63 |
ENST00000226067.5
|
HLF
|
hepatic leukemia factor |
| chr1_+_114447763 | 9.52 |
ENST00000369563.3
|
DCLRE1B
|
DNA cross-link repair 1B |
| chrX_-_48216101 | 9.49 |
ENST00000298396.2
ENST00000376893.3 |
SSX3
|
synovial sarcoma, X breakpoint 3 |
| chr1_-_45956822 | 9.38 |
ENST00000372086.3
ENST00000341771.6 |
TESK2
|
testis-specific kinase 2 |
| chr2_+_173600514 | 9.09 |
ENST00000264111.6
|
RAPGEF4
|
Rap guanine nucleotide exchange factor (GEF) 4 |
| chr4_-_83719884 | 8.97 |
ENST00000282709.4
ENST00000273908.4 |
SCD5
|
stearoyl-CoA desaturase 5 |
| chr18_+_5238055 | 8.97 |
ENST00000582363.1
ENST00000582008.1 ENST00000580082.1 |
LINC00667
|
long intergenic non-protein coding RNA 667 |
| chrX_+_48242863 | 8.96 |
ENST00000376886.2
ENST00000375517.3 |
SSX4
|
synovial sarcoma, X breakpoint 4 |
| chr13_+_113633620 | 8.93 |
ENST00000421756.1
ENST00000375601.3 |
MCF2L
|
MCF.2 cell line derived transforming sequence-like |
| chr2_+_183943464 | 8.93 |
ENST00000354221.4
|
DUSP19
|
dual specificity phosphatase 19 |
| chr11_-_207221 | 8.78 |
ENST00000486280.1
ENST00000332865.6 ENST00000529614.2 ENST00000325147.9 ENST00000410108.1 ENST00000382762.3 |
BET1L
|
Bet1 golgi vesicular membrane trafficking protein-like |
| chr10_+_76871454 | 8.77 |
ENST00000372687.4
|
SAMD8
|
sterile alpha motif domain containing 8 |
| chr10_-_28571015 | 8.48 |
ENST00000375719.3
ENST00000375732.1 |
MPP7
|
membrane protein, palmitoylated 7 (MAGUK p55 subfamily member 7) |
| chr19_+_17326521 | 8.37 |
ENST00000593597.1
|
USE1
|
unconventional SNARE in the ER 1 homolog (S. cerevisiae) |
| chr11_-_45687128 | 8.27 |
ENST00000308064.2
|
CHST1
|
carbohydrate (keratan sulfate Gal-6) sulfotransferase 1 |
| chr6_+_27107053 | 8.23 |
ENST00000354348.2
|
HIST1H4I
|
histone cluster 1, H4i |
| chrX_-_107019181 | 8.11 |
ENST00000315660.4
ENST00000372384.2 ENST00000502650.1 ENST00000506724.1 |
TSC22D3
|
TSC22 domain family, member 3 |
| chr4_-_82393009 | 7.89 |
ENST00000436139.2
|
RASGEF1B
|
RasGEF domain family, member 1B |
| chr10_+_99332198 | 7.89 |
ENST00000307518.5
ENST00000298808.5 ENST00000370655.1 |
ANKRD2
|
ankyrin repeat domain 2 (stretch responsive muscle) |
| chr3_+_35721106 | 7.87 |
ENST00000474696.1
ENST00000412048.1 ENST00000396482.2 ENST00000432682.1 |
ARPP21
|
cAMP-regulated phosphoprotein, 21kDa |
| chr21_+_44073916 | 7.72 |
ENST00000349112.3
ENST00000398224.3 |
PDE9A
|
phosphodiesterase 9A |
| chr1_-_9129735 | 7.66 |
ENST00000377424.4
|
SLC2A5
|
solute carrier family 2 (facilitated glucose/fructose transporter), member 5 |
| chr2_+_173600565 | 7.52 |
ENST00000397081.3
|
RAPGEF4
|
Rap guanine nucleotide exchange factor (GEF) 4 |
| chrX_+_15808569 | 7.45 |
ENST00000380308.3
ENST00000307771.7 |
ZRSR2
|
zinc finger (CCCH type), RNA-binding motif and serine/arginine rich 2 |
| chr1_-_158301312 | 7.44 |
ENST00000368168.3
|
CD1B
|
CD1b molecule |
| chr17_-_33416231 | 7.43 |
ENST00000584655.1
ENST00000447669.2 ENST00000315249.7 |
RFFL
|
ring finger and FYVE-like domain containing E3 ubiquitin protein ligase |
| chr17_+_12692774 | 7.11 |
ENST00000379672.5
ENST00000340825.3 |
ARHGAP44
|
Rho GTPase activating protein 44 |
| chr2_-_89278535 | 7.07 |
ENST00000390247.2
|
IGKV3-7
|
immunoglobulin kappa variable 3-7 (non-functional) |
| chr2_-_237416071 | 7.04 |
ENST00000309507.5
ENST00000431676.2 |
IQCA1
|
IQ motif containing with AAA domain 1 |
| chr14_-_77737543 | 7.01 |
ENST00000298352.4
|
NGB
|
neuroglobin |
| chr16_+_2802623 | 6.96 |
ENST00000576924.1
ENST00000575009.1 ENST00000576415.1 ENST00000571378.1 |
SRRM2
|
serine/arginine repetitive matrix 2 |
| chr1_-_76076759 | 6.87 |
ENST00000370855.5
|
SLC44A5
|
solute carrier family 44, member 5 |
| chr2_-_237416181 | 6.79 |
ENST00000409907.3
|
IQCA1
|
IQ motif containing with AAA domain 1 |
| chr12_-_48398104 | 6.58 |
ENST00000337299.6
ENST00000380518.3 |
COL2A1
|
collagen, type II, alpha 1 |
| chr11_+_96123158 | 6.34 |
ENST00000332349.4
ENST00000458427.1 |
JRKL
|
jerky homolog-like (mouse) |
| chr1_-_33647267 | 6.19 |
ENST00000291416.5
|
TRIM62
|
tripartite motif containing 62 |
| chr16_+_71392616 | 6.11 |
ENST00000349553.5
ENST00000302628.4 ENST00000562305.1 |
CALB2
|
calbindin 2 |
| chr17_-_3461092 | 5.90 |
ENST00000301365.4
ENST00000572519.1 |
TRPV3
|
transient receptor potential cation channel, subfamily V, member 3 |
| chr19_+_42259329 | 5.81 |
ENST00000199764.6
|
CEACAM6
|
carcinoembryonic antigen-related cell adhesion molecule 6 (non-specific cross reacting antigen) |
| chr4_-_89744314 | 5.69 |
ENST00000508369.1
|
FAM13A
|
family with sequence similarity 13, member A |
| chr4_-_89744365 | 5.55 |
ENST00000513837.1
ENST00000503556.1 |
FAM13A
|
family with sequence similarity 13, member A |
| chr13_-_31736132 | 5.34 |
ENST00000429785.2
|
HSPH1
|
heat shock 105kDa/110kDa protein 1 |
| chr13_-_79979919 | 4.97 |
ENST00000267229.7
|
RBM26
|
RNA binding motif protein 26 |
| chr15_-_89764929 | 4.91 |
ENST00000268125.5
|
RLBP1
|
retinaldehyde binding protein 1 |
| chr10_-_1779663 | 4.81 |
ENST00000381312.1
|
ADARB2
|
adenosine deaminase, RNA-specific, B2 (non-functional) |
| chr16_-_15950868 | 4.80 |
ENST00000396324.3
ENST00000452625.2 ENST00000576790.2 ENST00000300036.5 |
MYH11
|
myosin, heavy chain 11, smooth muscle |
| chr19_-_46526304 | 4.72 |
ENST00000008938.4
|
PGLYRP1
|
peptidoglycan recognition protein 1 |
| chr19_-_48389651 | 4.59 |
ENST00000222002.3
|
SULT2A1
|
sulfotransferase family, cytosolic, 2A, dehydroepiandrosterone (DHEA)-preferring, member 1 |
| chr12_+_75784850 | 4.56 |
ENST00000550916.1
ENST00000435775.1 ENST00000378689.2 ENST00000378692.3 ENST00000320460.4 ENST00000547164.1 |
GLIPR1L2
|
GLI pathogenesis-related 1 like 2 |
| chr10_+_43572475 | 4.38 |
ENST00000355710.3
ENST00000498820.1 ENST00000340058.5 |
RET
|
ret proto-oncogene |
| chr9_+_4985228 | 4.23 |
ENST00000381652.3
|
JAK2
|
Janus kinase 2 |
| chr20_+_44637526 | 4.21 |
ENST00000372330.3
|
MMP9
|
matrix metallopeptidase 9 (gelatinase B, 92kDa gelatinase, 92kDa type IV collagenase) |
| chr1_-_20446020 | 4.17 |
ENST00000375105.3
|
PLA2G2D
|
phospholipase A2, group IID |
| chr18_+_33877654 | 4.10 |
ENST00000257209.4
ENST00000445677.1 ENST00000590592.1 ENST00000359247.4 |
FHOD3
|
formin homology 2 domain containing 3 |
| chr16_-_2004683 | 4.10 |
ENST00000268661.7
|
RPL3L
|
ribosomal protein L3-like |
| chr2_-_160761179 | 3.89 |
ENST00000554112.1
ENST00000553424.1 ENST00000263636.4 ENST00000504764.1 ENST00000505052.1 |
LY75
LY75-CD302
|
lymphocyte antigen 75 LY75-CD302 readthrough |
| chrX_-_134305322 | 3.75 |
ENST00000276241.6
ENST00000344129.2 |
CXorf48
|
cancer/testis antigen 55 |
| chr7_+_142458507 | 3.75 |
ENST00000492062.1
|
PRSS1
|
protease, serine, 1 (trypsin 1) |
| chr4_+_81951957 | 3.56 |
ENST00000282701.2
|
BMP3
|
bone morphogenetic protein 3 |
| chr2_-_228497888 | 3.52 |
ENST00000264387.4
ENST00000409066.1 |
C2orf83
|
chromosome 2 open reading frame 83 |
| chr13_-_79979952 | 3.50 |
ENST00000438724.1
|
RBM26
|
RNA binding motif protein 26 |
| chr7_-_142207004 | 3.37 |
ENST00000426318.2
|
TRBV10-2
|
T cell receptor beta variable 10-2 |
| chr1_-_231114542 | 3.37 |
ENST00000522821.1
ENST00000366661.4 ENST00000366662.4 ENST00000414259.1 ENST00000522399.1 |
TTC13
|
tetratricopeptide repeat domain 13 |
| chr21_+_44073860 | 3.35 |
ENST00000335512.4
ENST00000539837.1 ENST00000291539.6 ENST00000380328.2 ENST00000398232.3 ENST00000398234.3 ENST00000398236.3 ENST00000328862.6 ENST00000335440.6 ENST00000398225.3 ENST00000398229.3 ENST00000398227.3 |
PDE9A
|
phosphodiesterase 9A |
| chr16_+_89696692 | 3.32 |
ENST00000261615.4
|
DPEP1
|
dipeptidase 1 (renal) |
| chr8_-_125577940 | 3.22 |
ENST00000519168.1
ENST00000395508.2 |
MTSS1
|
metastasis suppressor 1 |
| chr6_-_46620522 | 2.94 |
ENST00000275016.2
|
CYP39A1
|
cytochrome P450, family 39, subfamily A, polypeptide 1 |
| chr19_-_11039261 | 2.80 |
ENST00000590329.1
ENST00000587943.1 ENST00000585858.1 ENST00000586748.1 ENST00000586575.1 ENST00000253031.2 |
YIPF2
|
Yip1 domain family, member 2 |
| chr16_-_65155833 | 2.78 |
ENST00000566827.1
ENST00000394156.3 ENST00000562998.1 |
CDH11
|
cadherin 11, type 2, OB-cadherin (osteoblast) |
| chr13_+_49280951 | 2.65 |
ENST00000282018.3
|
CYSLTR2
|
cysteinyl leukotriene receptor 2 |
| chr19_+_42300548 | 2.60 |
ENST00000344550.4
|
CEACAM3
|
carcinoembryonic antigen-related cell adhesion molecule 3 |
| chr4_-_107957454 | 2.42 |
ENST00000285311.3
|
DKK2
|
dickkopf WNT signaling pathway inhibitor 2 |
| chr7_-_99097863 | 2.29 |
ENST00000426306.2
ENST00000337673.6 |
ZNF394
|
zinc finger protein 394 |
| chr10_-_101841588 | 2.19 |
ENST00000370418.3
|
CPN1
|
carboxypeptidase N, polypeptide 1 |
| chr6_-_24877490 | 2.17 |
ENST00000540914.1
ENST00000378023.4 |
FAM65B
|
family with sequence similarity 65, member B |
| chr4_-_175750364 | 2.14 |
ENST00000340217.5
ENST00000274093.3 |
GLRA3
|
glycine receptor, alpha 3 |
| chr5_+_140557371 | 2.12 |
ENST00000239444.2
|
PCDHB8
|
protocadherin beta 8 |
| chr1_-_9129598 | 2.07 |
ENST00000535586.1
|
SLC2A5
|
solute carrier family 2 (facilitated glucose/fructose transporter), member 5 |
| chr22_+_24999114 | 2.05 |
ENST00000412658.1
ENST00000445029.1 ENST00000419133.1 ENST00000400382.1 ENST00000438643.2 ENST00000452551.1 ENST00000400383.1 ENST00000412898.1 ENST00000400380.1 ENST00000455483.1 ENST00000430289.1 |
GGT1
|
gamma-glutamyltransferase 1 |
| chr3_-_169587621 | 2.03 |
ENST00000523069.1
ENST00000316428.5 ENST00000264676.5 |
LRRC31
|
leucine rich repeat containing 31 |
| chr11_+_64052692 | 2.01 |
ENST00000377702.4
|
GPR137
|
G protein-coupled receptor 137 |
| chr1_-_204654826 | 1.95 |
ENST00000367177.3
|
LRRN2
|
leucine rich repeat neuronal 2 |
| chr1_-_45956800 | 1.88 |
ENST00000538496.1
|
TESK2
|
testis-specific kinase 2 |
| chr9_-_104145795 | 1.85 |
ENST00000259407.2
|
BAAT
|
bile acid CoA: amino acid N-acyltransferase (glycine N-choloyltransferase) |
| chr4_-_123843597 | 1.79 |
ENST00000510735.1
ENST00000304430.5 |
NUDT6
|
nudix (nucleoside diphosphate linked moiety X)-type motif 6 |
| chr2_-_89417335 | 1.77 |
ENST00000490686.1
|
IGKV1-17
|
immunoglobulin kappa variable 1-17 |
| chr1_+_32084641 | 1.66 |
ENST00000373706.5
|
HCRTR1
|
hypocretin (orexin) receptor 1 |
| chr4_+_40198527 | 1.58 |
ENST00000381799.5
|
RHOH
|
ras homolog family member H |
| chrX_+_154299690 | 1.52 |
ENST00000340647.4
ENST00000330045.7 |
BRCC3
|
BRCA1/BRCA2-containing complex, subunit 3 |
| chr16_+_2802316 | 1.49 |
ENST00000301740.8
|
SRRM2
|
serine/arginine repetitive matrix 2 |
| chr19_+_46801639 | 1.44 |
ENST00000244303.6
ENST00000339613.2 ENST00000533145.1 ENST00000472815.1 |
HIF3A
|
hypoxia inducible factor 3, alpha subunit |
| chr17_+_67498538 | 1.32 |
ENST00000589647.1
|
MAP2K6
|
mitogen-activated protein kinase kinase 6 |
| chr19_-_10491234 | 1.27 |
ENST00000524462.1
ENST00000531836.1 ENST00000525621.1 |
TYK2
|
tyrosine kinase 2 |
| chr8_+_32405785 | 1.22 |
ENST00000287842.3
|
NRG1
|
neuregulin 1 |
| chr2_+_97426631 | 1.10 |
ENST00000377075.2
|
CNNM4
|
cyclin M4 |
| chr22_-_39190116 | 1.00 |
ENST00000406622.1
ENST00000216068.4 ENST00000406199.3 |
SUN2
DNAL4
|
Sad1 and UNC84 domain containing 2 dynein, axonemal, light chain 4 |
| chr6_-_24489842 | 0.97 |
ENST00000230036.1
|
GPLD1
|
glycosylphosphatidylinositol specific phospholipase D1 |
| chr11_+_64052454 | 0.88 |
ENST00000539833.1
|
GPR137
|
G protein-coupled receptor 137 |
| chr8_+_11351876 | 0.84 |
ENST00000529894.1
|
BLK
|
B lymphoid tyrosine kinase |
| chr5_+_169532896 | 0.82 |
ENST00000306268.6
ENST00000449804.2 |
FOXI1
|
forkhead box I1 |
| chr6_-_56258892 | 0.81 |
ENST00000370819.1
|
COL21A1
|
collagen, type XXI, alpha 1 |
| chr13_+_49794474 | 0.66 |
ENST00000218721.1
ENST00000398307.1 |
MLNR
|
motilin receptor |
| chr7_+_141811539 | 0.57 |
ENST00000550469.2
ENST00000477922.3 |
RP11-1220K2.2
|
Putative inactive maltase-glucoamylase-like protein LOC93432 |
| chr20_+_43211149 | 0.43 |
ENST00000372886.1
|
PKIG
|
protein kinase (cAMP-dependent, catalytic) inhibitor gamma |
| chr8_+_32405728 | 0.31 |
ENST00000523079.1
ENST00000338921.4 ENST00000356819.4 ENST00000287845.5 ENST00000341377.5 |
NRG1
|
neuregulin 1 |
| chr9_-_138853156 | 0.19 |
ENST00000371756.3
|
UBAC1
|
UBA domain containing 1 |
| chr6_-_41715128 | 0.18 |
ENST00000356667.4
ENST00000373025.3 ENST00000425343.2 |
PGC
|
progastricsin (pepsinogen C) |
| chr11_-_102576537 | 0.14 |
ENST00000260229.4
|
MMP27
|
matrix metallopeptidase 27 |
| chr5_-_39425290 | 0.12 |
ENST00000545653.1
|
DAB2
|
Dab, mitogen-responsive phosphoprotein, homolog 2 (Drosophila) |
| chr11_+_64052294 | 0.09 |
ENST00000536667.1
|
GPR137
|
G protein-coupled receptor 137 |
| chr20_+_54823788 | 0.06 |
ENST00000243911.2
|
MC3R
|
melanocortin 3 receptor |
Network of associatons between targets according to the STRING database.

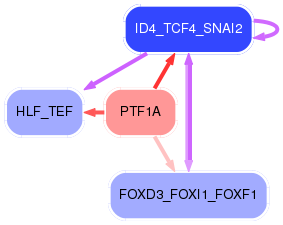
First level regulatory network of PTF1A
Gene Ontology Analysis
Gene overrepresentation in biological_process category:
| Log-likelihood per target | Total log-likelihood | Term | Description |
|---|---|---|---|
| 7.6 | 45.8 | GO:0052551 | response to defense-related nitric oxide production by other organism involved in symbiotic interaction(GO:0052551) response to defense-related host nitric oxide production(GO:0052565) |
| 5.4 | 54.0 | GO:0051610 | negative regulation of neurotransmitter uptake(GO:0051581) serotonin uptake(GO:0051610) regulation of serotonin uptake(GO:0051611) negative regulation of serotonin uptake(GO:0051612) |
| 3.9 | 31.4 | GO:0015693 | magnesium ion transport(GO:0015693) |
| 3.9 | 19.4 | GO:0048478 | replication fork protection(GO:0048478) |
| 3.2 | 9.5 | GO:0031627 | telomeric loop formation(GO:0031627) |
| 2.8 | 16.8 | GO:0000707 | meiotic DNA recombinase assembly(GO:0000707) |
| 2.5 | 45.2 | GO:0007021 | tubulin complex assembly(GO:0007021) |
| 1.9 | 7.4 | GO:2001271 | negative regulation of cysteine-type endopeptidase activity involved in execution phase of apoptosis(GO:2001271) |
| 1.6 | 4.8 | GO:0030241 | skeletal muscle myosin thick filament assembly(GO:0030241) |
| 1.6 | 4.7 | GO:0051710 | regulation of cytolysis in other organism(GO:0051710) |
| 1.5 | 4.4 | GO:0007497 | posterior midgut development(GO:0007497) |
| 1.4 | 4.2 | GO:0060398 | regulation of growth hormone receptor signaling pathway(GO:0060398) |
| 1.2 | 8.5 | GO:0071896 | protein localization to adherens junction(GO:0071896) |
| 1.2 | 10.7 | GO:0006477 | protein sulfation(GO:0006477) |
| 1.2 | 3.5 | GO:0015888 | thiamine transport(GO:0015888) thiamine transmembrane transport(GO:0071934) |
| 1.1 | 3.3 | GO:0016999 | antibiotic metabolic process(GO:0016999) cellular amide catabolic process(GO:0043605) |
| 1.1 | 8.8 | GO:0006686 | sphingomyelin biosynthetic process(GO:0006686) |
| 1.0 | 7.1 | GO:0035021 | negative regulation of Rac protein signal transduction(GO:0035021) |
| 1.0 | 8.1 | GO:0070236 | regulation of activation-induced cell death of T cells(GO:0070235) negative regulation of activation-induced cell death of T cells(GO:0070236) |
| 0.9 | 9.8 | GO:0036159 | inner dynein arm assembly(GO:0036159) |
| 0.9 | 23.9 | GO:0045947 | negative regulation of translational initiation(GO:0045947) |
| 0.8 | 5.9 | GO:0042636 | negative regulation of hair cycle(GO:0042636) |
| 0.8 | 4.2 | GO:0002361 | CD4-positive, CD25-positive, alpha-beta regulatory T cell differentiation(GO:0002361) |
| 0.8 | 15.1 | GO:0071397 | cellular response to cholesterol(GO:0071397) |
| 0.7 | 12.1 | GO:0006071 | glycerol metabolic process(GO:0006071) |
| 0.7 | 11.1 | GO:0046069 | cGMP catabolic process(GO:0046069) |
| 0.6 | 4.2 | GO:0051549 | positive regulation of keratinocyte migration(GO:0051549) |
| 0.6 | 6.9 | GO:0048007 | antigen processing and presentation of lipid antigen via MHC class Ib(GO:0048003) antigen processing and presentation, exogenous lipid antigen via MHC class Ib(GO:0048007) |
| 0.6 | 6.9 | GO:0015871 | choline transport(GO:0015871) |
| 0.5 | 6.6 | GO:0060174 | limb bud formation(GO:0060174) |
| 0.5 | 3.2 | GO:0030035 | microspike assembly(GO:0030035) |
| 0.5 | 7.9 | GO:0043619 | regulation of transcription from RNA polymerase II promoter in response to oxidative stress(GO:0043619) |
| 0.5 | 7.0 | GO:0015671 | oxygen transport(GO:0015671) |
| 0.4 | 8.9 | GO:0043508 | negative regulation of JUN kinase activity(GO:0043508) |
| 0.4 | 1.3 | GO:0072709 | cellular response to sorbitol(GO:0072709) |
| 0.4 | 2.6 | GO:0061737 | leukotriene signaling pathway(GO:0061737) |
| 0.4 | 2.2 | GO:0030070 | insulin processing(GO:0030070) |
| 0.4 | 8.3 | GO:0006012 | galactose metabolic process(GO:0006012) |
| 0.4 | 4.9 | GO:0006776 | vitamin A metabolic process(GO:0006776) |
| 0.4 | 2.9 | GO:0016127 | cholesterol catabolic process(GO:0006707) sterol catabolic process(GO:0016127) |
| 0.3 | 2.1 | GO:0019344 | cysteine biosynthetic process(GO:0019344) |
| 0.3 | 2.8 | GO:0021957 | corticospinal tract morphogenesis(GO:0021957) |
| 0.3 | 4.1 | GO:0051639 | actin filament network formation(GO:0051639) |
| 0.3 | 15.7 | GO:0045646 | regulation of erythrocyte differentiation(GO:0045646) |
| 0.2 | 15.5 | GO:0048247 | lymphocyte chemotaxis(GO:0048247) |
| 0.2 | 4.6 | GO:0051923 | sulfation(GO:0051923) |
| 0.2 | 2.1 | GO:0060012 | synaptic transmission, glycinergic(GO:0060012) |
| 0.2 | 1.9 | GO:0019530 | taurine metabolic process(GO:0019530) |
| 0.2 | 6.2 | GO:0032897 | negative regulation of viral transcription(GO:0032897) |
| 0.2 | 1.5 | GO:0021842 | directional guidance of interneurons involved in migration from the subpallium to the cortex(GO:0021840) chemorepulsion involved in interneuron migration from the subpallium to the cortex(GO:0021842) |
| 0.2 | 9.0 | GO:0046949 | fatty-acyl-CoA biosynthetic process(GO:0046949) |
| 0.2 | 22.5 | GO:1903955 | positive regulation of protein targeting to mitochondrion(GO:1903955) |
| 0.2 | 16.6 | GO:0019933 | cAMP-mediated signaling(GO:0019933) |
| 0.2 | 3.9 | GO:0006954 | inflammatory response(GO:0006954) |
| 0.2 | 17.1 | GO:0006890 | retrograde vesicle-mediated transport, Golgi to ER(GO:0006890) |
| 0.2 | 1.0 | GO:0031022 | nuclear migration along microfilament(GO:0031022) |
| 0.2 | 1.1 | GO:1903830 | magnesium ion transmembrane transport(GO:1903830) |
| 0.1 | 9.6 | GO:0035914 | skeletal muscle cell differentiation(GO:0035914) |
| 0.1 | 22.9 | GO:0034605 | cellular response to heat(GO:0034605) |
| 0.1 | 14.4 | GO:0007422 | peripheral nervous system development(GO:0007422) |
| 0.1 | 7.5 | GO:0000245 | spliceosomal complex assembly(GO:0000245) |
| 0.1 | 16.8 | GO:0030449 | regulation of complement activation(GO:0030449) |
| 0.1 | 10.0 | GO:0048024 | regulation of mRNA splicing, via spliceosome(GO:0048024) |
| 0.1 | 4.1 | GO:0000027 | ribosomal large subunit assembly(GO:0000027) |
| 0.1 | 8.5 | GO:0010923 | negative regulation of phosphatase activity(GO:0010923) |
| 0.1 | 2.5 | GO:0009235 | cobalamin metabolic process(GO:0009235) |
| 0.1 | 11.3 | GO:0007045 | cell-substrate adherens junction assembly(GO:0007045) focal adhesion assembly(GO:0048041) |
| 0.1 | 7.7 | GO:0010508 | positive regulation of autophagy(GO:0010508) |
| 0.1 | 3.6 | GO:0060395 | SMAD protein signal transduction(GO:0060395) |
| 0.1 | 8.9 | GO:0035023 | regulation of Rho protein signal transduction(GO:0035023) |
| 0.0 | 12.7 | GO:0065004 | protein-DNA complex assembly(GO:0065004) |
| 0.0 | 1.6 | GO:0034260 | negative regulation of GTPase activity(GO:0034260) |
| 0.0 | 6.1 | GO:0002377 | immunoglobulin production(GO:0002377) |
| 0.0 | 2.6 | GO:0050900 | leukocyte migration(GO:0050900) |
| 0.0 | 1.9 | GO:0090263 | positive regulation of canonical Wnt signaling pathway(GO:0090263) |
| 0.0 | 0.2 | GO:0002803 | positive regulation of antimicrobial peptide production(GO:0002225) positive regulation of antimicrobial humoral response(GO:0002760) positive regulation of antibacterial peptide production(GO:0002803) |
| 0.0 | 0.4 | GO:2000480 | negative regulation of cAMP-dependent protein kinase activity(GO:2000480) |
| 0.0 | 1.3 | GO:0060338 | regulation of type I interferon-mediated signaling pathway(GO:0060338) |
| 0.0 | 0.7 | GO:0045187 | regulation of circadian sleep/wake cycle, sleep(GO:0045187) |
| 0.0 | 5.9 | GO:0051480 | regulation of cytosolic calcium ion concentration(GO:0051480) |
| 0.0 | 0.4 | GO:0050855 | regulation of B cell receptor signaling pathway(GO:0050855) |
| 0.0 | 1.4 | GO:0061418 | regulation of transcription from RNA polymerase II promoter in response to hypoxia(GO:0061418) |
| 0.0 | 2.1 | GO:0007156 | homophilic cell adhesion via plasma membrane adhesion molecules(GO:0007156) |
| 0.0 | 0.8 | GO:0042472 | inner ear morphogenesis(GO:0042472) |
| 0.0 | 4.1 | GO:0030335 | positive regulation of cell migration(GO:0030335) |
| 0.0 | 5.3 | GO:0007264 | small GTPase mediated signal transduction(GO:0007264) |
Gene overrepresentation in cellular_component category:
| Log-likelihood per target | Total log-likelihood | Term | Description |
|---|---|---|---|
| 2.8 | 45.2 | GO:0097512 | cardiac myofibril(GO:0097512) |
| 2.8 | 16.8 | GO:0033061 | DNA recombinase mediator complex(GO:0033061) Rad51B-Rad51C-Rad51D-XRCC2 complex(GO:0033063) |
| 1.8 | 45.8 | GO:0008074 | guanylate cyclase complex, soluble(GO:0008074) |
| 1.5 | 7.5 | GO:0089701 | U2AF(GO:0089701) |
| 0.7 | 2.1 | GO:0016935 | glycine-gated chloride channel complex(GO:0016935) |
| 0.7 | 8.5 | GO:0097025 | MPP7-DLG1-LIN7 complex(GO:0097025) |
| 0.7 | 9.8 | GO:0005858 | axonemal dynein complex(GO:0005858) |
| 0.5 | 6.6 | GO:0005583 | fibrillar collagen trimer(GO:0005583) banded collagen fibril(GO:0098643) |
| 0.5 | 3.4 | GO:0097013 | phagocytic vesicle lumen(GO:0097013) |
| 0.4 | 18.3 | GO:0031228 | intrinsic component of Golgi membrane(GO:0031228) |
| 0.2 | 3.3 | GO:0031528 | microvillus membrane(GO:0031528) |
| 0.2 | 32.4 | GO:0043204 | perikaryon(GO:0043204) |
| 0.2 | 5.7 | GO:0005921 | gap junction(GO:0005921) |
| 0.2 | 4.8 | GO:0032982 | myosin filament(GO:0032982) |
| 0.2 | 8.4 | GO:0043596 | nuclear replication fork(GO:0043596) |
| 0.2 | 75.6 | GO:0045121 | membrane raft(GO:0045121) |
| 0.2 | 7.9 | GO:0000791 | euchromatin(GO:0000791) |
| 0.1 | 1.0 | GO:0034992 | microtubule organizing center attachment site(GO:0034992) LINC complex(GO:0034993) |
| 0.1 | 12.9 | GO:0000932 | cytoplasmic mRNA processing body(GO:0000932) |
| 0.1 | 12.7 | GO:0032993 | protein-DNA complex(GO:0032993) |
| 0.1 | 4.1 | GO:0005865 | striated muscle thin filament(GO:0005865) myofilament(GO:0036379) |
| 0.1 | 9.5 | GO:0000784 | nuclear chromosome, telomeric region(GO:0000784) |
| 0.1 | 0.1 | GO:0042406 | extrinsic component of endoplasmic reticulum membrane(GO:0042406) |
| 0.1 | 1.5 | GO:0030673 | axolemma(GO:0030673) |
| 0.0 | 1.6 | GO:0001772 | immunological synapse(GO:0001772) |
| 0.0 | 7.1 | GO:0043197 | dendritic spine(GO:0043197) |
| 0.0 | 7.4 | GO:0005770 | late endosome(GO:0005770) |
| 0.0 | 5.8 | GO:0031225 | anchored component of membrane(GO:0031225) |
| 0.0 | 0.3 | GO:0071682 | endocytic vesicle lumen(GO:0071682) |
| 0.0 | 1.9 | GO:0005782 | peroxisomal matrix(GO:0005782) microbody lumen(GO:0031907) |
| 0.0 | 24.5 | GO:0000139 | Golgi membrane(GO:0000139) |
| 0.0 | 25.6 | GO:0005789 | endoplasmic reticulum membrane(GO:0005789) |
| 0.0 | 5.5 | GO:0072562 | blood microparticle(GO:0072562) |
| 0.0 | 0.8 | GO:0005581 | collagen trimer(GO:0005581) |
| 0.0 | 3.2 | GO:0030139 | endocytic vesicle(GO:0030139) |
| 0.0 | 2.8 | GO:0030133 | transport vesicle(GO:0030133) |
| 0.0 | 25.8 | GO:0005615 | extracellular space(GO:0005615) |
| 0.0 | 1.6 | GO:0071013 | catalytic step 2 spliceosome(GO:0071013) |
| 0.0 | 1.7 | GO:0031234 | extrinsic component of cytoplasmic side of plasma membrane(GO:0031234) |
| 0.0 | 1.3 | GO:0022625 | cytosolic large ribosomal subunit(GO:0022625) |
Gene overrepresentation in molecular_function category:
| Log-likelihood per target | Total log-likelihood | Term | Description |
|---|---|---|---|
| 4.0 | 12.1 | GO:0003846 | 2-acylglycerol O-acyltransferase activity(GO:0003846) |
| 3.0 | 9.0 | GO:0004768 | stearoyl-CoA 9-desaturase activity(GO:0004768) acyl-CoA desaturase activity(GO:0016215) |
| 2.9 | 8.8 | GO:0033188 | sphingomyelin synthase activity(GO:0033188) ceramide cholinephosphotransferase activity(GO:0047493) |
| 2.7 | 19.0 | GO:0001517 | N-acetylglucosamine 6-O-sulfotransferase activity(GO:0001517) |
| 2.6 | 7.9 | GO:0061629 | RNA polymerase II sequence-specific DNA binding transcription factor binding(GO:0061629) |
| 2.3 | 32.5 | GO:0015095 | magnesium ion transmembrane transporter activity(GO:0015095) |
| 1.9 | 19.4 | GO:0036310 | annealing helicase activity(GO:0036310) |
| 1.8 | 45.8 | GO:0004383 | guanylate cyclase activity(GO:0004383) |
| 1.7 | 6.9 | GO:0015220 | choline transmembrane transporter activity(GO:0015220) |
| 1.6 | 4.7 | GO:0016019 | peptidoglycan receptor activity(GO:0016019) |
| 1.5 | 16.8 | GO:0000150 | recombinase activity(GO:0000150) |
| 1.5 | 7.5 | GO:0030628 | pre-mRNA 3'-splice site binding(GO:0030628) |
| 1.5 | 45.2 | GO:0005212 | structural constituent of eye lens(GO:0005212) |
| 1.3 | 6.6 | GO:0042289 | MHC class II protein binding(GO:0042289) |
| 1.2 | 4.9 | GO:0005502 | 11-cis retinal binding(GO:0005502) |
| 1.2 | 23.9 | GO:0000900 | translation repressor activity, nucleic acid binding(GO:0000900) |
| 1.2 | 9.5 | GO:0035312 | 5'-3' exodeoxyribonuclease activity(GO:0035312) |
| 1.2 | 3.5 | GO:0015234 | thiamine transmembrane transporter activity(GO:0015234) thiamine uptake transmembrane transporter activity(GO:0015403) |
| 1.0 | 12.7 | GO:0001011 | transcription factor activity, sequence-specific DNA binding, RNA polymerase recruiting(GO:0001011) transcription factor activity, TFIIB-class binding(GO:0001087) |
| 0.9 | 8.1 | GO:0043426 | MRF binding(GO:0043426) |
| 0.7 | 8.9 | GO:0005078 | MAP-kinase scaffold activity(GO:0005078) |
| 0.7 | 6.9 | GO:0030884 | lipid antigen binding(GO:0030882) endogenous lipid antigen binding(GO:0030883) exogenous lipid antigen binding(GO:0030884) |
| 0.7 | 4.6 | GO:0050294 | steroid sulfotransferase activity(GO:0050294) |
| 0.6 | 4.8 | GO:0004000 | adenosine deaminase activity(GO:0004000) |
| 0.6 | 10.8 | GO:0045505 | dynein intermediate chain binding(GO:0045505) |
| 0.5 | 7.0 | GO:0005344 | oxygen transporter activity(GO:0005344) |
| 0.5 | 2.6 | GO:0004974 | leukotriene receptor activity(GO:0004974) |
| 0.5 | 4.2 | GO:0005143 | interleukin-12 receptor binding(GO:0005143) |
| 0.5 | 3.3 | GO:0070573 | metallodipeptidase activity(GO:0070573) |
| 0.4 | 2.1 | GO:0016934 | extracellular-glycine-gated ion channel activity(GO:0016933) extracellular-glycine-gated chloride channel activity(GO:0016934) |
| 0.4 | 16.6 | GO:0030552 | cAMP binding(GO:0030552) |
| 0.4 | 10.0 | GO:0008266 | poly(U) RNA binding(GO:0008266) |
| 0.4 | 11.1 | GO:0047555 | 3',5'-cyclic-GMP phosphodiesterase activity(GO:0047555) |
| 0.4 | 15.5 | GO:0048020 | CCR chemokine receptor binding(GO:0048020) |
| 0.3 | 2.4 | GO:0039706 | co-receptor binding(GO:0039706) |
| 0.3 | 8.5 | GO:0070742 | C2H2 zinc finger domain binding(GO:0070742) |
| 0.3 | 3.6 | GO:0070700 | BMP receptor binding(GO:0070700) |
| 0.2 | 3.9 | GO:0031418 | L-ascorbic acid binding(GO:0031418) |
| 0.2 | 1.9 | GO:0016290 | palmitoyl-CoA hydrolase activity(GO:0016290) |
| 0.2 | 4.2 | GO:0043395 | heparan sulfate proteoglycan binding(GO:0043395) |
| 0.2 | 0.7 | GO:0016520 | growth hormone-releasing hormone receptor activity(GO:0016520) |
| 0.2 | 0.7 | GO:0016499 | orexin receptor activity(GO:0016499) |
| 0.2 | 1.0 | GO:0004630 | phospholipase D activity(GO:0004630) |
| 0.2 | 1.5 | GO:0005176 | ErbB-2 class receptor binding(GO:0005176) |
| 0.1 | 2.1 | GO:0036374 | glutathione hydrolase activity(GO:0036374) |
| 0.1 | 1.3 | GO:0005131 | growth hormone receptor binding(GO:0005131) |
| 0.1 | 7.8 | GO:0004712 | protein serine/threonine/tyrosine kinase activity(GO:0004712) |
| 0.1 | 8.9 | GO:0005089 | Rho guanyl-nucleotide exchange factor activity(GO:0005089) |
| 0.1 | 7.1 | GO:0048365 | Rac GTPase binding(GO:0048365) |
| 0.1 | 1.6 | GO:0005095 | GTPase inhibitor activity(GO:0005095) |
| 0.1 | 8.5 | GO:0032947 | protein complex scaffold(GO:0032947) |
| 0.1 | 2.9 | GO:0008395 | steroid hydroxylase activity(GO:0008395) |
| 0.1 | 22.9 | GO:0005516 | calmodulin binding(GO:0005516) |
| 0.1 | 22.5 | GO:0004252 | serine-type endopeptidase activity(GO:0004252) |
| 0.1 | 2.2 | GO:0004181 | metallocarboxypeptidase activity(GO:0004181) |
| 0.1 | 12.3 | GO:0005088 | Ras guanyl-nucleotide exchange factor activity(GO:0005088) |
| 0.1 | 5.9 | GO:0005262 | calcium channel activity(GO:0005262) |
| 0.0 | 0.4 | GO:0004862 | cAMP-dependent protein kinase inhibitor activity(GO:0004862) |
| 0.0 | 2.5 | GO:0002020 | protease binding(GO:0002020) |
| 0.0 | 0.8 | GO:0008301 | DNA binding, bending(GO:0008301) |
| 0.0 | 9.6 | GO:0001077 | transcriptional activator activity, RNA polymerase II core promoter proximal region sequence-specific binding(GO:0001077) |
| 0.0 | 0.3 | GO:0000774 | adenyl-nucleotide exchange factor activity(GO:0000774) |
| 0.0 | 19.1 | GO:0003712 | transcription cofactor activity(GO:0003712) |
| 0.0 | 10.1 | GO:0003779 | actin binding(GO:0003779) |
| 0.0 | 2.8 | GO:0017137 | Rab GTPase binding(GO:0017137) |
| 0.0 | 0.1 | GO:0004980 | melanocyte-stimulating hormone receptor activity(GO:0004980) |
| 0.0 | 11.0 | GO:0005509 | calcium ion binding(GO:0005509) |
| 0.0 | 1.8 | GO:0008083 | growth factor activity(GO:0008083) |
| 0.0 | 13.5 | GO:0032403 | protein complex binding(GO:0032403) |
| 0.0 | 0.4 | GO:0004715 | non-membrane spanning protein tyrosine kinase activity(GO:0004715) |
| 0.0 | 0.2 | GO:0070001 | aspartic-type endopeptidase activity(GO:0004190) aspartic-type peptidase activity(GO:0070001) |
| 0.0 | 1.0 | GO:0004867 | serine-type endopeptidase inhibitor activity(GO:0004867) |
Gene overrepresentation in C2:CP category:
| Log-likelihood per target | Total log-likelihood | Term | Description |
|---|---|---|---|
| 0.5 | 5.5 | ST IL 13 PATHWAY | Interleukin 13 (IL-13) Pathway |
| 0.2 | 7.4 | NABA COLLAGENS | Genes encoding collagen proteins |
| 0.2 | 8.9 | PID CDC42 REG PATHWAY | Regulation of CDC42 activity |
| 0.1 | 4.2 | PID SYNDECAN 1 PATHWAY | Syndecan-1-mediated signaling events |
| 0.1 | 12.4 | PID AR TF PATHWAY | Regulation of Androgen receptor activity |
| 0.1 | 14.4 | PID MYC ACTIV PATHWAY | Validated targets of C-MYC transcriptional activation |
| 0.1 | 12.4 | PID AR PATHWAY | Coregulation of Androgen receptor activity |
| 0.1 | 7.4 | PID TNF PATHWAY | TNF receptor signaling pathway |
| 0.1 | 2.4 | ST WNT BETA CATENIN PATHWAY | Wnt/beta-catenin Pathway |
| 0.1 | 4.4 | PID RET PATHWAY | Signaling events regulated by Ret tyrosine kinase |
| 0.1 | 1.4 | PID HIF1A PATHWAY | Hypoxic and oxygen homeostasis regulation of HIF-1-alpha |
| 0.1 | 3.2 | PID HEDGEHOG GLI PATHWAY | Hedgehog signaling events mediated by Gli proteins |
| 0.1 | 2.6 | PID ENDOTHELIN PATHWAY | Endothelins |
| 0.1 | 4.6 | PID E2F PATHWAY | E2F transcription factor network |
| 0.0 | 19.4 | NABA SECRETED FACTORS | Genes encoding secreted soluble factors |
| 0.0 | 1.0 | PID UPA UPAR PATHWAY | Urokinase-type plasminogen activator (uPA) and uPAR-mediated signaling |
| 0.0 | 0.4 | PID P38 ALPHA BETA PATHWAY | Regulation of p38-alpha and p38-beta |
Gene overrepresentation in C2:CP:REACTOME category:
| Log-likelihood per target | Total log-likelihood | Term | Description |
|---|---|---|---|
| 1.0 | 56.2 | REACTOME NITRIC OXIDE STIMULATES GUANYLATE CYCLASE | Genes involved in Nitric oxide stimulates guanylate cyclase |
| 0.6 | 19.0 | REACTOME KERATAN SULFATE BIOSYNTHESIS | Genes involved in Keratan sulfate biosynthesis |
| 0.4 | 16.6 | REACTOME RAP1 SIGNALLING | Genes involved in Rap1 signalling |
| 0.3 | 5.5 | REACTOME IL 6 SIGNALING | Genes involved in Interleukin-6 signaling |
| 0.3 | 2.9 | REACTOME SYNTHESIS OF BILE ACIDS AND BILE SALTS VIA 24 HYDROXYCHOLESTEROL | Genes involved in Synthesis of bile acids and bile salts via 24-hydroxycholesterol |
| 0.3 | 4.2 | REACTOME ACYL CHAIN REMODELLING OF PG | Genes involved in Acyl chain remodelling of PG |
| 0.3 | 14.1 | REACTOME MYOGENESIS | Genes involved in Myogenesis |
| 0.3 | 6.9 | REACTOME SYNTHESIS OF PC | Genes involved in Synthesis of PC |
| 0.2 | 8.0 | REACTOME DEGRADATION OF THE EXTRACELLULAR MATRIX | Genes involved in Degradation of the extracellular matrix |
| 0.2 | 8.2 | REACTOME PACKAGING OF TELOMERE ENDS | Genes involved in Packaging Of Telomere Ends |
| 0.2 | 4.6 | REACTOME CYTOSOLIC SULFONATION OF SMALL MOLECULES | Genes involved in Cytosolic sulfonation of small molecules |
| 0.1 | 2.6 | REACTOME EICOSANOID LIGAND BINDING RECEPTORS | Genes involved in Eicosanoid ligand-binding receptors |
| 0.1 | 1.9 | REACTOME SYNTHESIS OF BILE ACIDS AND BILE SALTS VIA 7ALPHA HYDROXYCHOLESTEROL | Genes involved in Synthesis of bile acids and bile salts via 7alpha-hydroxycholesterol |
| 0.1 | 7.4 | REACTOME EXTRACELLULAR MATRIX ORGANIZATION | Genes involved in Extracellular matrix organization |
| 0.1 | 4.8 | REACTOME SEMA4D INDUCED CELL MIGRATION AND GROWTH CONE COLLAPSE | Genes involved in Sema4D induced cell migration and growth-cone collapse |
| 0.1 | 2.8 | REACTOME ADHERENS JUNCTIONS INTERACTIONS | Genes involved in Adherens junctions interactions |
| 0.1 | 1.4 | REACTOME OXYGEN DEPENDENT PROLINE HYDROXYLATION OF HYPOXIA INDUCIBLE FACTOR ALPHA | Genes involved in Oxygen-dependent Proline Hydroxylation of Hypoxia-inducible Factor Alpha |
| 0.1 | 1.5 | REACTOME DOWNREGULATION OF ERBB2 ERBB3 SIGNALING | Genes involved in Downregulation of ERBB2:ERBB3 signaling |
| 0.1 | 2.1 | REACTOME GLUTATHIONE CONJUGATION | Genes involved in Glutathione conjugation |
| 0.1 | 8.9 | REACTOME SIGNALING BY RHO GTPASES | Genes involved in Signaling by Rho GTPases |
| 0.1 | 2.1 | REACTOME LIGAND GATED ION CHANNEL TRANSPORT | Genes involved in Ligand-gated ion channel transport |
| 0.1 | 21.6 | REACTOME GENERIC TRANSCRIPTION PATHWAY | Genes involved in Generic Transcription Pathway |
| 0.0 | 1.0 | REACTOME RETROGRADE NEUROTROPHIN SIGNALLING | Genes involved in Retrograde neurotrophin signalling |