Project
GNF SymAtlas + NCI-60 cancer cell lines, comparison of cancers vs non-cancers, human (Su, 2004; Ross, 2000)
Navigation
Downloads
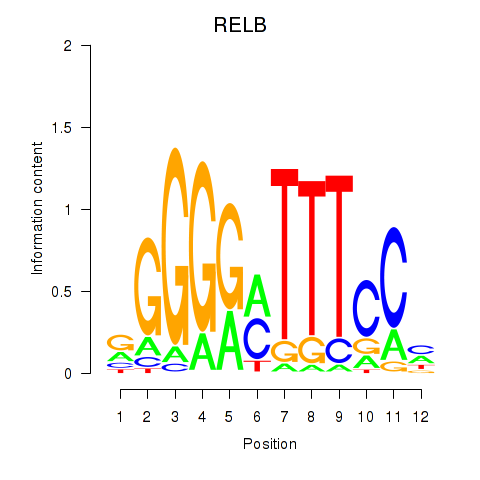
Results for RELB
Z-value: 0.82
Motif logo
Transcription factors associated with RELB
| Gene Symbol | Gene ID | Gene Info |
|---|---|---|
|
RELB
|
ENSG00000104856.9 | RELB proto-oncogene, NF-kB subunit |
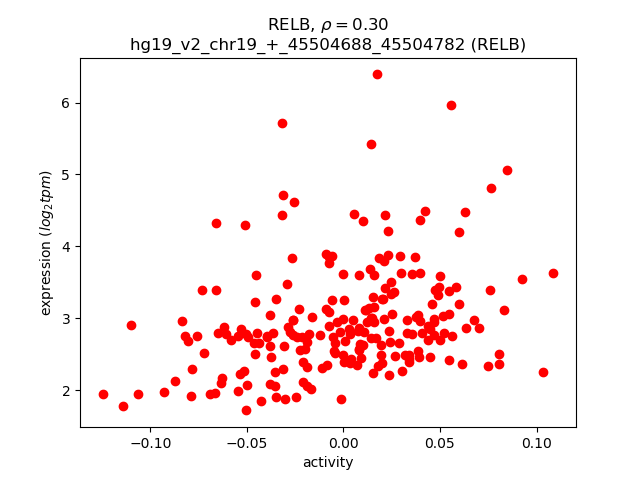
Activity-expression correlation:
| Gene | Promoter | Pearson corr. coef. | P-value | Plot |
|---|---|---|---|---|
| RELB | hg19_v2_chr19_+_45504688_45504782 | 0.30 | 6.8e-06 | Click! |
Activity profile of RELB motif
Sorted Z-values of RELB motif
| Promoter | Log-likelihood | Transcript | Gene | Gene Info |
|---|---|---|---|---|
| chr1_+_6845384 | 21.82 |
ENST00000303635.7
|
CAMTA1
|
calmodulin binding transcription activator 1 |
| chr5_-_149792295 | 17.90 |
ENST00000518797.1
ENST00000524315.1 ENST00000009530.7 ENST00000377795.3 |
CD74
|
CD74 molecule, major histocompatibility complex, class II invariant chain |
| chr22_-_19512893 | 16.11 |
ENST00000403084.1
ENST00000413119.2 |
CLDN5
|
claudin 5 |
| chrX_-_73072534 | 11.10 |
ENST00000429829.1
|
XIST
|
X inactive specific transcript (non-protein coding) |
| chr12_-_54982300 | 10.58 |
ENST00000547431.1
|
PPP1R1A
|
protein phosphatase 1, regulatory (inhibitor) subunit 1A |
| chr18_-_53068911 | 10.31 |
ENST00000537856.3
|
TCF4
|
transcription factor 4 |
| chr14_+_23299088 | 10.24 |
ENST00000355151.5
ENST00000397496.3 ENST00000555345.1 ENST00000432849.3 ENST00000553711.1 ENST00000556465.1 ENST00000397505.2 ENST00000557221.1 ENST00000311892.6 ENST00000556840.1 ENST00000555536.1 |
MRPL52
|
mitochondrial ribosomal protein L52 |
| chr12_-_54982420 | 9.85 |
ENST00000257905.8
|
PPP1R1A
|
protein phosphatase 1, regulatory (inhibitor) subunit 1A |
| chr1_-_32229523 | 9.61 |
ENST00000398547.1
ENST00000373655.2 ENST00000373658.3 ENST00000257070.4 |
BAI2
|
brain-specific angiogenesis inhibitor 2 |
| chr19_+_42381173 | 9.61 |
ENST00000221972.3
|
CD79A
|
CD79a molecule, immunoglobulin-associated alpha |
| chrX_+_103031421 | 8.89 |
ENST00000433491.1
ENST00000418604.1 ENST00000443502.1 |
PLP1
|
proteolipid protein 1 |
| chr6_+_32605195 | 8.61 |
ENST00000374949.2
|
HLA-DQA1
|
major histocompatibility complex, class II, DQ alpha 1 |
| chr2_-_89619904 | 8.61 |
ENST00000498574.1
|
IGKV1-39
|
immunoglobulin kappa variable 1-39 (gene/pseudogene) |
| chr2_-_89310012 | 8.43 |
ENST00000493819.1
|
IGKV1-9
|
immunoglobulin kappa variable 1-9 |
| chr2_-_89340242 | 8.39 |
ENST00000480492.1
|
IGKV1-12
|
immunoglobulin kappa variable 1-12 |
| chr19_+_42381337 | 7.92 |
ENST00000597454.1
ENST00000444740.2 |
CD79A
|
CD79a molecule, immunoglobulin-associated alpha |
| chr6_+_46097711 | 7.84 |
ENST00000321037.4
|
ENPP4
|
ectonucleotide pyrophosphatase/phosphodiesterase 4 (putative) |
| chr19_-_39390440 | 7.75 |
ENST00000249396.7
ENST00000414941.1 ENST00000392081.2 |
SIRT2
|
sirtuin 2 |
| chr10_+_124221036 | 7.60 |
ENST00000368984.3
|
HTRA1
|
HtrA serine peptidase 1 |
| chr6_-_32636145 | 7.38 |
ENST00000399084.1
|
HLA-DQB1
|
major histocompatibility complex, class II, DQ beta 1 |
| chr19_-_39390350 | 6.92 |
ENST00000447739.1
ENST00000358931.5 ENST00000407552.1 |
SIRT2
|
sirtuin 2 |
| chr20_-_4795747 | 6.79 |
ENST00000379376.2
|
RASSF2
|
Ras association (RalGDS/AF-6) domain family member 2 |
| chr1_-_32229934 | 6.53 |
ENST00000398542.1
|
BAI2
|
brain-specific angiogenesis inhibitor 2 |
| chr5_+_67584174 | 6.12 |
ENST00000320694.8
|
PIK3R1
|
phosphoinositide-3-kinase, regulatory subunit 1 (alpha) |
| chr9_-_136344197 | 5.96 |
ENST00000414172.1
ENST00000371897.4 |
SLC2A6
|
solute carrier family 2 (facilitated glucose transporter), member 6 |
| chr1_+_151043070 | 5.95 |
ENST00000368918.3
ENST00000368917.1 |
GABPB2
|
GA binding protein transcription factor, beta subunit 2 |
| chr6_+_32605134 | 5.85 |
ENST00000343139.5
ENST00000395363.1 ENST00000496318.1 |
HLA-DQA1
|
major histocompatibility complex, class II, DQ alpha 1 |
| chr22_+_22786288 | 5.76 |
ENST00000390301.2
|
IGLV1-36
|
immunoglobulin lambda variable 1-36 |
| chr14_+_24583836 | 5.76 |
ENST00000559115.1
ENST00000558215.1 ENST00000557810.1 ENST00000561375.1 ENST00000446197.3 ENST00000559796.1 ENST00000560713.1 ENST00000560901.1 ENST00000559382.1 |
DCAF11
|
DDB1 and CUL4 associated factor 11 |
| chr8_+_38644715 | 5.75 |
ENST00000317827.4
ENST00000379931.3 |
TACC1
|
transforming, acidic coiled-coil containing protein 1 |
| chr5_-_35230434 | 5.71 |
ENST00000504500.1
|
PRLR
|
prolactin receptor |
| chr6_+_42018251 | 5.70 |
ENST00000372978.3
ENST00000494547.1 ENST00000456846.2 ENST00000372982.4 ENST00000472818.1 ENST00000372977.3 |
TAF8
|
TAF8 RNA polymerase II, TATA box binding protein (TBP)-associated factor, 43kDa |
| chr10_+_13142225 | 5.59 |
ENST00000378747.3
|
OPTN
|
optineurin |
| chr4_+_185395947 | 5.55 |
ENST00000605834.1
|
RP11-326I11.3
|
RP11-326I11.3 |
| chr5_+_140588269 | 5.45 |
ENST00000541609.1
ENST00000239450.2 |
PCDHB12
|
protocadherin beta 12 |
| chr14_-_64970494 | 5.42 |
ENST00000608382.1
|
ZBTB25
|
zinc finger and BTB domain containing 25 |
| chr7_+_86273218 | 5.41 |
ENST00000361669.2
|
GRM3
|
glutamate receptor, metabotropic 3 |
| chr14_+_91580732 | 5.37 |
ENST00000519019.1
ENST00000523816.1 ENST00000517518.1 |
C14orf159
|
chromosome 14 open reading frame 159 |
| chr5_-_127418755 | 5.37 |
ENST00000501702.2
ENST00000501173.2 ENST00000514573.1 ENST00000499346.2 ENST00000606251.1 |
CTC-228N24.3
|
CTC-228N24.3 |
| chr2_+_61108771 | 5.31 |
ENST00000394479.3
|
REL
|
v-rel avian reticuloendotheliosis viral oncogene homolog |
| chr1_+_37940153 | 5.07 |
ENST00000373087.6
|
ZC3H12A
|
zinc finger CCCH-type containing 12A |
| chr20_+_44035200 | 5.06 |
ENST00000372717.1
ENST00000360981.4 |
DBNDD2
|
dysbindin (dystrobrevin binding protein 1) domain containing 2 |
| chr22_+_23134974 | 5.02 |
ENST00000390314.2
|
IGLV2-11
|
immunoglobulin lambda variable 2-11 |
| chr20_+_9494987 | 5.02 |
ENST00000427562.2
ENST00000246070.2 |
LAMP5
|
lysosomal-associated membrane protein family, member 5 |
| chr5_+_94890778 | 4.98 |
ENST00000380009.4
|
ARSK
|
arylsulfatase family, member K |
| chrX_+_16737718 | 4.92 |
ENST00000380155.3
|
SYAP1
|
synapse associated protein 1 |
| chr10_+_13142075 | 4.85 |
ENST00000378757.2
ENST00000430081.1 ENST00000378752.3 ENST00000378748.3 |
OPTN
|
optineurin |
| chr1_-_153113927 | 4.82 |
ENST00000368752.4
|
SPRR2B
|
small proline-rich protein 2B |
| chr16_+_3096638 | 4.71 |
ENST00000336577.4
|
MMP25
|
matrix metallopeptidase 25 |
| chr10_+_73975742 | 4.65 |
ENST00000299381.4
|
ANAPC16
|
anaphase promoting complex subunit 16 |
| chr7_+_150498610 | 4.62 |
ENST00000461345.1
|
TMEM176A
|
transmembrane protein 176A |
| chr7_+_150498783 | 4.59 |
ENST00000475536.1
ENST00000468689.1 |
TMEM176A
|
transmembrane protein 176A |
| chr10_+_101088836 | 4.53 |
ENST00000356713.4
|
CNNM1
|
cyclin M1 |
| chr14_+_91580708 | 4.51 |
ENST00000518868.1
|
C14orf159
|
chromosome 14 open reading frame 159 |
| chr11_-_64570706 | 4.51 |
ENST00000294066.2
ENST00000377350.3 |
MAP4K2
|
mitogen-activated protein kinase kinase kinase kinase 2 |
| chr1_+_156123359 | 4.44 |
ENST00000368284.1
ENST00000368286.2 ENST00000438830.1 |
SEMA4A
|
sema domain, immunoglobulin domain (Ig), transmembrane domain (TM) and short cytoplasmic domain, (semaphorin) 4A |
| chr1_+_156123318 | 4.42 |
ENST00000368285.3
|
SEMA4A
|
sema domain, immunoglobulin domain (Ig), transmembrane domain (TM) and short cytoplasmic domain, (semaphorin) 4A |
| chr9_+_101705893 | 4.39 |
ENST00000375001.3
|
COL15A1
|
collagen, type XV, alpha 1 |
| chr11_-_58345569 | 4.31 |
ENST00000528954.1
ENST00000528489.1 |
LPXN
|
leupaxin |
| chr10_+_12391481 | 4.24 |
ENST00000378847.3
|
CAMK1D
|
calcium/calmodulin-dependent protein kinase ID |
| chr15_+_85923856 | 4.20 |
ENST00000560302.1
ENST00000394518.2 ENST00000361243.2 ENST00000560256.1 |
AKAP13
|
A kinase (PRKA) anchor protein 13 |
| chr15_+_33010175 | 4.20 |
ENST00000300177.4
ENST00000560677.1 ENST00000560830.1 |
GREM1
|
gremlin 1, DAN family BMP antagonist |
| chr5_-_150521192 | 4.17 |
ENST00000523714.1
ENST00000521749.1 |
ANXA6
|
annexin A6 |
| chr13_+_32605437 | 4.16 |
ENST00000380250.3
|
FRY
|
furry homolog (Drosophila) |
| chr14_+_91580357 | 4.16 |
ENST00000298858.4
ENST00000521081.1 ENST00000520328.1 ENST00000256324.10 ENST00000524232.1 ENST00000522170.1 ENST00000519950.1 ENST00000523879.1 ENST00000521077.2 ENST00000518665.2 |
C14orf159
|
chromosome 14 open reading frame 159 |
| chr2_-_179672142 | 4.05 |
ENST00000342992.6
ENST00000360870.5 ENST00000460472.2 ENST00000589042.1 ENST00000591111.1 ENST00000342175.6 ENST00000359218.5 |
TTN
|
titin |
| chr14_-_106967788 | 3.98 |
ENST00000390622.2
|
IGHV1-46
|
immunoglobulin heavy variable 1-46 |
| chr22_-_38380543 | 3.95 |
ENST00000396884.2
|
SOX10
|
SRY (sex determining region Y)-box 10 |
| chr9_-_123476612 | 3.94 |
ENST00000426959.1
|
MEGF9
|
multiple EGF-like-domains 9 |
| chr16_+_48278178 | 3.93 |
ENST00000285737.4
ENST00000535754.1 |
LONP2
|
lon peptidase 2, peroxisomal |
| chrX_-_15872914 | 3.93 |
ENST00000380291.1
ENST00000545766.1 ENST00000421527.2 ENST00000329235.2 |
AP1S2
|
adaptor-related protein complex 1, sigma 2 subunit |
| chr2_+_166428839 | 3.90 |
ENST00000342316.4
|
CSRNP3
|
cysteine-serine-rich nuclear protein 3 |
| chr9_-_123476719 | 3.90 |
ENST00000373930.3
|
MEGF9
|
multiple EGF-like-domains 9 |
| chr14_+_91580777 | 3.83 |
ENST00000525393.2
ENST00000428926.2 ENST00000517362.1 |
C14orf159
|
chromosome 14 open reading frame 159 |
| chr9_-_132805430 | 3.80 |
ENST00000446176.2
ENST00000355681.3 ENST00000420781.1 |
FNBP1
|
formin binding protein 1 |
| chr6_+_138188551 | 3.80 |
ENST00000237289.4
ENST00000433680.1 |
TNFAIP3
|
tumor necrosis factor, alpha-induced protein 3 |
| chr11_-_111170526 | 3.79 |
ENST00000355430.4
|
COLCA1
|
colorectal cancer associated 1 |
| chr7_+_69064300 | 3.78 |
ENST00000342771.4
|
AUTS2
|
autism susceptibility candidate 2 |
| chr5_-_146833485 | 3.77 |
ENST00000398514.3
|
DPYSL3
|
dihydropyrimidinase-like 3 |
| chr2_-_68694390 | 3.74 |
ENST00000377957.3
|
FBXO48
|
F-box protein 48 |
| chr17_-_1420182 | 3.74 |
ENST00000421807.2
|
INPP5K
|
inositol polyphosphate-5-phosphatase K |
| chr12_-_122018859 | 3.73 |
ENST00000536437.1
ENST00000377071.4 ENST00000538046.2 |
KDM2B
|
lysine (K)-specific demethylase 2B |
| chr1_+_183441500 | 3.73 |
ENST00000456731.2
|
SMG7
|
SMG7 nonsense mediated mRNA decay factor |
| chr6_-_36355513 | 3.70 |
ENST00000340181.4
ENST00000373737.4 |
ETV7
|
ets variant 7 |
| chr14_-_35873856 | 3.68 |
ENST00000553342.1
ENST00000216797.5 ENST00000557140.1 |
NFKBIA
|
nuclear factor of kappa light polypeptide gene enhancer in B-cells inhibitor, alpha |
| chr17_-_19880992 | 3.66 |
ENST00000395536.3
ENST00000576896.1 ENST00000225737.6 |
AKAP10
|
A kinase (PRKA) anchor protein 10 |
| chr6_-_29527702 | 3.65 |
ENST00000377050.4
|
UBD
|
ubiquitin D |
| chr10_+_76586348 | 3.63 |
ENST00000372724.1
ENST00000287239.4 ENST00000372714.1 |
KAT6B
|
K(lysine) acetyltransferase 6B |
| chrX_-_65253506 | 3.60 |
ENST00000427538.1
|
VSIG4
|
V-set and immunoglobulin domain containing 4 |
| chr1_-_183559693 | 3.59 |
ENST00000367535.3
ENST00000413720.1 ENST00000418089.1 |
NCF2
|
neutrophil cytosolic factor 2 |
| chr2_+_89952792 | 3.55 |
ENST00000390265.2
|
IGKV1D-33
|
immunoglobulin kappa variable 1D-33 |
| chr20_+_44035847 | 3.52 |
ENST00000372712.2
|
DBNDD2
|
dysbindin (dystrobrevin binding protein 1) domain containing 2 |
| chr3_-_194072019 | 3.50 |
ENST00000429275.1
ENST00000323830.3 |
CPN2
|
carboxypeptidase N, polypeptide 2 |
| chrX_+_18443703 | 3.47 |
ENST00000379996.3
|
CDKL5
|
cyclin-dependent kinase-like 5 |
| chrX_-_21776281 | 3.45 |
ENST00000379494.3
|
SMPX
|
small muscle protein, X-linked |
| chr8_+_42128812 | 3.43 |
ENST00000520810.1
ENST00000416505.2 ENST00000519735.1 ENST00000520835.1 ENST00000379708.3 |
IKBKB
|
inhibitor of kappa light polypeptide gene enhancer in B-cells, kinase beta |
| chr1_+_117297007 | 3.39 |
ENST00000369478.3
ENST00000369477.1 |
CD2
|
CD2 molecule |
| chr6_-_32908792 | 3.36 |
ENST00000418107.2
|
HLA-DMB
|
major histocompatibility complex, class II, DM beta |
| chr7_+_123485102 | 3.30 |
ENST00000488323.1
ENST00000223026.4 |
HYAL4
|
hyaluronoglucosaminidase 4 |
| chr6_-_11779840 | 3.25 |
ENST00000506810.1
|
ADTRP
|
androgen-dependent TFPI-regulating protein |
| chr15_+_85923797 | 3.24 |
ENST00000559362.1
|
AKAP13
|
A kinase (PRKA) anchor protein 13 |
| chr8_-_9008206 | 3.23 |
ENST00000310455.3
|
PPP1R3B
|
protein phosphatase 1, regulatory subunit 3B |
| chr19_-_10679697 | 3.22 |
ENST00000335766.2
|
CDKN2D
|
cyclin-dependent kinase inhibitor 2D (p19, inhibits CDK4) |
| chr6_+_292051 | 3.20 |
ENST00000344450.5
|
DUSP22
|
dual specificity phosphatase 22 |
| chr3_+_52529346 | 3.18 |
ENST00000321725.6
|
STAB1
|
stabilin 1 |
| chr14_-_101034407 | 3.18 |
ENST00000443071.2
ENST00000557378.1 |
BEGAIN
|
brain-enriched guanylate kinase-associated |
| chr9_+_127539481 | 3.15 |
ENST00000373580.3
|
OLFML2A
|
olfactomedin-like 2A |
| chr1_+_156611960 | 3.10 |
ENST00000361588.5
|
BCAN
|
brevican |
| chr8_+_21911054 | 3.09 |
ENST00000519850.1
ENST00000381470.3 |
DMTN
|
dematin actin binding protein |
| chr19_-_17958832 | 3.07 |
ENST00000458235.1
|
JAK3
|
Janus kinase 3 |
| chr7_+_95401877 | 3.01 |
ENST00000524053.1
ENST00000324972.6 ENST00000537881.1 ENST00000437599.1 ENST00000359388.4 ENST00000413338.1 |
DYNC1I1
|
dynein, cytoplasmic 1, intermediate chain 1 |
| chr16_-_30134266 | 3.01 |
ENST00000484663.1
ENST00000478356.1 |
MAPK3
|
mitogen-activated protein kinase 3 |
| chr6_-_36355486 | 2.93 |
ENST00000538992.1
|
ETV7
|
ets variant 7 |
| chr7_-_82792215 | 2.92 |
ENST00000333891.9
ENST00000423517.2 |
PCLO
|
piccolo presynaptic cytomatrix protein |
| chrX_+_67913471 | 2.91 |
ENST00000374597.3
|
STARD8
|
StAR-related lipid transfer (START) domain containing 8 |
| chr17_-_1420006 | 2.91 |
ENST00000320345.6
ENST00000406424.4 |
INPP5K
|
inositol polyphosphate-5-phosphatase K |
| chr18_+_2846972 | 2.90 |
ENST00000254528.3
|
EMILIN2
|
elastin microfibril interfacer 2 |
| chr2_+_176957619 | 2.90 |
ENST00000392539.3
|
HOXD13
|
homeobox D13 |
| chr15_-_77712477 | 2.89 |
ENST00000560626.2
|
PEAK1
|
pseudopodium-enriched atypical kinase 1 |
| chr2_+_61108650 | 2.88 |
ENST00000295025.8
|
REL
|
v-rel avian reticuloendotheliosis viral oncogene homolog |
| chrX_+_108779870 | 2.86 |
ENST00000372107.1
|
NXT2
|
nuclear transport factor 2-like export factor 2 |
| chr4_-_185275104 | 2.84 |
ENST00000317596.3
|
RP11-290F5.2
|
RP11-290F5.2 |
| chr9_+_4490394 | 2.79 |
ENST00000262352.3
|
SLC1A1
|
solute carrier family 1 (neuronal/epithelial high affinity glutamate transporter, system Xag), member 1 |
| chr16_-_15188106 | 2.76 |
ENST00000429751.2
ENST00000564131.1 ENST00000563559.1 ENST00000198767.6 |
RRN3
|
RRN3 RNA polymerase I transcription factor homolog (S. cerevisiae) |
| chr9_+_130547958 | 2.76 |
ENST00000421939.1
ENST00000373265.2 |
CDK9
|
cyclin-dependent kinase 9 |
| chr2_-_122407007 | 2.75 |
ENST00000263710.4
ENST00000455322.2 ENST00000397587.3 ENST00000541377.1 |
CLASP1
|
cytoplasmic linker associated protein 1 |
| chr10_+_49514698 | 2.73 |
ENST00000432379.1
ENST00000429041.1 ENST00000374189.1 |
MAPK8
|
mitogen-activated protein kinase 8 |
| chr2_-_27718052 | 2.73 |
ENST00000264703.3
|
FNDC4
|
fibronectin type III domain containing 4 |
| chr13_-_30424821 | 2.72 |
ENST00000380680.4
|
UBL3
|
ubiquitin-like 3 |
| chr21_+_33245548 | 2.70 |
ENST00000270112.2
|
HUNK
|
hormonally up-regulated Neu-associated kinase |
| chr14_+_91581011 | 2.70 |
ENST00000523894.1
ENST00000522322.1 ENST00000523771.1 |
C14orf159
|
chromosome 14 open reading frame 159 |
| chr19_+_496454 | 2.64 |
ENST00000346144.4
ENST00000215637.3 ENST00000382683.4 |
MADCAM1
|
mucosal vascular addressin cell adhesion molecule 1 |
| chr13_-_78492955 | 2.62 |
ENST00000446573.1
|
EDNRB
|
endothelin receptor type B |
| chr3_+_42201653 | 2.61 |
ENST00000341421.3
ENST00000396175.1 |
TRAK1
|
trafficking protein, kinesin binding 1 |
| chr2_-_89247338 | 2.60 |
ENST00000496168.1
|
IGKV1-5
|
immunoglobulin kappa variable 1-5 |
| chr5_+_147763498 | 2.56 |
ENST00000340253.5
|
FBXO38
|
F-box protein 38 |
| chr5_+_147763539 | 2.56 |
ENST00000296701.6
ENST00000394370.3 |
FBXO38
|
F-box protein 38 |
| chr8_+_54793425 | 2.53 |
ENST00000522225.1
|
RGS20
|
regulator of G-protein signaling 20 |
| chr19_+_45504688 | 2.51 |
ENST00000221452.8
ENST00000540120.1 ENST00000505236.1 |
RELB
|
v-rel avian reticuloendotheliosis viral oncogene homolog B |
| chr2_+_203879568 | 2.50 |
ENST00000449802.1
|
NBEAL1
|
neurobeachin-like 1 |
| chrX_+_107683096 | 2.48 |
ENST00000328300.6
ENST00000361603.2 |
COL4A5
|
collagen, type IV, alpha 5 |
| chr1_-_146644036 | 2.47 |
ENST00000425272.2
|
PRKAB2
|
protein kinase, AMP-activated, beta 2 non-catalytic subunit |
| chr1_+_94884023 | 2.47 |
ENST00000315713.5
|
ABCD3
|
ATP-binding cassette, sub-family D (ALD), member 3 |
| chr19_-_33360647 | 2.44 |
ENST00000590341.1
ENST00000587772.1 ENST00000023064.4 |
SLC7A9
|
solute carrier family 7 (amino acid transporter light chain, bo,+ system), member 9 |
| chr1_+_35225339 | 2.41 |
ENST00000339480.1
|
GJB4
|
gap junction protein, beta 4, 30.3kDa |
| chr11_-_124806297 | 2.37 |
ENST00000298251.4
|
HEPACAM
|
hepatic and glial cell adhesion molecule |
| chr20_+_44098346 | 2.36 |
ENST00000372676.3
|
WFDC2
|
WAP four-disulfide core domain 2 |
| chr3_-_155461515 | 2.35 |
ENST00000399242.2
|
AC104472.1
|
CDNA FLJ26134 fis, clone TMS03713; Uncharacterized protein |
| chr10_+_114710425 | 2.35 |
ENST00000352065.5
ENST00000369395.1 |
TCF7L2
|
transcription factor 7-like 2 (T-cell specific, HMG-box) |
| chr20_+_17207636 | 2.35 |
ENST00000262545.2
|
PCSK2
|
proprotein convertase subtilisin/kexin type 2 |
| chr19_+_41222998 | 2.31 |
ENST00000263370.2
|
ITPKC
|
inositol-trisphosphate 3-kinase C |
| chr20_-_44600810 | 2.29 |
ENST00000322927.2
ENST00000426788.1 |
ZNF335
|
zinc finger protein 335 |
| chrX_+_108780347 | 2.29 |
ENST00000372103.1
|
NXT2
|
nuclear transport factor 2-like export factor 2 |
| chr12_+_70760056 | 2.28 |
ENST00000258111.4
|
KCNMB4
|
potassium large conductance calcium-activated channel, subfamily M, beta member 4 |
| chr12_-_103310987 | 2.27 |
ENST00000307000.2
|
PAH
|
phenylalanine hydroxylase |
| chr6_+_29910301 | 2.27 |
ENST00000376809.5
ENST00000376802.2 |
HLA-A
|
major histocompatibility complex, class I, A |
| chr13_-_78492927 | 2.25 |
ENST00000334286.5
|
EDNRB
|
endothelin receptor type B |
| chr14_+_96858454 | 2.24 |
ENST00000555570.1
|
AK7
|
adenylate kinase 7 |
| chr17_+_37793318 | 2.22 |
ENST00000336308.5
|
STARD3
|
StAR-related lipid transfer (START) domain containing 3 |
| chrX_+_37208540 | 2.22 |
ENST00000466533.1
ENST00000542554.1 ENST00000543642.1 ENST00000484460.1 ENST00000449135.2 ENST00000463135.1 ENST00000465127.1 |
PRRG1
TM4SF2
|
proline rich Gla (G-carboxyglutamic acid) 1 Uncharacterized protein; cDNA FLJ59144, highly similar to Tetraspanin-7 |
| chr1_+_156611704 | 2.21 |
ENST00000329117.5
|
BCAN
|
brevican |
| chr17_-_1419878 | 2.19 |
ENST00000449479.1
ENST00000477910.1 ENST00000542125.1 ENST00000575172.1 |
INPP5K
|
inositol polyphosphate-5-phosphatase K |
| chr4_-_74964904 | 2.19 |
ENST00000508487.2
|
CXCL2
|
chemokine (C-X-C motif) ligand 2 |
| chr8_+_75262629 | 2.17 |
ENST00000434412.2
|
GDAP1
|
ganglioside induced differentiation associated protein 1 |
| chr11_+_18287801 | 2.17 |
ENST00000532858.1
ENST00000405158.2 |
SAA1
|
serum amyloid A1 |
| chr11_-_3862206 | 2.16 |
ENST00000351018.4
|
RHOG
|
ras homolog family member G |
| chr5_-_132073210 | 2.16 |
ENST00000378735.1
ENST00000378746.4 |
KIF3A
|
kinesin family member 3A |
| chr12_-_14721283 | 2.15 |
ENST00000240617.5
|
PLBD1
|
phospholipase B domain containing 1 |
| chr17_-_39890893 | 2.14 |
ENST00000393939.2
ENST00000347901.4 ENST00000341193.5 ENST00000310778.5 |
HAP1
|
huntingtin-associated protein 1 |
| chr10_-_7708918 | 2.13 |
ENST00000256861.6
ENST00000397146.2 ENST00000446830.2 ENST00000397145.2 |
ITIH5
|
inter-alpha-trypsin inhibitor heavy chain family, member 5 |
| chrX_-_133119895 | 2.06 |
ENST00000370818.3
|
GPC3
|
glypican 3 |
| chr20_+_4667094 | 2.06 |
ENST00000424424.1
ENST00000457586.1 |
PRNP
|
prion protein |
| chr2_+_44589036 | 2.06 |
ENST00000402247.1
ENST00000407131.1 ENST00000403853.3 ENST00000378494.3 |
CAMKMT
|
calmodulin-lysine N-methyltransferase |
| chr20_+_17207665 | 2.03 |
ENST00000536609.1
|
PCSK2
|
proprotein convertase subtilisin/kexin type 2 |
| chr8_+_107738240 | 1.97 |
ENST00000449762.2
ENST00000297447.6 |
OXR1
|
oxidation resistance 1 |
| chr8_-_72274467 | 1.97 |
ENST00000340726.3
|
EYA1
|
eyes absent homolog 1 (Drosophila) |
| chr1_+_36690011 | 1.96 |
ENST00000354618.5
ENST00000469141.2 ENST00000478853.1 |
THRAP3
|
thyroid hormone receptor associated protein 3 |
| chr12_+_7055631 | 1.94 |
ENST00000543115.1
ENST00000399448.1 |
PTPN6
|
protein tyrosine phosphatase, non-receptor type 6 |
| chr19_+_14142535 | 1.93 |
ENST00000263379.2
|
IL27RA
|
interleukin 27 receptor, alpha |
| chrX_+_37208521 | 1.91 |
ENST00000378628.4
|
PRRG1
|
proline rich Gla (G-carboxyglutamic acid) 1 |
| chr20_-_1974692 | 1.91 |
ENST00000217305.2
ENST00000539905.1 |
PDYN
|
prodynorphin |
| chr17_-_1419914 | 1.91 |
ENST00000397335.3
ENST00000574561.1 |
INPP5K
|
inositol polyphosphate-5-phosphatase K |
| chr17_+_25799008 | 1.90 |
ENST00000583370.1
ENST00000398988.3 ENST00000268763.6 |
KSR1
|
kinase suppressor of ras 1 |
| chr2_-_56150184 | 1.89 |
ENST00000394554.1
|
EFEMP1
|
EGF containing fibulin-like extracellular matrix protein 1 |
| chrX_-_48858667 | 1.89 |
ENST00000376423.4
ENST00000376441.1 |
GRIPAP1
|
GRIP1 associated protein 1 |
| chr9_+_35792151 | 1.88 |
ENST00000342694.2
|
NPR2
|
natriuretic peptide receptor B/guanylate cyclase B (atrionatriuretic peptide receptor B) |
| chr20_+_57875758 | 1.87 |
ENST00000395654.3
|
EDN3
|
endothelin 3 |
| chr11_+_18287721 | 1.86 |
ENST00000356524.4
|
SAA1
|
serum amyloid A1 |
| chr2_-_122407097 | 1.85 |
ENST00000409078.3
|
CLASP1
|
cytoplasmic linker associated protein 1 |
| chr4_+_186064395 | 1.83 |
ENST00000281456.6
|
SLC25A4
|
solute carrier family 25 (mitochondrial carrier; adenine nucleotide translocator), member 4 |
| chr1_-_12677714 | 1.80 |
ENST00000376223.2
|
DHRS3
|
dehydrogenase/reductase (SDR family) member 3 |
| chr5_-_132948216 | 1.79 |
ENST00000265342.7
|
FSTL4
|
follistatin-like 4 |
| chr10_+_30722866 | 1.79 |
ENST00000263056.1
|
MAP3K8
|
mitogen-activated protein kinase kinase kinase 8 |
| chr20_-_18477862 | 1.78 |
ENST00000337227.4
|
RBBP9
|
retinoblastoma binding protein 9 |
| chr1_+_160313062 | 1.77 |
ENST00000294785.5
ENST00000368063.1 ENST00000437169.1 |
NCSTN
|
nicastrin |
| chr14_+_65878565 | 1.77 |
ENST00000556518.1
ENST00000557164.1 |
FUT8
|
fucosyltransferase 8 (alpha (1,6) fucosyltransferase) |
| chr11_+_10477733 | 1.74 |
ENST00000528723.1
|
AMPD3
|
adenosine monophosphate deaminase 3 |
| chr3_+_148415571 | 1.74 |
ENST00000497524.1
ENST00000349243.3 ENST00000542281.1 ENST00000418473.2 ENST00000404754.2 |
AGTR1
|
angiotensin II receptor, type 1 |
| chr21_-_43373999 | 1.72 |
ENST00000380486.3
|
C2CD2
|
C2 calcium-dependent domain containing 2 |
| chrX_-_72347916 | 1.69 |
ENST00000373518.1
|
NAP1L6
|
nucleosome assembly protein 1-like 6 |
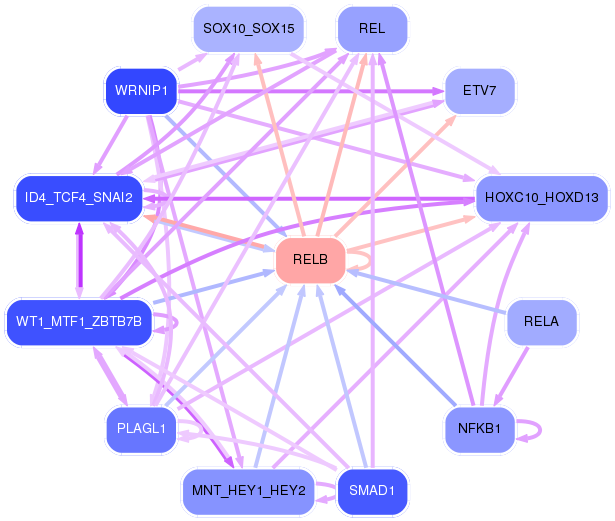
Network of associatons between targets according to the STRING database.

First level regulatory network of RELB
Gene Ontology Analysis
Gene overrepresentation in biological_process category:
| Log-likelihood per target | Total log-likelihood | Term | Description |
|---|---|---|---|
| 4.9 | 14.7 | GO:2000777 | positive regulation of oocyte maturation(GO:1900195) negative regulation of NLRP3 inflammasome complex assembly(GO:1900226) positive regulation of proteasomal ubiquitin-dependent protein catabolic process involved in cellular response to hypoxia(GO:2000777) |
| 3.6 | 17.9 | GO:0002906 | mature B cell apoptotic process(GO:0002901) regulation of mature B cell apoptotic process(GO:0002905) negative regulation of mature B cell apoptotic process(GO:0002906) |
| 2.7 | 10.7 | GO:2001151 | regulation of renal water transport(GO:2001151) positive regulation of renal water transport(GO:2001153) |
| 2.7 | 8.0 | GO:0090291 | negative regulation of osteoclast proliferation(GO:0090291) |
| 2.5 | 7.4 | GO:1900169 | regulation of glucocorticoid mediated signaling pathway(GO:1900169) |
| 2.0 | 16.1 | GO:1901552 | positive regulation of endothelial cell development(GO:1901552) positive regulation of establishment of endothelial barrier(GO:1903142) |
| 1.7 | 5.1 | GO:0000294 | nuclear-transcribed mRNA catabolic process, endonucleolytic cleavage-dependent decay(GO:0000294) negative regulation by host of viral genome replication(GO:0044828) |
| 1.6 | 4.9 | GO:0007497 | posterior midgut development(GO:0007497) endothelin receptor signaling pathway(GO:0086100) |
| 1.5 | 7.6 | GO:0060718 | chorionic trophoblast cell differentiation(GO:0060718) |
| 1.5 | 11.7 | GO:0001920 | negative regulation of receptor recycling(GO:0001920) |
| 1.4 | 4.3 | GO:0045210 | negative regulation of dendritic cell cytokine production(GO:0002731) FasL biosynthetic process(GO:0045210) |
| 1.3 | 4.0 | GO:0030241 | skeletal muscle myosin thick filament assembly(GO:0030241) |
| 1.2 | 3.7 | GO:0021555 | midbrain-hindbrain boundary morphogenesis(GO:0021555) fourth ventricle development(GO:0021592) third ventricle development(GO:0021678) |
| 1.1 | 5.7 | GO:0038161 | prolactin signaling pathway(GO:0038161) |
| 1.1 | 3.4 | GO:1902938 | regulation of intracellular calcium activated chloride channel activity(GO:1902938) |
| 1.1 | 3.4 | GO:2001190 | positive regulation of T cell activation via T cell receptor contact with antigen bound to MHC molecule on antigen presenting cell(GO:2001190) |
| 1.0 | 3.9 | GO:0071393 | cellular response to progesterone stimulus(GO:0071393) |
| 0.9 | 3.8 | GO:2000620 | positive regulation of histone H4-K16 acetylation(GO:2000620) |
| 0.9 | 2.7 | GO:1902595 | regulation of DNA replication origin binding(GO:1902595) |
| 0.9 | 4.5 | GO:0000189 | MAPK import into nucleus(GO:0000189) |
| 0.9 | 4.4 | GO:0030070 | insulin processing(GO:0030070) |
| 0.9 | 2.6 | GO:0030451 | regulation of complement activation, alternative pathway(GO:0030451) negative regulation of complement activation, alternative pathway(GO:0045957) |
| 0.9 | 3.4 | GO:1903347 | negative regulation of bicellular tight junction assembly(GO:1903347) |
| 0.9 | 4.3 | GO:0070427 | nucleotide-binding oligomerization domain containing 1 signaling pathway(GO:0070427) |
| 0.8 | 10.7 | GO:0032688 | negative regulation of interferon-beta production(GO:0032688) |
| 0.8 | 6.2 | GO:0050859 | negative regulation of B cell receptor signaling pathway(GO:0050859) |
| 0.7 | 3.7 | GO:0070842 | aggresome assembly(GO:0070842) |
| 0.7 | 3.6 | GO:0006957 | complement activation, alternative pathway(GO:0006957) |
| 0.7 | 2.1 | GO:0031587 | positive regulation of inositol 1,4,5-trisphosphate-sensitive calcium-release channel activity(GO:0031587) |
| 0.7 | 2.8 | GO:2001168 | regulation of histone H2B ubiquitination(GO:2001166) positive regulation of histone H2B ubiquitination(GO:2001168) |
| 0.7 | 9.2 | GO:2001199 | negative regulation of dendritic cell differentiation(GO:2001199) |
| 0.7 | 5.2 | GO:0000101 | sulfur amino acid transport(GO:0000101) |
| 0.6 | 1.8 | GO:0036071 | N-glycan fucosylation(GO:0036071) |
| 0.6 | 4.6 | GO:1903690 | negative regulation of wound healing, spreading of epidermal cells(GO:1903690) |
| 0.6 | 5.7 | GO:0001833 | inner cell mass cell proliferation(GO:0001833) |
| 0.6 | 3.4 | GO:0030885 | regulation of myeloid dendritic cell activation(GO:0030885) positive regulation of interferon-gamma secretion(GO:1902715) |
| 0.5 | 6.5 | GO:1901223 | negative regulation of NIK/NF-kappaB signaling(GO:1901223) |
| 0.5 | 8.9 | GO:0042759 | long-chain fatty acid biosynthetic process(GO:0042759) |
| 0.5 | 4.2 | GO:0090042 | tubulin deacetylation(GO:0090042) |
| 0.5 | 2.1 | GO:0072180 | mesonephric duct morphogenesis(GO:0072180) |
| 0.5 | 3.1 | GO:0070560 | protein secretion by platelet(GO:0070560) |
| 0.5 | 2.9 | GO:0048619 | embryonic hindgut morphogenesis(GO:0048619) |
| 0.5 | 2.4 | GO:0006651 | diacylglycerol biosynthetic process(GO:0006651) |
| 0.5 | 1.9 | GO:1905244 | regulation of modification of synaptic structure(GO:1905244) |
| 0.5 | 1.9 | GO:1900194 | negative regulation of oocyte maturation(GO:1900194) |
| 0.5 | 1.9 | GO:0010961 | cellular magnesium ion homeostasis(GO:0010961) |
| 0.4 | 1.3 | GO:0038043 | interleukin-5-mediated signaling pathway(GO:0038043) |
| 0.4 | 1.3 | GO:0022007 | neural plate elongation(GO:0014022) convergent extension involved in neural plate elongation(GO:0022007) |
| 0.4 | 1.7 | GO:0086097 | phospholipase C-activating angiotensin-activated signaling pathway(GO:0086097) |
| 0.4 | 4.7 | GO:0060022 | hard palate development(GO:0060022) |
| 0.4 | 2.4 | GO:0042048 | olfactory behavior(GO:0042048) |
| 0.4 | 2.8 | GO:0001180 | transcription initiation from RNA polymerase I promoter for nuclear large rRNA transcript(GO:0001180) |
| 0.4 | 5.4 | GO:0007196 | adenylate cyclase-inhibiting G-protein coupled glutamate receptor signaling pathway(GO:0007196) |
| 0.4 | 6.1 | GO:0051531 | NFAT protein import into nucleus(GO:0051531) |
| 0.4 | 3.7 | GO:0072383 | plus-end-directed vesicle transport along microtubule(GO:0072383) |
| 0.4 | 3.2 | GO:0005981 | regulation of glycogen catabolic process(GO:0005981) |
| 0.4 | 11.0 | GO:0030207 | chondroitin sulfate catabolic process(GO:0030207) |
| 0.4 | 15.9 | GO:0006536 | glutamate metabolic process(GO:0006536) |
| 0.3 | 3.4 | GO:0060267 | positive regulation of respiratory burst(GO:0060267) |
| 0.3 | 1.0 | GO:0036309 | protein localization to M-band(GO:0036309) protein localization to T-tubule(GO:0036371) |
| 0.3 | 1.3 | GO:0000255 | allantoin metabolic process(GO:0000255) |
| 0.3 | 2.9 | GO:0072513 | positive regulation of secondary heart field cardioblast proliferation(GO:0072513) |
| 0.3 | 19.1 | GO:0050885 | neuromuscular process controlling balance(GO:0050885) |
| 0.3 | 1.9 | GO:0002829 | negative regulation of type 2 immune response(GO:0002829) |
| 0.3 | 0.9 | GO:0002384 | hepatic immune response(GO:0002384) response to prolactin(GO:1990637) regulation of STAT protein import into nucleus(GO:2000364) positive regulation of STAT protein import into nucleus(GO:2000366) |
| 0.3 | 1.8 | GO:0015853 | adenine transport(GO:0015853) |
| 0.3 | 3.6 | GO:0006853 | carnitine shuttle(GO:0006853) |
| 0.3 | 3.2 | GO:0048102 | autophagic cell death(GO:0048102) |
| 0.3 | 1.7 | GO:0006196 | AMP catabolic process(GO:0006196) |
| 0.3 | 1.1 | GO:0010730 | negative regulation of hydrogen peroxide biosynthetic process(GO:0010730) |
| 0.3 | 8.7 | GO:0045063 | T-helper 1 cell differentiation(GO:0045063) |
| 0.3 | 3.0 | GO:2000580 | positive regulation of microtubule motor activity(GO:2000576) regulation of ATP-dependent microtubule motor activity, plus-end-directed(GO:2000580) positive regulation of ATP-dependent microtubule motor activity, plus-end-directed(GO:2000582) |
| 0.3 | 2.2 | GO:2000507 | positive regulation of energy homeostasis(GO:2000507) |
| 0.3 | 36.7 | GO:0030449 | regulation of complement activation(GO:0030449) |
| 0.3 | 2.4 | GO:1902856 | negative regulation of nonmotile primary cilium assembly(GO:1902856) |
| 0.3 | 4.5 | GO:0031998 | regulation of fatty acid beta-oxidation(GO:0031998) |
| 0.3 | 2.6 | GO:0019896 | axonal transport of mitochondrion(GO:0019896) |
| 0.3 | 2.1 | GO:0070424 | regulation of nucleotide-binding oligomerization domain containing signaling pathway(GO:0070424) |
| 0.3 | 3.0 | GO:0071447 | cellular response to hydroperoxide(GO:0071447) |
| 0.3 | 2.3 | GO:0002480 | antigen processing and presentation of exogenous peptide antigen via MHC class I, TAP-independent(GO:0002480) |
| 0.2 | 2.2 | GO:0006701 | progesterone biosynthetic process(GO:0006701) |
| 0.2 | 7.8 | GO:0030194 | positive regulation of blood coagulation(GO:0030194) positive regulation of hemostasis(GO:1900048) |
| 0.2 | 1.9 | GO:0048050 | post-embryonic eye morphogenesis(GO:0048050) |
| 0.2 | 1.2 | GO:0010727 | negative regulation of hydrogen peroxide metabolic process(GO:0010727) |
| 0.2 | 1.2 | GO:0046085 | adenosine metabolic process(GO:0046085) |
| 0.2 | 20.4 | GO:0005977 | glycogen metabolic process(GO:0005977) |
| 0.2 | 3.2 | GO:0002710 | negative regulation of T cell mediated immunity(GO:0002710) |
| 0.2 | 23.6 | GO:0031295 | T cell costimulation(GO:0031295) |
| 0.2 | 0.9 | GO:0086046 | membrane depolarization during SA node cell action potential(GO:0086046) |
| 0.2 | 16.9 | GO:0042100 | B cell proliferation(GO:0042100) |
| 0.2 | 2.8 | GO:0021670 | lateral ventricle development(GO:0021670) |
| 0.2 | 6.0 | GO:1904659 | hexose transmembrane transport(GO:0035428) glucose transmembrane transport(GO:1904659) |
| 0.2 | 1.0 | GO:0007042 | lysosomal lumen acidification(GO:0007042) |
| 0.2 | 2.1 | GO:0043950 | positive regulation of cAMP-mediated signaling(GO:0043950) |
| 0.2 | 4.5 | GO:0000185 | activation of MAPKKK activity(GO:0000185) |
| 0.2 | 3.3 | GO:0008053 | mitochondrial fusion(GO:0008053) |
| 0.2 | 0.6 | GO:0051935 | amino acid neurotransmitter reuptake(GO:0051933) glutamate reuptake(GO:0051935) |
| 0.2 | 2.5 | GO:0038063 | collagen-activated tyrosine kinase receptor signaling pathway(GO:0038063) |
| 0.2 | 0.7 | GO:1900168 | glial cell-derived neurotrophic factor secretion(GO:0044467) regulation of glial cell-derived neurotrophic factor secretion(GO:1900166) positive regulation of glial cell-derived neurotrophic factor secretion(GO:1900168) |
| 0.2 | 1.8 | GO:0061000 | negative regulation of dendritic spine development(GO:0061000) |
| 0.2 | 2.3 | GO:0080182 | histone H3-K4 trimethylation(GO:0080182) |
| 0.2 | 4.2 | GO:0051560 | mitochondrial calcium ion homeostasis(GO:0051560) |
| 0.2 | 0.7 | GO:1902261 | positive regulation of delayed rectifier potassium channel activity(GO:1902261) |
| 0.2 | 2.3 | GO:1902222 | L-phenylalanine metabolic process(GO:0006558) L-phenylalanine catabolic process(GO:0006559) erythrose 4-phosphate/phosphoenolpyruvate family amino acid metabolic process(GO:1902221) erythrose 4-phosphate/phosphoenolpyruvate family amino acid catabolic process(GO:1902222) |
| 0.2 | 0.5 | GO:0015860 | purine nucleoside transmembrane transport(GO:0015860) |
| 0.2 | 0.6 | GO:0002266 | follicular dendritic cell activation(GO:0002266) follicular dendritic cell differentiation(GO:0002268) |
| 0.2 | 0.6 | GO:0046967 | cytosol to ER transport(GO:0046967) |
| 0.2 | 1.1 | GO:0023041 | neuronal signal transduction(GO:0023041) |
| 0.1 | 0.7 | GO:0051182 | coenzyme transport(GO:0051182) |
| 0.1 | 0.3 | GO:0071332 | cellular response to fructose stimulus(GO:0071332) |
| 0.1 | 4.0 | GO:0050716 | positive regulation of interleukin-1 secretion(GO:0050716) |
| 0.1 | 16.6 | GO:0002377 | immunoglobulin production(GO:0002377) |
| 0.1 | 1.8 | GO:0048387 | negative regulation of retinoic acid receptor signaling pathway(GO:0048387) |
| 0.1 | 2.2 | GO:0036149 | phosphatidylinositol acyl-chain remodeling(GO:0036149) |
| 0.1 | 1.6 | GO:0021591 | ventricular system development(GO:0021591) |
| 0.1 | 3.0 | GO:0045730 | respiratory burst(GO:0045730) |
| 0.1 | 3.9 | GO:0050690 | regulation of defense response to virus by virus(GO:0050690) |
| 0.1 | 0.3 | GO:0009750 | response to fructose(GO:0009750) positive regulation of prostaglandin biosynthetic process(GO:0031394) positive regulation of unsaturated fatty acid biosynthetic process(GO:2001280) |
| 0.1 | 2.3 | GO:0005513 | detection of calcium ion(GO:0005513) |
| 0.1 | 0.8 | GO:0035754 | B cell chemotaxis(GO:0035754) |
| 0.1 | 2.6 | GO:0050901 | leukocyte tethering or rolling(GO:0050901) |
| 0.1 | 0.8 | GO:0001865 | NK T cell differentiation(GO:0001865) |
| 0.1 | 0.9 | GO:0086024 | adrenergic receptor signaling pathway involved in positive regulation of heart rate(GO:0086024) |
| 0.1 | 1.8 | GO:0007220 | Notch receptor processing(GO:0007220) |
| 0.1 | 0.5 | GO:1903971 | positive regulation of odontogenesis of dentin-containing tooth(GO:0042488) mammary gland fat development(GO:0060611) positive regulation of macrophage colony-stimulating factor signaling pathway(GO:1902228) positive regulation of response to macrophage colony-stimulating factor(GO:1903971) positive regulation of cellular response to macrophage colony-stimulating factor stimulus(GO:1903974) positive regulation of microglial cell migration(GO:1904141) |
| 0.1 | 1.6 | GO:0097094 | craniofacial suture morphogenesis(GO:0097094) |
| 0.1 | 3.0 | GO:0051491 | positive regulation of filopodium assembly(GO:0051491) |
| 0.1 | 1.1 | GO:0001886 | endothelial cell morphogenesis(GO:0001886) |
| 0.1 | 2.0 | GO:0048026 | positive regulation of mRNA splicing, via spliceosome(GO:0048026) |
| 0.1 | 4.5 | GO:0018149 | peptide cross-linking(GO:0018149) |
| 0.1 | 0.9 | GO:0090023 | positive regulation of neutrophil chemotaxis(GO:0090023) |
| 0.1 | 0.9 | GO:0016322 | neuron remodeling(GO:0016322) |
| 0.1 | 3.8 | GO:0006897 | endocytosis(GO:0006897) |
| 0.1 | 1.6 | GO:0070286 | axonemal dynein complex assembly(GO:0070286) |
| 0.1 | 0.3 | GO:2001197 | regulation of basement membrane assembly involved in embryonic body morphogenesis(GO:1904259) positive regulation of basement membrane assembly involved in embryonic body morphogenesis(GO:1904261) basement membrane assembly involved in embryonic body morphogenesis(GO:2001197) |
| 0.1 | 2.2 | GO:0090004 | positive regulation of establishment of protein localization to plasma membrane(GO:0090004) |
| 0.1 | 4.5 | GO:0006811 | ion transport(GO:0006811) |
| 0.1 | 4.9 | GO:0019933 | cAMP-mediated signaling(GO:0019933) |
| 0.1 | 3.5 | GO:0050775 | positive regulation of dendrite morphogenesis(GO:0050775) |
| 0.1 | 0.3 | GO:0072183 | negative regulation by virus of viral protein levels in host cell(GO:0046725) negative regulation of nephron tubule epithelial cell differentiation(GO:0072183) negative regulation of metanephric nephron tubule epithelial cell differentiation(GO:0072308) negative regulation of epithelial cell differentiation involved in kidney development(GO:2000697) |
| 0.1 | 0.7 | GO:0002475 | antigen processing and presentation via MHC class Ib(GO:0002475) antigen processing and presentation of lipid antigen via MHC class Ib(GO:0048003) antigen processing and presentation, exogenous lipid antigen via MHC class Ib(GO:0048007) |
| 0.1 | 1.7 | GO:0006590 | thyroid hormone generation(GO:0006590) |
| 0.1 | 2.1 | GO:0022400 | regulation of rhodopsin mediated signaling pathway(GO:0022400) |
| 0.1 | 0.7 | GO:0039530 | MDA-5 signaling pathway(GO:0039530) |
| 0.1 | 1.5 | GO:0002026 | regulation of the force of heart contraction(GO:0002026) |
| 0.1 | 1.6 | GO:0032008 | positive regulation of TOR signaling(GO:0032008) |
| 0.1 | 3.8 | GO:0030574 | collagen catabolic process(GO:0030574) |
| 0.1 | 0.8 | GO:0098719 | sodium ion import across plasma membrane(GO:0098719) sodium ion import into cell(GO:1990118) |
| 0.1 | 3.6 | GO:0043966 | histone H3 acetylation(GO:0043966) |
| 0.1 | 3.9 | GO:0010923 | negative regulation of phosphatase activity(GO:0010923) |
| 0.1 | 1.5 | GO:0060334 | regulation of interferon-gamma-mediated signaling pathway(GO:0060334) |
| 0.0 | 6.0 | GO:0090501 | RNA phosphodiester bond hydrolysis(GO:0090501) |
| 0.0 | 3.2 | GO:0016525 | negative regulation of angiogenesis(GO:0016525) |
| 0.0 | 1.4 | GO:0048247 | lymphocyte chemotaxis(GO:0048247) |
| 0.0 | 1.1 | GO:0045747 | positive regulation of Notch signaling pathway(GO:0045747) |
| 0.0 | 2.1 | GO:0015949 | nucleobase-containing small molecule interconversion(GO:0015949) |
| 0.0 | 2.2 | GO:0045214 | sarcomere organization(GO:0045214) |
| 0.0 | 0.2 | GO:0070942 | neutrophil mediated cytotoxicity(GO:0070942) neutrophil mediated killing of symbiont cell(GO:0070943) neutrophil mediated killing of bacterium(GO:0070944) |
| 0.0 | 3.0 | GO:0043647 | inositol phosphate metabolic process(GO:0043647) |
| 0.0 | 1.1 | GO:0035116 | embryonic hindlimb morphogenesis(GO:0035116) |
| 0.0 | 0.7 | GO:0032012 | regulation of ARF protein signal transduction(GO:0032012) |
| 0.0 | 2.0 | GO:0071222 | cellular response to lipopolysaccharide(GO:0071222) |
| 0.0 | 0.3 | GO:0006069 | ethanol oxidation(GO:0006069) |
| 0.0 | 1.0 | GO:0006979 | response to oxidative stress(GO:0006979) |
| 0.0 | 1.2 | GO:0006958 | complement activation, classical pathway(GO:0006958) |
| 0.0 | 0.3 | GO:0051601 | exocyst localization(GO:0051601) |
| 0.0 | 1.1 | GO:0001578 | microtubule bundle formation(GO:0001578) |
| 0.0 | 1.9 | GO:0070125 | mitochondrial translational elongation(GO:0070125) mitochondrial translational termination(GO:0070126) |
| 0.0 | 2.5 | GO:0051436 | negative regulation of ubiquitin-protein ligase activity involved in mitotic cell cycle(GO:0051436) regulation of ubiquitin-protein ligase activity involved in mitotic cell cycle(GO:0051439) |
| 0.0 | 0.7 | GO:0072661 | protein targeting to plasma membrane(GO:0072661) |
| 0.0 | 1.9 | GO:0007218 | neuropeptide signaling pathway(GO:0007218) |
| 0.0 | 0.1 | GO:0072672 | neutrophil extravasation(GO:0072672) regulation of neutrophil extravasation(GO:2000389) |
| 0.0 | 3.4 | GO:0006941 | striated muscle contraction(GO:0006941) |
| 0.0 | 1.3 | GO:0006687 | glycosphingolipid metabolic process(GO:0006687) |
| 0.0 | 0.2 | GO:0043928 | exonucleolytic nuclear-transcribed mRNA catabolic process involved in deadenylation-dependent decay(GO:0043928) |
| 0.0 | 3.2 | GO:0065004 | protein-DNA complex assembly(GO:0065004) |
| 0.0 | 0.1 | GO:0030157 | pancreatic juice secretion(GO:0030157) |
| 0.0 | 0.0 | GO:0097084 | vascular smooth muscle cell development(GO:0097084) |
| 0.0 | 1.0 | GO:0007286 | spermatid development(GO:0007286) |
Gene overrepresentation in cellular_component category:
| Log-likelihood per target | Total log-likelihood | Term | Description |
|---|---|---|---|
| 2.6 | 17.9 | GO:0035692 | macrophage migration inhibitory factor receptor complex(GO:0035692) |
| 2.5 | 17.5 | GO:0019815 | B cell receptor complex(GO:0019815) |
| 1.6 | 14.7 | GO:0072687 | meiotic spindle(GO:0072687) |
| 1.5 | 6.1 | GO:1990578 | perinuclear endoplasmic reticulum membrane(GO:1990578) |
| 1.3 | 25.2 | GO:0042613 | MHC class II protein complex(GO:0042613) |
| 1.0 | 11.5 | GO:0033256 | I-kappaB/NF-kappaB complex(GO:0033256) |
| 0.9 | 2.8 | GO:0005879 | axonemal microtubule(GO:0005879) |
| 0.9 | 3.7 | GO:0016939 | kinesin II complex(GO:0016939) |
| 0.8 | 5.1 | GO:0042406 | extrinsic component of endoplasmic reticulum membrane(GO:0042406) |
| 0.8 | 4.6 | GO:0030981 | cortical microtubule cytoskeleton(GO:0030981) |
| 0.7 | 5.0 | GO:0032584 | growth cone membrane(GO:0032584) |
| 0.6 | 6.3 | GO:0098651 | basement membrane collagen trimer(GO:0098651) |
| 0.6 | 3.4 | GO:0005927 | muscle tendon junction(GO:0005927) |
| 0.5 | 3.2 | GO:0097129 | cyclin D2-CDK4 complex(GO:0097129) |
| 0.5 | 16.1 | GO:0016327 | apicolateral plasma membrane(GO:0016327) |
| 0.4 | 3.6 | GO:0032010 | phagolysosome(GO:0032010) |
| 0.4 | 2.2 | GO:0031143 | pseudopodium(GO:0031143) |
| 0.4 | 3.5 | GO:0044294 | dendritic growth cone(GO:0044294) |
| 0.4 | 1.9 | GO:0098837 | postsynaptic recycling endosome(GO:0098837) |
| 0.4 | 3.6 | GO:0070775 | H3 histone acetyltransferase complex(GO:0070775) MOZ/MORF histone acetyltransferase complex(GO:0070776) |
| 0.3 | 3.2 | GO:0042587 | glycogen granule(GO:0042587) |
| 0.3 | 3.4 | GO:0008385 | IkappaB kinase complex(GO:0008385) |
| 0.3 | 2.8 | GO:0008024 | cyclin/CDK positive transcription elongation factor complex(GO:0008024) |
| 0.3 | 8.9 | GO:0046658 | anchored component of plasma membrane(GO:0046658) |
| 0.2 | 0.9 | GO:0005896 | interleukin-6 receptor complex(GO:0005896) |
| 0.2 | 1.6 | GO:0061700 | GATOR2 complex(GO:0061700) |
| 0.2 | 2.3 | GO:0042612 | MHC class I protein complex(GO:0042612) |
| 0.2 | 3.1 | GO:0031095 | platelet dense tubular network membrane(GO:0031095) |
| 0.2 | 1.9 | GO:0042105 | alpha-beta T cell receptor complex(GO:0042105) |
| 0.2 | 5.8 | GO:0080008 | Cul4-RING E3 ubiquitin ligase complex(GO:0080008) |
| 0.2 | 1.8 | GO:0070765 | gamma-secretase complex(GO:0070765) |
| 0.2 | 0.9 | GO:0071256 | Sec61 translocon complex(GO:0005784) translocon complex(GO:0071256) |
| 0.2 | 4.6 | GO:0005680 | anaphase-promoting complex(GO:0005680) |
| 0.2 | 5.6 | GO:0005859 | muscle myosin complex(GO:0005859) |
| 0.1 | 0.4 | GO:0016938 | kinesin I complex(GO:0016938) |
| 0.1 | 2.2 | GO:0044232 | organelle membrane contact site(GO:0044232) |
| 0.1 | 2.4 | GO:0005922 | connexon complex(GO:0005922) |
| 0.1 | 8.2 | GO:0055038 | recycling endosome membrane(GO:0055038) |
| 0.1 | 3.3 | GO:0031307 | integral component of mitochondrial outer membrane(GO:0031307) |
| 0.1 | 2.6 | GO:0001527 | microfibril(GO:0001527) fibril(GO:0043205) |
| 0.1 | 1.0 | GO:0000220 | vacuolar proton-transporting V-type ATPase, V0 domain(GO:0000220) |
| 0.1 | 3.0 | GO:0005868 | cytoplasmic dynein complex(GO:0005868) |
| 0.1 | 1.8 | GO:0042622 | photoreceptor outer segment membrane(GO:0042622) |
| 0.1 | 2.7 | GO:0031312 | extrinsic component of organelle membrane(GO:0031312) |
| 0.1 | 3.8 | GO:0005905 | clathrin-coated pit(GO:0005905) |
| 0.1 | 8.7 | GO:0101003 | ficolin-1-rich granule membrane(GO:0101003) |
| 0.1 | 9.3 | GO:0030672 | synaptic vesicle membrane(GO:0030672) exocytic vesicle membrane(GO:0099501) |
| 0.1 | 0.3 | GO:0045180 | basal cortex(GO:0045180) |
| 0.1 | 4.7 | GO:1904115 | axon cytoplasm(GO:1904115) |
| 0.1 | 0.6 | GO:0042825 | TAP complex(GO:0042825) |
| 0.1 | 5.7 | GO:0031904 | endosome lumen(GO:0031904) |
| 0.1 | 2.0 | GO:0031588 | nucleotide-activated protein kinase complex(GO:0031588) |
| 0.1 | 2.2 | GO:0016281 | eukaryotic translation initiation factor 4F complex(GO:0016281) |
| 0.1 | 4.5 | GO:0001533 | cornified envelope(GO:0001533) |
| 0.1 | 0.8 | GO:1990111 | spermatoproteasome complex(GO:1990111) |
| 0.1 | 5.0 | GO:0016235 | aggresome(GO:0016235) |
| 0.1 | 18.6 | GO:0005802 | trans-Golgi network(GO:0005802) |
| 0.1 | 3.9 | GO:0031907 | peroxisomal matrix(GO:0005782) microbody lumen(GO:0031907) |
| 0.1 | 1.6 | GO:0016581 | NuRD complex(GO:0016581) CHD-type complex(GO:0090545) |
| 0.1 | 4.5 | GO:0016323 | basolateral plasma membrane(GO:0016323) |
| 0.1 | 0.5 | GO:1990682 | CSF1-CSF1R complex(GO:1990682) |
| 0.1 | 6.9 | GO:0030864 | cortical actin cytoskeleton(GO:0030864) |
| 0.1 | 4.1 | GO:0002102 | podosome(GO:0002102) |
| 0.1 | 4.0 | GO:0005881 | cytoplasmic microtubule(GO:0005881) |
| 0.1 | 9.5 | GO:0031225 | anchored component of membrane(GO:0031225) |
| 0.1 | 1.9 | GO:0008074 | guanylate cyclase complex, soluble(GO:0008074) |
| 0.1 | 2.5 | GO:0099738 | cell cortex region(GO:0099738) |
| 0.1 | 2.0 | GO:0035145 | exon-exon junction complex(GO:0035145) |
| 0.1 | 14.5 | GO:0072562 | blood microparticle(GO:0072562) |
| 0.1 | 5.5 | GO:0005901 | caveola(GO:0005901) |
| 0.1 | 0.2 | GO:0055087 | Ski complex(GO:0055087) |
| 0.1 | 5.4 | GO:0042734 | presynaptic membrane(GO:0042734) |
| 0.1 | 2.4 | GO:0001917 | photoreceptor inner segment(GO:0001917) |
| 0.1 | 3.7 | GO:0031519 | PcG protein complex(GO:0031519) |
| 0.1 | 5.4 | GO:0000777 | condensed chromosome kinetochore(GO:0000777) |
| 0.1 | 2.7 | GO:0031526 | brush border membrane(GO:0031526) |
| 0.1 | 4.7 | GO:0005604 | basement membrane(GO:0005604) |
| 0.0 | 66.7 | GO:0005615 | extracellular space(GO:0005615) |
| 0.0 | 1.9 | GO:0000315 | organellar large ribosomal subunit(GO:0000315) mitochondrial large ribosomal subunit(GO:0005762) |
| 0.0 | 5.7 | GO:0045111 | intermediate filament cytoskeleton(GO:0045111) |
| 0.0 | 4.2 | GO:0031902 | late endosome membrane(GO:0031902) |
| 0.0 | 1.0 | GO:0031430 | M band(GO:0031430) |
| 0.0 | 3.8 | GO:0034705 | voltage-gated potassium channel complex(GO:0008076) potassium channel complex(GO:0034705) |
| 0.0 | 2.3 | GO:0035097 | histone methyltransferase complex(GO:0035097) |
| 0.0 | 4.2 | GO:0030427 | site of polarized growth(GO:0030427) |
| 0.0 | 2.3 | GO:0005770 | late endosome(GO:0005770) |
| 0.0 | 5.2 | GO:0043209 | myelin sheath(GO:0043209) |
| 0.0 | 2.5 | GO:0030666 | endocytic vesicle membrane(GO:0030666) |
| 0.0 | 0.3 | GO:0000788 | nuclear nucleosome(GO:0000788) |
| 0.0 | 0.9 | GO:0005891 | voltage-gated calcium channel complex(GO:0005891) |
| 0.0 | 1.7 | GO:0032587 | ruffle membrane(GO:0032587) |
| 0.0 | 0.6 | GO:0005669 | transcription factor TFIID complex(GO:0005669) |
| 0.0 | 2.9 | GO:0016324 | apical plasma membrane(GO:0016324) |
| 0.0 | 1.7 | GO:0034774 | secretory granule lumen(GO:0034774) |
| 0.0 | 1.2 | GO:0005766 | primary lysosome(GO:0005766) azurophil granule(GO:0042582) |
Gene overrepresentation in molecular_function category:
| Log-likelihood per target | Total log-likelihood | Term | Description |
|---|---|---|---|
| 4.9 | 14.7 | GO:0034739 | histone deacetylase activity (H4-K16 specific)(GO:0034739) |
| 4.1 | 20.6 | GO:0047820 | D-glutamate cyclase activity(GO:0047820) |
| 3.6 | 17.9 | GO:0042289 | MHC class II protein binding(GO:0042289) |
| 2.6 | 20.4 | GO:0004865 | protein serine/threonine phosphatase inhibitor activity(GO:0004865) |
| 1.8 | 10.7 | GO:0042577 | lipid phosphatase activity(GO:0042577) |
| 1.7 | 21.8 | GO:0032395 | MHC class II receptor activity(GO:0032395) |
| 1.6 | 4.9 | GO:0004962 | endothelin receptor activity(GO:0004962) |
| 1.2 | 4.6 | GO:0043515 | kinetochore binding(GO:0043515) |
| 1.1 | 5.7 | GO:0004925 | prolactin receptor activity(GO:0004925) |
| 1.1 | 5.4 | GO:0001641 | group II metabotropic glutamate receptor activity(GO:0001641) |
| 0.9 | 3.8 | GO:0019828 | aspartic-type endopeptidase inhibitor activity(GO:0019828) |
| 0.9 | 2.8 | GO:0001181 | transcription factor activity, core RNA polymerase I binding(GO:0001181) |
| 0.9 | 2.7 | GO:0035033 | histone deacetylase regulator activity(GO:0035033) |
| 0.9 | 2.6 | GO:0098640 | integrin binding involved in cell-matrix adhesion(GO:0098640) |
| 0.9 | 2.6 | GO:0004877 | complement component C4b receptor activity(GO:0001861) complement component C3b receptor activity(GO:0004877) |
| 0.9 | 3.4 | GO:0008384 | IkappaB kinase activity(GO:0008384) |
| 0.8 | 10.3 | GO:0001011 | transcription factor activity, sequence-specific DNA binding, RNA polymerase recruiting(GO:0001011) transcription factor activity, TFIIB-class binding(GO:0001087) |
| 0.8 | 9.3 | GO:0005078 | MAP-kinase scaffold activity(GO:0005078) |
| 0.8 | 6.1 | GO:0043559 | insulin binding(GO:0043559) |
| 0.7 | 8.9 | GO:0019911 | structural constituent of myelin sheath(GO:0019911) |
| 0.7 | 11.9 | GO:0070530 | K63-linked polyubiquitin binding(GO:0070530) |
| 0.6 | 4.2 | GO:0016015 | morphogen activity(GO:0016015) |
| 0.6 | 1.8 | GO:0046921 | glycoprotein 6-alpha-L-fucosyltransferase activity(GO:0008424) alpha-(1->6)-fucosyltransferase activity(GO:0046921) |
| 0.6 | 5.2 | GO:0000099 | sulfur amino acid transmembrane transporter activity(GO:0000099) |
| 0.6 | 1.7 | GO:0001596 | angiotensin type I receptor activity(GO:0001596) |
| 0.6 | 2.3 | GO:0035650 | AP-1 adaptor complex binding(GO:0035650) |
| 0.6 | 2.3 | GO:0004505 | phenylalanine 4-monooxygenase activity(GO:0004505) |
| 0.6 | 3.9 | GO:0048403 | brain-derived neurotrophic factor binding(GO:0048403) |
| 0.5 | 8.9 | GO:0038191 | neuropilin binding(GO:0038191) |
| 0.5 | 2.1 | GO:0060422 | peptidyl-dipeptidase inhibitor activity(GO:0060422) |
| 0.5 | 3.9 | GO:0004176 | ATP-dependent peptidase activity(GO:0004176) |
| 0.5 | 7.8 | GO:0004551 | nucleotide diphosphatase activity(GO:0004551) |
| 0.5 | 3.7 | GO:0051864 | histone demethylase activity (H3-K36 specific)(GO:0051864) |
| 0.5 | 1.8 | GO:0015207 | ATP:ADP antiporter activity(GO:0005471) adenine transmembrane transporter activity(GO:0015207) |
| 0.4 | 1.3 | GO:0004914 | interleukin-5 receptor activity(GO:0004914) |
| 0.4 | 6.0 | GO:0055056 | D-glucose transmembrane transporter activity(GO:0055056) |
| 0.4 | 3.4 | GO:0031802 | type 5 metabotropic glutamate receptor binding(GO:0031802) |
| 0.4 | 2.9 | GO:0030023 | extracellular matrix constituent conferring elasticity(GO:0030023) |
| 0.4 | 4.0 | GO:0031433 | telethonin binding(GO:0031433) |
| 0.4 | 1.5 | GO:0032038 | myosin II heavy chain binding(GO:0032038) |
| 0.4 | 2.3 | GO:0008440 | inositol-1,4,5-trisphosphate 3-kinase activity(GO:0008440) |
| 0.4 | 1.9 | GO:0005006 | epidermal growth factor-activated receptor activity(GO:0005006) |
| 0.4 | 3.0 | GO:0035374 | chondroitin sulfate binding(GO:0035374) |
| 0.4 | 1.9 | GO:0031708 | endothelin B receptor binding(GO:0031708) |
| 0.4 | 3.6 | GO:0016176 | superoxide-generating NADPH oxidase activator activity(GO:0016176) |
| 0.4 | 5.0 | GO:0004065 | arylsulfatase activity(GO:0004065) |
| 0.3 | 2.8 | GO:0097322 | 7SK snRNA binding(GO:0097322) |
| 0.3 | 3.3 | GO:0004415 | hyalurononglucosaminidase activity(GO:0004415) |
| 0.3 | 5.1 | GO:0035925 | mRNA 3'-UTR AU-rich region binding(GO:0035925) |
| 0.3 | 9.4 | GO:0005540 | hyaluronic acid binding(GO:0005540) |
| 0.3 | 1.9 | GO:0016941 | natriuretic peptide receptor activity(GO:0016941) |
| 0.3 | 1.5 | GO:0004906 | interferon-gamma receptor activity(GO:0004906) |
| 0.3 | 1.4 | GO:0048248 | CXCR3 chemokine receptor binding(GO:0048248) |
| 0.3 | 1.7 | GO:0004800 | thyroxine 5'-deiodinase activity(GO:0004800) |
| 0.3 | 1.9 | GO:0030368 | interleukin-17 receptor activity(GO:0030368) |
| 0.3 | 1.9 | GO:0001515 | opioid peptide activity(GO:0001515) |
| 0.3 | 1.8 | GO:0052650 | NADP-retinol dehydrogenase activity(GO:0052650) |
| 0.3 | 0.8 | GO:0003846 | 2-acylglycerol O-acyltransferase activity(GO:0003846) |
| 0.3 | 3.6 | GO:0004679 | AMP-activated protein kinase activity(GO:0004679) |
| 0.3 | 4.5 | GO:0031435 | MAP kinase kinase kinase kinase activity(GO:0008349) mitogen-activated protein kinase kinase kinase binding(GO:0031435) |
| 0.3 | 55.6 | GO:0003823 | antigen binding(GO:0003823) |
| 0.2 | 0.7 | GO:0051185 | coenzyme transporter activity(GO:0051185) |
| 0.2 | 0.9 | GO:0005222 | intracellular cAMP activated cation channel activity(GO:0005222) |
| 0.2 | 6.7 | GO:0008574 | ATP-dependent microtubule motor activity, plus-end-directed(GO:0008574) |
| 0.2 | 7.6 | GO:0005520 | insulin-like growth factor binding(GO:0005520) |
| 0.2 | 1.6 | GO:0030215 | semaphorin receptor binding(GO:0030215) |
| 0.2 | 1.7 | GO:0047623 | AMP deaminase activity(GO:0003876) adenosine-phosphate deaminase activity(GO:0047623) |
| 0.2 | 3.2 | GO:0004861 | cyclin-dependent protein serine/threonine kinase inhibitor activity(GO:0004861) |
| 0.2 | 1.1 | GO:0001609 | G-protein coupled adenosine receptor activity(GO:0001609) |
| 0.2 | 4.5 | GO:0004708 | MAP kinase kinase activity(GO:0004708) |
| 0.2 | 3.7 | GO:0070628 | proteasome binding(GO:0070628) |
| 0.2 | 2.1 | GO:0004017 | adenylate kinase activity(GO:0004017) |
| 0.2 | 1.0 | GO:0004563 | beta-N-acetylhexosaminidase activity(GO:0004563) |
| 0.2 | 2.9 | GO:0005522 | profilin binding(GO:0005522) |
| 0.1 | 1.2 | GO:0004957 | prostaglandin E receptor activity(GO:0004957) |
| 0.1 | 2.2 | GO:0008190 | eukaryotic initiation factor 4E binding(GO:0008190) |
| 0.1 | 1.4 | GO:0030247 | pattern binding(GO:0001871) polysaccharide binding(GO:0030247) |
| 0.1 | 2.6 | GO:0050811 | GABA receptor binding(GO:0050811) |
| 0.1 | 2.0 | GO:0042809 | vitamin D receptor binding(GO:0042809) |
| 0.1 | 0.5 | GO:0005415 | nucleoside:sodium symporter activity(GO:0005415) |
| 0.1 | 3.5 | GO:0004181 | metallocarboxypeptidase activity(GO:0004181) |
| 0.1 | 0.9 | GO:0005138 | interleukin-6 receptor binding(GO:0005138) |
| 0.1 | 6.4 | GO:0015485 | cholesterol binding(GO:0015485) |
| 0.1 | 1.1 | GO:0031730 | CCR5 chemokine receptor binding(GO:0031730) |
| 0.1 | 8.9 | GO:0005201 | extracellular matrix structural constituent(GO:0005201) |
| 0.1 | 0.7 | GO:0001591 | dopamine neurotransmitter receptor activity, coupled via Gi/Go(GO:0001591) |
| 0.1 | 3.3 | GO:0051059 | NF-kappaB binding(GO:0051059) |
| 0.1 | 3.9 | GO:1990841 | promoter-specific chromatin binding(GO:1990841) |
| 0.1 | 4.0 | GO:0042056 | chemoattractant activity(GO:0042056) |
| 0.1 | 4.6 | GO:0042162 | telomeric DNA binding(GO:0042162) |
| 0.1 | 8.6 | GO:0004715 | non-membrane spanning protein tyrosine kinase activity(GO:0004715) |
| 0.1 | 0.6 | GO:0015272 | ATP-activated inward rectifier potassium channel activity(GO:0015272) |
| 0.1 | 2.3 | GO:0015269 | calcium-activated potassium channel activity(GO:0015269) |
| 0.1 | 0.9 | GO:0045236 | CXCR chemokine receptor binding(GO:0045236) |
| 0.1 | 3.4 | GO:0004683 | calmodulin-dependent protein kinase activity(GO:0004683) |
| 0.1 | 4.1 | GO:0030507 | spectrin binding(GO:0030507) |
| 0.1 | 4.2 | GO:0001205 | transcriptional activator activity, RNA polymerase II distal enhancer sequence-specific binding(GO:0001205) |
| 0.1 | 2.2 | GO:0004622 | lysophospholipase activity(GO:0004622) |
| 0.1 | 0.3 | GO:0050473 | prostaglandin-endoperoxide synthase activity(GO:0004666) arachidonate 15-lipoxygenase activity(GO:0050473) |
| 0.1 | 0.8 | GO:0015385 | sodium:proton antiporter activity(GO:0015385) potassium:proton antiporter activity(GO:0015386) |
| 0.1 | 3.6 | GO:0004402 | histone acetyltransferase activity(GO:0004402) |
| 0.1 | 0.6 | GO:0004955 | prostaglandin receptor activity(GO:0004955) |
| 0.1 | 0.5 | GO:0005157 | macrophage colony-stimulating factor receptor binding(GO:0005157) |
| 0.1 | 2.0 | GO:0004435 | phosphatidylinositol phospholipase C activity(GO:0004435) |
| 0.1 | 1.9 | GO:0019198 | transmembrane receptor protein tyrosine phosphatase activity(GO:0005001) transmembrane receptor protein phosphatase activity(GO:0019198) |
| 0.1 | 0.3 | GO:0015563 | uptake transmembrane transporter activity(GO:0015563) |
| 0.1 | 3.2 | GO:0008138 | protein tyrosine/serine/threonine phosphatase activity(GO:0008138) |
| 0.1 | 3.3 | GO:0004364 | glutathione transferase activity(GO:0004364) |
| 0.1 | 1.1 | GO:0005112 | Notch binding(GO:0005112) |
| 0.1 | 1.8 | GO:0004709 | MAP kinase kinase kinase activity(GO:0004709) |
| 0.1 | 3.2 | GO:0050840 | extracellular matrix binding(GO:0050840) |
| 0.1 | 3.5 | GO:0004693 | cyclin-dependent protein serine/threonine kinase activity(GO:0004693) |
| 0.1 | 5.6 | GO:0004222 | metalloendopeptidase activity(GO:0004222) |
| 0.0 | 1.4 | GO:0008009 | chemokine activity(GO:0008009) |
| 0.0 | 2.2 | GO:0005080 | protein kinase C binding(GO:0005080) |
| 0.0 | 0.9 | GO:0031698 | beta-2 adrenergic receptor binding(GO:0031698) |
| 0.0 | 0.3 | GO:0004445 | inositol-polyphosphate 5-phosphatase activity(GO:0004445) |
| 0.0 | 1.1 | GO:0004697 | protein kinase C activity(GO:0004697) |
| 0.0 | 0.7 | GO:0008179 | adenylate cyclase binding(GO:0008179) |
| 0.0 | 0.5 | GO:0004745 | retinol dehydrogenase activity(GO:0004745) |
| 0.0 | 1.3 | GO:0005109 | frizzled binding(GO:0005109) |
| 0.0 | 1.0 | GO:0046933 | proton-transporting ATP synthase activity, rotational mechanism(GO:0046933) |
| 0.0 | 2.1 | GO:0016278 | lysine N-methyltransferase activity(GO:0016278) protein-lysine N-methyltransferase activity(GO:0016279) |
| 0.0 | 3.2 | GO:0019888 | protein phosphatase regulator activity(GO:0019888) |
| 0.0 | 0.6 | GO:0005251 | delayed rectifier potassium channel activity(GO:0005251) |
| 0.0 | 0.8 | GO:0004298 | threonine-type endopeptidase activity(GO:0004298) threonine-type peptidase activity(GO:0070003) |
| 0.0 | 0.7 | GO:0005086 | ARF guanyl-nucleotide exchange factor activity(GO:0005086) |
| 0.0 | 4.6 | GO:0004252 | serine-type endopeptidase activity(GO:0004252) |
| 0.0 | 1.2 | GO:0001105 | RNA polymerase II transcription coactivator activity(GO:0001105) |
| 0.0 | 0.7 | GO:0008395 | steroid hydroxylase activity(GO:0008395) |
| 0.0 | 2.0 | GO:0004867 | serine-type endopeptidase inhibitor activity(GO:0004867) |
| 0.0 | 0.5 | GO:0005164 | tumor necrosis factor receptor binding(GO:0005164) |
| 0.0 | 4.8 | GO:0001227 | transcriptional repressor activity, RNA polymerase II transcription regulatory region sequence-specific binding(GO:0001227) |
| 0.0 | 0.1 | GO:0008420 | CTD phosphatase activity(GO:0008420) |
| 0.0 | 0.1 | GO:0019212 | phosphatase inhibitor activity(GO:0019212) |
| 0.0 | 4.6 | GO:0001077 | transcriptional activator activity, RNA polymerase II core promoter proximal region sequence-specific binding(GO:0001077) |
| 0.0 | 0.3 | GO:0004029 | aldehyde dehydrogenase (NAD) activity(GO:0004029) |
| 0.0 | 0.4 | GO:0019894 | kinesin binding(GO:0019894) |
| 0.0 | 0.3 | GO:0000983 | transcription factor activity, RNA polymerase II core promoter sequence-specific(GO:0000983) |
Gene overrepresentation in C2:CP category:
| Log-likelihood per target | Total log-likelihood | Term | Description |
|---|---|---|---|
| 0.5 | 17.9 | PID NFKAPPAB ATYPICAL PATHWAY | Atypical NF-kappaB pathway |
| 0.4 | 6.3 | ST STAT3 PATHWAY | STAT3 Pathway |
| 0.3 | 7.2 | PID TCR RAS PATHWAY | Ras signaling in the CD4+ TCR pathway |
| 0.3 | 24.2 | PID BCR 5PATHWAY | BCR signaling pathway |
| 0.3 | 9.6 | PID HDAC CLASSIII PATHWAY | Signaling events mediated by HDAC Class III |
| 0.3 | 2.7 | PID IL5 PATHWAY | IL5-mediated signaling events |
| 0.2 | 7.4 | NABA COLLAGENS | Genes encoding collagen proteins |
| 0.2 | 4.4 | PID NFKAPPAB CANONICAL PATHWAY | Canonical NF-kappaB pathway |
| 0.2 | 4.4 | PID TOLL ENDOGENOUS PATHWAY | Endogenous TLR signaling |
| 0.1 | 7.2 | PID ENDOTHELIN PATHWAY | Endothelins |
| 0.1 | 5.7 | PID AURORA A PATHWAY | Aurora A signaling |
| 0.1 | 5.7 | PID ERBB4 PATHWAY | ErbB4 signaling events |
| 0.1 | 6.8 | PID TNF PATHWAY | TNF receptor signaling pathway |
| 0.1 | 5.3 | NABA PROTEOGLYCANS | Genes encoding proteoglycans |
| 0.1 | 3.7 | ST G ALPHA I PATHWAY | G alpha i Pathway |
| 0.1 | 5.2 | PID IL12 2PATHWAY | IL12-mediated signaling events |
| 0.1 | 2.6 | PID INTEGRIN5 PATHWAY | Beta5 beta6 beta7 and beta8 integrin cell surface interactions |
| 0.1 | 3.1 | PID GLYPICAN 1PATHWAY | Glypican 1 network |
| 0.1 | 1.9 | PID IL27 PATHWAY | IL27-mediated signaling events |
| 0.1 | 14.1 | NABA ECM AFFILIATED | Genes encoding proteins affiliated structurally or functionally to extracellular matrix proteins |
| 0.1 | 19.4 | NABA ECM REGULATORS | Genes encoding enzymes and their regulators involved in the remodeling of the extracellular matrix |
| 0.1 | 1.8 | PID SYNDECAN 3 PATHWAY | Syndecan-3-mediated signaling events |
| 0.1 | 7.7 | PID AR PATHWAY | Coregulation of Androgen receptor activity |
| 0.1 | 5.4 | PID RHOA REG PATHWAY | Regulation of RhoA activity |
| 0.1 | 1.6 | PID TXA2PATHWAY | Thromboxane A2 receptor signaling |
| 0.1 | 1.1 | ST GA13 PATHWAY | G alpha 13 Pathway |
| 0.1 | 2.3 | PID HEDGEHOG GLI PATHWAY | Hedgehog signaling events mediated by Gli proteins |
| 0.1 | 2.6 | PID ANGIOPOIETIN RECEPTOR PATHWAY | Angiopoietin receptor Tie2-mediated signaling |
| 0.1 | 1.4 | SA FAS SIGNALING | The TNF-type receptor Fas induces apoptosis on ligand binding. |
| 0.1 | 1.3 | PID WNT CANONICAL PATHWAY | Canonical Wnt signaling pathway |
| 0.0 | 1.9 | PID RAC1 PATHWAY | RAC1 signaling pathway |
| 0.0 | 1.1 | PID NOTCH PATHWAY | Notch signaling pathway |
| 0.0 | 2.2 | PID TRKR PATHWAY | Neurotrophic factor-mediated Trk receptor signaling |
| 0.0 | 1.8 | PID TAP63 PATHWAY | Validated transcriptional targets of TAp63 isoforms |
| 0.0 | 0.3 | PID S1P S1P1 PATHWAY | S1P1 pathway |
| 0.0 | 0.5 | SA MMP CYTOKINE CONNECTION | Cytokines can induce activation of matrix metalloproteinases, which degrade extracellular matrix. |
| 0.0 | 0.3 | PID CERAMIDE PATHWAY | Ceramide signaling pathway |
| 0.0 | 4.2 | NABA SECRETED FACTORS | Genes encoding secreted soluble factors |
Gene overrepresentation in C2:CP:REACTOME category:
| Log-likelihood per target | Total log-likelihood | Term | Description |
|---|---|---|---|
| 0.6 | 14.5 | REACTOME TRANSLOCATION OF ZAP 70 TO IMMUNOLOGICAL SYNAPSE | Genes involved in Translocation of ZAP-70 to Immunological synapse |
| 0.6 | 11.7 | REACTOME IL 7 SIGNALING | Genes involved in Interleukin-7 signaling |
| 0.5 | 6.8 | REACTOME NFKB IS ACTIVATED AND SIGNALS SURVIVAL | Genes involved in NF-kB is activated and signals survival |
| 0.4 | 6.2 | REACTOME NEF MEDIATED DOWNREGULATION OF MHC CLASS I COMPLEX CELL SURFACE EXPRESSION | Genes involved in Nef mediated downregulation of MHC class I complex cell surface expression |
| 0.4 | 10.5 | REACTOME OTHER SEMAPHORIN INTERACTIONS | Genes involved in Other semaphorin interactions |
| 0.4 | 16.1 | REACTOME TIGHT JUNCTION INTERACTIONS | Genes involved in Tight junction interactions |
| 0.4 | 5.0 | REACTOME THE ACTIVATION OF ARYLSULFATASES | Genes involved in The activation of arylsulfatases |
| 0.4 | 4.5 | REACTOME SIGNAL ATTENUATION | Genes involved in Signal attenuation |
| 0.4 | 17.5 | REACTOME ANTIGEN ACTIVATES B CELL RECEPTOR LEADING TO GENERATION OF SECOND MESSENGERS | Genes involved in Antigen Activates B Cell Receptor Leading to Generation of Second Messengers |
| 0.3 | 4.5 | REACTOME NRIF SIGNALS CELL DEATH FROM THE NUCLEUS | Genes involved in NRIF signals cell death from the nucleus |
| 0.3 | 10.7 | REACTOME SYNTHESIS OF PIPS AT THE PLASMA MEMBRANE | Genes involved in Synthesis of PIPs at the plasma membrane |
| 0.3 | 5.4 | REACTOME CLASS C 3 METABOTROPIC GLUTAMATE PHEROMONE RECEPTORS | Genes involved in Class C/3 (Metabotropic glutamate/pheromone receptors) |
| 0.3 | 7.7 | REACTOME CS DS DEGRADATION | Genes involved in CS/DS degradation |
| 0.3 | 6.0 | REACTOME FACILITATIVE NA INDEPENDENT GLUCOSE TRANSPORTERS | Genes involved in Facilitative Na+-independent glucose transporters |
| 0.2 | 9.1 | REACTOME GROWTH HORMONE RECEPTOR SIGNALING | Genes involved in Growth hormone receptor signaling |
| 0.2 | 5.9 | REACTOME NOD1 2 SIGNALING PATHWAY | Genes involved in NOD1/2 Signaling Pathway |
| 0.2 | 7.3 | REACTOME TAK1 ACTIVATES NFKB BY PHOSPHORYLATION AND ACTIVATION OF IKKS COMPLEX | Genes involved in TAK1 activates NFkB by phosphorylation and activation of IKKs complex |
| 0.2 | 24.7 | REACTOME MHC CLASS II ANTIGEN PRESENTATION | Genes involved in MHC class II antigen presentation |
| 0.2 | 10.3 | REACTOME MYOGENESIS | Genes involved in Myogenesis |
| 0.2 | 4.4 | REACTOME INSULIN SYNTHESIS AND PROCESSING | Genes involved in Insulin Synthesis and Processing |
| 0.2 | 3.6 | REACTOME REGULATION OF RHEB GTPASE ACTIVITY BY AMPK | Genes involved in Regulation of Rheb GTPase activity by AMPK |
| 0.2 | 1.8 | REACTOME PROSTANOID LIGAND RECEPTORS | Genes involved in Prostanoid ligand receptors |
| 0.2 | 6.1 | REACTOME DEGRADATION OF THE EXTRACELLULAR MATRIX | Genes involved in Degradation of the extracellular matrix |
| 0.2 | 0.9 | REACTOME IL 6 SIGNALING | Genes involved in Interleukin-6 signaling |
| 0.1 | 1.5 | REACTOME REGULATION OF IFNG SIGNALING | Genes involved in Regulation of IFNG signaling |
| 0.1 | 2.4 | REACTOME GAP JUNCTION ASSEMBLY | Genes involved in Gap junction assembly |
| 0.1 | 3.0 | REACTOME CRMPS IN SEMA3A SIGNALING | Genes involved in CRMPs in Sema3A signaling |
| 0.1 | 2.8 | REACTOME GLUTAMATE NEUROTRANSMITTER RELEASE CYCLE | Genes involved in Glutamate Neurotransmitter Release Cycle |
| 0.1 | 3.9 | REACTOME ASSOCIATION OF TRIC CCT WITH TARGET PROTEINS DURING BIOSYNTHESIS | Genes involved in Association of TriC/CCT with target proteins during biosynthesis |
| 0.1 | 2.2 | REACTOME MTORC1 MEDIATED SIGNALLING | Genes involved in mTORC1-mediated signalling |
| 0.1 | 2.1 | REACTOME A TETRASACCHARIDE LINKER SEQUENCE IS REQUIRED FOR GAG SYNTHESIS | Genes involved in A tetrasaccharide linker sequence is required for GAG synthesis |
| 0.1 | 2.2 | REACTOME ACYL CHAIN REMODELLING OF PI | Genes involved in Acyl chain remodelling of PI |
| 0.1 | 4.6 | REACTOME SIGNALING BY ROBO RECEPTOR | Genes involved in Signaling by Robo receptor |
| 0.1 | 4.6 | REACTOME LATENT INFECTION OF HOMO SAPIENS WITH MYCOBACTERIUM TUBERCULOSIS | Genes involved in Latent infection of Homo sapiens with Mycobacterium tuberculosis |
| 0.1 | 0.4 | REACTOME G PROTEIN BETA GAMMA SIGNALLING | Genes involved in G-protein beta:gamma signalling |
| 0.1 | 9.0 | REACTOME ACTIVATION OF NF KAPPAB IN B CELLS | Genes involved in Activation of NF-kappaB in B Cells |
| 0.1 | 2.6 | REACTOME REGULATION OF COMPLEMENT CASCADE | Genes involved in Regulation of Complement cascade |
| 0.1 | 6.0 | REACTOME EXTRACELLULAR MATRIX ORGANIZATION | Genes involved in Extracellular matrix organization |
| 0.1 | 1.8 | REACTOME CD28 DEPENDENT PI3K AKT SIGNALING | Genes involved in CD28 dependent PI3K/Akt signaling |
| 0.1 | 1.3 | REACTOME IL RECEPTOR SHC SIGNALING | Genes involved in Interleukin receptor SHC signaling |
| 0.1 | 3.8 | REACTOME NRAGE SIGNALS DEATH THROUGH JNK | Genes involved in NRAGE signals death through JNK |
| 0.1 | 1.5 | REACTOME GPVI MEDIATED ACTIVATION CASCADE | Genes involved in GPVI-mediated activation cascade |
| 0.1 | 14.1 | REACTOME PEPTIDE LIGAND BINDING RECEPTORS | Genes involved in Peptide ligand-binding receptors |
| 0.1 | 1.7 | REACTOME AMINE DERIVED HORMONES | Genes involved in Amine-derived hormones |
| 0.1 | 3.2 | REACTOME G1 PHASE | Genes involved in G1 Phase |
| 0.1 | 1.8 | REACTOME N GLYCAN ANTENNAE ELONGATION IN THE MEDIAL TRANS GOLGI | Genes involved in N-glycan antennae elongation in the medial/trans-Golgi |
| 0.1 | 2.4 | REACTOME BASIGIN INTERACTIONS | Genes involved in Basigin interactions |
| 0.1 | 2.5 | REACTOME NCAM1 INTERACTIONS | Genes involved in NCAM1 interactions |
| 0.1 | 2.8 | REACTOME SMAD2 SMAD3 SMAD4 HETEROTRIMER REGULATES TRANSCRIPTION | Genes involved in SMAD2/SMAD3:SMAD4 heterotrimer regulates transcription |
| 0.1 | 1.1 | REACTOME P2Y RECEPTORS | Genes involved in P2Y receptors |
| 0.1 | 3.4 | REACTOME CELL SURFACE INTERACTIONS AT THE VASCULAR WALL | Genes involved in Cell surface interactions at the vascular wall |
| 0.1 | 2.1 | REACTOME CGMP EFFECTS | Genes involved in cGMP effects |
| 0.0 | 2.9 | REACTOME G ALPHA Z SIGNALLING EVENTS | Genes involved in G alpha (z) signalling events |
| 0.0 | 1.3 | REACTOME SIGNALING BY HIPPO | Genes involved in Signaling by Hippo |
| 0.0 | 0.8 | REACTOME ENDOGENOUS STEROLS | Genes involved in Endogenous sterols |
| 0.0 | 0.9 | REACTOME SEMA4D INDUCED CELL MIGRATION AND GROWTH CONE COLLAPSE | Genes involved in Sema4D induced cell migration and growth-cone collapse |
| 0.0 | 0.6 | REACTOME ANTIGEN PRESENTATION FOLDING ASSEMBLY AND PEPTIDE LOADING OF CLASS I MHC | Genes involved in Antigen Presentation: Folding, assembly and peptide loading of class I MHC |
| 0.0 | 1.1 | REACTOME SPHINGOLIPID DE NOVO BIOSYNTHESIS | Genes involved in Sphingolipid de novo biosynthesis |
| 0.0 | 0.6 | REACTOME INHIBITION OF VOLTAGE GATED CA2 CHANNELS VIA GBETA GAMMA SUBUNITS | Genes involved in Inhibition of voltage gated Ca2+ channels via Gbeta/gamma subunits |
| 0.0 | 1.8 | REACTOME MITOCHONDRIAL PROTEIN IMPORT | Genes involved in Mitochondrial Protein Import |
| 0.0 | 1.2 | REACTOME TRANSPORT OF VITAMINS NUCLEOSIDES AND RELATED MOLECULES | Genes involved in Transport of vitamins, nucleosides, and related molecules |
| 0.0 | 0.9 | REACTOME SRP DEPENDENT COTRANSLATIONAL PROTEIN TARGETING TO MEMBRANE | Genes involved in SRP-dependent cotranslational protein targeting to membrane |
| 0.0 | 1.5 | REACTOME STRIATED MUSCLE CONTRACTION | Genes involved in Striated Muscle Contraction |
| 0.0 | 1.5 | REACTOME POTASSIUM CHANNELS | Genes involved in Potassium Channels |
| 0.0 | 0.7 | REACTOME AMINE LIGAND BINDING RECEPTORS | Genes involved in Amine ligand-binding receptors |
| 0.0 | 0.3 | REACTOME SYNTHESIS OF PIPS AT THE GOLGI MEMBRANE | Genes involved in Synthesis of PIPs at the Golgi membrane |
| 0.0 | 0.1 | REACTOME COPI MEDIATED TRANSPORT | Genes involved in COPI Mediated Transport |
| 0.0 | 1.1 | REACTOME L1CAM INTERACTIONS | Genes involved in L1CAM interactions |
| 0.0 | 2.2 | REACTOME NONSENSE MEDIATED DECAY ENHANCED BY THE EXON JUNCTION COMPLEX | Genes involved in Nonsense Mediated Decay Enhanced by the Exon Junction Complex |
| 0.0 | 1.1 | REACTOME TRANSPORT OF INORGANIC CATIONS ANIONS AND AMINO ACIDS OLIGOPEPTIDES | Genes involved in Transport of inorganic cations/anions and amino acids/oligopeptides |
| 0.0 | 0.9 | REACTOME G ALPHA S SIGNALLING EVENTS | Genes involved in G alpha (s) signalling events |