Project
GNF SymAtlas + NCI-60 cancer cell lines, comparison of cancers vs non-cancers, human (Su, 2004; Ross, 2000)
Navigation
Downloads
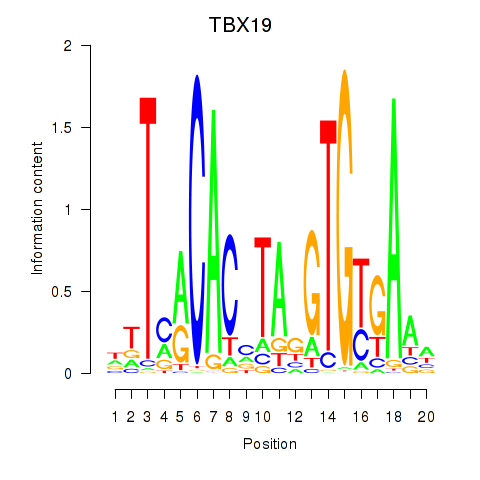
Results for TBX19
Z-value: 0.45
Motif logo
Transcription factors associated with TBX19
| Gene Symbol | Gene ID | Gene Info |
|---|---|---|
|
TBX19
|
ENSG00000143178.8 | T-box transcription factor 19 |
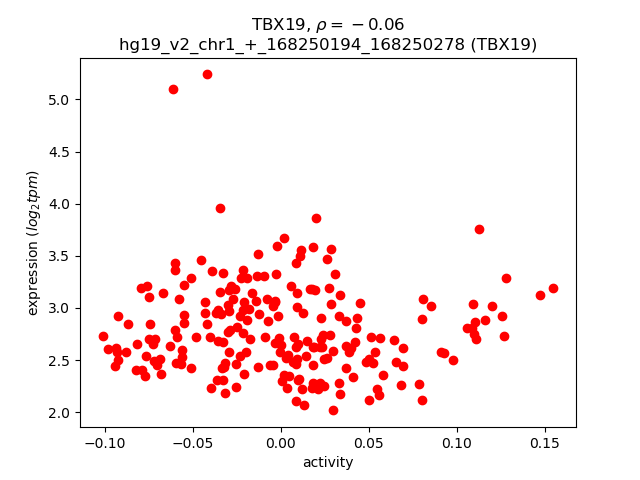
Activity-expression correlation:
| Gene | Promoter | Pearson corr. coef. | P-value | Plot |
|---|---|---|---|---|
| TBX19 | hg19_v2_chr1_+_168250194_168250278 | -0.06 | 4.1e-01 | Click! |
Activity profile of TBX19 motif
Sorted Z-values of TBX19 motif
| Promoter | Log-likelihood | Transcript | Gene | Gene Info |
|---|---|---|---|---|
| chr6_-_2842087 | 21.37 |
ENST00000537185.1
|
SERPINB1
|
serpin peptidase inhibitor, clade B (ovalbumin), member 1 |
| chr19_-_40331345 | 21.10 |
ENST00000597224.1
|
FBL
|
fibrillarin |
| chr16_+_84801852 | 18.67 |
ENST00000569925.1
ENST00000567526.1 |
USP10
|
ubiquitin specific peptidase 10 |
| chr6_-_36515177 | 18.46 |
ENST00000229812.7
|
STK38
|
serine/threonine kinase 38 |
| chr6_-_2842219 | 14.99 |
ENST00000380739.5
|
SERPINB1
|
serpin peptidase inhibitor, clade B (ovalbumin), member 1 |
| chr2_-_85636928 | 14.84 |
ENST00000449030.1
|
CAPG
|
capping protein (actin filament), gelsolin-like |
| chr15_-_55581954 | 14.74 |
ENST00000336787.1
|
RAB27A
|
RAB27A, member RAS oncogene family |
| chr9_-_116172946 | 12.93 |
ENST00000374171.4
|
POLE3
|
polymerase (DNA directed), epsilon 3, accessory subunit |
| chr1_-_63988846 | 12.60 |
ENST00000283568.8
ENST00000371092.3 ENST00000271002.10 |
ITGB3BP
|
integrin beta 3 binding protein (beta3-endonexin) |
| chr10_-_95242044 | 11.96 |
ENST00000371501.4
ENST00000371502.4 ENST00000371489.1 |
MYOF
|
myoferlin |
| chr12_-_49319265 | 11.44 |
ENST00000552878.1
ENST00000453172.2 |
FKBP11
|
FK506 binding protein 11, 19 kDa |
| chr2_+_90153696 | 11.43 |
ENST00000417279.2
|
IGKV3D-15
|
immunoglobulin kappa variable 3D-15 (gene/pseudogene) |
| chr7_-_148580563 | 11.15 |
ENST00000476773.1
|
EZH2
|
enhancer of zeste homolog 2 (Drosophila) |
| chr10_-_95241951 | 11.08 |
ENST00000358334.5
ENST00000359263.4 ENST00000371488.3 |
MYOF
|
myoferlin |
| chr2_-_89278535 | 10.66 |
ENST00000390247.2
|
IGKV3-7
|
immunoglobulin kappa variable 3-7 (non-functional) |
| chr14_+_24458093 | 10.15 |
ENST00000558753.1
ENST00000537912.1 |
DHRS4L2
|
dehydrogenase/reductase (SDR family) member 4 like 2 |
| chr14_+_51706886 | 10.14 |
ENST00000457354.2
|
TMX1
|
thioredoxin-related transmembrane protein 1 |
| chr11_+_71938925 | 10.04 |
ENST00000538751.1
|
INPPL1
|
inositol polyphosphate phosphatase-like 1 |
| chr14_+_21249200 | 9.79 |
ENST00000304677.2
|
RNASE6
|
ribonuclease, RNase A family, k6 |
| chr7_-_132766800 | 9.44 |
ENST00000542753.1
ENST00000448878.1 |
CHCHD3
|
coiled-coil-helix-coiled-coil-helix domain containing 3 |
| chr5_+_33440802 | 9.35 |
ENST00000502553.1
ENST00000514259.1 ENST00000265112.3 |
TARS
|
threonyl-tRNA synthetase |
| chr7_-_132766818 | 9.33 |
ENST00000262570.5
|
CHCHD3
|
coiled-coil-helix-coiled-coil-helix domain containing 3 |
| chr7_+_2394445 | 9.01 |
ENST00000360876.4
ENST00000413917.1 ENST00000397011.2 |
EIF3B
|
eukaryotic translation initiation factor 3, subunit B |
| chr15_-_20170354 | 8.69 |
ENST00000338912.5
|
IGHV1OR15-9
|
immunoglobulin heavy variable 1/OR15-9 (non-functional) |
| chr1_-_150947343 | 8.24 |
ENST00000271688.6
ENST00000368954.5 |
CERS2
|
ceramide synthase 2 |
| chr6_+_22569784 | 8.13 |
ENST00000510882.2
|
HDGFL1
|
hepatoma derived growth factor-like 1 |
| chr17_-_34207295 | 8.05 |
ENST00000463941.1
ENST00000293272.3 |
CCL5
|
chemokine (C-C motif) ligand 5 |
| chr22_+_45072925 | 7.92 |
ENST00000006251.7
|
PRR5
|
proline rich 5 (renal) |
| chr9_-_19127474 | 7.91 |
ENST00000380465.3
ENST00000380464.3 ENST00000411567.1 ENST00000276914.2 |
PLIN2
|
perilipin 2 |
| chr12_+_104680659 | 7.67 |
ENST00000526691.1
ENST00000531691.1 ENST00000388854.3 ENST00000354940.6 ENST00000526390.1 ENST00000531689.1 |
TXNRD1
|
thioredoxin reductase 1 |
| chr2_+_143886877 | 7.66 |
ENST00000295095.6
|
ARHGAP15
|
Rho GTPase activating protein 15 |
| chr12_-_10875831 | 7.66 |
ENST00000279550.7
ENST00000228251.4 |
YBX3
|
Y box binding protein 3 |
| chr2_-_89399845 | 7.52 |
ENST00000479981.1
|
IGKV1-16
|
immunoglobulin kappa variable 1-16 |
| chr1_-_146040968 | 7.48 |
ENST00000401010.3
|
NBPF11
|
neuroblastoma breakpoint family, member 11 |
| chr5_+_96212185 | 7.45 |
ENST00000379904.4
|
ERAP2
|
endoplasmic reticulum aminopeptidase 2 |
| chr10_+_12237924 | 7.36 |
ENST00000429258.2
ENST00000281141.4 |
CDC123
|
cell division cycle 123 |
| chr22_+_45072958 | 7.28 |
ENST00000403581.1
|
PRR5
|
proline rich 5 (renal) |
| chr4_+_15704679 | 7.28 |
ENST00000382346.3
|
BST1
|
bone marrow stromal cell antigen 1 |
| chr22_+_37678424 | 7.06 |
ENST00000248901.6
|
CYTH4
|
cytohesin 4 |
| chr14_-_106963409 | 6.87 |
ENST00000390621.2
|
IGHV1-45
|
immunoglobulin heavy variable 1-45 |
| chr1_-_19746236 | 6.86 |
ENST00000375144.1
|
CAPZB
|
capping protein (actin filament) muscle Z-line, beta |
| chr5_+_96211643 | 6.73 |
ENST00000437043.3
ENST00000510373.1 |
ERAP2
|
endoplasmic reticulum aminopeptidase 2 |
| chr2_+_201754050 | 6.41 |
ENST00000426253.1
ENST00000416651.1 ENST00000454952.1 ENST00000409020.1 ENST00000359683.4 |
NIF3L1
|
NIF3 NGG1 interacting factor 3-like 1 (S. cerevisiae) |
| chr19_+_49496705 | 5.86 |
ENST00000595090.1
|
RUVBL2
|
RuvB-like AAA ATPase 2 |
| chr2_+_201754135 | 5.86 |
ENST00000409357.1
ENST00000409129.2 |
NIF3L1
|
NIF3 NGG1 interacting factor 3-like 1 (S. cerevisiae) |
| chr10_-_120938303 | 5.75 |
ENST00000356951.3
ENST00000298510.2 |
PRDX3
|
peroxiredoxin 3 |
| chr8_-_134115118 | 5.71 |
ENST00000395352.3
ENST00000338087.5 |
SLA
|
Src-like-adaptor |
| chr5_-_70272055 | 5.65 |
ENST00000514857.2
|
NAIP
|
NLR family, apoptosis inhibitory protein |
| chr12_+_75784850 | 5.46 |
ENST00000550916.1
ENST00000435775.1 ENST00000378689.2 ENST00000378692.3 ENST00000320460.4 ENST00000547164.1 |
GLIPR1L2
|
GLI pathogenesis-related 1 like 2 |
| chr1_+_117297007 | 5.36 |
ENST00000369478.3
ENST00000369477.1 |
CD2
|
CD2 molecule |
| chr4_+_15704573 | 5.35 |
ENST00000265016.4
|
BST1
|
bone marrow stromal cell antigen 1 |
| chr14_-_106573756 | 5.29 |
ENST00000390601.2
|
IGHV3-11
|
immunoglobulin heavy variable 3-11 (gene/pseudogene) |
| chr2_-_113594279 | 5.28 |
ENST00000416750.1
ENST00000418817.1 ENST00000263341.2 |
IL1B
|
interleukin 1, beta |
| chr19_+_535835 | 5.22 |
ENST00000607527.1
ENST00000606065.1 |
CDC34
|
cell division cycle 34 |
| chr12_-_9760482 | 5.03 |
ENST00000229402.3
|
KLRB1
|
killer cell lectin-like receptor subfamily B, member 1 |
| chr19_+_38755042 | 4.94 |
ENST00000301244.7
|
SPINT2
|
serine peptidase inhibitor, Kunitz type, 2 |
| chr17_-_56296580 | 4.83 |
ENST00000313863.6
ENST00000546108.1 ENST00000337050.7 ENST00000393119.2 |
MKS1
|
Meckel syndrome, type 1 |
| chr6_-_42713792 | 4.77 |
ENST00000372876.1
|
TBCC
|
tubulin folding cofactor C |
| chr1_-_167522982 | 4.76 |
ENST00000370509.4
|
CREG1
|
cellular repressor of E1A-stimulated genes 1 |
| chr19_+_852291 | 4.70 |
ENST00000263621.1
|
ELANE
|
elastase, neutrophil expressed |
| chr2_+_228337079 | 4.64 |
ENST00000409315.1
ENST00000373671.3 ENST00000409171.1 |
AGFG1
|
ArfGAP with FG repeats 1 |
| chr5_+_54320078 | 4.53 |
ENST00000231009.2
|
GZMK
|
granzyme K (granzyme 3; tryptase II) |
| chr17_+_7123125 | 4.52 |
ENST00000356839.5
ENST00000583312.1 ENST00000350303.5 |
ACADVL
|
acyl-CoA dehydrogenase, very long chain |
| chr20_-_5093673 | 4.17 |
ENST00000379299.2
ENST00000379286.2 ENST00000379279.2 ENST00000379283.2 |
TMEM230
|
transmembrane protein 230 |
| chr2_-_162931052 | 4.05 |
ENST00000360534.3
|
DPP4
|
dipeptidyl-peptidase 4 |
| chr14_+_24458021 | 4.04 |
ENST00000397071.1
ENST00000559411.1 ENST00000335125.6 |
DHRS4L2
|
dehydrogenase/reductase (SDR family) member 4 like 2 |
| chr10_+_76969909 | 4.00 |
ENST00000298468.5
ENST00000543351.1 |
VDAC2
|
voltage-dependent anion channel 2 |
| chr1_+_168250194 | 3.96 |
ENST00000367821.3
|
TBX19
|
T-box 19 |
| chr22_-_31364187 | 3.93 |
ENST00000215862.4
ENST00000397641.3 |
MORC2
|
MORC family CW-type zinc finger 2 |
| chr12_+_8276433 | 3.89 |
ENST00000345999.3
ENST00000352620.3 ENST00000360500.3 |
CLEC4A
|
C-type lectin domain family 4, member A |
| chr3_-_150264272 | 3.88 |
ENST00000491660.1
ENST00000487153.1 ENST00000239944.2 |
SERP1
|
stress-associated endoplasmic reticulum protein 1 |
| chr12_+_8276224 | 3.85 |
ENST00000229332.5
|
CLEC4A
|
C-type lectin domain family 4, member A |
| chr9_+_78505581 | 3.82 |
ENST00000376767.3
ENST00000376752.4 |
PCSK5
|
proprotein convertase subtilisin/kexin type 5 |
| chr10_+_17686124 | 3.82 |
ENST00000377524.3
|
STAM
|
signal transducing adaptor molecule (SH3 domain and ITAM motif) 1 |
| chr1_+_207627575 | 3.69 |
ENST00000367058.3
ENST00000367057.3 ENST00000367059.3 |
CR2
|
complement component (3d/Epstein Barr virus) receptor 2 |
| chr20_-_5093713 | 3.66 |
ENST00000342308.5
ENST00000202834.7 |
TMEM230
|
transmembrane protein 230 |
| chr1_+_114471972 | 3.64 |
ENST00000369559.4
ENST00000369554.2 |
HIPK1
|
homeodomain interacting protein kinase 1 |
| chr1_+_114471809 | 3.53 |
ENST00000426820.2
|
HIPK1
|
homeodomain interacting protein kinase 1 |
| chr14_-_106816253 | 3.49 |
ENST00000390615.2
|
IGHV3-33
|
immunoglobulin heavy variable 3-33 |
| chr8_-_6836156 | 3.44 |
ENST00000382679.2
|
DEFA1
|
defensin, alpha 1 |
| chr19_-_8008533 | 3.26 |
ENST00000597926.1
|
TIMM44
|
translocase of inner mitochondrial membrane 44 homolog (yeast) |
| chr6_-_31651817 | 3.24 |
ENST00000375863.3
ENST00000375860.2 |
LY6G5C
|
lymphocyte antigen 6 complex, locus G5C |
| chr11_+_57425209 | 3.17 |
ENST00000533905.1
ENST00000525602.1 ENST00000302731.4 |
CLP1
|
cleavage and polyadenylation factor I subunit 1 |
| chr11_-_64889252 | 3.09 |
ENST00000525297.1
ENST00000529259.1 |
FAU
|
Finkel-Biskis-Reilly murine sarcoma virus (FBR-MuSV) ubiquitously expressed |
| chr17_+_4736627 | 3.04 |
ENST00000355280.6
ENST00000347992.7 |
MINK1
|
misshapen-like kinase 1 |
| chr14_+_24458123 | 3.01 |
ENST00000545240.1
ENST00000382755.4 |
DHRS4L2
|
dehydrogenase/reductase (SDR family) member 4 like 2 |
| chrX_+_129535937 | 2.97 |
ENST00000305536.6
ENST00000370947.1 |
RBMX2
|
RNA binding motif protein, X-linked 2 |
| chr15_-_60771280 | 2.97 |
ENST00000560072.1
ENST00000560406.1 ENST00000560520.1 ENST00000261520.4 ENST00000439632.1 |
NARG2
|
NMDA receptor regulated 2 |
| chr20_-_44991813 | 2.94 |
ENST00000372227.1
|
SLC35C2
|
solute carrier family 35 (GDP-fucose transporter), member C2 |
| chr9_-_130890662 | 2.94 |
ENST00000277462.5
ENST00000338961.6 |
PTGES2
|
prostaglandin E synthase 2 |
| chr9_+_78505554 | 2.89 |
ENST00000545128.1
|
PCSK5
|
proprotein convertase subtilisin/kexin type 5 |
| chr1_+_114472222 | 2.86 |
ENST00000369558.1
ENST00000369561.4 |
HIPK1
|
homeodomain interacting protein kinase 1 |
| chr14_-_107219365 | 2.77 |
ENST00000424969.2
|
IGHV3-74
|
immunoglobulin heavy variable 3-74 |
| chr9_+_125137565 | 2.75 |
ENST00000373698.5
|
PTGS1
|
prostaglandin-endoperoxide synthase 1 (prostaglandin G/H synthase and cyclooxygenase) |
| chr6_+_10694900 | 2.74 |
ENST00000379568.3
|
PAK1IP1
|
PAK1 interacting protein 1 |
| chr6_+_52285046 | 2.74 |
ENST00000371068.5
|
EFHC1
|
EF-hand domain (C-terminal) containing 1 |
| chr19_+_49496782 | 2.56 |
ENST00000601968.1
ENST00000596837.1 |
RUVBL2
|
RuvB-like AAA ATPase 2 |
| chr22_+_40322595 | 2.49 |
ENST00000420971.1
ENST00000544756.1 |
GRAP2
|
GRB2-related adaptor protein 2 |
| chr11_+_7618413 | 2.41 |
ENST00000528883.1
|
PPFIBP2
|
PTPRF interacting protein, binding protein 2 (liprin beta 2) |
| chr7_+_93535866 | 2.36 |
ENST00000429473.1
ENST00000430875.1 ENST00000428834.1 |
GNGT1
|
guanine nucleotide binding protein (G protein), gamma transducing activity polypeptide 1 |
| chr17_+_35306175 | 2.36 |
ENST00000225402.5
|
AATF
|
apoptosis antagonizing transcription factor |
| chr22_+_40322623 | 2.29 |
ENST00000399090.2
|
GRAP2
|
GRB2-related adaptor protein 2 |
| chr1_+_160765947 | 2.28 |
ENST00000263285.6
ENST00000368039.2 |
LY9
|
lymphocyte antigen 9 |
| chr12_-_10605929 | 2.27 |
ENST00000347831.5
ENST00000359151.3 |
KLRC1
|
killer cell lectin-like receptor subfamily C, member 1 |
| chr1_+_100810575 | 2.23 |
ENST00000542213.1
|
CDC14A
|
cell division cycle 14A |
| chr6_+_52285131 | 2.22 |
ENST00000433625.2
|
EFHC1
|
EF-hand domain (C-terminal) containing 1 |
| chrX_-_119709637 | 2.18 |
ENST00000404115.3
|
CUL4B
|
cullin 4B |
| chr12_-_10962767 | 2.16 |
ENST00000240691.2
|
TAS2R9
|
taste receptor, type 2, member 9 |
| chr2_-_9563469 | 2.14 |
ENST00000484735.1
ENST00000456913.2 |
ITGB1BP1
|
integrin beta 1 binding protein 1 |
| chr22_+_31477296 | 2.11 |
ENST00000426927.1
ENST00000440425.1 ENST00000358743.1 ENST00000347557.2 ENST00000333137.7 |
SMTN
|
smoothelin |
| chr8_+_125463048 | 2.09 |
ENST00000328599.3
|
TRMT12
|
tRNA methyltransferase 12 homolog (S. cerevisiae) |
| chr20_-_22565101 | 2.08 |
ENST00000419308.2
|
FOXA2
|
forkhead box A2 |
| chr10_+_90750378 | 2.06 |
ENST00000355740.2
ENST00000352159.4 |
FAS
|
Fas cell surface death receptor |
| chr21_+_39628655 | 1.98 |
ENST00000398925.1
ENST00000398928.1 ENST00000328656.4 ENST00000443341.1 |
KCNJ15
|
potassium inwardly-rectifying channel, subfamily J, member 15 |
| chr14_-_58894332 | 1.97 |
ENST00000395159.2
|
TIMM9
|
translocase of inner mitochondrial membrane 9 homolog (yeast) |
| chr20_-_7921090 | 1.93 |
ENST00000378789.3
|
HAO1
|
hydroxyacid oxidase (glycolate oxidase) 1 |
| chr7_+_93535817 | 1.90 |
ENST00000248572.5
|
GNGT1
|
guanine nucleotide binding protein (G protein), gamma transducing activity polypeptide 1 |
| chr6_-_133035185 | 1.74 |
ENST00000367928.4
|
VNN1
|
vanin 1 |
| chr6_+_26158343 | 1.71 |
ENST00000377777.4
ENST00000289316.2 |
HIST1H2BD
|
histone cluster 1, H2bd |
| chr17_+_41561317 | 1.61 |
ENST00000540306.1
ENST00000262415.3 ENST00000605777.1 |
DHX8
|
DEAH (Asp-Glu-Ala-His) box polypeptide 8 |
| chr1_+_41157361 | 1.57 |
ENST00000427410.2
ENST00000447388.3 ENST00000425457.2 ENST00000453631.1 ENST00000456393.2 |
NFYC
|
nuclear transcription factor Y, gamma |
| chr19_+_4247070 | 1.56 |
ENST00000262962.7
|
CCDC94
|
coiled-coil domain containing 94 |
| chr9_+_77230499 | 1.54 |
ENST00000396204.2
|
RORB
|
RAR-related orphan receptor B |
| chr12_+_8276495 | 1.53 |
ENST00000546339.1
|
CLEC4A
|
C-type lectin domain family 4, member A |
| chr10_+_71561630 | 1.52 |
ENST00000398974.3
ENST00000398971.3 ENST00000398968.3 ENST00000398966.3 ENST00000398964.3 ENST00000398969.3 ENST00000356340.3 ENST00000398972.3 ENST00000398973.3 |
COL13A1
|
collagen, type XIII, alpha 1 |
| chr20_+_43835638 | 1.47 |
ENST00000372781.3
ENST00000244069.6 |
SEMG1
|
semenogelin I |
| chr6_-_26285737 | 1.37 |
ENST00000377727.1
ENST00000289352.1 |
HIST1H4H
|
histone cluster 1, H4h |
| chr1_+_153963227 | 1.33 |
ENST00000368567.4
ENST00000392558.4 |
RPS27
|
ribosomal protein S27 |
| chr5_-_39270725 | 1.33 |
ENST00000512138.1
ENST00000512982.1 ENST00000540520.1 |
FYB
|
FYN binding protein |
| chr3_-_194393206 | 1.29 |
ENST00000265245.5
|
LSG1
|
large 60S subunit nuclear export GTPase 1 |
| chr4_+_69962185 | 1.29 |
ENST00000305231.7
|
UGT2B7
|
UDP glucuronosyltransferase 2 family, polypeptide B7 |
| chrX_+_107288197 | 1.16 |
ENST00000415430.3
|
VSIG1
|
V-set and immunoglobulin domain containing 1 |
| chr7_-_76255444 | 1.03 |
ENST00000454397.1
|
POMZP3
|
POM121 and ZP3 fusion |
| chr19_-_46526304 | 1.01 |
ENST00000008938.4
|
PGLYRP1
|
peptidoglycan recognition protein 1 |
| chr6_-_131277510 | 0.91 |
ENST00000525193.1
ENST00000527659.1 |
EPB41L2
|
erythrocyte membrane protein band 4.1-like 2 |
| chr12_-_11036844 | 0.87 |
ENST00000428168.2
|
PRH1
|
proline-rich protein HaeIII subfamily 1 |
| chr4_+_26321284 | 0.87 |
ENST00000506956.1
ENST00000512671.1 ENST00000345843.3 ENST00000342295.1 |
RBPJ
|
recombination signal binding protein for immunoglobulin kappa J region |
| chr8_-_6795823 | 0.73 |
ENST00000297435.2
|
DEFA4
|
defensin, alpha 4, corticostatin |
| chr1_-_19615744 | 0.73 |
ENST00000361640.4
|
AKR7A3
|
aldo-keto reductase family 7, member A3 (aflatoxin aldehyde reductase) |
| chr2_+_152214098 | 0.72 |
ENST00000243347.3
|
TNFAIP6
|
tumor necrosis factor, alpha-induced protein 6 |
| chr19_-_7766991 | 0.68 |
ENST00000597921.1
ENST00000346664.5 |
FCER2
|
Fc fragment of IgE, low affinity II, receptor for (CD23) |
| chrX_+_107288239 | 0.52 |
ENST00000217957.5
|
VSIG1
|
V-set and immunoglobulin domain containing 1 |
| chr17_-_33760269 | 0.51 |
ENST00000452764.3
|
SLFN12
|
schlafen family member 12 |
| chr15_-_65809581 | 0.42 |
ENST00000341861.5
|
DPP8
|
dipeptidyl-peptidase 8 |
| chr19_+_49990811 | 0.32 |
ENST00000391857.4
ENST00000467825.2 |
RPL13A
|
ribosomal protein L13a |
| chr14_+_58894706 | 0.30 |
ENST00000261244.5
|
KIAA0586
|
KIAA0586 |
| chr19_+_21203426 | 0.28 |
ENST00000261560.5
ENST00000599548.1 ENST00000594110.1 |
ZNF430
|
zinc finger protein 430 |
| chr20_+_43849941 | 0.26 |
ENST00000372769.3
|
SEMG2
|
semenogelin II |
| chr10_+_90750493 | 0.16 |
ENST00000357339.2
ENST00000355279.2 |
FAS
|
Fas cell surface death receptor |
| chr5_+_169010638 | 0.16 |
ENST00000265295.4
ENST00000506574.1 ENST00000515224.1 ENST00000508247.1 ENST00000513941.1 |
SPDL1
|
spindle apparatus coiled-coil protein 1 |
| chr3_+_119499331 | 0.13 |
ENST00000393716.2
ENST00000466380.1 |
NR1I2
|
nuclear receptor subfamily 1, group I, member 2 |
| chr1_+_46640750 | 0.07 |
ENST00000372003.1
|
TSPAN1
|
tetraspanin 1 |
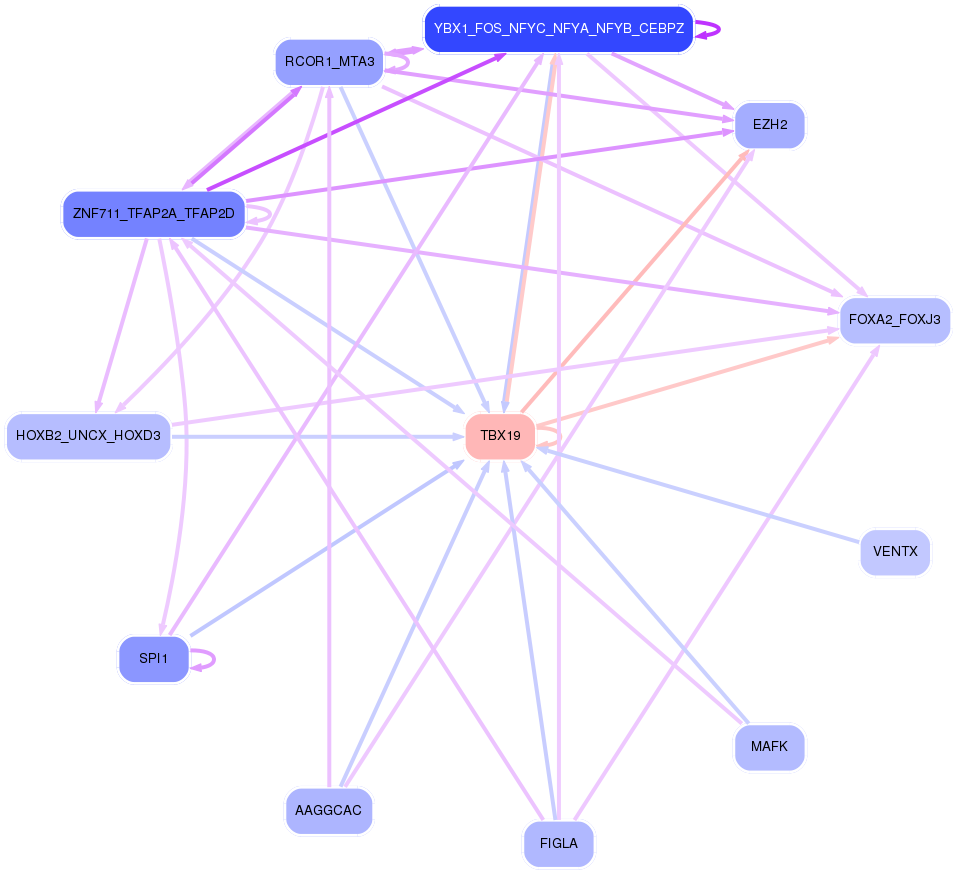
Network of associatons between targets according to the STRING database.

First level regulatory network of TBX19
Gene Ontology Analysis
Gene overrepresentation in biological_process category:
| Log-likelihood per target | Total log-likelihood | Term | Description |
|---|---|---|---|
| 5.3 | 21.1 | GO:0018364 | peptidyl-glutamine methylation(GO:0018364) |
| 3.7 | 11.2 | GO:0036333 | hepatocyte homeostasis(GO:0036333) response to tetrachloromethane(GO:1904772) |
| 3.1 | 9.4 | GO:0006435 | threonyl-tRNA aminoacylation(GO:0006435) |
| 2.5 | 14.7 | GO:1903435 | positive regulation of constitutive secretory pathway(GO:1903435) |
| 2.1 | 8.4 | GO:0090202 | transcriptional activation by promoter-enhancer looping(GO:0071733) gene looping(GO:0090202) dsDNA loop formation(GO:0090579) |
| 2.0 | 8.0 | GO:0033634 | positive regulation of cell-cell adhesion mediated by integrin(GO:0033634) |
| 1.9 | 23.0 | GO:0001778 | plasma membrane repair(GO:0001778) |
| 1.9 | 5.8 | GO:0018171 | peptidyl-cysteine oxidation(GO:0018171) |
| 1.8 | 5.3 | GO:0046136 | positive regulation of vitamin metabolic process(GO:0046136) positive regulation of vitamin D biosynthetic process(GO:0060557) positive regulation of calcidiol 1-monooxygenase activity(GO:0060559) |
| 1.6 | 8.2 | GO:1903976 | negative regulation of glial cell migration(GO:1903976) |
| 1.4 | 15.2 | GO:0038203 | TORC2 signaling(GO:0038203) |
| 1.4 | 6.9 | GO:0051490 | negative regulation of filopodium assembly(GO:0051490) |
| 1.3 | 6.7 | GO:0032455 | nerve growth factor processing(GO:0032455) |
| 1.2 | 4.9 | GO:0060672 | epithelial cell differentiation involved in embryonic placenta development(GO:0060671) epithelial cell morphogenesis involved in placental branching(GO:0060672) |
| 1.1 | 3.4 | GO:0035915 | pore formation in membrane of other organism(GO:0035915) |
| 1.1 | 9.0 | GO:0075525 | viral translational termination-reinitiation(GO:0075525) |
| 1.1 | 10.0 | GO:0060235 | lens induction in camera-type eye(GO:0060235) |
| 1.1 | 14.2 | GO:0019885 | antigen processing and presentation of endogenous peptide antigen via MHC class I(GO:0019885) |
| 1.0 | 4.0 | GO:0033632 | regulation of cell-cell adhesion mediated by integrin(GO:0033632) |
| 1.0 | 4.8 | GO:0061009 | common bile duct development(GO:0061009) |
| 1.0 | 7.7 | GO:1902219 | negative regulation of intrinsic apoptotic signaling pathway in response to osmotic stress(GO:1902219) |
| 0.9 | 5.4 | GO:0030885 | regulation of myeloid dendritic cell activation(GO:0030885) |
| 0.9 | 7.7 | GO:0001887 | selenium compound metabolic process(GO:0001887) |
| 0.8 | 4.8 | GO:0007023 | post-chaperonin tubulin folding pathway(GO:0007023) |
| 0.8 | 4.7 | GO:1903238 | positive regulation of leukocyte tethering or rolling(GO:1903238) |
| 0.7 | 14.8 | GO:0071803 | positive regulation of podosome assembly(GO:0071803) |
| 0.7 | 18.8 | GO:0008053 | mitochondrial fusion(GO:0008053) |
| 0.7 | 2.1 | GO:0045013 | carbon catabolite repression of transcription(GO:0045013) negative regulation of transcription by glucose(GO:0045014) |
| 0.5 | 18.7 | GO:0019985 | translesion synthesis(GO:0019985) |
| 0.5 | 3.8 | GO:1903551 | regulation of extracellular exosome assembly(GO:1903551) |
| 0.5 | 3.2 | GO:0035087 | targeting of mRNA for destruction involved in RNA interference(GO:0030423) siRNA loading onto RISC involved in RNA interference(GO:0035087) |
| 0.5 | 4.6 | GO:0001675 | acrosome assembly(GO:0001675) |
| 0.5 | 2.4 | GO:0032929 | negative regulation of superoxide anion generation(GO:0032929) |
| 0.5 | 12.6 | GO:0002691 | regulation of cellular extravasation(GO:0002691) |
| 0.4 | 2.2 | GO:0097527 | necroptotic signaling pathway(GO:0097527) |
| 0.4 | 5.2 | GO:0043951 | negative regulation of cAMP-mediated signaling(GO:0043951) positive regulation of inclusion body assembly(GO:0090261) |
| 0.4 | 12.9 | GO:0032201 | telomere maintenance via semi-conservative replication(GO:0032201) |
| 0.4 | 12.6 | GO:0034080 | CENP-A containing nucleosome assembly(GO:0034080) CENP-A containing chromatin organization(GO:0061641) |
| 0.4 | 7.1 | GO:0032012 | regulation of ARF protein signal transduction(GO:0032012) |
| 0.3 | 1.7 | GO:1900005 | positive regulation of serine-type endopeptidase activity(GO:1900005) positive regulation of serine-type peptidase activity(GO:1902573) |
| 0.3 | 1.0 | GO:0051710 | regulation of cytolysis in other organism(GO:0051710) |
| 0.3 | 5.7 | GO:0019371 | cyclooxygenase pathway(GO:0019371) |
| 0.3 | 10.0 | GO:0046856 | phosphatidylinositol dephosphorylation(GO:0046856) |
| 0.3 | 1.9 | GO:0009441 | glycolate metabolic process(GO:0009441) |
| 0.3 | 5.7 | GO:1990001 | inhibition of cysteine-type endopeptidase activity involved in apoptotic process(GO:1990001) |
| 0.3 | 4.5 | GO:0033539 | fatty acid beta-oxidation using acyl-CoA dehydrogenase(GO:0033539) |
| 0.3 | 2.9 | GO:0015781 | pyrimidine nucleotide-sugar transport(GO:0015781) protein O-linked fucosylation(GO:0036066) |
| 0.3 | 0.9 | GO:1905068 | arterial endothelial cell fate commitment(GO:0060844) blood vessel lumenization(GO:0072554) positive regulation of ephrin receptor signaling pathway(GO:1901189) positive regulation of canonical Wnt signaling pathway involved in cardiac muscle cell fate commitment(GO:1901297) positive regulation of canonical Wnt signaling pathway involved in heart development(GO:1905068) |
| 0.3 | 3.9 | GO:0060124 | positive regulation of growth hormone secretion(GO:0060124) |
| 0.3 | 38.3 | GO:0006958 | complement activation, classical pathway(GO:0006958) |
| 0.3 | 10.5 | GO:0019731 | antibacterial humoral response(GO:0019731) |
| 0.3 | 1.5 | GO:0042670 | amacrine cell differentiation(GO:0035881) retinal cone cell differentiation(GO:0042670) retinal cone cell development(GO:0046549) |
| 0.2 | 1.7 | GO:0033089 | positive regulation of T cell differentiation in thymus(GO:0033089) positive regulation of thymocyte aggregation(GO:2000400) |
| 0.2 | 11.4 | GO:0000413 | protein peptidyl-prolyl isomerization(GO:0000413) |
| 0.2 | 7.4 | GO:0045948 | positive regulation of translational initiation(GO:0045948) |
| 0.2 | 2.0 | GO:0045039 | protein import into mitochondrial inner membrane(GO:0045039) |
| 0.2 | 3.3 | GO:0030150 | protein import into mitochondrial matrix(GO:0030150) |
| 0.2 | 1.0 | GO:0035803 | egg coat formation(GO:0035803) |
| 0.2 | 2.2 | GO:0070914 | UV-damage excision repair(GO:0070914) |
| 0.2 | 18.5 | GO:0043407 | negative regulation of MAP kinase activity(GO:0043407) |
| 0.2 | 0.7 | GO:0002925 | positive regulation of humoral immune response mediated by circulating immunoglobulin(GO:0002925) |
| 0.1 | 2.2 | GO:0051256 | mitotic spindle midzone assembly(GO:0051256) |
| 0.1 | 2.3 | GO:0043373 | T-helper cell lineage commitment(GO:0002295) CD4-positive, alpha-beta T cell lineage commitment(GO:0043373) T-helper 17 cell lineage commitment(GO:0072540) |
| 0.1 | 3.0 | GO:0000185 | activation of MAPKKK activity(GO:0000185) regulation of alpha-amino-3-hydroxy-5-methyl-4-isoxazole propionate selective glutamate receptor activity(GO:2000311) |
| 0.1 | 22.1 | GO:0002377 | immunoglobulin production(GO:0002377) |
| 0.1 | 4.3 | GO:0042462 | eye photoreceptor cell development(GO:0042462) |
| 0.1 | 10.1 | GO:0045454 | cell redox homeostasis(GO:0045454) |
| 0.1 | 7.9 | GO:0015909 | long-chain fatty acid transport(GO:0015909) |
| 0.1 | 10.5 | GO:0038083 | peptidyl-tyrosine autophosphorylation(GO:0038083) |
| 0.1 | 31.1 | GO:0010951 | negative regulation of endopeptidase activity(GO:0010951) |
| 0.1 | 1.7 | GO:0030277 | maintenance of gastrointestinal epithelium(GO:0030277) |
| 0.1 | 3.7 | GO:1903959 | regulation of anion transmembrane transport(GO:1903959) |
| 0.1 | 5.0 | GO:0021795 | cerebral cortex cell migration(GO:0021795) |
| 0.1 | 4.0 | GO:0021983 | pituitary gland development(GO:0021983) |
| 0.1 | 0.9 | GO:1904776 | regulation of protein localization to cell cortex(GO:1904776) positive regulation of protein localization to cell cortex(GO:1904778) |
| 0.1 | 8.8 | GO:0002223 | stimulatory C-type lectin receptor signaling pathway(GO:0002223) |
| 0.1 | 1.3 | GO:0052695 | cellular glucuronidation(GO:0052695) |
| 0.1 | 1.3 | GO:0000028 | ribosomal small subunit assembly(GO:0000028) |
| 0.0 | 2.0 | GO:0010107 | potassium ion import(GO:0010107) |
| 0.0 | 1.3 | GO:0006607 | NLS-bearing protein import into nucleus(GO:0006607) |
| 0.0 | 0.7 | GO:0030728 | ovulation(GO:0030728) |
| 0.0 | 2.7 | GO:0060021 | palate development(GO:0060021) |
| 0.0 | 4.4 | GO:0097480 | synaptic vesicle transport(GO:0048489) establishment of synaptic vesicle localization(GO:0097480) |
| 0.0 | 0.3 | GO:0001731 | formation of translation preinitiation complex(GO:0001731) |
| 0.0 | 4.9 | GO:0008360 | regulation of cell shape(GO:0008360) |
| 0.0 | 3.0 | GO:0006406 | mRNA export from nucleus(GO:0006406) mRNA-containing ribonucleoprotein complex export from nucleus(GO:0071427) |
| 0.0 | 1.5 | GO:0030574 | collagen catabolic process(GO:0030574) |
| 0.0 | 0.2 | GO:0034501 | protein localization to kinetochore(GO:0034501) |
| 0.0 | 1.7 | GO:0006334 | nucleosome assembly(GO:0006334) |
| 0.0 | 0.1 | GO:0046618 | drug export(GO:0046618) |
| 0.0 | 1.3 | GO:0051168 | nuclear export(GO:0051168) |
Gene overrepresentation in cellular_component category:
| Log-likelihood per target | Total log-likelihood | Term | Description |
|---|---|---|---|
| 7.0 | 21.1 | GO:0031428 | box C/D snoRNP complex(GO:0031428) |
| 2.6 | 12.9 | GO:0008622 | epsilon DNA polymerase complex(GO:0008622) |
| 1.8 | 12.4 | GO:0061617 | MICOS complex(GO:0061617) |
| 1.4 | 21.7 | GO:0008290 | F-actin capping protein complex(GO:0008290) |
| 1.3 | 3.8 | GO:0033565 | ESCRT-0 complex(GO:0033565) |
| 1.2 | 14.7 | GO:0033093 | Weibel-Palade body(GO:0033093) |
| 1.0 | 9.0 | GO:0071541 | eukaryotic translation initiation factor 3 complex, eIF3m(GO:0071541) |
| 0.8 | 15.2 | GO:0031932 | TORC2 complex(GO:0031932) |
| 0.8 | 8.4 | GO:0097255 | R2TP complex(GO:0097255) |
| 0.8 | 3.2 | GO:0000214 | tRNA-intron endonuclease complex(GO:0000214) |
| 0.7 | 11.2 | GO:0045120 | pronucleus(GO:0045120) |
| 0.6 | 4.0 | GO:0046581 | intercellular canaliculus(GO:0046581) |
| 0.5 | 12.6 | GO:0031254 | uropod(GO:0001931) cell trailing edge(GO:0031254) |
| 0.5 | 2.0 | GO:0042721 | mitochondrial inner membrane protein insertion complex(GO:0042721) |
| 0.4 | 5.8 | GO:0008385 | IkappaB kinase complex(GO:0008385) |
| 0.4 | 1.5 | GO:0005600 | collagen type XIII trimer(GO:0005600) transmembrane collagen trimer(GO:0030936) |
| 0.4 | 18.3 | GO:0042571 | immunoglobulin complex, circulating(GO:0042571) |
| 0.3 | 4.8 | GO:0036038 | MKS complex(GO:0036038) |
| 0.3 | 2.2 | GO:0060091 | kinocilium(GO:0060091) |
| 0.3 | 2.2 | GO:0031465 | Cul4B-RING E3 ubiquitin ligase complex(GO:0031465) |
| 0.2 | 23.0 | GO:0005901 | caveola(GO:0005901) |
| 0.2 | 0.9 | GO:0002193 | MAML1-RBP-Jkappa- ICN1 complex(GO:0002193) |
| 0.2 | 5.4 | GO:0046658 | anchored component of plasma membrane(GO:0046658) |
| 0.2 | 4.0 | GO:0046930 | pore complex(GO:0046930) |
| 0.2 | 4.3 | GO:0097381 | photoreceptor disc membrane(GO:0097381) |
| 0.1 | 1.0 | GO:0097013 | phagocytic vesicle lumen(GO:0097013) |
| 0.1 | 1.6 | GO:0016602 | CCAAT-binding factor complex(GO:0016602) |
| 0.1 | 4.8 | GO:0032391 | photoreceptor connecting cilium(GO:0032391) |
| 0.1 | 3.0 | GO:0005686 | U2 snRNP(GO:0005686) |
| 0.1 | 13.3 | GO:0035578 | azurophil granule lumen(GO:0035578) |
| 0.1 | 7.7 | GO:0005844 | polysome(GO:0005844) |
| 0.1 | 12.8 | GO:0000777 | condensed chromosome kinetochore(GO:0000777) |
| 0.1 | 2.2 | GO:0031265 | CD95 death-inducing signaling complex(GO:0031265) |
| 0.1 | 7.9 | GO:0005811 | lipid particle(GO:0005811) |
| 0.1 | 31.3 | GO:0034774 | secretory granule lumen(GO:0034774) |
| 0.1 | 3.9 | GO:0005881 | cytoplasmic microtubule(GO:0005881) |
| 0.1 | 13.5 | GO:0005788 | endoplasmic reticulum lumen(GO:0005788) |
| 0.1 | 0.9 | GO:0008091 | spectrin(GO:0008091) |
| 0.1 | 10.0 | GO:0016605 | PML body(GO:0016605) |
| 0.1 | 0.3 | GO:0097452 | GAIT complex(GO:0097452) |
| 0.1 | 5.3 | GO:0005776 | autophagosome(GO:0005776) |
| 0.1 | 2.9 | GO:0005801 | cis-Golgi network(GO:0005801) |
| 0.0 | 3.2 | GO:0072686 | mitotic spindle(GO:0072686) |
| 0.0 | 7.5 | GO:0001650 | fibrillar center(GO:0001650) |
| 0.0 | 4.6 | GO:0005643 | nuclear pore(GO:0005643) |
| 0.0 | 6.1 | GO:0030175 | filopodium(GO:0030175) |
| 0.0 | 2.8 | GO:0001750 | photoreceptor outer segment(GO:0001750) |
| 0.0 | 4.2 | GO:0005796 | Golgi lumen(GO:0005796) |
| 0.0 | 5.7 | GO:0043204 | perikaryon(GO:0043204) |
| 0.0 | 0.7 | GO:1904724 | tertiary granule lumen(GO:1904724) |
| 0.0 | 1.9 | GO:0031907 | peroxisomal matrix(GO:0005782) microbody lumen(GO:0031907) |
| 0.0 | 5.1 | GO:0031234 | extrinsic component of cytoplasmic side of plasma membrane(GO:0031234) |
| 0.0 | 9.3 | GO:0031965 | nuclear membrane(GO:0031965) |
| 0.0 | 0.3 | GO:0001917 | photoreceptor inner segment(GO:0001917) |
| 0.0 | 7.1 | GO:0005769 | early endosome(GO:0005769) |
| 0.0 | 31.2 | GO:0005615 | extracellular space(GO:0005615) |
| 0.0 | 1.3 | GO:0022627 | cytosolic small ribosomal subunit(GO:0022627) |
| 0.0 | 1.2 | GO:0015030 | Cajal body(GO:0015030) |
| 0.0 | 10.8 | GO:0015629 | actin cytoskeleton(GO:0015629) |
| 0.0 | 1.6 | GO:0071013 | catalytic step 2 spliceosome(GO:0071013) |
| 0.0 | 2.7 | GO:0009897 | external side of plasma membrane(GO:0009897) |
| 0.0 | 5.2 | GO:0016607 | nuclear speck(GO:0016607) |
Gene overrepresentation in molecular_function category:
| Log-likelihood per target | Total log-likelihood | Term | Description |
|---|---|---|---|
| 4.2 | 12.6 | GO:0050135 | NAD+ nucleosidase activity(GO:0003953) NAD(P)+ nucleosidase activity(GO:0050135) |
| 3.1 | 9.4 | GO:0004829 | threonine-tRNA ligase activity(GO:0004829) |
| 2.6 | 7.7 | GO:0098626 | methylselenol reductase activity(GO:0098625) methylseleninic acid reductase activity(GO:0098626) |
| 2.0 | 29.5 | GO:0001094 | TFIID-class transcription factor binding(GO:0001094) |
| 1.4 | 8.2 | GO:0050291 | sphingosine N-acyltransferase activity(GO:0050291) |
| 1.2 | 11.2 | GO:0046976 | histone methyltransferase activity (H3-K27 specific)(GO:0046976) |
| 1.1 | 8.0 | GO:0031726 | CCR1 chemokine receptor binding(GO:0031726) |
| 1.1 | 4.5 | GO:0004466 | long-chain-acyl-CoA dehydrogenase activity(GO:0004466) |
| 1.0 | 10.0 | GO:0034485 | phosphatidylinositol-3,4,5-trisphosphate 5-phosphatase activity(GO:0034485) |
| 0.9 | 18.5 | GO:0031435 | mitogen-activated protein kinase kinase kinase binding(GO:0031435) |
| 0.8 | 3.2 | GO:0051734 | ATP-dependent polydeoxyribonucleotide 5'-hydroxyl-kinase activity(GO:0046404) polydeoxyribonucleotide kinase activity(GO:0051733) ATP-dependent polynucleotide kinase activity(GO:0051734) |
| 0.7 | 2.9 | GO:0050220 | prostaglandin-E synthase activity(GO:0050220) |
| 0.7 | 5.8 | GO:0008379 | thioredoxin peroxidase activity(GO:0008379) |
| 0.7 | 2.8 | GO:0004666 | prostaglandin-endoperoxide synthase activity(GO:0004666) |
| 0.6 | 1.9 | GO:0016899 | oxidoreductase activity, acting on the CH-OH group of donors, oxygen as acceptor(GO:0016899) |
| 0.6 | 14.2 | GO:0070006 | metalloaminopeptidase activity(GO:0070006) |
| 0.6 | 14.7 | GO:0031489 | myosin V binding(GO:0031489) |
| 0.5 | 10.1 | GO:0003756 | protein disulfide isomerase activity(GO:0003756) intramolecular oxidoreductase activity, transposing S-S bonds(GO:0016864) |
| 0.5 | 2.3 | GO:0023024 | MHC class I protein complex binding(GO:0023024) |
| 0.4 | 12.9 | GO:0003887 | DNA-directed DNA polymerase activity(GO:0003887) |
| 0.4 | 4.0 | GO:0015288 | porin activity(GO:0015288) |
| 0.4 | 2.2 | GO:0043120 | tumor necrosis factor binding(GO:0043120) |
| 0.4 | 11.4 | GO:0005527 | macrolide binding(GO:0005527) FK506 binding(GO:0005528) |
| 0.3 | 1.7 | GO:0017159 | pantetheine hydrolase activity(GO:0017159) |
| 0.3 | 37.5 | GO:0004867 | serine-type endopeptidase inhibitor activity(GO:0004867) |
| 0.3 | 1.0 | GO:0016019 | peptidoglycan receptor activity(GO:0016019) |
| 0.3 | 18.3 | GO:0034987 | immunoglobulin receptor binding(GO:0034987) |
| 0.3 | 5.3 | GO:0005149 | interleukin-1 receptor binding(GO:0005149) |
| 0.3 | 7.1 | GO:0005086 | ARF guanyl-nucleotide exchange factor activity(GO:0005086) |
| 0.3 | 27.8 | GO:0032947 | protein complex scaffold(GO:0032947) |
| 0.2 | 18.7 | GO:0004843 | thiol-dependent ubiquitin-specific protease activity(GO:0004843) |
| 0.2 | 4.5 | GO:0008239 | dipeptidyl-peptidase activity(GO:0008239) |
| 0.2 | 2.4 | GO:0048156 | tau protein binding(GO:0048156) |
| 0.2 | 3.0 | GO:0008349 | MAP kinase kinase kinase kinase activity(GO:0008349) |
| 0.2 | 1.0 | GO:0032190 | acrosin binding(GO:0032190) |
| 0.2 | 27.7 | GO:0003823 | antigen binding(GO:0003823) |
| 0.1 | 1.9 | GO:0004875 | complement receptor activity(GO:0004875) |
| 0.1 | 5.7 | GO:0043027 | cysteine-type endopeptidase inhibitor activity involved in apoptotic process(GO:0043027) |
| 0.1 | 10.5 | GO:0004715 | non-membrane spanning protein tyrosine kinase activity(GO:0004715) |
| 0.1 | 4.7 | GO:0001106 | RNA polymerase II transcription corepressor activity(GO:0001106) |
| 0.1 | 5.2 | GO:0061631 | ubiquitin conjugating enzyme activity(GO:0061631) |
| 0.1 | 2.0 | GO:0015467 | G-protein activated inward rectifier potassium channel activity(GO:0015467) |
| 0.1 | 10.0 | GO:0051087 | chaperone binding(GO:0051087) |
| 0.1 | 9.8 | GO:0004540 | ribonuclease activity(GO:0004540) |
| 0.1 | 0.9 | GO:0042731 | PH domain binding(GO:0042731) |
| 0.1 | 21.7 | GO:0051015 | actin filament binding(GO:0051015) |
| 0.1 | 0.7 | GO:0019863 | IgE binding(GO:0019863) |
| 0.1 | 0.9 | GO:0000150 | recombinase activity(GO:0000150) |
| 0.1 | 7.7 | GO:0017048 | Rho GTPase binding(GO:0017048) |
| 0.0 | 2.2 | GO:0008138 | protein tyrosine/serine/threonine phosphatase activity(GO:0008138) |
| 0.0 | 14.3 | GO:0030246 | carbohydrate binding(GO:0030246) |
| 0.0 | 5.5 | GO:0001158 | enhancer sequence-specific DNA binding(GO:0001158) |
| 0.0 | 0.2 | GO:0043515 | kinetochore binding(GO:0043515) |
| 0.0 | 0.7 | GO:0005540 | hyaluronic acid binding(GO:0005540) |
| 0.0 | 2.2 | GO:0003684 | damaged DNA binding(GO:0003684) |
| 0.0 | 2.1 | GO:0008307 | structural constituent of muscle(GO:0008307) |
| 0.0 | 1.3 | GO:0001972 | retinoic acid binding(GO:0001972) |
| 0.0 | 20.1 | GO:0008134 | transcription factor binding(GO:0008134) |
| 0.0 | 9.6 | GO:0005096 | GTPase activator activity(GO:0005096) |
| 0.0 | 1.8 | GO:0005070 | SH3/SH2 adaptor activity(GO:0005070) |
| 0.0 | 1.6 | GO:0004004 | ATP-dependent RNA helicase activity(GO:0004004) |
| 0.0 | 0.7 | GO:0004033 | aldo-keto reductase (NADP) activity(GO:0004033) |
| 0.0 | 7.3 | GO:0005543 | phospholipid binding(GO:0005543) |
| 0.0 | 4.0 | GO:0004252 | serine-type endopeptidase activity(GO:0004252) |
| 0.0 | 5.6 | GO:0003924 | GTPase activity(GO:0003924) |
| 0.0 | 3.3 | GO:0008022 | protein C-terminus binding(GO:0008022) |
Gene overrepresentation in C2:CP category:
| Log-likelihood per target | Total log-likelihood | Term | Description |
|---|---|---|---|
| 0.3 | 10.0 | PID EPHA2 FWD PATHWAY | EPHA2 forward signaling |
| 0.2 | 4.8 | PID TCR JNK PATHWAY | JNK signaling in the CD4+ TCR pathway |
| 0.2 | 21.9 | PID VEGFR1 2 PATHWAY | Signaling events mediated by VEGFR1 and VEGFR2 |
| 0.2 | 5.3 | PID ANTHRAX PATHWAY | Cellular roles of Anthrax toxin |
| 0.2 | 15.2 | PID MTOR 4PATHWAY | mTOR signaling pathway |
| 0.2 | 8.4 | PID MYC PATHWAY | C-MYC pathway |
| 0.2 | 40.6 | NABA ECM REGULATORS | Genes encoding enzymes and their regulators involved in the remodeling of the extracellular matrix |
| 0.2 | 9.6 | PID SYNDECAN 1 PATHWAY | Syndecan-1-mediated signaling events |
| 0.1 | 2.2 | SA FAS SIGNALING | The TNF-type receptor Fas induces apoptosis on ligand binding. |
| 0.1 | 12.6 | ST INTEGRIN SIGNALING PATHWAY | Integrin Signaling Pathway |
| 0.1 | 4.3 | PID RHODOPSIN PATHWAY | Visual signal transduction: Rods |
| 0.1 | 3.8 | PID IL2 1PATHWAY | IL2-mediated signaling events |
| 0.1 | 4.6 | ST TUMOR NECROSIS FACTOR PATHWAY | Tumor Necrosis Factor Pathway. |
| 0.1 | 6.6 | PID HNF3B PATHWAY | FOXA2 and FOXA3 transcription factor networks |
| 0.1 | 2.9 | PID IFNG PATHWAY | IFN-gamma pathway |
| 0.1 | 7.9 | PID HIF1 TFPATHWAY | HIF-1-alpha transcription factor network |
| 0.1 | 3.7 | SIG BCR SIGNALING PATHWAY | Members of the BCR signaling pathway |
| 0.1 | 5.8 | PID MYC ACTIV PATHWAY | Validated targets of C-MYC transcriptional activation |
| 0.1 | 5.7 | PID PDGFRB PATHWAY | PDGFR-beta signaling pathway |
| 0.1 | 9.3 | NABA ECM AFFILIATED | Genes encoding proteins affiliated structurally or functionally to extracellular matrix proteins |
| 0.0 | 0.8 | PID INTEGRIN A9B1 PATHWAY | Alpha9 beta1 integrin signaling events |
| 0.0 | 1.3 | PID TCR PATHWAY | TCR signaling in naïve CD4+ T cells |
| 0.0 | 0.9 | PID PS1 PATHWAY | Presenilin action in Notch and Wnt signaling |
| 0.0 | 1.2 | PID RB 1PATHWAY | Regulation of retinoblastoma protein |
| 0.0 | 1.6 | PID MYC REPRESS PATHWAY | Validated targets of C-MYC transcriptional repression |
| 0.0 | 0.7 | PID IL4 2PATHWAY | IL4-mediated signaling events |
Gene overrepresentation in C2:CP:REACTOME category:
| Log-likelihood per target | Total log-likelihood | Term | Description |
|---|---|---|---|
| 0.6 | 12.6 | REACTOME NRIF SIGNALS CELL DEATH FROM THE NUCLEUS | Genes involved in NRIF signals cell death from the nucleus |
| 0.5 | 2.4 | REACTOME NRAGE SIGNALS DEATH THROUGH JNK | Genes involved in NRAGE signals death through JNK |
| 0.4 | 10.9 | REACTOME INSULIN SYNTHESIS AND PROCESSING | Genes involved in Insulin Synthesis and Processing |
| 0.3 | 9.4 | REACTOME CYTOSOLIC TRNA AMINOACYLATION | Genes involved in Cytosolic tRNA aminoacylation |
| 0.2 | 4.0 | REACTOME SYNTHESIS SECRETION AND INACTIVATION OF GIP | Genes involved in Synthesis, Secretion, and Inactivation of Glucose-dependent Insulinotropic Polypeptide (GIP) |
| 0.2 | 4.2 | REACTOME DEFENSINS | Genes involved in Defensins |
| 0.2 | 10.0 | REACTOME SYNTHESIS OF PIPS AT THE PLASMA MEMBRANE | Genes involved in Synthesis of PIPs at the plasma membrane |
| 0.2 | 7.7 | REACTOME SYNTHESIS AND INTERCONVERSION OF NUCLEOTIDE DI AND TRIPHOSPHATES | Genes involved in Synthesis and interconversion of nucleotide di- and triphosphates |
| 0.2 | 8.4 | REACTOME EXTENSION OF TELOMERES | Genes involved in Extension of Telomeres |
| 0.2 | 4.3 | REACTOME G BETA GAMMA SIGNALLING THROUGH PLC BETA | Genes involved in G beta:gamma signalling through PLC beta |
| 0.2 | 3.8 | REACTOME ENDOSOMAL SORTING COMPLEX REQUIRED FOR TRANSPORT ESCRT | Genes involved in Endosomal Sorting Complex Required For Transport (ESCRT) |
| 0.2 | 13.4 | REACTOME FORMATION OF THE TERNARY COMPLEX AND SUBSEQUENTLY THE 43S COMPLEX | Genes involved in Formation of the ternary complex, and subsequently, the 43S complex |
| 0.2 | 4.8 | REACTOME POST CHAPERONIN TUBULIN FOLDING PATHWAY | Genes involved in Post-chaperonin tubulin folding pathway |
| 0.2 | 3.2 | REACTOME PROCESSING OF INTRONLESS PRE MRNAS | Genes involved in Processing of Intronless Pre-mRNAs |
| 0.1 | 4.7 | REACTOME DEGRADATION OF THE EXTRACELLULAR MATRIX | Genes involved in Degradation of the extracellular matrix |
| 0.1 | 6.9 | REACTOME CHEMOKINE RECEPTORS BIND CHEMOKINES | Genes involved in Chemokine receptors bind chemokines |
| 0.1 | 6.1 | REACTOME GENERATION OF SECOND MESSENGER MOLECULES | Genes involved in Generation of second messenger molecules |
| 0.1 | 8.4 | REACTOME ACTIVATION OF CHAPERONE GENES BY XBP1S | Genes involved in Activation of Chaperone Genes by XBP1(S) |
| 0.1 | 2.0 | REACTOME INHIBITION OF VOLTAGE GATED CA2 CHANNELS VIA GBETA GAMMA SUBUNITS | Genes involved in Inhibition of voltage gated Ca2+ channels via Gbeta/gamma subunits |
| 0.1 | 4.9 | REACTOME IL1 SIGNALING | Genes involved in Interleukin-1 signaling |
| 0.1 | 5.2 | REACTOME MITOCHONDRIAL PROTEIN IMPORT | Genes involved in Mitochondrial Protein Import |
| 0.1 | 3.0 | REACTOME REGULATION OF BETA CELL DEVELOPMENT | Genes involved in Regulation of beta-cell development |
| 0.1 | 2.2 | REACTOME CONVERSION FROM APC C CDC20 TO APC C CDH1 IN LATE ANAPHASE | Genes involved in Conversion from APC/C:Cdc20 to APC/C:Cdh1 in late anaphase |
| 0.1 | 2.2 | REACTOME EXTRINSIC PATHWAY FOR APOPTOSIS | Genes involved in Extrinsic Pathway for Apoptosis |
| 0.1 | 7.3 | REACTOME PPARA ACTIVATES GENE EXPRESSION | Genes involved in PPARA Activates Gene Expression |
| 0.1 | 1.3 | REACTOME GLUCURONIDATION | Genes involved in Glucuronidation |
| 0.0 | 7.7 | REACTOME SIGNALING BY RHO GTPASES | Genes involved in Signaling by Rho GTPases |
| 0.0 | 2.8 | REACTOME PHASE1 FUNCTIONALIZATION OF COMPOUNDS | Genes involved in Phase 1 - Functionalization of compounds |
| 0.0 | 2.3 | REACTOME IMMUNOREGULATORY INTERACTIONS BETWEEN A LYMPHOID AND A NON LYMPHOID CELL | Genes involved in Immunoregulatory interactions between a Lymphoid and a non-Lymphoid cell |
| 0.0 | 2.8 | REACTOME CELL SURFACE INTERACTIONS AT THE VASCULAR WALL | Genes involved in Cell surface interactions at the vascular wall |
| 0.0 | 1.5 | REACTOME COLLAGEN FORMATION | Genes involved in Collagen formation |
| 0.0 | 5.2 | REACTOME SIGNALLING BY NGF | Genes involved in Signalling by NGF |
| 0.0 | 1.7 | REACTOME NUCLEAR RECEPTOR TRANSCRIPTION PATHWAY | Genes involved in Nuclear Receptor transcription pathway |
| 0.0 | 5.2 | REACTOME ANTIGEN PROCESSING UBIQUITINATION PROTEASOME DEGRADATION | Genes involved in Antigen processing: Ubiquitination & Proteasome degradation |