Project
GNF SymAtlas + NCI-60 cancer cell lines, comparison of cancers vs non-cancers, human (Su, 2004; Ross, 2000)
Navigation
Downloads
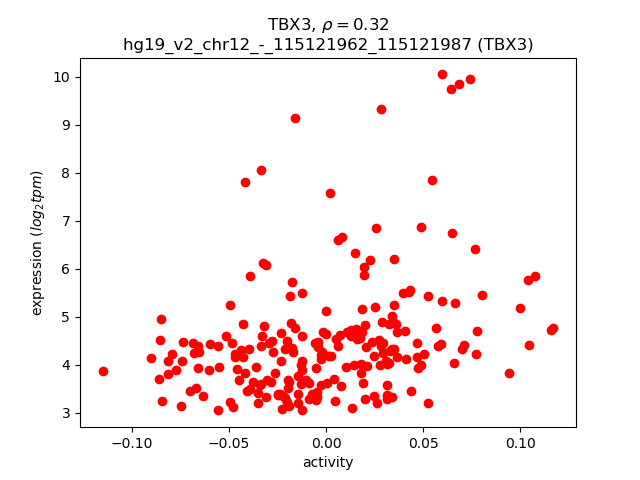
Results for TBX3
Z-value: 0.31
Motif logo

Transcription factors associated with TBX3
| Gene Symbol | Gene ID | Gene Info |
|---|---|---|
|
TBX3
|
ENSG00000135111.10 | T-box transcription factor 3 |
Activity-expression correlation:
| Gene | Promoter | Pearson corr. coef. | P-value | Plot |
|---|---|---|---|---|
| TBX3 | hg19_v2_chr12_-_115121962_115121987 | 0.32 | 1.0e-06 | Click! |
Activity profile of TBX3 motif
Sorted Z-values of TBX3 motif
| Promoter | Log-likelihood | Transcript | Gene | Gene Info |
|---|---|---|---|---|
| chr22_+_23237555 | 13.43 |
ENST00000390321.2
|
IGLC1
|
immunoglobulin lambda constant 1 (Mcg marker) |
| chr5_-_39425222 | 11.53 |
ENST00000320816.6
|
DAB2
|
Dab, mitogen-responsive phosphoprotein, homolog 2 (Drosophila) |
| chr2_-_89310012 | 11.10 |
ENST00000493819.1
|
IGKV1-9
|
immunoglobulin kappa variable 1-9 |
| chr16_+_55512742 | 10.21 |
ENST00000568715.1
ENST00000219070.4 |
MMP2
|
matrix metallopeptidase 2 (gelatinase A, 72kDa gelatinase, 72kDa type IV collagenase) |
| chr2_-_89266286 | 9.63 |
ENST00000464162.1
|
IGKV1-6
|
immunoglobulin kappa variable 1-6 |
| chr2_-_89513402 | 9.49 |
ENST00000498435.1
|
IGKV1-27
|
immunoglobulin kappa variable 1-27 |
| chr14_-_106642049 | 8.61 |
ENST00000390605.2
|
IGHV1-18
|
immunoglobulin heavy variable 1-18 |
| chr2_-_209118974 | 8.42 |
ENST00000415913.1
ENST00000415282.1 ENST00000446179.1 |
IDH1
|
isocitrate dehydrogenase 1 (NADP+), soluble |
| chr6_-_52668605 | 8.00 |
ENST00000334575.5
|
GSTA1
|
glutathione S-transferase alpha 1 |
| chr11_-_327537 | 7.67 |
ENST00000602735.1
|
IFITM3
|
interferon induced transmembrane protein 3 |
| chr17_-_40575535 | 7.54 |
ENST00000357037.5
|
PTRF
|
polymerase I and transcript release factor |
| chr14_-_107283278 | 7.42 |
ENST00000390639.2
|
IGHV7-81
|
immunoglobulin heavy variable 7-81 (non-functional) |
| chr12_-_56120865 | 6.88 |
ENST00000548898.1
ENST00000552067.1 |
CD63
|
CD63 molecule |
| chr2_-_209119831 | 6.86 |
ENST00000345146.2
|
IDH1
|
isocitrate dehydrogenase 1 (NADP+), soluble |
| chr12_-_56121612 | 6.60 |
ENST00000546939.1
|
CD63
|
CD63 molecule |
| chr12_-_56121580 | 6.46 |
ENST00000550776.1
|
CD63
|
CD63 molecule |
| chrX_-_65259914 | 5.96 |
ENST00000374737.4
ENST00000455586.2 |
VSIG4
|
V-set and immunoglobulin domain containing 4 |
| chr16_+_58283814 | 5.90 |
ENST00000443128.2
ENST00000219299.4 |
CCDC113
|
coiled-coil domain containing 113 |
| chrX_-_65259900 | 5.82 |
ENST00000412866.2
|
VSIG4
|
V-set and immunoglobulin domain containing 4 |
| chr3_+_149192475 | 5.77 |
ENST00000465758.1
|
TM4SF4
|
transmembrane 4 L six family member 4 |
| chr7_+_22766766 | 5.68 |
ENST00000426291.1
ENST00000401651.1 ENST00000258743.5 ENST00000420258.2 ENST00000407492.1 ENST00000401630.3 ENST00000406575.1 |
IL6
|
interleukin 6 (interferon, beta 2) |
| chrX_+_16737718 | 5.65 |
ENST00000380155.3
|
SYAP1
|
synapse associated protein 1 |
| chr22_+_24999114 | 5.40 |
ENST00000412658.1
ENST00000445029.1 ENST00000419133.1 ENST00000400382.1 ENST00000438643.2 ENST00000452551.1 ENST00000400383.1 ENST00000412898.1 ENST00000400380.1 ENST00000455483.1 ENST00000430289.1 |
GGT1
|
gamma-glutamyltransferase 1 |
| chr22_+_24891210 | 5.23 |
ENST00000382760.2
|
UPB1
|
ureidopropionase, beta |
| chr11_-_33744487 | 5.22 |
ENST00000426650.2
|
CD59
|
CD59 molecule, complement regulatory protein |
| chr12_-_56120838 | 5.05 |
ENST00000548160.1
|
CD63
|
CD63 molecule |
| chr7_-_93519471 | 4.95 |
ENST00000451238.1
|
TFPI2
|
tissue factor pathway inhibitor 2 |
| chr20_-_44539538 | 4.89 |
ENST00000372420.1
|
PLTP
|
phospholipid transfer protein |
| chr4_-_84030996 | 4.66 |
ENST00000411416.2
|
PLAC8
|
placenta-specific 8 |
| chr19_-_51531272 | 4.48 |
ENST00000319720.7
|
KLK11
|
kallikrein-related peptidase 11 |
| chr11_+_35198243 | 4.22 |
ENST00000528455.1
|
CD44
|
CD44 molecule (Indian blood group) |
| chr3_+_149191723 | 4.13 |
ENST00000305354.4
|
TM4SF4
|
transmembrane 4 L six family member 4 |
| chr1_-_183560011 | 4.10 |
ENST00000367536.1
|
NCF2
|
neutrophil cytosolic factor 2 |
| chr19_-_51530916 | 4.08 |
ENST00000594768.1
|
KLK11
|
kallikrein-related peptidase 11 |
| chr6_+_32821924 | 3.98 |
ENST00000374859.2
ENST00000453265.2 |
PSMB9
|
proteasome (prosome, macropain) subunit, beta type, 9 |
| chr3_+_52454971 | 3.94 |
ENST00000465863.1
|
PHF7
|
PHD finger protein 7 |
| chr2_+_89184868 | 3.87 |
ENST00000390243.2
|
IGKV4-1
|
immunoglobulin kappa variable 4-1 |
| chr2_+_90153696 | 3.86 |
ENST00000417279.2
|
IGKV3D-15
|
immunoglobulin kappa variable 3D-15 (gene/pseudogene) |
| chr2_+_90192768 | 3.81 |
ENST00000390275.2
|
IGKV1D-13
|
immunoglobulin kappa variable 1D-13 |
| chr11_-_1629693 | 3.72 |
ENST00000399685.1
|
KRTAP5-3
|
keratin associated protein 5-3 |
| chr12_+_124155652 | 3.69 |
ENST00000426174.2
ENST00000303372.5 |
TCTN2
|
tectonic family member 2 |
| chr6_-_52628271 | 3.68 |
ENST00000493422.1
|
GSTA2
|
glutathione S-transferase alpha 2 |
| chr4_-_83765613 | 3.57 |
ENST00000503937.1
|
SEC31A
|
SEC31 homolog A (S. cerevisiae) |
| chr4_-_83812402 | 3.53 |
ENST00000395310.2
|
SEC31A
|
SEC31 homolog A (S. cerevisiae) |
| chr11_-_33744256 | 3.52 |
ENST00000415002.2
ENST00000437761.2 ENST00000445143.2 |
CD59
|
CD59 molecule, complement regulatory protein |
| chr2_-_217560248 | 3.34 |
ENST00000233813.4
|
IGFBP5
|
insulin-like growth factor binding protein 5 |
| chr14_-_21270561 | 3.33 |
ENST00000412779.2
|
RNASE1
|
ribonuclease, RNase A family, 1 (pancreatic) |
| chr15_+_79603404 | 3.28 |
ENST00000299705.5
|
TMED3
|
transmembrane emp24 protein transport domain containing 3 |
| chr11_-_10590238 | 3.26 |
ENST00000256178.3
|
LYVE1
|
lymphatic vessel endothelial hyaluronan receptor 1 |
| chr22_-_21581926 | 3.24 |
ENST00000401924.1
|
GGT2
|
gamma-glutamyltransferase 2 |
| chr6_-_32821599 | 3.22 |
ENST00000354258.4
|
TAP1
|
transporter 1, ATP-binding cassette, sub-family B (MDR/TAP) |
| chr5_+_148521046 | 3.17 |
ENST00000326685.7
ENST00000356541.3 ENST00000309868.7 |
ABLIM3
|
actin binding LIM protein family, member 3 |
| chr21_+_27011899 | 3.09 |
ENST00000425221.2
|
JAM2
|
junctional adhesion molecule 2 |
| chr11_-_73689037 | 3.08 |
ENST00000544615.1
|
UCP2
|
uncoupling protein 2 (mitochondrial, proton carrier) |
| chr11_+_1718425 | 3.05 |
ENST00000382160.1
|
KRTAP5-6
|
keratin associated protein 5-6 |
| chr19_+_9296279 | 3.02 |
ENST00000344248.2
|
OR7D2
|
olfactory receptor, family 7, subfamily D, member 2 |
| chrX_-_101726732 | 3.01 |
ENST00000457521.2
ENST00000412230.2 ENST00000453326.2 |
NXF2B
TCP11X2
|
nuclear RNA export factor 2B t-complex 11 family, X-linked 2 |
| chr14_-_21270995 | 2.89 |
ENST00000555698.1
ENST00000397970.4 ENST00000340900.3 |
RNASE1
|
ribonuclease, RNase A family, 1 (pancreatic) |
| chr8_-_133123406 | 2.87 |
ENST00000434736.2
|
HHLA1
|
HERV-H LTR-associating 1 |
| chr4_+_155484155 | 2.84 |
ENST00000509493.1
|
FGB
|
fibrinogen beta chain |
| chr5_+_32788945 | 2.83 |
ENST00000326958.1
|
AC026703.1
|
AC026703.1 |
| chr11_-_8285405 | 2.82 |
ENST00000335790.3
ENST00000534484.1 |
LMO1
|
LIM domain only 1 (rhombotin 1) |
| chr2_-_217559517 | 2.69 |
ENST00000449583.1
|
IGFBP5
|
insulin-like growth factor binding protein 5 |
| chr4_-_46911223 | 2.65 |
ENST00000396533.1
|
COX7B2
|
cytochrome c oxidase subunit VIIb2 |
| chr11_-_10590118 | 2.62 |
ENST00000529598.1
|
LYVE1
|
lymphatic vessel endothelial hyaluronan receptor 1 |
| chr22_+_23063100 | 2.61 |
ENST00000390309.2
|
IGLV3-19
|
immunoglobulin lambda variable 3-19 |
| chr1_+_162602244 | 2.59 |
ENST00000367922.3
ENST00000367921.3 |
DDR2
|
discoidin domain receptor tyrosine kinase 2 |
| chr3_-_81792780 | 2.57 |
ENST00000489715.1
|
GBE1
|
glucan (1,4-alpha-), branching enzyme 1 |
| chr10_+_71561704 | 2.57 |
ENST00000520267.1
|
COL13A1
|
collagen, type XIII, alpha 1 |
| chrX_+_101470280 | 2.57 |
ENST00000395088.2
ENST00000330252.5 ENST00000333110.5 |
NXF2
TCP11X1
|
nuclear RNA export factor 2 t-complex 11 family, X-linked 1 |
| chr4_-_46911248 | 2.55 |
ENST00000355591.3
ENST00000505102.1 |
COX7B2
|
cytochrome c oxidase subunit VIIb2 |
| chr17_+_45286387 | 2.54 |
ENST00000572316.1
ENST00000354968.1 ENST00000576874.1 ENST00000536623.2 |
MYL4
|
myosin, light chain 4, alkali; atrial, embryonic |
| chr16_+_72088376 | 2.53 |
ENST00000570083.1
ENST00000355906.5 ENST00000398131.2 ENST00000569639.1 ENST00000564499.1 ENST00000357763.4 ENST00000562526.1 ENST00000565574.1 ENST00000568417.2 ENST00000356967.5 |
HP
HPR
|
haptoglobin haptoglobin-related protein |
| chr2_+_65215604 | 2.52 |
ENST00000531327.1
|
SLC1A4
|
solute carrier family 1 (glutamate/neutral amino acid transporter), member 4 |
| chr7_+_150434430 | 2.49 |
ENST00000358647.3
|
GIMAP5
|
GTPase, IMAP family member 5 |
| chr5_+_54320078 | 2.48 |
ENST00000231009.2
|
GZMK
|
granzyme K (granzyme 3; tryptase II) |
| chr13_-_46679144 | 2.48 |
ENST00000181383.4
|
CPB2
|
carboxypeptidase B2 (plasma) |
| chr17_+_74372662 | 2.47 |
ENST00000591651.1
ENST00000545180.1 |
SPHK1
|
sphingosine kinase 1 |
| chr19_+_41103063 | 2.42 |
ENST00000308370.7
|
LTBP4
|
latent transforming growth factor beta binding protein 4 |
| chr19_+_49404041 | 2.42 |
ENST00000263273.5
ENST00000424608.1 |
NUCB1
|
nucleobindin 1 |
| chr19_+_1077393 | 2.34 |
ENST00000590577.1
|
HMHA1
|
histocompatibility (minor) HA-1 |
| chr4_+_15704573 | 2.31 |
ENST00000265016.4
|
BST1
|
bone marrow stromal cell antigen 1 |
| chr2_-_165698662 | 2.30 |
ENST00000194871.6
ENST00000445474.2 |
COBLL1
|
cordon-bleu WH2 repeat protein-like 1 |
| chr3_-_178984759 | 2.24 |
ENST00000349697.2
ENST00000497599.1 |
KCNMB3
|
potassium large conductance calcium-activated channel, subfamily M beta member 3 |
| chr4_+_155484103 | 2.16 |
ENST00000302068.4
|
FGB
|
fibrinogen beta chain |
| chr19_-_51538118 | 2.14 |
ENST00000529888.1
|
KLK12
|
kallikrein-related peptidase 12 |
| chr14_-_106471723 | 2.11 |
ENST00000390595.2
|
IGHV1-3
|
immunoglobulin heavy variable 1-3 |
| chr10_+_71561630 | 2.09 |
ENST00000398974.3
ENST00000398971.3 ENST00000398968.3 ENST00000398966.3 ENST00000398964.3 ENST00000398969.3 ENST00000356340.3 ENST00000398972.3 ENST00000398973.3 |
COL13A1
|
collagen, type XIII, alpha 1 |
| chr19_+_49403562 | 2.09 |
ENST00000407032.1
ENST00000452087.1 ENST00000411700.1 |
NUCB1
|
nucleobindin 1 |
| chr12_-_8815404 | 1.98 |
ENST00000359478.2
ENST00000396549.2 |
MFAP5
|
microfibrillar associated protein 5 |
| chr14_+_21785693 | 1.96 |
ENST00000382933.4
ENST00000557351.1 |
RPGRIP1
|
retinitis pigmentosa GTPase regulator interacting protein 1 |
| chr8_+_133931648 | 1.88 |
ENST00000519178.1
ENST00000542445.1 |
TG
|
thyroglobulin |
| chr7_-_19748640 | 1.87 |
ENST00000222567.5
|
TWISTNB
|
TWIST neighbor |
| chr17_-_1419914 | 1.84 |
ENST00000397335.3
ENST00000574561.1 |
INPP5K
|
inositol polyphosphate-5-phosphatase K |
| chr1_-_11865351 | 1.82 |
ENST00000413656.1
ENST00000376585.1 ENST00000423400.1 ENST00000431243.1 |
MTHFR
|
methylenetetrahydrofolate reductase (NAD(P)H) |
| chr12_-_7848364 | 1.79 |
ENST00000329913.3
|
GDF3
|
growth differentiation factor 3 |
| chr11_+_18433840 | 1.78 |
ENST00000541669.1
ENST00000280704.4 |
LDHC
|
lactate dehydrogenase C |
| chr7_+_150264365 | 1.78 |
ENST00000255945.2
ENST00000461940.1 |
GIMAP4
|
GTPase, IMAP family member 4 |
| chr17_-_7017559 | 1.77 |
ENST00000446679.2
|
ASGR2
|
asialoglycoprotein receptor 2 |
| chr8_+_23386305 | 1.77 |
ENST00000519973.1
|
SLC25A37
|
solute carrier family 25 (mitochondrial iron transporter), member 37 |
| chr10_+_71561649 | 1.77 |
ENST00000398978.3
ENST00000354547.3 ENST00000357811.3 |
COL13A1
|
collagen, type XIII, alpha 1 |
| chr2_+_90259593 | 1.71 |
ENST00000471857.1
|
IGKV1D-8
|
immunoglobulin kappa variable 1D-8 |
| chr17_+_43861680 | 1.67 |
ENST00000314537.5
|
CRHR1
|
corticotropin releasing hormone receptor 1 |
| chr19_-_51538148 | 1.67 |
ENST00000319590.4
ENST00000250351.4 |
KLK12
|
kallikrein-related peptidase 12 |
| chr2_+_242167319 | 1.63 |
ENST00000601871.1
|
AC104841.2
|
HCG1777198, isoform CRA_a; PRO2900; Uncharacterized protein |
| chr11_+_71238313 | 1.61 |
ENST00000398536.4
|
KRTAP5-7
|
keratin associated protein 5-7 |
| chr6_-_41254403 | 1.61 |
ENST00000589614.1
ENST00000334475.6 ENST00000591620.1 ENST00000244709.4 |
TREM1
|
triggering receptor expressed on myeloid cells 1 |
| chr19_-_51531210 | 1.58 |
ENST00000391804.3
|
KLK11
|
kallikrein-related peptidase 11 |
| chr3_+_189349162 | 1.57 |
ENST00000264731.3
ENST00000382063.4 ENST00000418709.2 ENST00000320472.5 ENST00000392460.3 ENST00000440651.2 |
TP63
|
tumor protein p63 |
| chr14_+_74416989 | 1.53 |
ENST00000334571.2
ENST00000554920.1 |
COQ6
|
coenzyme Q6 monooxygenase |
| chr15_-_75017711 | 1.51 |
ENST00000567032.1
ENST00000564596.1 ENST00000566503.1 ENST00000395049.4 ENST00000395048.2 ENST00000379727.3 |
CYP1A1
|
cytochrome P450, family 1, subfamily A, polypeptide 1 |
| chr9_-_130679257 | 1.50 |
ENST00000361444.3
ENST00000335791.5 ENST00000343609.2 |
ST6GALNAC4
|
ST6 (alpha-N-acetyl-neuraminyl-2,3-beta-galactosyl-1,3)-N-acetylgalactosaminide alpha-2,6-sialyltransferase 4 |
| chr16_+_83932684 | 1.49 |
ENST00000262430.4
|
MLYCD
|
malonyl-CoA decarboxylase |
| chr14_+_96722152 | 1.49 |
ENST00000216629.6
|
BDKRB1
|
bradykinin receptor B1 |
| chr3_+_148709128 | 1.49 |
ENST00000345003.4
ENST00000296048.6 ENST00000483267.1 |
GYG1
|
glycogenin 1 |
| chr19_-_16682987 | 1.48 |
ENST00000431408.1
ENST00000436553.2 ENST00000595753.1 |
SLC35E1
|
solute carrier family 35, member E1 |
| chr1_-_182921119 | 1.47 |
ENST00000423786.1
|
SHCBP1L
|
SHC SH2-domain binding protein 1-like |
| chr19_-_55691377 | 1.47 |
ENST00000589172.1
|
SYT5
|
synaptotagmin V |
| chr19_-_33360647 | 1.46 |
ENST00000590341.1
ENST00000587772.1 ENST00000023064.4 |
SLC7A9
|
solute carrier family 7 (amino acid transporter light chain, bo,+ system), member 9 |
| chr17_-_61959202 | 1.44 |
ENST00000449787.2
ENST00000456543.2 ENST00000423893.2 ENST00000332800.7 |
GH2
|
growth hormone 2 |
| chr7_-_99381884 | 1.44 |
ENST00000336411.2
|
CYP3A4
|
cytochrome P450, family 3, subfamily A, polypeptide 4 |
| chr11_+_65082289 | 1.43 |
ENST00000279249.2
|
CDC42EP2
|
CDC42 effector protein (Rho GTPase binding) 2 |
| chr6_+_6588316 | 1.42 |
ENST00000379953.2
|
LY86
|
lymphocyte antigen 86 |
| chr7_-_150675372 | 1.41 |
ENST00000262186.5
|
KCNH2
|
potassium voltage-gated channel, subfamily H (eag-related), member 2 |
| chrX_-_65858865 | 1.39 |
ENST00000374719.3
ENST00000450752.1 ENST00000451436.2 |
EDA2R
|
ectodysplasin A2 receptor |
| chr2_+_241807870 | 1.38 |
ENST00000307503.3
|
AGXT
|
alanine-glyoxylate aminotransferase |
| chr6_+_52285046 | 1.35 |
ENST00000371068.5
|
EFHC1
|
EF-hand domain (C-terminal) containing 1 |
| chrX_-_65859096 | 1.34 |
ENST00000456230.2
|
EDA2R
|
ectodysplasin A2 receptor |
| chr1_+_154540246 | 1.32 |
ENST00000368476.3
|
CHRNB2
|
cholinergic receptor, nicotinic, beta 2 (neuronal) |
| chr12_+_12223867 | 1.31 |
ENST00000308721.5
|
BCL2L14
|
BCL2-like 14 (apoptosis facilitator) |
| chr5_-_137610300 | 1.30 |
ENST00000274721.3
|
GFRA3
|
GDNF family receptor alpha 3 |
| chr2_-_113594279 | 1.28 |
ENST00000416750.1
ENST00000418817.1 ENST00000263341.2 |
IL1B
|
interleukin 1, beta |
| chr1_+_32608566 | 1.25 |
ENST00000545542.1
|
KPNA6
|
karyopherin alpha 6 (importin alpha 7) |
| chr4_-_5021164 | 1.24 |
ENST00000506508.1
ENST00000509419.1 ENST00000307746.4 |
CYTL1
|
cytokine-like 1 |
| chr8_+_79578282 | 1.22 |
ENST00000263849.4
|
ZC2HC1A
|
zinc finger, C2HC-type containing 1A |
| chr1_-_212208842 | 1.19 |
ENST00000366992.3
ENST00000366993.3 ENST00000440600.2 ENST00000366994.3 |
INTS7
|
integrator complex subunit 7 |
| chr6_+_160542821 | 1.19 |
ENST00000366963.4
|
SLC22A1
|
solute carrier family 22 (organic cation transporter), member 1 |
| chr12_-_88535747 | 1.19 |
ENST00000309041.7
|
CEP290
|
centrosomal protein 290kDa |
| chr22_+_41487711 | 1.18 |
ENST00000263253.7
|
EP300
|
E1A binding protein p300 |
| chr11_-_18258342 | 1.16 |
ENST00000278222.4
|
SAA4
|
serum amyloid A4, constitutive |
| chr19_-_47291843 | 1.16 |
ENST00000542575.2
|
SLC1A5
|
solute carrier family 1 (neutral amino acid transporter), member 5 |
| chr20_-_4229721 | 1.15 |
ENST00000379453.4
|
ADRA1D
|
adrenoceptor alpha 1D |
| chr3_+_133118839 | 1.12 |
ENST00000302334.2
|
BFSP2
|
beaded filament structural protein 2, phakinin |
| chr6_+_52285131 | 1.11 |
ENST00000433625.2
|
EFHC1
|
EF-hand domain (C-terminal) containing 1 |
| chr18_-_25616519 | 1.08 |
ENST00000399380.3
|
CDH2
|
cadherin 2, type 1, N-cadherin (neuronal) |
| chr9_+_5231413 | 1.08 |
ENST00000239316.4
|
INSL4
|
insulin-like 4 (placenta) |
| chr17_+_38465441 | 1.08 |
ENST00000577646.1
ENST00000254066.5 |
RARA
|
retinoic acid receptor, alpha |
| chr16_+_3062457 | 1.03 |
ENST00000445369.2
|
CLDN9
|
claudin 9 |
| chr2_+_55459808 | 1.03 |
ENST00000404735.1
|
RPS27A
|
ribosomal protein S27a |
| chr19_+_53898380 | 1.02 |
ENST00000396408.3
ENST00000505866.1 ENST00000594030.1 |
ZNF765
|
zinc finger protein 765 |
| chr6_-_33771757 | 1.01 |
ENST00000507738.1
ENST00000266003.5 ENST00000430124.2 |
MLN
|
motilin |
| chr6_-_11382478 | 1.00 |
ENST00000397378.3
ENST00000513989.1 ENST00000508546.1 ENST00000504387.1 |
NEDD9
|
neural precursor cell expressed, developmentally down-regulated 9 |
| chr9_+_130186653 | 0.96 |
ENST00000342483.5
ENST00000543471.1 |
ZNF79
|
zinc finger protein 79 |
| chr12_+_110011571 | 0.91 |
ENST00000539696.1
ENST00000228510.3 ENST00000392727.3 |
MVK
|
mevalonate kinase |
| chr15_-_59665062 | 0.90 |
ENST00000288235.4
|
MYO1E
|
myosin IE |
| chr7_+_99971129 | 0.89 |
ENST00000394000.2
ENST00000350573.2 |
PILRA
|
paired immunoglobin-like type 2 receptor alpha |
| chr19_+_58281014 | 0.87 |
ENST00000391702.3
ENST00000598885.1 ENST00000598183.1 ENST00000396154.2 ENST00000599802.1 ENST00000396150.4 |
ZNF586
|
zinc finger protein 586 |
| chrX_+_135570046 | 0.86 |
ENST00000370648.3
|
BRS3
|
bombesin-like receptor 3 |
| chr18_+_55018044 | 0.85 |
ENST00000324000.3
|
ST8SIA3
|
ST8 alpha-N-acetyl-neuraminide alpha-2,8-sialyltransferase 3 |
| chr8_-_72268889 | 0.84 |
ENST00000388742.4
|
EYA1
|
eyes absent homolog 1 (Drosophila) |
| chr5_-_137610254 | 0.84 |
ENST00000378362.3
|
GFRA3
|
GDNF family receptor alpha 3 |
| chr19_-_42931567 | 0.83 |
ENST00000244289.4
|
LIPE
|
lipase, hormone-sensitive |
| chr2_+_162101247 | 0.83 |
ENST00000439050.1
ENST00000436506.1 |
AC009299.3
|
AC009299.3 |
| chr3_-_178976996 | 0.82 |
ENST00000485523.1
|
KCNMB3
|
potassium large conductance calcium-activated channel, subfamily M beta member 3 |
| chr3_+_148447887 | 0.78 |
ENST00000475347.1
ENST00000474935.1 ENST00000461609.1 |
AGTR1
|
angiotensin II receptor, type 1 |
| chr13_-_103719196 | 0.76 |
ENST00000245312.3
|
SLC10A2
|
solute carrier family 10 (sodium/bile acid cotransporter), member 2 |
| chr9_-_100954910 | 0.71 |
ENST00000375077.4
|
CORO2A
|
coronin, actin binding protein, 2A |
| chr3_-_45838011 | 0.71 |
ENST00000358525.4
ENST00000413781.1 |
SLC6A20
|
solute carrier family 6 (proline IMINO transporter), member 20 |
| chr18_+_5238055 | 0.69 |
ENST00000582363.1
ENST00000582008.1 ENST00000580082.1 |
LINC00667
|
long intergenic non-protein coding RNA 667 |
| chr1_-_241799232 | 0.69 |
ENST00000366553.1
|
CHML
|
choroideremia-like (Rab escort protein 2) |
| chr7_-_134896234 | 0.68 |
ENST00000354475.4
ENST00000344400.5 |
WDR91
|
WD repeat domain 91 |
| chr1_+_171217622 | 0.68 |
ENST00000433267.1
ENST00000367750.3 |
FMO1
|
flavin containing monooxygenase 1 |
| chr1_-_51810778 | 0.66 |
ENST00000413473.2
ENST00000401051.3 ENST00000527205.1 |
TTC39A
|
tetratricopeptide repeat domain 39A |
| chr11_+_7506713 | 0.66 |
ENST00000329293.3
ENST00000534244.1 |
OLFML1
|
olfactomedin-like 1 |
| chr1_+_36396677 | 0.66 |
ENST00000373191.4
ENST00000397828.2 |
AGO3
|
argonaute RISC catalytic component 3 |
| chr2_+_55459495 | 0.64 |
ENST00000272317.6
ENST00000449323.1 |
RPS27A
|
ribosomal protein S27a |
| chr19_+_9361606 | 0.63 |
ENST00000456448.1
|
OR7E24
|
olfactory receptor, family 7, subfamily E, member 24 |
| chr1_-_13219581 | 0.63 |
ENST00000423177.1
|
PRAMEF26
|
PRAME family member 26 |
| chr22_+_27017921 | 0.60 |
ENST00000354760.3
|
CRYBA4
|
crystallin, beta A4 |
| chr15_-_34635314 | 0.60 |
ENST00000557912.1
ENST00000328848.4 |
NOP10
|
NOP10 ribonucleoprotein |
| chr7_-_2883928 | 0.60 |
ENST00000275364.3
|
GNA12
|
guanine nucleotide binding protein (G protein) alpha 12 |
| chr3_-_170626418 | 0.59 |
ENST00000474096.1
ENST00000295822.2 |
EIF5A2
|
eukaryotic translation initiation factor 5A2 |
| chr4_-_80247162 | 0.57 |
ENST00000286794.4
|
NAA11
|
N(alpha)-acetyltransferase 11, NatA catalytic subunit |
| chr21_-_15918618 | 0.57 |
ENST00000400564.1
ENST00000400566.1 |
SAMSN1
|
SAM domain, SH3 domain and nuclear localization signals 1 |
| chr4_+_156824840 | 0.56 |
ENST00000536354.2
|
TDO2
|
tryptophan 2,3-dioxygenase |
| chr12_+_11081828 | 0.53 |
ENST00000381847.3
ENST00000396400.3 |
PRH2
|
proline-rich protein HaeIII subfamily 2 |
| chr2_-_89545079 | 0.52 |
ENST00000468494.1
|
IGKV2-30
|
immunoglobulin kappa variable 2-30 |
| chr12_-_88535842 | 0.52 |
ENST00000550962.1
ENST00000552810.1 |
CEP290
|
centrosomal protein 290kDa |
| chr19_+_41257084 | 0.52 |
ENST00000601393.1
|
SNRPA
|
small nuclear ribonucleoprotein polypeptide A |
| chr13_+_28494130 | 0.51 |
ENST00000381033.4
|
PDX1
|
pancreatic and duodenal homeobox 1 |
| chr15_-_74501310 | 0.51 |
ENST00000423167.2
ENST00000432245.2 |
STRA6
|
stimulated by retinoic acid 6 |
| chr4_+_187148556 | 0.47 |
ENST00000264690.6
ENST00000446598.2 ENST00000414291.1 ENST00000513864.1 |
KLKB1
|
kallikrein B, plasma (Fletcher factor) 1 |
| chr16_+_66914264 | 0.46 |
ENST00000311765.2
ENST00000568869.1 ENST00000561704.1 ENST00000568398.1 ENST00000566776.1 |
PDP2
|
pyruvate dehyrogenase phosphatase catalytic subunit 2 |
| chr1_+_151020175 | 0.45 |
ENST00000368926.5
|
C1orf56
|
chromosome 1 open reading frame 56 |
| chr1_+_36396791 | 0.43 |
ENST00000246314.6
|
AGO3
|
argonaute RISC catalytic component 3 |
| chr8_-_20161466 | 0.39 |
ENST00000381569.1
|
LZTS1
|
leucine zipper, putative tumor suppressor 1 |
| chr13_+_73356197 | 0.37 |
ENST00000326291.6
|
PIBF1
|
progesterone immunomodulatory binding factor 1 |
| chr19_+_53868940 | 0.35 |
ENST00000474037.1
ENST00000491101.1 ENST00000467003.1 ENST00000475179.1 ENST00000593918.1 |
ZNF525
|
zinc finger protein 525 |
| chr8_-_72274095 | 0.34 |
ENST00000303824.7
|
EYA1
|
eyes absent homolog 1 (Drosophila) |
| chr12_+_133757995 | 0.33 |
ENST00000536435.2
ENST00000228289.5 ENST00000541211.2 ENST00000500625.3 ENST00000539248.2 ENST00000542711.2 ENST00000536899.2 ENST00000542986.2 ENST00000537565.1 ENST00000541975.2 |
ZNF268
|
zinc finger protein 268 |
Network of associatons between targets according to the STRING database.

First level regulatory network of TBX3
Gene Ontology Analysis
Gene overrepresentation in biological_process category:
| Log-likelihood per target | Total log-likelihood | Term | Description |
|---|---|---|---|
| 5.1 | 15.3 | GO:0006097 | glyoxylate cycle(GO:0006097) |
| 2.9 | 11.5 | GO:0035026 | leading edge cell differentiation(GO:0035026) |
| 2.2 | 8.7 | GO:0001971 | negative regulation of activation of membrane attack complex(GO:0001971) |
| 2.0 | 10.2 | GO:0001957 | intramembranous ossification(GO:0001957) direct ossification(GO:0036072) |
| 2.0 | 6.0 | GO:1904204 | regulation of skeletal muscle hypertrophy(GO:1904204) |
| 1.9 | 25.0 | GO:0035826 | rubidium ion transport(GO:0035826) regulation of rubidium ion transport(GO:2000680) |
| 1.9 | 5.7 | GO:0002384 | hepatic immune response(GO:0002384) response to prolactin(GO:1990637) regulation of STAT protein import into nucleus(GO:2000364) positive regulation of STAT protein import into nucleus(GO:2000366) |
| 1.7 | 5.2 | GO:0019482 | beta-alanine metabolic process(GO:0019482) |
| 1.2 | 4.9 | GO:0042360 | vitamin E metabolic process(GO:0042360) |
| 0.8 | 2.5 | GO:2000296 | negative regulation of hydrogen peroxide catabolic process(GO:2000296) |
| 0.8 | 2.5 | GO:0046521 | sphingoid catabolic process(GO:0046521) |
| 0.8 | 3.2 | GO:0046967 | cytosol to ER transport(GO:0046967) |
| 0.8 | 5.4 | GO:0019344 | cysteine biosynthetic process(GO:0019344) |
| 0.7 | 2.8 | GO:0046013 | regulation of T cell homeostatic proliferation(GO:0046013) |
| 0.7 | 1.4 | GO:0009093 | cysteine catabolic process(GO:0009093) L-cysteine catabolic process(GO:0019448) L-cysteine metabolic process(GO:0046439) |
| 0.7 | 4.0 | GO:0015811 | L-cystine transport(GO:0015811) |
| 0.6 | 2.5 | GO:0003331 | regulation of extracellular matrix constituent secretion(GO:0003330) positive regulation of extracellular matrix constituent secretion(GO:0003331) |
| 0.6 | 1.8 | GO:0048250 | mitochondrial iron ion transport(GO:0048250) |
| 0.6 | 1.7 | GO:0036378 | calcitriol biosynthetic process from calciol(GO:0036378) |
| 0.5 | 4.2 | GO:1900625 | regulation of monocyte aggregation(GO:1900623) positive regulation of monocyte aggregation(GO:1900625) |
| 0.5 | 0.5 | GO:0010157 | response to chlorate(GO:0010157) |
| 0.5 | 11.8 | GO:0032703 | negative regulation of interleukin-2 production(GO:0032703) |
| 0.5 | 1.5 | GO:0018894 | dibenzo-p-dioxin metabolic process(GO:0018894) cellular alkene metabolic process(GO:0043449) |
| 0.5 | 5.0 | GO:0043152 | induction of bacterial agglutination(GO:0043152) |
| 0.5 | 4.5 | GO:0072718 | response to cisplatin(GO:0072718) |
| 0.5 | 1.4 | GO:1902303 | regulation of heart rate by hormone(GO:0003064) negative regulation of potassium ion export(GO:1902303) |
| 0.5 | 1.8 | GO:2001153 | regulation of renal water transport(GO:2001151) positive regulation of renal water transport(GO:2001153) |
| 0.4 | 0.9 | GO:0035166 | post-embryonic hemopoiesis(GO:0035166) |
| 0.4 | 1.8 | GO:0048859 | formation of anatomical boundary(GO:0048859) |
| 0.4 | 31.6 | GO:0006910 | phagocytosis, recognition(GO:0006910) |
| 0.4 | 8.0 | GO:0043651 | linoleic acid metabolic process(GO:0043651) |
| 0.4 | 1.3 | GO:0070487 | positive regulation of vitamin metabolic process(GO:0046136) positive regulation of vitamin D biosynthetic process(GO:0060557) positive regulation of calcidiol 1-monooxygenase activity(GO:0060559) monocyte aggregation(GO:0070487) |
| 0.4 | 1.6 | GO:0007499 | ectoderm and mesoderm interaction(GO:0007499) |
| 0.4 | 1.8 | GO:0033274 | response to vitamin B2(GO:0033274) heterochromatin maintenance(GO:0070829) |
| 0.4 | 7.1 | GO:0090110 | cargo loading into COPII-coated vesicle(GO:0090110) |
| 0.3 | 1.3 | GO:0042320 | regulation of circadian sleep/wake cycle, REM sleep(GO:0042320) synaptic transmission involved in micturition(GO:0060084) |
| 0.3 | 3.1 | GO:0061179 | negative regulation of insulin secretion involved in cellular response to glucose stimulus(GO:0061179) |
| 0.3 | 7.7 | GO:0035455 | response to interferon-alpha(GO:0035455) |
| 0.3 | 0.9 | GO:0019287 | isopentenyl diphosphate biosynthetic process, mevalonate pathway(GO:0019287) |
| 0.3 | 1.5 | GO:0036115 | fatty-acyl-CoA catabolic process(GO:0036115) malonyl-CoA metabolic process(GO:2001293) |
| 0.3 | 1.8 | GO:0019249 | lactate biosynthetic process(GO:0019249) |
| 0.3 | 1.2 | GO:0018076 | N-terminal peptidyl-lysine acetylation(GO:0018076) |
| 0.3 | 1.2 | GO:0036229 | glutamine secretion(GO:0010585) L-glutamine import(GO:0036229) L-glutamine import into cell(GO:1903803) |
| 0.3 | 1.2 | GO:0001994 | norepinephrine-epinephrine vasoconstriction involved in regulation of systemic arterial blood pressure(GO:0001994) |
| 0.3 | 3.2 | GO:1901750 | leukotriene D4 metabolic process(GO:1901748) leukotriene D4 biosynthetic process(GO:1901750) |
| 0.3 | 1.1 | GO:0060010 | Sertoli cell fate commitment(GO:0060010) |
| 0.3 | 1.6 | GO:0070945 | neutrophil mediated killing of gram-negative bacterium(GO:0070945) |
| 0.3 | 4.7 | GO:0040015 | negative regulation of multicellular organism growth(GO:0040015) |
| 0.3 | 5.9 | GO:0030214 | hyaluronan catabolic process(GO:0030214) |
| 0.2 | 42.8 | GO:0002377 | immunoglobulin production(GO:0002377) |
| 0.2 | 1.7 | GO:0051458 | corticosterone secretion(GO:0035934) corticotropin secretion(GO:0051458) regulation of corticosterone secretion(GO:2000852) |
| 0.2 | 1.2 | GO:0048241 | epinephrine transport(GO:0048241) |
| 0.2 | 1.2 | GO:0035279 | mRNA cleavage involved in gene silencing by miRNA(GO:0035279) mRNA cleavage involved in gene silencing by siRNA(GO:0090625) mRNA cleavage involved in gene silencing(GO:0098795) |
| 0.2 | 1.9 | GO:0015705 | iodide transport(GO:0015705) |
| 0.2 | 0.7 | GO:0045897 | positive regulation of transcription during mitosis(GO:0045897) |
| 0.2 | 1.1 | GO:2000809 | positive regulation of synaptic vesicle clustering(GO:2000809) |
| 0.2 | 2.6 | GO:0090091 | collagen-activated tyrosine kinase receptor signaling pathway(GO:0038063) positive regulation of extracellular matrix disassembly(GO:0090091) |
| 0.2 | 0.8 | GO:0086097 | phospholipase C-activating angiotensin-activated signaling pathway(GO:0086097) |
| 0.2 | 2.7 | GO:0010668 | ectodermal cell differentiation(GO:0010668) |
| 0.2 | 0.6 | GO:0019442 | tryptophan catabolic process to acetyl-CoA(GO:0019442) |
| 0.2 | 2.9 | GO:0071600 | otic vesicle morphogenesis(GO:0071600) |
| 0.2 | 1.4 | GO:0031666 | positive regulation of lipopolysaccharide-mediated signaling pathway(GO:0031666) |
| 0.2 | 0.8 | GO:0046340 | diacylglycerol catabolic process(GO:0046340) |
| 0.2 | 0.5 | GO:0002541 | activation of plasma proteins involved in acute inflammatory response(GO:0002541) |
| 0.2 | 3.1 | GO:0005513 | detection of calcium ion(GO:0005513) |
| 0.1 | 4.9 | GO:0071498 | cellular response to fluid shear stress(GO:0071498) |
| 0.1 | 2.3 | GO:0051639 | actin filament network formation(GO:0051639) |
| 0.1 | 0.7 | GO:0015824 | proline transport(GO:0015824) |
| 0.1 | 0.6 | GO:0030920 | N-terminal peptidyl-serine acetylation(GO:0017198) N-terminal peptidyl-glutamic acid acetylation(GO:0018002) peptidyl-serine acetylation(GO:0030920) |
| 0.1 | 6.4 | GO:0001958 | endochondral ossification(GO:0001958) replacement ossification(GO:0036075) |
| 0.1 | 2.6 | GO:0016973 | poly(A)+ mRNA export from nucleus(GO:0016973) |
| 0.1 | 3.7 | GO:1901685 | glutathione derivative metabolic process(GO:1901685) glutathione derivative biosynthetic process(GO:1901687) |
| 0.1 | 0.6 | GO:0031120 | snRNA pseudouridine synthesis(GO:0031120) |
| 0.1 | 1.4 | GO:0031274 | positive regulation of pseudopodium assembly(GO:0031274) |
| 0.1 | 4.1 | GO:0045730 | respiratory burst(GO:0045730) |
| 0.1 | 0.9 | GO:0008343 | adult feeding behavior(GO:0008343) |
| 0.1 | 0.9 | GO:0001574 | ganglioside biosynthetic process(GO:0001574) |
| 0.1 | 9.9 | GO:0042246 | tissue regeneration(GO:0042246) |
| 0.1 | 1.2 | GO:0034472 | snRNA 3'-end processing(GO:0034472) |
| 0.1 | 6.2 | GO:0090502 | RNA phosphodiester bond hydrolysis, endonucleolytic(GO:0090502) |
| 0.1 | 2.3 | GO:2001044 | regulation of integrin-mediated signaling pathway(GO:2001044) |
| 0.1 | 1.1 | GO:0070307 | lens fiber cell development(GO:0070307) |
| 0.1 | 2.4 | GO:0030252 | growth hormone secretion(GO:0030252) |
| 0.1 | 0.4 | GO:0031392 | regulation of prostaglandin biosynthetic process(GO:0031392) negative regulation of natural killer cell activation(GO:0032815) regulation of unsaturated fatty acid biosynthetic process(GO:2001279) |
| 0.1 | 0.7 | GO:0070995 | NADPH oxidation(GO:0070995) |
| 0.1 | 5.7 | GO:0009250 | glycogen biosynthetic process(GO:0005978) glucan biosynthetic process(GO:0009250) |
| 0.1 | 1.5 | GO:0006743 | ubiquinone metabolic process(GO:0006743) ubiquinone biosynthetic process(GO:0006744) quinone biosynthetic process(GO:1901663) |
| 0.1 | 2.5 | GO:0002026 | regulation of the force of heart contraction(GO:0002026) |
| 0.1 | 0.7 | GO:0018344 | protein geranylgeranylation(GO:0018344) |
| 0.1 | 1.5 | GO:0097503 | sialylation(GO:0097503) |
| 0.1 | 0.6 | GO:0045905 | translational frameshifting(GO:0006452) positive regulation of translational termination(GO:0045905) |
| 0.1 | 10.0 | GO:0031424 | keratinization(GO:0031424) |
| 0.1 | 2.1 | GO:0048485 | sympathetic nervous system development(GO:0048485) |
| 0.1 | 0.2 | GO:0051344 | regulation of cyclic-nucleotide phosphodiesterase activity(GO:0051342) negative regulation of cyclic-nucleotide phosphodiesterase activity(GO:0051344) |
| 0.1 | 0.1 | GO:0014057 | acetylcholine secretion, neurotransmission(GO:0014055) regulation of acetylcholine secretion, neurotransmission(GO:0014056) positive regulation of acetylcholine secretion, neurotransmission(GO:0014057) |
| 0.1 | 2.0 | GO:0060216 | definitive hemopoiesis(GO:0060216) |
| 0.1 | 1.4 | GO:0060397 | JAK-STAT cascade involved in growth hormone signaling pathway(GO:0060397) |
| 0.1 | 2.0 | GO:0042462 | eye photoreceptor cell development(GO:0042462) |
| 0.0 | 0.1 | GO:0002589 | regulation of antigen processing and presentation of peptide antigen via MHC class I(GO:0002589) negative regulation of antigen processing and presentation of peptide antigen via MHC class I(GO:0002590) regulation of T cell antigen processing and presentation(GO:0002625) positive regulation of iron ion transport(GO:0034758) positive regulation of iron ion transmembrane transport(GO:0034761) regulation of iron ion import(GO:1900390) regulation of ferrous iron import into cell(GO:1903989) positive regulation of ferrous iron import into cell(GO:1903991) regulation of ferrous iron binding(GO:1904432) positive regulation of ferrous iron binding(GO:1904434) regulation of transferrin receptor binding(GO:1904435) positive regulation of transferrin receptor binding(GO:1904437) regulation of ferrous iron import across plasma membrane(GO:1904438) positive regulation of ferrous iron import across plasma membrane(GO:1904440) response to iron ion starvation(GO:1990641) |
| 0.0 | 3.2 | GO:0030032 | lamellipodium assembly(GO:0030032) |
| 0.0 | 1.8 | GO:0018279 | protein N-linked glycosylation via asparagine(GO:0018279) |
| 0.0 | 1.5 | GO:0006607 | NLS-bearing protein import into nucleus(GO:0006607) |
| 0.0 | 2.5 | GO:0021795 | cerebral cortex cell migration(GO:0021795) |
| 0.0 | 5.2 | GO:1902600 | hydrogen ion transmembrane transport(GO:1902600) |
| 0.0 | 1.5 | GO:0007205 | protein kinase C-activating G-protein coupled receptor signaling pathway(GO:0007205) |
| 0.0 | 1.9 | GO:0006363 | termination of RNA polymerase I transcription(GO:0006363) |
| 0.0 | 0.2 | GO:0051552 | flavone metabolic process(GO:0051552) |
| 0.0 | 3.3 | GO:0006890 | retrograde vesicle-mediated transport, Golgi to ER(GO:0006890) |
| 0.0 | 1.0 | GO:0016338 | calcium-independent cell-cell adhesion via plasma membrane cell-adhesion molecules(GO:0016338) |
| 0.0 | 3.1 | GO:0006958 | complement activation, classical pathway(GO:0006958) |
| 0.0 | 1.6 | GO:0050911 | detection of chemical stimulus involved in sensory perception of smell(GO:0050911) |
| 0.0 | 3.7 | GO:0007224 | smoothened signaling pathway(GO:0007224) |
| 0.0 | 0.6 | GO:0010762 | regulation of fibroblast migration(GO:0010762) |
| 0.0 | 0.2 | GO:0006531 | aspartate metabolic process(GO:0006531) |
| 0.0 | 0.2 | GO:0031936 | negative regulation of chromatin silencing(GO:0031936) |
| 0.0 | 0.6 | GO:0050869 | negative regulation of B cell activation(GO:0050869) |
| 0.0 | 0.5 | GO:0010510 | regulation of acetyl-CoA biosynthetic process from pyruvate(GO:0010510) |
| 0.0 | 0.1 | GO:0097527 | necroptotic signaling pathway(GO:0097527) |
| 0.0 | 0.3 | GO:0090557 | establishment of endothelial intestinal barrier(GO:0090557) |
| 0.0 | 0.8 | GO:0015721 | bile acid and bile salt transport(GO:0015721) |
| 0.0 | 0.4 | GO:0016242 | negative regulation of macroautophagy(GO:0016242) |
| 0.0 | 3.5 | GO:0060271 | cilium morphogenesis(GO:0060271) |
| 0.0 | 1.2 | GO:0050918 | positive chemotaxis(GO:0050918) |
| 0.0 | 0.0 | GO:0031547 | brain-derived neurotrophic factor receptor signaling pathway(GO:0031547) regulation of brain-derived neurotrophic factor receptor signaling pathway(GO:0031548) |
| 0.0 | 1.2 | GO:0002062 | chondrocyte differentiation(GO:0002062) |
| 0.0 | 3.1 | GO:0007162 | negative regulation of cell adhesion(GO:0007162) |
Gene overrepresentation in cellular_component category:
| Log-likelihood per target | Total log-likelihood | Term | Description |
|---|---|---|---|
| 2.1 | 25.0 | GO:0097487 | multivesicular body, internal vesicle(GO:0097487) |
| 1.6 | 6.4 | GO:0005600 | collagen type XIII trimer(GO:0005600) transmembrane collagen trimer(GO:0030936) |
| 1.5 | 4.5 | GO:0090498 | extrinsic component of Golgi membrane(GO:0090498) |
| 1.4 | 5.7 | GO:0005896 | interleukin-6 receptor complex(GO:0005896) |
| 1.3 | 11.5 | GO:0070022 | transforming growth factor beta receptor homodimeric complex(GO:0070022) |
| 0.7 | 6.0 | GO:0042567 | insulin-like growth factor ternary complex(GO:0042567) |
| 0.6 | 2.5 | GO:0031838 | haptoglobin-hemoglobin complex(GO:0031838) |
| 0.6 | 31.6 | GO:0042571 | immunoglobulin complex, circulating(GO:0042571) |
| 0.6 | 4.2 | GO:0035692 | macrophage migration inhibitory factor receptor complex(GO:0035692) |
| 0.5 | 8.7 | GO:0031362 | anchored component of external side of plasma membrane(GO:0031362) |
| 0.5 | 3.2 | GO:0042825 | TAP complex(GO:0042825) |
| 0.5 | 2.6 | GO:0042272 | nuclear RNA export factor complex(GO:0042272) |
| 0.5 | 4.1 | GO:0032010 | phagolysosome(GO:0032010) |
| 0.5 | 4.0 | GO:1990111 | spermatoproteasome complex(GO:1990111) |
| 0.4 | 5.4 | GO:0036038 | MKS complex(GO:0036038) |
| 0.4 | 5.0 | GO:0005577 | fibrinogen complex(GO:0005577) |
| 0.3 | 3.3 | GO:0030126 | COPI vesicle coat(GO:0030126) |
| 0.3 | 7.1 | GO:0030127 | COPII vesicle coat(GO:0030127) |
| 0.3 | 17.8 | GO:0031907 | peroxisomal matrix(GO:0005782) microbody lumen(GO:0031907) |
| 0.3 | 5.2 | GO:0045277 | respiratory chain complex IV(GO:0045277) |
| 0.3 | 1.4 | GO:1902937 | inward rectifier potassium channel complex(GO:1902937) |
| 0.2 | 6.3 | GO:0034451 | centriolar satellite(GO:0034451) |
| 0.2 | 0.7 | GO:0005968 | Rab-protein geranylgeranyltransferase complex(GO:0005968) |
| 0.2 | 1.5 | GO:0072687 | meiotic spindle(GO:0072687) |
| 0.2 | 6.7 | GO:0045095 | keratin filament(GO:0045095) |
| 0.1 | 1.2 | GO:0032039 | integrator complex(GO:0032039) |
| 0.1 | 1.2 | GO:0035068 | micro-ribonucleoprotein complex(GO:0035068) |
| 0.1 | 2.3 | GO:0031254 | uropod(GO:0001931) cell trailing edge(GO:0031254) |
| 0.1 | 1.9 | GO:0005736 | DNA-directed RNA polymerase I complex(GO:0005736) |
| 0.1 | 0.6 | GO:0031429 | box H/ACA snoRNP complex(GO:0031429) box H/ACA RNP complex(GO:0072588) box H/ACA scaRNP complex(GO:0072589) box H/ACA telomerase RNP complex(GO:0090661) |
| 0.1 | 2.0 | GO:0043205 | microfibril(GO:0001527) fibril(GO:0043205) |
| 0.1 | 1.1 | GO:0016342 | catenin complex(GO:0016342) |
| 0.1 | 0.6 | GO:0031415 | NatA complex(GO:0031415) |
| 0.1 | 7.7 | GO:0031902 | late endosome membrane(GO:0031902) |
| 0.1 | 4.7 | GO:0035578 | azurophil granule lumen(GO:0035578) |
| 0.1 | 1.3 | GO:0005892 | acetylcholine-gated channel complex(GO:0005892) |
| 0.1 | 3.6 | GO:0005882 | intermediate filament(GO:0005882) |
| 0.1 | 2.0 | GO:0032391 | photoreceptor connecting cilium(GO:0032391) |
| 0.0 | 82.2 | GO:0005615 | extracellular space(GO:0005615) |
| 0.0 | 1.4 | GO:0031904 | endosome lumen(GO:0031904) |
| 0.0 | 2.1 | GO:0031526 | brush border membrane(GO:0031526) |
| 0.0 | 2.5 | GO:0031672 | A band(GO:0031672) |
| 0.0 | 0.2 | GO:0031314 | extrinsic component of mitochondrial inner membrane(GO:0031314) |
| 0.0 | 2.5 | GO:0005930 | axoneme(GO:0005930) ciliary plasm(GO:0097014) |
| 0.0 | 3.2 | GO:0097517 | stress fiber(GO:0001725) contractile actin filament bundle(GO:0097517) |
| 0.0 | 3.1 | GO:0008076 | voltage-gated potassium channel complex(GO:0008076) potassium channel complex(GO:0034705) |
| 0.0 | 1.8 | GO:0045202 | synapse(GO:0045202) |
| 0.0 | 1.6 | GO:0005791 | rough endoplasmic reticulum(GO:0005791) |
| 0.0 | 2.1 | GO:0031225 | anchored component of membrane(GO:0031225) |
| 0.0 | 2.5 | GO:0005741 | mitochondrial outer membrane(GO:0005741) |
| 0.0 | 1.8 | GO:0032587 | ruffle membrane(GO:0032587) |
| 0.0 | 0.9 | GO:0016459 | myosin complex(GO:0016459) |
| 0.0 | 1.8 | GO:0031514 | motile cilium(GO:0031514) |
| 0.0 | 0.8 | GO:0005902 | microvillus(GO:0005902) |
| 0.0 | 1.8 | GO:0005643 | nuclear pore(GO:0005643) |
| 0.0 | 0.5 | GO:0005685 | U1 snRNP(GO:0005685) |
| 0.0 | 0.8 | GO:0005901 | caveola(GO:0005901) |
| 0.0 | 1.2 | GO:0032993 | protein-DNA complex(GO:0032993) |
| 0.0 | 1.4 | GO:0005923 | bicellular tight junction(GO:0005923) occluding junction(GO:0070160) |
| 0.0 | 0.3 | GO:0031265 | CD95 death-inducing signaling complex(GO:0031265) |
| 0.0 | 1.5 | GO:1904813 | ficolin-1-rich granule(GO:0101002) ficolin-1-rich granule lumen(GO:1904813) |
| 0.0 | 1.0 | GO:0030027 | lamellipodium(GO:0030027) |
| 0.0 | 0.6 | GO:0001726 | ruffle(GO:0001726) |
| 0.0 | 2.8 | GO:0016324 | apical plasma membrane(GO:0016324) |
| 0.0 | 26.0 | GO:0070062 | extracellular exosome(GO:0070062) |
Gene overrepresentation in molecular_function category:
| Log-likelihood per target | Total log-likelihood | Term | Description |
|---|---|---|---|
| 5.1 | 15.3 | GO:0004450 | isocitrate dehydrogenase (NADP+) activity(GO:0004450) |
| 1.0 | 6.2 | GO:0004522 | ribonuclease A activity(GO:0004522) |
| 0.8 | 2.3 | GO:0050135 | NAD+ nucleosidase activity(GO:0003953) NAD(P)+ nucleosidase activity(GO:0050135) |
| 0.7 | 4.0 | GO:0015184 | L-cystine transmembrane transporter activity(GO:0015184) |
| 0.6 | 3.2 | GO:0070576 | vitamin D 24-hydroxylase activity(GO:0070576) |
| 0.6 | 2.5 | GO:0032038 | myosin II heavy chain binding(GO:0032038) |
| 0.6 | 5.7 | GO:0005138 | interleukin-6 receptor binding(GO:0005138) |
| 0.6 | 8.6 | GO:0036374 | glutathione hydrolase activity(GO:0036374) |
| 0.6 | 31.6 | GO:0034987 | immunoglobulin receptor binding(GO:0034987) |
| 0.5 | 6.0 | GO:0031995 | insulin-like growth factor II binding(GO:0031995) |
| 0.5 | 3.2 | GO:0046979 | TAP2 binding(GO:0046979) |
| 0.5 | 11.5 | GO:0035615 | clathrin adaptor activity(GO:0035615) endocytic adaptor activity(GO:0098748) |
| 0.5 | 2.6 | GO:0038062 | protein tyrosine kinase collagen receptor activity(GO:0038062) |
| 0.5 | 1.5 | GO:0001665 | alpha-N-acetylgalactosaminide alpha-2,6-sialyltransferase activity(GO:0001665) |
| 0.5 | 1.5 | GO:0004947 | bradykinin receptor activity(GO:0004947) |
| 0.4 | 3.1 | GO:0017077 | oxidative phosphorylation uncoupler activity(GO:0017077) |
| 0.4 | 2.5 | GO:0030492 | hemoglobin binding(GO:0030492) |
| 0.4 | 2.5 | GO:0008481 | sphinganine kinase activity(GO:0008481) D-erythro-sphingosine kinase activity(GO:0017050) |
| 0.4 | 4.1 | GO:0016176 | superoxide-generating NADPH oxidase activator activity(GO:0016176) |
| 0.4 | 1.2 | GO:0004937 | alpha1-adrenergic receptor activity(GO:0004937) |
| 0.4 | 1.5 | GO:0008466 | glycogenin glucosyltransferase activity(GO:0008466) |
| 0.4 | 1.8 | GO:0004489 | methylenetetrahydrofolate reductase (NAD(P)H) activity(GO:0004489) |
| 0.4 | 2.1 | GO:0008046 | axon guidance receptor activity(GO:0008046) |
| 0.3 | 1.7 | GO:0015056 | corticotrophin-releasing factor receptor activity(GO:0015056) |
| 0.3 | 1.8 | GO:0042577 | lipid phosphatase activity(GO:0042577) |
| 0.3 | 1.2 | GO:0005277 | acetylcholine transmembrane transporter activity(GO:0005277) secondary active organic cation transmembrane transporter activity(GO:0008513) acetate ester transmembrane transporter activity(GO:1901375) |
| 0.3 | 0.8 | GO:0033878 | hormone-sensitive lipase activity(GO:0033878) |
| 0.3 | 8.0 | GO:0004602 | glutathione peroxidase activity(GO:0004602) |
| 0.3 | 0.8 | GO:0001596 | angiotensin type I receptor activity(GO:0001596) |
| 0.3 | 1.8 | GO:0004457 | lactate dehydrogenase activity(GO:0004457) L-lactate dehydrogenase activity(GO:0004459) |
| 0.2 | 8.7 | GO:0001848 | complement binding(GO:0001848) |
| 0.2 | 1.2 | GO:0004468 | lysine N-acetyltransferase activity, acting on acetyl phosphate as donor(GO:0004468) |
| 0.2 | 1.4 | GO:0000155 | phosphorelay sensor kinase activity(GO:0000155) |
| 0.2 | 1.2 | GO:0015186 | L-glutamine transmembrane transporter activity(GO:0015186) |
| 0.2 | 40.3 | GO:0003823 | antigen binding(GO:0003823) |
| 0.2 | 1.8 | GO:0004873 | asialoglycoprotein receptor activity(GO:0004873) |
| 0.2 | 1.4 | GO:0001515 | opioid peptide activity(GO:0001515) |
| 0.2 | 0.8 | GO:0008508 | bile acid:sodium symporter activity(GO:0008508) |
| 0.2 | 0.6 | GO:0004833 | tryptophan 2,3-dioxygenase activity(GO:0004833) |
| 0.2 | 5.4 | GO:0005540 | hyaluronic acid binding(GO:0005540) |
| 0.2 | 5.2 | GO:0015002 | cytochrome-c oxidase activity(GO:0004129) heme-copper terminal oxidase activity(GO:0015002) oxidoreductase activity, acting on a heme group of donors, oxygen as acceptor(GO:0016676) |
| 0.2 | 4.5 | GO:0001965 | G-protein alpha-subunit binding(GO:0001965) |
| 0.1 | 0.6 | GO:1990190 | peptide-glutamate-N-acetyltransferase activity(GO:1990190) |
| 0.1 | 1.1 | GO:0044323 | retinoic acid-responsive element binding(GO:0044323) |
| 0.1 | 4.0 | GO:0004298 | threonine-type endopeptidase activity(GO:0004298) threonine-type peptidase activity(GO:0070003) |
| 0.1 | 1.7 | GO:0051011 | microtubule minus-end binding(GO:0051011) |
| 0.1 | 27.1 | GO:0004252 | serine-type endopeptidase activity(GO:0004252) |
| 0.1 | 0.9 | GO:0003828 | alpha-N-acetylneuraminate alpha-2,8-sialyltransferase activity(GO:0003828) |
| 0.1 | 1.6 | GO:0097371 | MDM2/MDM4 family protein binding(GO:0097371) |
| 0.1 | 3.1 | GO:0015269 | calcium-activated potassium channel activity(GO:0015269) |
| 0.1 | 1.8 | GO:0005381 | iron ion transmembrane transporter activity(GO:0005381) |
| 0.1 | 2.4 | GO:0005024 | transforming growth factor beta-activated receptor activity(GO:0005024) |
| 0.1 | 3.7 | GO:0004364 | glutathione transferase activity(GO:0004364) |
| 0.1 | 1.9 | GO:0001054 | RNA polymerase I activity(GO:0001054) |
| 0.1 | 3.0 | GO:0005031 | tumor necrosis factor-activated receptor activity(GO:0005031) death receptor activity(GO:0005035) |
| 0.1 | 0.6 | GO:0034513 | box H/ACA snoRNA binding(GO:0034513) |
| 0.1 | 0.3 | GO:0015361 | low-affinity sodium:dicarboxylate symporter activity(GO:0015361) |
| 0.1 | 7.1 | GO:0048306 | calcium-dependent protein binding(GO:0048306) |
| 0.1 | 1.1 | GO:0045294 | alpha-catenin binding(GO:0045294) |
| 0.1 | 2.5 | GO:0004181 | metallocarboxypeptidase activity(GO:0004181) |
| 0.1 | 6.9 | GO:0005201 | extracellular matrix structural constituent(GO:0005201) |
| 0.1 | 0.5 | GO:0004741 | [pyruvate dehydrogenase (lipoamide)] phosphatase activity(GO:0004741) |
| 0.1 | 0.7 | GO:0004499 | N,N-dimethylaniline monooxygenase activity(GO:0004499) |
| 0.1 | 0.5 | GO:0035614 | snRNA stem-loop binding(GO:0035614) |
| 0.1 | 1.3 | GO:0005149 | interleukin-1 receptor binding(GO:0005149) |
| 0.1 | 0.3 | GO:0000405 | bubble DNA binding(GO:0000405) |
| 0.1 | 1.4 | GO:0008483 | transaminase activity(GO:0008483) |
| 0.1 | 2.3 | GO:0003785 | actin monomer binding(GO:0003785) |
| 0.1 | 1.7 | GO:0005212 | structural constituent of eye lens(GO:0005212) |
| 0.1 | 1.3 | GO:0022848 | acetylcholine-gated cation channel activity(GO:0022848) |
| 0.1 | 1.2 | GO:0035198 | miRNA binding(GO:0035198) |
| 0.0 | 5.5 | GO:0005179 | hormone activity(GO:0005179) |
| 0.0 | 1.5 | GO:0016709 | oxidoreductase activity, acting on paired donors, with incorporation or reduction of molecular oxygen, NAD(P)H as one donor, and incorporation of one atom of oxygen(GO:0016709) |
| 0.0 | 1.2 | GO:0008139 | nuclear localization sequence binding(GO:0008139) |
| 0.0 | 1.8 | GO:0005160 | transforming growth factor beta receptor binding(GO:0005160) |
| 0.0 | 1.2 | GO:0042056 | chemoattractant activity(GO:0042056) |
| 0.0 | 0.7 | GO:0005328 | neurotransmitter:sodium symporter activity(GO:0005328) |
| 0.0 | 1.0 | GO:0008188 | neuropeptide receptor activity(GO:0008188) |
| 0.0 | 1.6 | GO:0004984 | olfactory receptor activity(GO:0004984) |
| 0.0 | 0.7 | GO:0005092 | GDP-dissociation inhibitor activity(GO:0005092) |
| 0.0 | 0.7 | GO:0042288 | MHC class I protein binding(GO:0042288) |
| 0.0 | 3.1 | GO:0016811 | hydrolase activity, acting on carbon-nitrogen (but not peptide) bonds, in linear amides(GO:0016811) |
| 0.0 | 1.5 | GO:0016831 | carboxy-lyase activity(GO:0016831) |
| 0.0 | 2.6 | GO:0004553 | hydrolase activity, hydrolyzing O-glycosyl compounds(GO:0004553) |
| 0.0 | 0.9 | GO:0000146 | microfilament motor activity(GO:0000146) |
| 0.0 | 0.6 | GO:0003746 | translation elongation factor activity(GO:0003746) |
| 0.0 | 0.6 | GO:0050780 | dopamine receptor binding(GO:0050780) |
| 0.0 | 0.2 | GO:0031545 | peptidyl-proline 4-dioxygenase activity(GO:0031545) |
| 0.0 | 1.5 | GO:0097110 | scaffold protein binding(GO:0097110) |
| 0.0 | 1.8 | GO:0005525 | GTP binding(GO:0005525) |
| 0.0 | 0.1 | GO:0004126 | cytidine deaminase activity(GO:0004126) |
| 0.0 | 2.7 | GO:0008201 | heparin binding(GO:0008201) |
| 0.0 | 0.2 | GO:0030280 | structural constituent of epidermis(GO:0030280) |
| 0.0 | 0.2 | GO:0005131 | growth hormone receptor binding(GO:0005131) |
| 0.0 | 0.0 | GO:0005169 | neurotrophin TRKB receptor binding(GO:0005169) |
| 0.0 | 0.2 | GO:0017017 | MAP kinase tyrosine/serine/threonine phosphatase activity(GO:0017017) |
| 0.0 | 1.0 | GO:0001618 | virus receptor activity(GO:0001618) |
| 0.0 | 0.2 | GO:0016641 | oxidoreductase activity, acting on the CH-NH2 group of donors, oxygen as acceptor(GO:0016641) |
| 0.0 | 0.6 | GO:0001784 | phosphotyrosine binding(GO:0001784) |
Gene overrepresentation in C2:CP category:
| Log-likelihood per target | Total log-likelihood | Term | Description |
|---|---|---|---|
| 0.3 | 5.7 | ST STAT3 PATHWAY | STAT3 Pathway |
| 0.3 | 14.4 | PID AVB3 OPN PATHWAY | Osteopontin-mediated events |
| 0.1 | 6.4 | NABA COLLAGENS | Genes encoding collagen proteins |
| 0.1 | 11.5 | PID TGFBR PATHWAY | TGF-beta receptor signaling |
| 0.1 | 7.5 | PID INTEGRIN3 PATHWAY | Beta3 integrin cell surface interactions |
| 0.1 | 3.1 | PID INTEGRIN1 PATHWAY | Beta1 integrin cell surface interactions |
| 0.1 | 1.3 | SA MMP CYTOKINE CONNECTION | Cytokines can induce activation of matrix metalloproteinases, which degrade extracellular matrix. |
| 0.1 | 2.3 | PID RETINOIC ACID PATHWAY | Retinoic acid receptors-mediated signaling |
| 0.1 | 4.1 | PID RAC1 PATHWAY | RAC1 signaling pathway |
| 0.0 | 9.2 | NABA ECM GLYCOPROTEINS | Genes encoding structural ECM glycoproteins |
| 0.0 | 3.6 | PID HNF3B PATHWAY | FOXA2 and FOXA3 transcription factor networks |
| 0.0 | 0.6 | PID S1P S1P4 PATHWAY | S1P4 pathway |
| 0.0 | 1.1 | PID NCADHERIN PATHWAY | N-cadherin signaling events |
| 0.0 | 1.9 | PID TAP63 PATHWAY | Validated transcriptional targets of TAp63 isoforms |
| 0.0 | 0.2 | ST IL 13 PATHWAY | Interleukin 13 (IL-13) Pathway |
| 0.0 | 0.8 | PID ARF6 TRAFFICKING PATHWAY | Arf6 trafficking events |
Gene overrepresentation in C2:CP:REACTOME category:
| Log-likelihood per target | Total log-likelihood | Term | Description |
|---|---|---|---|
| 0.6 | 11.5 | REACTOME GAP JUNCTION DEGRADATION | Genes involved in Gap junction degradation |
| 0.6 | 16.2 | REACTOME REGULATION OF INSULIN LIKE GROWTH FACTOR IGF ACTIVITY BY INSULIN LIKE GROWTH FACTOR BINDING PROTEINS IGFBPS | Genes involved in Regulation of Insulin-like Growth Factor (IGF) Activity by Insulin-like Growth Factor Binding Proteins (IGFBPs) |
| 0.5 | 10.1 | REACTOME HYALURONAN UPTAKE AND DEGRADATION | Genes involved in Hyaluronan uptake and degradation |
| 0.5 | 17.1 | REACTOME GLUTATHIONE CONJUGATION | Genes involved in Glutathione conjugation |
| 0.4 | 14.7 | REACTOME PEROXISOMAL LIPID METABOLISM | Genes involved in Peroxisomal lipid metabolism |
| 0.4 | 5.2 | REACTOME PYRIMIDINE CATABOLISM | Genes involved in Pyrimidine catabolism |
| 0.3 | 5.0 | REACTOME COMMON PATHWAY | Genes involved in Common Pathway |
| 0.3 | 5.8 | REACTOME IL 6 SIGNALING | Genes involved in Interleukin-6 signaling |
| 0.3 | 10.3 | REACTOME ANTIGEN PRESENTATION FOLDING ASSEMBLY AND PEPTIDE LOADING OF CLASS I MHC | Genes involved in Antigen Presentation: Folding, assembly and peptide loading of class I MHC |
| 0.2 | 7.5 | REACTOME RNA POL I TRANSCRIPTION TERMINATION | Genes involved in RNA Polymerase I Transcription Termination |
| 0.2 | 4.9 | REACTOME HDL MEDIATED LIPID TRANSPORT | Genes involved in HDL-mediated lipid transport |
| 0.2 | 3.2 | REACTOME XENOBIOTICS | Genes involved in Xenobiotics |
| 0.2 | 25.0 | REACTOME RESPONSE TO ELEVATED PLATELET CYTOSOLIC CA2 | Genes involved in Response to elevated platelet cytosolic Ca2+ |
| 0.2 | 1.7 | REACTOME MEMBRANE BINDING AND TARGETTING OF GAG PROTEINS | Genes involved in Membrane binding and targetting of GAG proteins |
| 0.1 | 5.9 | REACTOME AMINO ACID TRANSPORT ACROSS THE PLASMA MEMBRANE | Genes involved in Amino acid transport across the plasma membrane |
| 0.1 | 6.4 | REACTOME COLLAGEN FORMATION | Genes involved in Collagen formation |
| 0.1 | 3.2 | REACTOME DCC MEDIATED ATTRACTIVE SIGNALING | Genes involved in DCC mediated attractive signaling |
| 0.1 | 1.2 | REACTOME ABACAVIR TRANSPORT AND METABOLISM | Genes involved in Abacavir transport and metabolism |
| 0.1 | 1.2 | REACTOME TRAF3 DEPENDENT IRF ACTIVATION PATHWAY | Genes involved in TRAF3-dependent IRF activation pathway |
| 0.1 | 6.6 | REACTOME INTERFERON ALPHA BETA SIGNALING | Genes involved in Interferon alpha/beta signaling |
| 0.1 | 1.3 | REACTOME PRESYNAPTIC NICOTINIC ACETYLCHOLINE RECEPTORS | Genes involved in Presynaptic nicotinic acetylcholine receptors |
| 0.1 | 3.1 | REACTOME CGMP EFFECTS | Genes involved in cGMP effects |
| 0.1 | 2.5 | REACTOME ASSOCIATION OF TRIC CCT WITH TARGET PROTEINS DURING BIOSYNTHESIS | Genes involved in Association of TriC/CCT with target proteins during biosynthesis |
| 0.1 | 1.5 | REACTOME GLYCOGEN BREAKDOWN GLYCOGENOLYSIS | Genes involved in Glycogen breakdown (glycogenolysis) |
| 0.1 | 1.4 | REACTOME PROLACTIN RECEPTOR SIGNALING | Genes involved in Prolactin receptor signaling |
| 0.1 | 0.8 | REACTOME RECYCLING OF BILE ACIDS AND SALTS | Genes involved in Recycling of bile acids and salts |
| 0.0 | 4.7 | REACTOME CELL SURFACE INTERACTIONS AT THE VASCULAR WALL | Genes involved in Cell surface interactions at the vascular wall |
| 0.0 | 0.9 | REACTOME N GLYCAN ANTENNAE ELONGATION | Genes involved in N-Glycan antennae elongation |
| 0.0 | 3.6 | REACTOME ANTIGEN PROCESSING CROSS PRESENTATION | Genes involved in Antigen processing-Cross presentation |
| 0.0 | 0.6 | REACTOME TRYPTOPHAN CATABOLISM | Genes involved in Tryptophan catabolism |
| 0.0 | 1.3 | REACTOME ADHERENS JUNCTIONS INTERACTIONS | Genes involved in Adherens junctions interactions |
| 0.0 | 0.5 | REACTOME INTRINSIC PATHWAY | Genes involved in Intrinsic Pathway |
| 0.0 | 0.7 | REACTOME TERMINATION OF O GLYCAN BIOSYNTHESIS | Genes involved in Termination of O-glycan biosynthesis |
| 0.0 | 2.5 | REACTOME STRIATED MUSCLE CONTRACTION | Genes involved in Striated Muscle Contraction |
| 0.0 | 2.6 | REACTOME GLUCOSE METABOLISM | Genes involved in Glucose metabolism |
| 0.0 | 0.8 | REACTOME HORMONE SENSITIVE LIPASE HSL MEDIATED TRIACYLGLYCEROL HYDROLYSIS | Genes involved in Hormone-sensitive lipase (HSL)-mediated triacylglycerol hydrolysis |
| 0.0 | 1.3 | REACTOME IL1 SIGNALING | Genes involved in Interleukin-1 signaling |
| 0.0 | 0.4 | REACTOME RNA POL III CHAIN ELONGATION | Genes involved in RNA Polymerase III Chain Elongation |
| 0.0 | 0.9 | REACTOME CHOLESTEROL BIOSYNTHESIS | Genes involved in Cholesterol biosynthesis |
| 0.0 | 1.4 | REACTOME VOLTAGE GATED POTASSIUM CHANNELS | Genes involved in Voltage gated Potassium channels |
| 0.0 | 1.0 | REACTOME TIGHT JUNCTION INTERACTIONS | Genes involved in Tight junction interactions |
| 0.0 | 0.3 | REACTOME BILE SALT AND ORGANIC ANION SLC TRANSPORTERS | Genes involved in Bile salt and organic anion SLC transporters |
| 0.0 | 1.8 | REACTOME METABOLISM OF VITAMINS AND COFACTORS | Genes involved in Metabolism of vitamins and cofactors |
| 0.0 | 0.5 | REACTOME REGULATION OF PYRUVATE DEHYDROGENASE PDH COMPLEX | Genes involved in Regulation of pyruvate dehydrogenase (PDH) complex |
| 0.0 | 3.1 | REACTOME RESPIRATORY ELECTRON TRANSPORT ATP SYNTHESIS BY CHEMIOSMOTIC COUPLING AND HEAT PRODUCTION BY UNCOUPLING PROTEINS | Genes involved in Respiratory electron transport, ATP synthesis by chemiosmotic coupling, and heat production by uncoupling proteins. |
| 0.0 | 1.0 | REACTOME AMINE LIGAND BINDING RECEPTORS | Genes involved in Amine ligand-binding receptors |
| 0.0 | 0.3 | REACTOME SIGNAL REGULATORY PROTEIN SIRP FAMILY INTERACTIONS | Genes involved in Signal regulatory protein (SIRP) family interactions |
| 0.0 | 0.8 | REACTOME SYNTHESIS OF PIPS AT THE PLASMA MEMBRANE | Genes involved in Synthesis of PIPs at the plasma membrane |
| 0.0 | 1.0 | REACTOME OLFACTORY SIGNALING PATHWAY | Genes involved in Olfactory Signaling Pathway |
| 0.0 | 0.6 | REACTOME PTM GAMMA CARBOXYLATION HYPUSINE FORMATION AND ARYLSULFATASE ACTIVATION | Genes involved in PTM: gamma carboxylation, hypusine formation and arylsulfatase activation |
| 0.0 | 0.5 | REACTOME REGULATION OF GENE EXPRESSION IN BETA CELLS | Genes involved in Regulation of gene expression in beta cells |
| 0.0 | 1.1 | REACTOME NUCLEAR RECEPTOR TRANSCRIPTION PATHWAY | Genes involved in Nuclear Receptor transcription pathway |
| 0.0 | 0.3 | REACTOME EXTRINSIC PATHWAY FOR APOPTOSIS | Genes involved in Extrinsic Pathway for Apoptosis |
| 0.0 | 0.7 | REACTOME PHASE1 FUNCTIONALIZATION OF COMPOUNDS | Genes involved in Phase 1 - Functionalization of compounds |