Project
GNF SymAtlas + NCI-60 cancer cell lines, comparison of cancers vs non-cancers, human (Su, 2004; Ross, 2000)
Navigation
Downloads
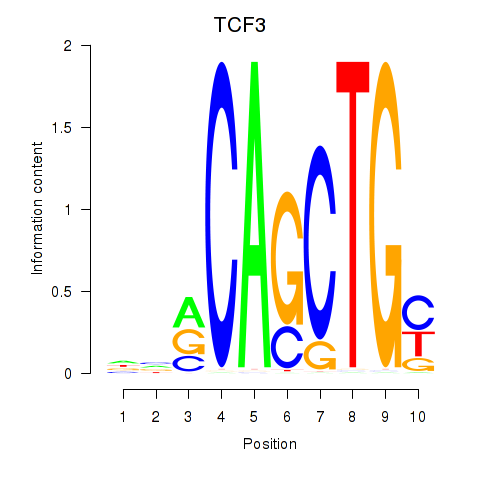
Results for TCF3_MYOG
Z-value: 0.87
Motif logo

Transcription factors associated with TCF3_MYOG
| Gene Symbol | Gene ID | Gene Info |
|---|---|---|
|
TCF3
|
ENSG00000071564.10 | transcription factor 3 |
|
MYOG
|
ENSG00000122180.4 | myogenin |
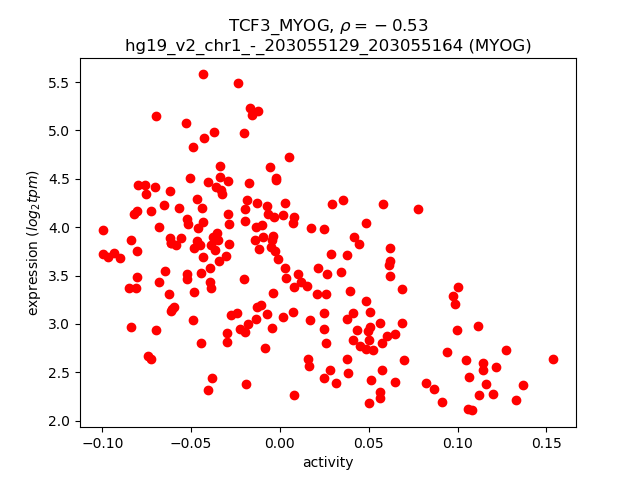
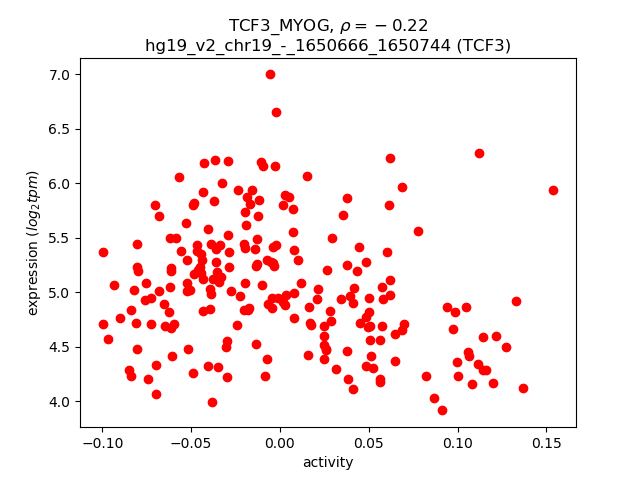
Activity-expression correlation:
| Gene | Promoter | Pearson corr. coef. | P-value | Plot |
|---|---|---|---|---|
| MYOG | hg19_v2_chr1_-_203055129_203055164 | -0.53 | 2.1e-17 | Click! |
| TCF3 | hg19_v2_chr19_-_1650666_1650744 | -0.22 | 8.5e-04 | Click! |
Activity profile of TCF3_MYOG motif
Sorted Z-values of TCF3_MYOG motif
| Promoter | Log-likelihood | Transcript | Gene | Gene Info |
|---|---|---|---|---|
| chr8_+_98788003 | 65.53 |
ENST00000521545.2
|
LAPTM4B
|
lysosomal protein transmembrane 4 beta |
| chr22_+_38071615 | 51.66 |
ENST00000215909.5
|
LGALS1
|
lectin, galactoside-binding, soluble, 1 |
| chr2_-_17981462 | 41.43 |
ENST00000402989.1
ENST00000428868.1 |
SMC6
|
structural maintenance of chromosomes 6 |
| chr17_+_39411636 | 36.80 |
ENST00000394008.1
|
KRTAP9-9
|
keratin associated protein 9-9 |
| chr19_+_16186903 | 36.34 |
ENST00000588507.1
|
TPM4
|
tropomyosin 4 |
| chr11_-_64014379 | 35.07 |
ENST00000309318.3
|
PPP1R14B
|
protein phosphatase 1, regulatory (inhibitor) subunit 14B |
| chr11_-_1643368 | 35.06 |
ENST00000399682.1
|
KRTAP5-4
|
keratin associated protein 5-4 |
| chr20_+_3776936 | 30.10 |
ENST00000439880.2
|
CDC25B
|
cell division cycle 25B |
| chr15_-_72523454 | 29.54 |
ENST00000565154.1
ENST00000565184.1 ENST00000389093.3 ENST00000449901.2 ENST00000335181.5 ENST00000319622.6 |
PKM
|
pyruvate kinase, muscle |
| chr3_+_49059038 | 28.84 |
ENST00000451378.2
|
NDUFAF3
|
NADH dehydrogenase (ubiquinone) complex I, assembly factor 3 |
| chr19_+_16187085 | 28.44 |
ENST00000300933.4
|
TPM4
|
tropomyosin 4 |
| chrX_+_150151824 | 28.39 |
ENST00000455596.1
ENST00000448905.2 |
HMGB3
|
high mobility group box 3 |
| chr3_+_159570722 | 27.40 |
ENST00000482804.1
|
SCHIP1
|
schwannomin interacting protein 1 |
| chr2_-_37899323 | 27.37 |
ENST00000295324.3
ENST00000457889.1 |
CDC42EP3
|
CDC42 effector protein (Rho GTPase binding) 3 |
| chr12_-_123752624 | 26.39 |
ENST00000542174.1
ENST00000535796.1 |
CDK2AP1
|
cyclin-dependent kinase 2 associated protein 1 |
| chr22_+_31489344 | 23.23 |
ENST00000404574.1
|
SMTN
|
smoothelin |
| chr7_+_116165754 | 23.14 |
ENST00000405348.1
|
CAV1
|
caveolin 1, caveolae protein, 22kDa |
| chr22_-_42342692 | 22.87 |
ENST00000404067.1
ENST00000402338.1 |
CENPM
|
centromere protein M |
| chr7_+_116166331 | 22.76 |
ENST00000393468.1
ENST00000393467.1 |
CAV1
|
caveolin 1, caveolae protein, 22kDa |
| chr12_-_56122426 | 22.30 |
ENST00000551173.1
|
CD63
|
CD63 molecule |
| chr8_-_49834299 | 21.77 |
ENST00000396822.1
|
SNAI2
|
snail family zinc finger 2 |
| chr11_-_64013288 | 21.61 |
ENST00000542235.1
|
PPP1R14B
|
protein phosphatase 1, regulatory (inhibitor) subunit 14B |
| chr2_-_220435963 | 21.36 |
ENST00000373876.1
ENST00000404537.1 ENST00000603926.1 ENST00000373873.4 ENST00000289656.3 |
OBSL1
|
obscurin-like 1 |
| chr1_+_165796753 | 20.69 |
ENST00000367879.4
|
UCK2
|
uridine-cytidine kinase 2 |
| chr17_-_7216939 | 20.51 |
ENST00000573684.1
|
GPS2
|
G protein pathway suppressor 2 |
| chr1_-_11120057 | 20.45 |
ENST00000376957.2
|
SRM
|
spermidine synthase |
| chr3_-_81792780 | 20.36 |
ENST00000489715.1
|
GBE1
|
glucan (1,4-alpha-), branching enzyme 1 |
| chr19_-_13068012 | 20.25 |
ENST00000316939.1
|
GADD45GIP1
|
growth arrest and DNA-damage-inducible, gamma interacting protein 1 |
| chr20_+_35202909 | 19.52 |
ENST00000558530.1
ENST00000558028.1 ENST00000560025.1 |
TGIF2-C20orf24
TGIF2
|
TGIF2-C20orf24 readthrough TGFB-induced factor homeobox 2 |
| chr19_-_48894104 | 19.49 |
ENST00000597017.1
|
KDELR1
|
KDEL (Lys-Asp-Glu-Leu) endoplasmic reticulum protein retention receptor 1 |
| chr1_-_150669500 | 19.34 |
ENST00000271732.3
|
GOLPH3L
|
golgi phosphoprotein 3-like |
| chr3_+_69788576 | 19.34 |
ENST00000352241.4
ENST00000448226.2 |
MITF
|
microphthalmia-associated transcription factor |
| chr21_+_30502806 | 19.21 |
ENST00000399928.1
ENST00000399926.1 |
MAP3K7CL
|
MAP3K7 C-terminal like |
| chr7_+_130794846 | 18.92 |
ENST00000421797.2
|
MKLN1
|
muskelin 1, intracellular mediator containing kelch motifs |
| chr7_+_12727250 | 18.76 |
ENST00000404894.1
|
ARL4A
|
ADP-ribosylation factor-like 4A |
| chr2_+_136343820 | 18.08 |
ENST00000410054.1
|
R3HDM1
|
R3H domain containing 1 |
| chr1_+_87170277 | 18.04 |
ENST00000535010.1
|
SH3GLB1
|
SH3-domain GRB2-like endophilin B1 |
| chr11_+_71249071 | 18.01 |
ENST00000398534.3
|
KRTAP5-8
|
keratin associated protein 5-8 |
| chr12_-_58146128 | 17.85 |
ENST00000551800.1
ENST00000549606.1 ENST00000257904.6 |
CDK4
|
cyclin-dependent kinase 4 |
| chr1_+_32687971 | 17.84 |
ENST00000373586.1
|
EIF3I
|
eukaryotic translation initiation factor 3, subunit I |
| chr2_+_10262857 | 17.79 |
ENST00000304567.5
|
RRM2
|
ribonucleotide reductase M2 |
| chr8_-_141931287 | 17.75 |
ENST00000517887.1
|
PTK2
|
protein tyrosine kinase 2 |
| chr8_-_49833978 | 17.64 |
ENST00000020945.1
|
SNAI2
|
snail family zinc finger 2 |
| chr12_-_58146048 | 17.38 |
ENST00000547281.1
ENST00000546489.1 ENST00000552388.1 ENST00000540325.1 ENST00000312990.6 |
CDK4
|
cyclin-dependent kinase 4 |
| chrX_-_153285251 | 17.29 |
ENST00000444230.1
ENST00000393682.1 ENST00000393687.2 ENST00000429936.2 ENST00000369974.2 |
IRAK1
|
interleukin-1 receptor-associated kinase 1 |
| chr1_-_38273840 | 17.22 |
ENST00000373044.2
|
YRDC
|
yrdC N(6)-threonylcarbamoyltransferase domain containing |
| chr11_+_71938925 | 16.57 |
ENST00000538751.1
|
INPPL1
|
inositol polyphosphate phosphatase-like 1 |
| chr14_-_69864993 | 16.53 |
ENST00000555373.1
|
ERH
|
enhancer of rudimentary homolog (Drosophila) |
| chr12_+_116997186 | 16.49 |
ENST00000306985.4
|
MAP1LC3B2
|
microtubule-associated protein 1 light chain 3 beta 2 |
| chr20_+_3776371 | 16.32 |
ENST00000245960.5
|
CDC25B
|
cell division cycle 25B |
| chr3_+_148709310 | 16.11 |
ENST00000484197.1
ENST00000492285.2 ENST00000461191.1 |
GYG1
|
glycogenin 1 |
| chr17_+_52978156 | 15.66 |
ENST00000348161.4
|
TOM1L1
|
target of myb1 (chicken)-like 1 |
| chr13_-_37573432 | 15.61 |
ENST00000413537.2
ENST00000443765.1 ENST00000239891.3 |
ALG5
|
ALG5, dolichyl-phosphate beta-glucosyltransferase |
| chr1_-_24126023 | 15.60 |
ENST00000429356.1
|
GALE
|
UDP-galactose-4-epimerase |
| chr12_-_50616382 | 15.58 |
ENST00000552783.1
|
LIMA1
|
LIM domain and actin binding 1 |
| chr17_+_34842473 | 15.54 |
ENST00000490126.2
ENST00000225410.4 |
ZNHIT3
|
zinc finger, HIT-type containing 3 |
| chrX_+_69509927 | 15.39 |
ENST00000374403.3
|
KIF4A
|
kinesin family member 4A |
| chr2_-_220436248 | 15.02 |
ENST00000265318.4
|
OBSL1
|
obscurin-like 1 |
| chr9_-_35689900 | 14.62 |
ENST00000378300.5
ENST00000329305.2 ENST00000360958.2 |
TPM2
|
tropomyosin 2 (beta) |
| chr10_-_88281494 | 14.48 |
ENST00000298767.5
|
WAPAL
|
wings apart-like homolog (Drosophila) |
| chr17_+_52978107 | 14.39 |
ENST00000445275.2
|
TOM1L1
|
target of myb1 (chicken)-like 1 |
| chr3_-_165555200 | 14.34 |
ENST00000479451.1
ENST00000540653.1 ENST00000488954.1 ENST00000264381.3 |
BCHE
|
butyrylcholinesterase |
| chr17_+_34842512 | 14.34 |
ENST00000588253.1
ENST00000592616.1 ENST00000590858.1 ENST00000588357.1 |
ZNHIT3
|
zinc finger, HIT-type containing 3 |
| chr9_-_130952989 | 14.16 |
ENST00000415526.1
ENST00000277465.4 |
CIZ1
|
CDKN1A interacting zinc finger protein 1 |
| chr11_-_65667997 | 14.05 |
ENST00000312562.2
ENST00000534222.1 |
FOSL1
|
FOS-like antigen 1 |
| chr1_-_33168336 | 13.83 |
ENST00000373484.3
|
SYNC
|
syncoilin, intermediate filament protein |
| chr7_-_148580563 | 13.80 |
ENST00000476773.1
|
EZH2
|
enhancer of zeste homolog 2 (Drosophila) |
| chr12_-_56122761 | 13.70 |
ENST00000552164.1
ENST00000420846.3 ENST00000257857.4 |
CD63
|
CD63 molecule |
| chrX_-_153285395 | 13.65 |
ENST00000369980.3
|
IRAK1
|
interleukin-1 receptor-associated kinase 1 |
| chr17_-_39191107 | 13.60 |
ENST00000344363.5
|
KRTAP1-3
|
keratin associated protein 1-3 |
| chr12_-_50616122 | 13.58 |
ENST00000552823.1
ENST00000552909.1 |
LIMA1
|
LIM domain and actin binding 1 |
| chr3_+_148709128 | 13.56 |
ENST00000345003.4
ENST00000296048.6 ENST00000483267.1 |
GYG1
|
glycogenin 1 |
| chr1_-_94079648 | 13.55 |
ENST00000370247.3
|
BCAR3
|
breast cancer anti-estrogen resistance 3 |
| chr3_+_49058444 | 13.54 |
ENST00000326925.6
ENST00000395458.2 |
NDUFAF3
|
NADH dehydrogenase (ubiquinone) complex I, assembly factor 3 |
| chr11_+_842808 | 13.49 |
ENST00000397397.2
ENST00000397411.2 ENST00000397396.1 |
TSPAN4
|
tetraspanin 4 |
| chr17_+_39240459 | 13.41 |
ENST00000391417.4
|
KRTAP4-7
|
keratin associated protein 4-7 |
| chr16_+_30078811 | 13.25 |
ENST00000564688.1
|
ALDOA
|
aldolase A, fructose-bisphosphate |
| chr12_-_46662772 | 13.20 |
ENST00000549049.1
ENST00000439706.1 ENST00000398637.5 |
SLC38A1
|
solute carrier family 38, member 1 |
| chr19_-_42806723 | 13.19 |
ENST00000262890.3
|
PAFAH1B3
|
platelet-activating factor acetylhydrolase 1b, catalytic subunit 3 (29kDa) |
| chr11_-_65667884 | 13.13 |
ENST00000448083.2
ENST00000531493.1 ENST00000532401.1 |
FOSL1
|
FOS-like antigen 1 |
| chr5_+_72112470 | 12.92 |
ENST00000447967.2
ENST00000523768.1 |
TNPO1
|
transportin 1 |
| chr13_+_34392185 | 12.91 |
ENST00000380071.3
|
RFC3
|
replication factor C (activator 1) 3, 38kDa |
| chr9_-_117880477 | 12.86 |
ENST00000534839.1
ENST00000340094.3 ENST00000535648.1 ENST00000346706.3 ENST00000345230.3 ENST00000350763.4 |
TNC
|
tenascin C |
| chrX_+_150151752 | 12.81 |
ENST00000325307.7
|
HMGB3
|
high mobility group box 3 |
| chr16_+_103816 | 12.78 |
ENST00000383018.3
ENST00000417493.1 |
SNRNP25
|
small nuclear ribonucleoprotein 25kDa (U11/U12) |
| chr3_-_185538849 | 12.70 |
ENST00000421047.2
|
IGF2BP2
|
insulin-like growth factor 2 mRNA binding protein 2 |
| chr11_+_86511569 | 12.63 |
ENST00000441050.1
|
PRSS23
|
protease, serine, 23 |
| chr9_+_36572851 | 12.46 |
ENST00000298048.2
ENST00000538311.1 ENST00000536987.1 ENST00000545008.1 ENST00000536860.1 ENST00000536329.1 ENST00000541717.1 ENST00000543751.1 |
MELK
|
maternal embryonic leucine zipper kinase |
| chr11_+_66247880 | 12.41 |
ENST00000360510.2
ENST00000453114.1 ENST00000541961.1 ENST00000532019.1 ENST00000526515.1 ENST00000530165.1 ENST00000533725.1 |
DPP3
|
dipeptidyl-peptidase 3 |
| chr13_-_24007815 | 12.16 |
ENST00000382298.3
|
SACS
|
spastic ataxia of Charlevoix-Saguenay (sacsin) |
| chr4_-_71705027 | 11.95 |
ENST00000545193.1
|
GRSF1
|
G-rich RNA sequence binding factor 1 |
| chr16_-_103572 | 11.93 |
ENST00000293860.5
|
POLR3K
|
polymerase (RNA) III (DNA directed) polypeptide K, 12.3 kDa |
| chr11_+_842928 | 11.79 |
ENST00000397408.1
|
TSPAN4
|
tetraspanin 4 |
| chr8_-_101963482 | 11.78 |
ENST00000419477.2
|
YWHAZ
|
tyrosine 3-monooxygenase/tryptophan 5-monooxygenase activation protein, zeta |
| chr15_-_42749711 | 11.73 |
ENST00000565611.1
ENST00000263805.4 ENST00000565948.1 |
ZNF106
|
zinc finger protein 106 |
| chr19_-_42806842 | 11.60 |
ENST00000596265.1
|
PAFAH1B3
|
platelet-activating factor acetylhydrolase 1b, catalytic subunit 3 (29kDa) |
| chr7_-_7679633 | 11.59 |
ENST00000401447.1
|
RPA3
|
replication protein A3, 14kDa |
| chr3_+_172468472 | 11.55 |
ENST00000232458.5
ENST00000392692.3 |
ECT2
|
epithelial cell transforming sequence 2 oncogene |
| chr19_-_19051103 | 11.55 |
ENST00000542541.2
ENST00000433218.2 |
HOMER3
|
homer homolog 3 (Drosophila) |
| chr7_-_99698338 | 11.32 |
ENST00000354230.3
ENST00000425308.1 |
MCM7
|
minichromosome maintenance complex component 7 |
| chr8_-_101962777 | 11.22 |
ENST00000395951.3
|
YWHAZ
|
tyrosine 3-monooxygenase/tryptophan 5-monooxygenase activation protein, zeta |
| chr4_-_71705060 | 11.07 |
ENST00000514161.1
|
GRSF1
|
G-rich RNA sequence binding factor 1 |
| chr12_-_54653313 | 10.97 |
ENST00000550411.1
ENST00000439541.2 |
CBX5
|
chromobox homolog 5 |
| chr7_+_12726474 | 10.88 |
ENST00000396662.1
ENST00000356797.3 ENST00000396664.2 |
ARL4A
|
ADP-ribosylation factor-like 4A |
| chr1_-_153538011 | 10.80 |
ENST00000368707.4
|
S100A2
|
S100 calcium binding protein A2 |
| chr1_-_225840747 | 10.80 |
ENST00000366843.2
ENST00000366844.3 |
ENAH
|
enabled homolog (Drosophila) |
| chr2_-_33824336 | 10.78 |
ENST00000431950.1
ENST00000403368.1 ENST00000441530.2 |
FAM98A
|
family with sequence similarity 98, member A |
| chr11_-_67169253 | 10.76 |
ENST00000527663.1
ENST00000312989.7 |
PPP1CA
|
protein phosphatase 1, catalytic subunit, alpha isozyme |
| chr5_+_72143988 | 10.58 |
ENST00000506351.2
|
TNPO1
|
transportin 1 |
| chr4_+_169418195 | 10.54 |
ENST00000261509.6
ENST00000335742.7 |
PALLD
|
palladin, cytoskeletal associated protein |
| chr20_-_48770174 | 10.50 |
ENST00000341698.2
|
TMEM189-UBE2V1
|
TMEM189-UBE2V1 readthrough |
| chr17_-_41132010 | 10.45 |
ENST00000409103.1
ENST00000360221.4 |
PTGES3L-AARSD1
|
PTGES3L-AARSD1 readthrough |
| chr11_+_66247478 | 10.40 |
ENST00000531863.1
ENST00000532677.1 |
DPP3
|
dipeptidyl-peptidase 3 |
| chr9_+_133710453 | 10.40 |
ENST00000318560.5
|
ABL1
|
c-abl oncogene 1, non-receptor tyrosine kinase |
| chr1_-_24126892 | 10.39 |
ENST00000374497.3
ENST00000425913.1 |
GALE
|
UDP-galactose-4-epimerase |
| chrX_-_153775426 | 10.38 |
ENST00000393562.2
|
G6PD
|
glucose-6-phosphate dehydrogenase |
| chr8_+_126010739 | 10.31 |
ENST00000523430.1
ENST00000265896.5 |
SQLE
|
squalene epoxidase |
| chr7_-_72936531 | 10.26 |
ENST00000339594.4
|
BAZ1B
|
bromodomain adjacent to zinc finger domain, 1B |
| chr3_+_172468505 | 10.23 |
ENST00000427830.1
ENST00000417960.1 ENST00000428567.1 ENST00000366090.2 ENST00000426894.1 |
ECT2
|
epithelial cell transforming sequence 2 oncogene |
| chr17_-_47492164 | 10.22 |
ENST00000512041.2
ENST00000446735.1 ENST00000504124.1 |
PHB
|
prohibitin |
| chr5_+_34656569 | 10.11 |
ENST00000428746.2
|
RAI14
|
retinoic acid induced 14 |
| chrX_-_109561294 | 10.08 |
ENST00000372059.2
ENST00000262844.5 |
AMMECR1
|
Alport syndrome, mental retardation, midface hypoplasia and elliptocytosis chromosomal region gene 1 |
| chr3_-_125313934 | 10.01 |
ENST00000296220.5
|
OSBPL11
|
oxysterol binding protein-like 11 |
| chr19_-_50432782 | 10.01 |
ENST00000413454.1
ENST00000596437.1 ENST00000341114.3 ENST00000595948.1 |
NUP62
IL4I1
|
nucleoporin 62kDa interleukin 4 induced 1 |
| chr22_-_36236265 | 9.94 |
ENST00000414461.2
ENST00000416721.2 ENST00000449924.2 ENST00000262829.7 ENST00000397305.3 |
RBFOX2
|
RNA binding protein, fox-1 homolog (C. elegans) 2 |
| chr9_+_138392483 | 9.83 |
ENST00000241600.5
|
MRPS2
|
mitochondrial ribosomal protein S2 |
| chr19_+_14672755 | 9.79 |
ENST00000594545.1
|
TECR
|
trans-2,3-enoyl-CoA reductase |
| chr1_+_25071848 | 9.68 |
ENST00000374379.4
|
CLIC4
|
chloride intracellular channel 4 |
| chr2_-_33824382 | 9.62 |
ENST00000238823.8
|
FAM98A
|
family with sequence similarity 98, member A |
| chr7_-_132766818 | 9.56 |
ENST00000262570.5
|
CHCHD3
|
coiled-coil-helix-coiled-coil-helix domain containing 3 |
| chr3_-_141868293 | 9.51 |
ENST00000317104.7
ENST00000494358.1 |
TFDP2
|
transcription factor Dp-2 (E2F dimerization partner 2) |
| chr5_-_133968529 | 9.38 |
ENST00000402673.2
|
SAR1B
|
SAR1 homolog B (S. cerevisiae) |
| chr2_+_192110199 | 9.34 |
ENST00000304164.4
|
MYO1B
|
myosin IB |
| chr5_+_52856456 | 9.34 |
ENST00000296684.5
ENST00000506765.1 |
NDUFS4
|
NADH dehydrogenase (ubiquinone) Fe-S protein 4, 18kDa (NADH-coenzyme Q reductase) |
| chrX_+_23685653 | 9.33 |
ENST00000379331.3
|
PRDX4
|
peroxiredoxin 4 |
| chr16_-_20911641 | 9.28 |
ENST00000564349.1
ENST00000324344.4 |
ERI2
DCUN1D3
|
ERI1 exoribonuclease family member 2 DCN1, defective in cullin neddylation 1, domain containing 3 |
| chr22_+_18593446 | 9.28 |
ENST00000316027.6
|
TUBA8
|
tubulin, alpha 8 |
| chr3_-_99833333 | 9.28 |
ENST00000354552.3
ENST00000331335.5 ENST00000398326.2 |
FILIP1L
|
filamin A interacting protein 1-like |
| chr9_-_32573130 | 9.25 |
ENST00000350021.2
ENST00000379847.3 |
NDUFB6
|
NADH dehydrogenase (ubiquinone) 1 beta subcomplex, 6, 17kDa |
| chr2_-_27545431 | 9.24 |
ENST00000233545.2
|
MPV17
|
MpV17 mitochondrial inner membrane protein |
| chr2_+_131100423 | 9.21 |
ENST00000409935.1
ENST00000409649.1 ENST00000428740.1 |
IMP4
|
IMP4, U3 small nucleolar ribonucleoprotein, homolog (yeast) |
| chr1_-_19536744 | 9.20 |
ENST00000375267.2
ENST00000375217.2 ENST00000375226.2 ENST00000375254.3 |
UBR4
|
ubiquitin protein ligase E3 component n-recognin 4 |
| chr18_+_29077990 | 9.19 |
ENST00000261590.8
|
DSG2
|
desmoglein 2 |
| chr1_-_95392635 | 9.11 |
ENST00000538964.1
ENST00000394202.4 ENST00000370206.4 |
CNN3
|
calponin 3, acidic |
| chr15_-_56209306 | 9.10 |
ENST00000506154.1
ENST00000338963.2 ENST00000508342.1 |
NEDD4
|
neural precursor cell expressed, developmentally down-regulated 4, E3 ubiquitin protein ligase |
| chr20_-_48770244 | 9.07 |
ENST00000371650.5
ENST00000371652.4 ENST00000557021.1 |
TMEM189
|
transmembrane protein 189 |
| chr19_-_42806919 | 9.06 |
ENST00000595530.1
ENST00000538771.1 ENST00000601865.1 |
PAFAH1B3
|
platelet-activating factor acetylhydrolase 1b, catalytic subunit 3 (29kDa) |
| chr2_-_47168850 | 8.91 |
ENST00000409207.1
|
MCFD2
|
multiple coagulation factor deficiency 2 |
| chr7_-_132766800 | 8.88 |
ENST00000542753.1
ENST00000448878.1 |
CHCHD3
|
coiled-coil-helix-coiled-coil-helix domain containing 3 |
| chr20_-_1373682 | 8.81 |
ENST00000381724.3
|
FKBP1A
|
FK506 binding protein 1A, 12kDa |
| chr19_+_39989535 | 8.79 |
ENST00000356433.5
|
DLL3
|
delta-like 3 (Drosophila) |
| chr19_+_47104493 | 8.74 |
ENST00000291295.9
ENST00000597743.1 |
CALM3
|
calmodulin 3 (phosphorylase kinase, delta) |
| chr3_+_49057876 | 8.69 |
ENST00000326912.4
|
NDUFAF3
|
NADH dehydrogenase (ubiquinone) complex I, assembly factor 3 |
| chr1_-_193028632 | 8.64 |
ENST00000421683.1
|
UCHL5
|
ubiquitin carboxyl-terminal hydrolase L5 |
| chr20_+_44441304 | 8.57 |
ENST00000352551.5
|
UBE2C
|
ubiquitin-conjugating enzyme E2C |
| chr7_-_30029574 | 8.49 |
ENST00000426154.1
ENST00000421434.1 ENST00000434476.2 |
SCRN1
|
secernin 1 |
| chr5_-_43557791 | 8.42 |
ENST00000338972.4
ENST00000511321.1 ENST00000515338.1 |
PAIP1
|
poly(A) binding protein interacting protein 1 |
| chr17_+_49337881 | 8.37 |
ENST00000225298.7
|
UTP18
|
UTP18 small subunit (SSU) processome component homolog (yeast) |
| chr12_-_50677255 | 8.36 |
ENST00000551691.1
ENST00000394943.3 ENST00000341247.4 |
LIMA1
|
LIM domain and actin binding 1 |
| chr20_+_44441215 | 8.29 |
ENST00000356455.4
ENST00000405520.1 |
UBE2C
|
ubiquitin-conjugating enzyme E2C |
| chr8_-_103668114 | 8.23 |
ENST00000285407.6
|
KLF10
|
Kruppel-like factor 10 |
| chr1_-_113249948 | 8.23 |
ENST00000339083.7
ENST00000369642.3 |
RHOC
|
ras homolog family member C |
| chrX_-_109590174 | 8.18 |
ENST00000372054.1
|
GNG5P2
|
guanine nucleotide binding protein (G protein), gamma 5 pseudogene 2 |
| chr19_+_17416457 | 8.05 |
ENST00000252602.1
|
MRPL34
|
mitochondrial ribosomal protein L34 |
| chr1_-_155224751 | 8.02 |
ENST00000350210.2
ENST00000368368.3 |
FAM189B
|
family with sequence similarity 189, member B |
| chr11_+_105948216 | 8.01 |
ENST00000278618.4
|
AASDHPPT
|
aminoadipate-semialdehyde dehydrogenase-phosphopantetheinyl transferase |
| chr19_+_17416609 | 7.98 |
ENST00000602206.1
|
MRPL34
|
mitochondrial ribosomal protein L34 |
| chr1_+_180165672 | 7.98 |
ENST00000443059.1
|
QSOX1
|
quiescin Q6 sulfhydryl oxidase 1 |
| chr11_-_842509 | 7.97 |
ENST00000322028.4
|
POLR2L
|
polymerase (RNA) II (DNA directed) polypeptide L, 7.6kDa |
| chr1_-_193028621 | 7.96 |
ENST00000367455.4
ENST00000367454.1 |
UCHL5
|
ubiquitin carboxyl-terminal hydrolase L5 |
| chr13_-_31040060 | 7.96 |
ENST00000326004.4
ENST00000341423.5 |
HMGB1
|
high mobility group box 1 |
| chr10_+_14880157 | 7.89 |
ENST00000378372.3
|
HSPA14
|
heat shock 70kDa protein 14 |
| chr4_+_37892682 | 7.89 |
ENST00000508802.1
ENST00000261439.4 ENST00000402522.1 |
TBC1D1
|
TBC1 (tre-2/USP6, BUB2, cdc16) domain family, member 1 |
| chr5_+_154092396 | 7.88 |
ENST00000336314.4
|
LARP1
|
La ribonucleoprotein domain family, member 1 |
| chr8_-_141810634 | 7.87 |
ENST00000521986.1
ENST00000523539.1 ENST00000538769.1 |
PTK2
|
protein tyrosine kinase 2 |
| chr1_+_155583012 | 7.86 |
ENST00000462250.2
|
MSTO1
|
misato 1, mitochondrial distribution and morphology regulator |
| chr3_-_52486841 | 7.79 |
ENST00000496590.1
|
TNNC1
|
troponin C type 1 (slow) |
| chr14_-_45603657 | 7.73 |
ENST00000396062.3
|
FKBP3
|
FK506 binding protein 3, 25kDa |
| chr9_+_80912059 | 7.72 |
ENST00000347159.2
ENST00000376588.3 |
PSAT1
|
phosphoserine aminotransferase 1 |
| chr3_-_134093275 | 7.68 |
ENST00000513145.1
ENST00000422605.2 |
AMOTL2
|
angiomotin like 2 |
| chr1_-_17304771 | 7.66 |
ENST00000375534.3
|
MFAP2
|
microfibrillar-associated protein 2 |
| chr19_+_47104553 | 7.54 |
ENST00000598871.1
ENST00000594523.1 |
CALM3
|
calmodulin 3 (phosphorylase kinase, delta) |
| chr12_-_56122220 | 7.52 |
ENST00000552692.1
|
CD63
|
CD63 molecule |
| chr20_-_43133491 | 7.48 |
ENST00000411544.1
|
SERINC3
|
serine incorporator 3 |
| chr11_-_88070920 | 7.40 |
ENST00000524463.1
ENST00000227266.5 |
CTSC
|
cathepsin C |
| chr7_-_44613494 | 7.34 |
ENST00000431640.1
ENST00000258772.5 |
DDX56
|
DEAD (Asp-Glu-Ala-Asp) box helicase 56 |
| chr2_-_133427767 | 7.30 |
ENST00000397463.2
|
LYPD1
|
LY6/PLAUR domain containing 1 |
| chr3_+_183894566 | 7.30 |
ENST00000439647.1
|
AP2M1
|
adaptor-related protein complex 2, mu 1 subunit |
| chrX_-_10588459 | 7.29 |
ENST00000380782.2
|
MID1
|
midline 1 (Opitz/BBB syndrome) |
| chr13_-_23949671 | 7.29 |
ENST00000402364.1
|
SACS
|
spastic ataxia of Charlevoix-Saguenay (sacsin) |
| chr15_-_37392086 | 7.27 |
ENST00000561208.1
|
MEIS2
|
Meis homeobox 2 |
| chr4_-_41216473 | 7.27 |
ENST00000513140.1
|
APBB2
|
amyloid beta (A4) precursor protein-binding, family B, member 2 |
| chrX_-_106243451 | 7.25 |
ENST00000355610.4
ENST00000535534.1 |
MORC4
|
MORC family CW-type zinc finger 4 |
| chr11_+_19798964 | 7.25 |
ENST00000527559.2
|
NAV2
|
neuron navigator 2 |
| chr7_-_10979750 | 7.25 |
ENST00000339600.5
|
NDUFA4
|
NADH dehydrogenase (ubiquinone) 1 alpha subcomplex, 4, 9kDa |
| chr18_+_3247779 | 7.20 |
ENST00000578611.1
ENST00000583449.1 |
MYL12A
|
myosin, light chain 12A, regulatory, non-sarcomeric |
| chr12_+_57849048 | 7.19 |
ENST00000266646.2
|
INHBE
|
inhibin, beta E |
| chr10_+_81272287 | 7.12 |
ENST00000520547.2
|
EIF5AL1
|
eukaryotic translation initiation factor 5A-like 1 |
| chr17_+_37894179 | 7.09 |
ENST00000577695.1
ENST00000309156.4 ENST00000309185.3 |
GRB7
|
growth factor receptor-bound protein 7 |
| chr5_-_16936340 | 7.05 |
ENST00000507288.1
ENST00000513610.1 |
MYO10
|
myosin X |
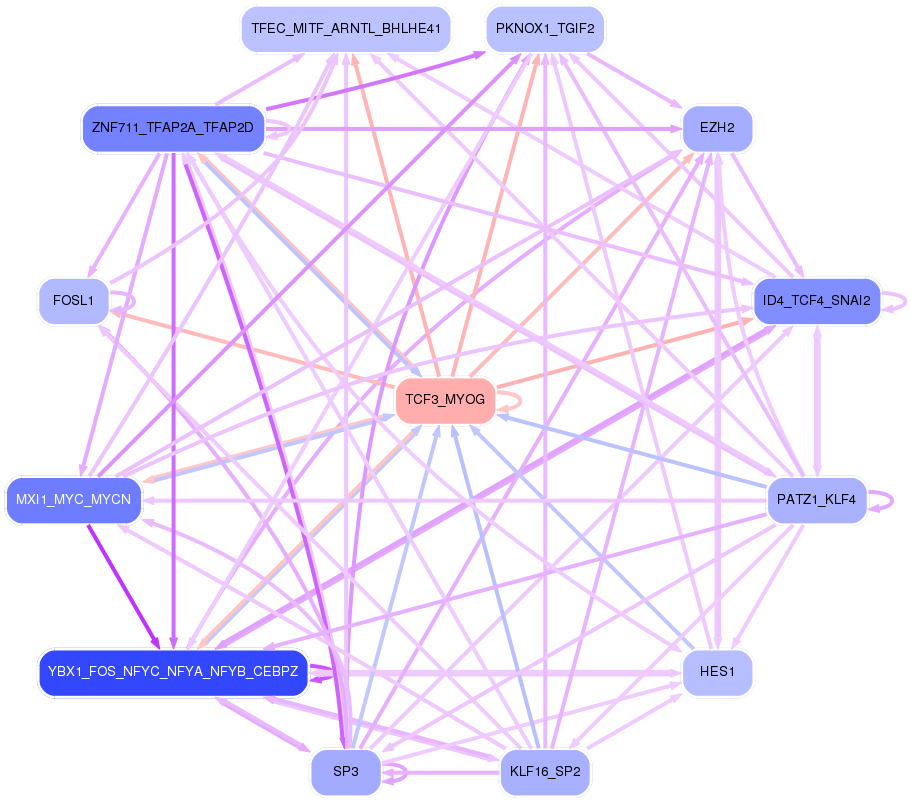
Network of associatons between targets according to the STRING database.

First level regulatory network of TCF3_MYOG
Gene Ontology Analysis
Gene overrepresentation in biological_process category:
| Log-likelihood per target | Total log-likelihood | Term | Description |
|---|---|---|---|
| 15.3 | 45.9 | GO:1900085 | negative regulation of peptidyl-tyrosine autophosphorylation(GO:1900085) negative regulation of inward rectifier potassium channel activity(GO:1903609) |
| 13.1 | 39.4 | GO:0070563 | negative regulation of vitamin D receptor signaling pathway(GO:0070563) |
| 12.9 | 51.7 | GO:0002317 | plasma cell differentiation(GO:0002317) |
| 7.0 | 35.2 | GO:1904636 | response to ionomycin(GO:1904636) cellular response to ionomycin(GO:1904637) |
| 7.0 | 27.9 | GO:1903778 | protein localization to vacuolar membrane(GO:1903778) |
| 5.7 | 17.2 | GO:0002949 | tRNA threonylcarbamoyladenosine modification(GO:0002949) |
| 5.2 | 20.7 | GO:0009224 | CMP salvage(GO:0006238) CMP biosynthetic process(GO:0009224) CMP metabolic process(GO:0046035) |
| 4.9 | 29.5 | GO:0042866 | pyruvate biosynthetic process(GO:0042866) |
| 4.8 | 28.8 | GO:0007296 | vitellogenesis(GO:0007296) |
| 4.8 | 14.3 | GO:0014016 | neuroblast differentiation(GO:0014016) |
| 4.8 | 19.1 | GO:0003404 | optic vesicle morphogenesis(GO:0003404) optic cup structural organization(GO:0003409) |
| 4.6 | 46.4 | GO:0007144 | female meiosis I(GO:0007144) |
| 4.6 | 13.8 | GO:1904772 | hepatocyte homeostasis(GO:0036333) response to tetrachloromethane(GO:1904772) |
| 4.3 | 12.9 | GO:0060447 | bud outgrowth involved in lung branching(GO:0060447) |
| 4.1 | 41.4 | GO:0000722 | telomere maintenance via recombination(GO:0000722) |
| 4.1 | 20.3 | GO:1903862 | positive regulation of oxidative phosphorylation(GO:1903862) |
| 3.8 | 15.3 | GO:0036496 | regulation of translational initiation by eIF2 alpha dephosphorylation(GO:0036496) |
| 3.8 | 49.7 | GO:2000680 | rubidium ion transport(GO:0035826) regulation of rubidium ion transport(GO:2000680) |
| 3.5 | 14.1 | GO:0021564 | vagus nerve development(GO:0021564) |
| 3.5 | 10.4 | GO:0006617 | SRP-dependent cotranslational protein targeting to membrane, signal sequence recognition(GO:0006617) |
| 3.5 | 10.4 | GO:0001922 | B-1 B cell homeostasis(GO:0001922) |
| 3.5 | 10.4 | GO:0009051 | pentose-phosphate shunt, oxidative branch(GO:0009051) |
| 3.1 | 9.3 | GO:0021678 | fourth ventricle development(GO:0021592) third ventricle development(GO:0021678) |
| 3.0 | 15.2 | GO:2000255 | negative regulation of male germ cell proliferation(GO:2000255) |
| 3.0 | 9.0 | GO:0042727 | flavin-containing compound biosynthetic process(GO:0042727) |
| 2.9 | 20.4 | GO:0008295 | spermidine biosynthetic process(GO:0008295) |
| 2.8 | 25.6 | GO:0038007 | netrin-activated signaling pathway(GO:0038007) |
| 2.7 | 11.0 | GO:1902361 | mitochondrial pyruvate transport(GO:0006850) mitochondrial pyruvate transmembrane transport(GO:1902361) |
| 2.6 | 7.9 | GO:0051083 | 'de novo' cotranslational protein folding(GO:0051083) |
| 2.6 | 7.9 | GO:1901355 | response to rapamycin(GO:1901355) |
| 2.6 | 36.4 | GO:0071688 | striated muscle myosin thick filament assembly(GO:0071688) |
| 2.6 | 12.9 | GO:1900264 | regulation of DNA-directed DNA polymerase activity(GO:1900262) positive regulation of DNA-directed DNA polymerase activity(GO:1900264) |
| 2.6 | 30.9 | GO:0050847 | progesterone receptor signaling pathway(GO:0050847) |
| 2.4 | 16.9 | GO:0010993 | regulation of ubiquitin homeostasis(GO:0010993) free ubiquitin chain polymerization(GO:0010994) |
| 2.4 | 14.4 | GO:0007386 | compartment pattern specification(GO:0007386) |
| 2.2 | 21.8 | GO:0051988 | regulation of attachment of spindle microtubules to kinetochore(GO:0051988) |
| 2.2 | 28.2 | GO:0019388 | galactose catabolic process(GO:0019388) |
| 2.2 | 38.9 | GO:0034134 | toll-like receptor 2 signaling pathway(GO:0034134) |
| 2.1 | 19.1 | GO:0022417 | protein maturation by protein folding(GO:0022417) |
| 2.1 | 6.3 | GO:2001245 | regulation of phosphatidylcholine biosynthetic process(GO:2001245) |
| 2.1 | 27.4 | GO:0031274 | positive regulation of pseudopodium assembly(GO:0031274) |
| 2.1 | 8.4 | GO:1903566 | positive regulation of protein localization to cilium(GO:1903566) |
| 2.0 | 30.1 | GO:0006610 | ribosomal protein import into nucleus(GO:0006610) |
| 2.0 | 30.1 | GO:0043162 | ubiquitin-dependent protein catabolic process via the multivesicular body sorting pathway(GO:0043162) |
| 2.0 | 5.9 | GO:0003383 | apical constriction(GO:0003383) |
| 1.9 | 5.8 | GO:0010286 | heat acclimation(GO:0010286) cellular heat acclimation(GO:0070370) |
| 1.9 | 7.8 | GO:0002086 | diaphragm contraction(GO:0002086) |
| 1.9 | 22.3 | GO:0035437 | maintenance of protein localization in endoplasmic reticulum(GO:0035437) |
| 1.9 | 7.4 | GO:1903438 | regulation of cytokinetic process(GO:0032954) positive regulation of centriole replication(GO:0046601) regulation of mitotic cytokinetic process(GO:1903436) positive regulation of mitotic cytokinetic process(GO:1903438) positive regulation of mitotic cytokinesis(GO:1903490) |
| 1.8 | 9.2 | GO:0003164 | His-Purkinje system development(GO:0003164) |
| 1.8 | 5.4 | GO:1902303 | regulation of heart rate by hormone(GO:0003064) negative regulation of potassium ion export(GO:1902303) |
| 1.7 | 5.2 | GO:0046166 | glyceraldehyde-3-phosphate biosynthetic process(GO:0046166) |
| 1.7 | 7.0 | GO:1903224 | regulation of endodermal cell differentiation(GO:1903224) |
| 1.7 | 5.0 | GO:1903926 | signal transduction involved in intra-S DNA damage checkpoint(GO:0072428) response to bisphenol A(GO:1903925) cellular response to bisphenol A(GO:1903926) |
| 1.7 | 9.9 | GO:0010724 | regulation of definitive erythrocyte differentiation(GO:0010724) |
| 1.6 | 8.2 | GO:0015862 | uridine transport(GO:0015862) |
| 1.5 | 6.2 | GO:0035523 | protein K29-linked deubiquitination(GO:0035523) maintenance of unfolded protein(GO:0036506) maintenance of unfolded protein involved in ERAD pathway(GO:1904378) |
| 1.5 | 7.7 | GO:0042816 | vitamin B6 metabolic process(GO:0042816) |
| 1.5 | 6.1 | GO:1904715 | negative regulation of chaperone-mediated autophagy(GO:1904715) |
| 1.5 | 19.4 | GO:0090084 | negative regulation of inclusion body assembly(GO:0090084) |
| 1.5 | 5.9 | GO:1904386 | response to thyroxine(GO:0097068) response to L-phenylalanine derivative(GO:1904386) |
| 1.4 | 1.4 | GO:1902908 | regulation of melanosome transport(GO:1902908) |
| 1.4 | 10.0 | GO:0010890 | positive regulation of sequestering of triglyceride(GO:0010890) |
| 1.4 | 10.0 | GO:0032445 | fructose transport(GO:0015755) fructose import(GO:0032445) carbohydrate import into cell(GO:0097319) carbohydrate import across plasma membrane(GO:0098704) fructose import across plasma membrane(GO:1990539) |
| 1.4 | 9.9 | GO:0035583 | sequestering of TGFbeta in extracellular matrix(GO:0035583) |
| 1.4 | 9.9 | GO:1902962 | regulation of metalloendopeptidase activity involved in amyloid precursor protein catabolic process(GO:1902962) negative regulation of metalloendopeptidase activity involved in amyloid precursor protein catabolic process(GO:1902963) |
| 1.4 | 4.2 | GO:0052047 | interaction with other organism via secreted substance involved in symbiotic interaction(GO:0052047) |
| 1.4 | 21.1 | GO:0090168 | Golgi reassembly(GO:0090168) |
| 1.4 | 8.2 | GO:1902766 | skeletal muscle satellite cell migration(GO:1902766) |
| 1.4 | 5.4 | GO:0031179 | peptide amidation(GO:0001519) protein amidation(GO:0018032) peptide modification(GO:0031179) |
| 1.3 | 102.1 | GO:0033275 | muscle filament sliding(GO:0030049) actin-myosin filament sliding(GO:0033275) |
| 1.3 | 8.0 | GO:0097374 | sensory neuron axon guidance(GO:0097374) |
| 1.3 | 9.3 | GO:0060011 | Sertoli cell proliferation(GO:0060011) |
| 1.3 | 6.4 | GO:0010637 | negative regulation of mitochondrial fusion(GO:0010637) |
| 1.3 | 3.8 | GO:1901301 | regulation of cargo loading into COPII-coated vesicle(GO:1901301) |
| 1.3 | 6.4 | GO:0035105 | sterol regulatory element binding protein import into nucleus(GO:0035105) |
| 1.3 | 3.8 | GO:0098968 | neurotransmitter receptor transport postsynaptic membrane to endosome(GO:0098968) |
| 1.2 | 6.2 | GO:0006436 | tryptophanyl-tRNA aminoacylation(GO:0006436) |
| 1.2 | 6.2 | GO:1902904 | late endosomal microautophagy(GO:0061738) negative regulation of fibril organization(GO:1902904) chaperone-mediated autophagy translocation complex disassembly(GO:1904764) |
| 1.2 | 9.8 | GO:0030497 | fatty acid elongation(GO:0030497) very long-chain fatty acid biosynthetic process(GO:0042761) |
| 1.2 | 4.9 | GO:0015746 | tricarboxylic acid transport(GO:0006842) citrate transport(GO:0015746) |
| 1.2 | 3.6 | GO:0051725 | protein de-ADP-ribosylation(GO:0051725) |
| 1.2 | 8.5 | GO:1905024 | regulation of potassium ion export(GO:1902302) regulation of voltage-gated potassium channel activity involved in ventricular cardiac muscle cell action potential repolarization(GO:1903760) regulation of potassium ion export across plasma membrane(GO:1903764) regulation of membrane repolarization during ventricular cardiac muscle cell action potential(GO:1905024) |
| 1.2 | 8.3 | GO:0061299 | retina vasculature morphogenesis in camera-type eye(GO:0061299) |
| 1.2 | 34.2 | GO:0005980 | glycogen catabolic process(GO:0005980) |
| 1.2 | 18.6 | GO:0043562 | cellular response to nitrogen starvation(GO:0006995) cellular response to nitrogen levels(GO:0043562) |
| 1.1 | 13.8 | GO:0035372 | protein localization to microtubule(GO:0035372) |
| 1.1 | 6.8 | GO:0035803 | egg coat formation(GO:0035803) |
| 1.1 | 1.1 | GO:0060926 | atrioventricular node development(GO:0003162) cardiac pacemaker cell differentiation(GO:0060920) cardiac pacemaker cell development(GO:0060926) |
| 1.1 | 32.7 | GO:0034080 | CENP-A containing nucleosome assembly(GO:0034080) CENP-A containing chromatin organization(GO:0061641) |
| 1.1 | 22.5 | GO:0048853 | forebrain morphogenesis(GO:0048853) |
| 1.1 | 5.6 | GO:1904879 | positive regulation of calcium ion transmembrane transport via high voltage-gated calcium channel(GO:1904879) |
| 1.1 | 2.2 | GO:0060573 | ventral spinal cord interneuron specification(GO:0021521) cell fate specification involved in pattern specification(GO:0060573) |
| 1.1 | 15.4 | GO:0051256 | mitotic spindle midzone assembly(GO:0051256) |
| 1.1 | 10.9 | GO:0030263 | apoptotic chromosome condensation(GO:0030263) |
| 1.1 | 7.5 | GO:0070934 | CRD-mediated mRNA stabilization(GO:0070934) |
| 1.1 | 7.5 | GO:0009597 | detection of virus(GO:0009597) |
| 1.1 | 9.5 | GO:0006268 | DNA unwinding involved in DNA replication(GO:0006268) |
| 1.0 | 5.1 | GO:0046340 | diacylglycerol catabolic process(GO:0046340) |
| 1.0 | 17.3 | GO:0038092 | nodal signaling pathway(GO:0038092) |
| 1.0 | 8.7 | GO:2000622 | regulation of nuclear-transcribed mRNA catabolic process, nonsense-mediated decay(GO:2000622) negative regulation of nuclear-transcribed mRNA catabolic process, nonsense-mediated decay(GO:2000623) |
| 1.0 | 73.4 | GO:0010257 | NADH dehydrogenase complex assembly(GO:0010257) mitochondrial respiratory chain complex I assembly(GO:0032981) mitochondrial respiratory chain complex I biogenesis(GO:0097031) |
| 1.0 | 11.6 | GO:0048194 | Golgi vesicle budding(GO:0048194) |
| 0.9 | 6.6 | GO:0014722 | regulation of skeletal muscle contraction by calcium ion signaling(GO:0014722) |
| 0.9 | 8.5 | GO:0030091 | protein repair(GO:0030091) |
| 0.9 | 18.4 | GO:0008053 | mitochondrial fusion(GO:0008053) |
| 0.9 | 6.4 | GO:0070294 | renal sodium ion absorption(GO:0070294) |
| 0.9 | 3.7 | GO:0019087 | transformation of host cell by virus(GO:0019087) |
| 0.9 | 7.1 | GO:0045905 | translational frameshifting(GO:0006452) positive regulation of translational termination(GO:0045905) |
| 0.9 | 5.3 | GO:0031914 | negative regulation of synaptic plasticity(GO:0031914) |
| 0.9 | 0.9 | GO:0072054 | renal inner medulla development(GO:0072053) renal outer medulla development(GO:0072054) |
| 0.9 | 7.9 | GO:0070933 | histone H4 deacetylation(GO:0070933) |
| 0.9 | 3.5 | GO:1903288 | protein transport into plasma membrane raft(GO:0044861) positive regulation of potassium ion import(GO:1903288) |
| 0.9 | 1.7 | GO:2000466 | negative regulation of glycogen (starch) synthase activity(GO:2000466) |
| 0.8 | 2.5 | GO:0045898 | regulation of RNA polymerase II transcriptional preinitiation complex assembly(GO:0045898) |
| 0.8 | 17.8 | GO:0009263 | deoxyribonucleotide biosynthetic process(GO:0009263) |
| 0.8 | 118.7 | GO:0031424 | keratinization(GO:0031424) |
| 0.8 | 13.0 | GO:0006527 | arginine catabolic process(GO:0006527) |
| 0.8 | 8.0 | GO:0015939 | pantothenate metabolic process(GO:0015939) |
| 0.8 | 5.5 | GO:0006449 | regulation of translational termination(GO:0006449) |
| 0.8 | 4.7 | GO:0001712 | ectodermal cell fate commitment(GO:0001712) |
| 0.8 | 8.5 | GO:0009414 | response to water deprivation(GO:0009414) |
| 0.8 | 10.8 | GO:0043542 | endothelial cell migration(GO:0043542) |
| 0.8 | 32.3 | GO:0050873 | brown fat cell differentiation(GO:0050873) |
| 0.8 | 18.3 | GO:0032201 | telomere maintenance via semi-conservative replication(GO:0032201) |
| 0.8 | 6.1 | GO:0046598 | positive regulation of viral entry into host cell(GO:0046598) |
| 0.7 | 40.6 | GO:0031529 | ruffle organization(GO:0031529) |
| 0.7 | 13.2 | GO:0003334 | keratinocyte development(GO:0003334) |
| 0.7 | 7.2 | GO:0006120 | mitochondrial electron transport, NADH to ubiquinone(GO:0006120) |
| 0.7 | 2.9 | GO:2001271 | negative regulation of cysteine-type endopeptidase activity involved in execution phase of apoptosis(GO:2001271) |
| 0.7 | 4.2 | GO:0072131 | kidney mesenchyme morphogenesis(GO:0072131) metanephric mesenchyme morphogenesis(GO:0072133) |
| 0.7 | 4.2 | GO:0090063 | positive regulation of microtubule nucleation(GO:0090063) |
| 0.7 | 2.8 | GO:0048698 | negative regulation of collateral sprouting in absence of injury(GO:0048698) |
| 0.7 | 2.7 | GO:0003199 | endocardial cushion to mesenchymal transition involved in heart valve formation(GO:0003199) |
| 0.7 | 11.5 | GO:0050774 | negative regulation of dendrite morphogenesis(GO:0050774) |
| 0.7 | 1.3 | GO:0060685 | regulation of prostatic bud formation(GO:0060685) negative regulation of prostatic bud formation(GO:0060686) |
| 0.7 | 6.5 | GO:0070863 | positive regulation of protein exit from endoplasmic reticulum(GO:0070863) |
| 0.6 | 3.8 | GO:0006933 | negative regulation of cell adhesion involved in substrate-bound cell migration(GO:0006933) |
| 0.6 | 16.5 | GO:0006221 | pyrimidine nucleotide biosynthetic process(GO:0006221) |
| 0.6 | 7.6 | GO:0019852 | L-ascorbic acid metabolic process(GO:0019852) |
| 0.6 | 11.9 | GO:0006379 | mRNA cleavage(GO:0006379) |
| 0.6 | 2.5 | GO:0046882 | negative regulation of B cell differentiation(GO:0045578) negative regulation of follicle-stimulating hormone secretion(GO:0046882) |
| 0.6 | 1.9 | GO:0061743 | motor learning(GO:0061743) |
| 0.6 | 1.8 | GO:0006990 | positive regulation of transcription from RNA polymerase II promoter involved in unfolded protein response(GO:0006990) |
| 0.6 | 2.4 | GO:0006051 | mannosamine metabolic process(GO:0006050) N-acetylmannosamine metabolic process(GO:0006051) |
| 0.6 | 4.8 | GO:0002326 | B cell lineage commitment(GO:0002326) immunoglobulin V(D)J recombination(GO:0033152) |
| 0.6 | 1.8 | GO:0048203 | vesicle targeting, trans-Golgi to endosome(GO:0048203) |
| 0.6 | 3.0 | GO:0035063 | nuclear speck organization(GO:0035063) |
| 0.6 | 4.7 | GO:0035608 | protein deglutamylation(GO:0035608) |
| 0.6 | 4.1 | GO:1903690 | negative regulation of wound healing, spreading of epidermal cells(GO:1903690) |
| 0.6 | 33.4 | GO:0006378 | mRNA polyadenylation(GO:0006378) |
| 0.6 | 1.8 | GO:0019858 | cytosine metabolic process(GO:0019858) |
| 0.6 | 4.7 | GO:0002036 | regulation of L-glutamate transport(GO:0002036) |
| 0.6 | 5.2 | GO:0021520 | spinal cord motor neuron cell fate specification(GO:0021520) |
| 0.6 | 9.3 | GO:0045116 | protein neddylation(GO:0045116) |
| 0.6 | 4.6 | GO:0006206 | pyrimidine nucleobase metabolic process(GO:0006206) |
| 0.6 | 9.1 | GO:0032780 | negative regulation of ATPase activity(GO:0032780) |
| 0.6 | 5.1 | GO:0010571 | positive regulation of nuclear cell cycle DNA replication(GO:0010571) |
| 0.6 | 5.0 | GO:0009249 | protein lipoylation(GO:0009249) |
| 0.5 | 2.7 | GO:1904075 | trophectodermal cell proliferation(GO:0001834) regulation of trophectodermal cell proliferation(GO:1904073) positive regulation of trophectodermal cell proliferation(GO:1904075) |
| 0.5 | 5.4 | GO:0031848 | protection from non-homologous end joining at telomere(GO:0031848) |
| 0.5 | 2.1 | GO:0002572 | pro-T cell differentiation(GO:0002572) |
| 0.5 | 44.2 | GO:0032392 | DNA geometric change(GO:0032392) |
| 0.5 | 3.7 | GO:0035331 | negative regulation of hippo signaling(GO:0035331) |
| 0.5 | 6.8 | GO:0043568 | positive regulation of insulin-like growth factor receptor signaling pathway(GO:0043568) |
| 0.5 | 6.3 | GO:0030050 | vesicle transport along actin filament(GO:0030050) |
| 0.5 | 30.7 | GO:0018279 | protein N-linked glycosylation via asparagine(GO:0018279) |
| 0.5 | 19.2 | GO:0000188 | inactivation of MAPK activity(GO:0000188) |
| 0.5 | 1.6 | GO:0002874 | regulation of chronic inflammatory response to antigenic stimulus(GO:0002874) |
| 0.5 | 7.1 | GO:0034063 | stress granule assembly(GO:0034063) |
| 0.5 | 14.6 | GO:1904376 | negative regulation of protein localization to plasma membrane(GO:1903077) negative regulation of protein localization to cell periphery(GO:1904376) |
| 0.5 | 36.2 | GO:0070125 | mitochondrial translational elongation(GO:0070125) mitochondrial translational termination(GO:0070126) |
| 0.5 | 1.5 | GO:0065001 | specification of axis polarity(GO:0065001) negative regulation of tooth mineralization(GO:0070171) |
| 0.5 | 6.0 | GO:0048311 | mitochondrion distribution(GO:0048311) |
| 0.5 | 12.9 | GO:0002089 | lens morphogenesis in camera-type eye(GO:0002089) |
| 0.5 | 11.5 | GO:0007216 | G-protein coupled glutamate receptor signaling pathway(GO:0007216) |
| 0.5 | 2.9 | GO:0006499 | N-terminal protein myristoylation(GO:0006499) |
| 0.5 | 1.9 | GO:0006432 | phenylalanyl-tRNA aminoacylation(GO:0006432) |
| 0.5 | 2.4 | GO:0098903 | regulation of membrane repolarization during action potential(GO:0098903) |
| 0.5 | 1.4 | GO:0060437 | lung growth(GO:0060437) |
| 0.5 | 5.1 | GO:0008298 | intracellular mRNA localization(GO:0008298) |
| 0.5 | 9.2 | GO:0000002 | mitochondrial genome maintenance(GO:0000002) |
| 0.5 | 11.1 | GO:0046716 | muscle cell cellular homeostasis(GO:0046716) |
| 0.5 | 4.6 | GO:0038203 | TORC2 signaling(GO:0038203) |
| 0.4 | 1.8 | GO:0006382 | adenosine to inosine editing(GO:0006382) |
| 0.4 | 1.8 | GO:1902715 | positive regulation of interferon-gamma secretion(GO:1902715) |
| 0.4 | 14.3 | GO:0009250 | glycogen biosynthetic process(GO:0005978) glucan biosynthetic process(GO:0009250) |
| 0.4 | 8.2 | GO:0045199 | maintenance of apical/basal cell polarity(GO:0035090) maintenance of epithelial cell apical/basal polarity(GO:0045199) |
| 0.4 | 18.9 | GO:2000144 | positive regulation of DNA-templated transcription, initiation(GO:2000144) |
| 0.4 | 1.3 | GO:0014724 | regulation of twitch skeletal muscle contraction(GO:0014724) regulation of fast-twitch skeletal muscle fiber contraction(GO:0031446) positive regulation of fast-twitch skeletal muscle fiber contraction(GO:0031448) |
| 0.4 | 5.1 | GO:0048096 | chromatin-mediated maintenance of transcription(GO:0048096) |
| 0.4 | 3.4 | GO:0048563 | post-embryonic organ morphogenesis(GO:0048563) |
| 0.4 | 13.1 | GO:0006370 | 7-methylguanosine mRNA capping(GO:0006370) |
| 0.4 | 1.7 | GO:0010982 | regulation of high-density lipoprotein particle clearance(GO:0010982) positive regulation of lipoprotein particle clearance(GO:0010986) |
| 0.4 | 7.1 | GO:0036295 | cellular response to increased oxygen levels(GO:0036295) |
| 0.4 | 13.5 | GO:0070979 | protein K11-linked ubiquitination(GO:0070979) |
| 0.4 | 12.3 | GO:0048255 | mRNA stabilization(GO:0048255) |
| 0.4 | 1.5 | GO:1900193 | regulation of oocyte maturation(GO:1900193) negative regulation of oocyte maturation(GO:1900194) |
| 0.4 | 3.1 | GO:0075525 | viral translational termination-reinitiation(GO:0075525) |
| 0.4 | 16.0 | GO:0070534 | protein K63-linked ubiquitination(GO:0070534) |
| 0.4 | 1.5 | GO:0097210 | cellular response to cocaine(GO:0071314) response to gonadotropin-releasing hormone(GO:0097210) cellular response to gonadotropin-releasing hormone(GO:0097211) |
| 0.4 | 8.1 | GO:0031581 | hemidesmosome assembly(GO:0031581) |
| 0.4 | 1.5 | GO:0061009 | common bile duct development(GO:0061009) |
| 0.4 | 2.9 | GO:2000210 | positive regulation of anoikis(GO:2000210) |
| 0.4 | 0.7 | GO:0051835 | positive regulation of synapse structural plasticity(GO:0051835) |
| 0.4 | 1.8 | GO:0001315 | age-dependent response to oxidative stress(GO:0001306) age-dependent response to reactive oxygen species(GO:0001315) regulation of systemic arterial blood pressure by acetylcholine(GO:0003068) vasodilation by acetylcholine involved in regulation of systemic arterial blood pressure(GO:0003069) regulation of systemic arterial blood pressure by neurotransmitter(GO:0003070) age-dependent general metabolic decline(GO:0007571) |
| 0.4 | 1.1 | GO:0030222 | eosinophil differentiation(GO:0030222) |
| 0.4 | 2.5 | GO:0060484 | lung-associated mesenchyme development(GO:0060484) |
| 0.3 | 2.4 | GO:2000503 | positive regulation of natural killer cell chemotaxis(GO:2000503) |
| 0.3 | 5.5 | GO:0045723 | positive regulation of fatty acid biosynthetic process(GO:0045723) |
| 0.3 | 21.4 | GO:0045454 | cell redox homeostasis(GO:0045454) |
| 0.3 | 1.4 | GO:0060040 | retinal bipolar neuron differentiation(GO:0060040) |
| 0.3 | 2.4 | GO:0032808 | lacrimal gland development(GO:0032808) |
| 0.3 | 3.7 | GO:0001915 | negative regulation of T cell mediated cytotoxicity(GO:0001915) |
| 0.3 | 7.4 | GO:0008631 | intrinsic apoptotic signaling pathway in response to oxidative stress(GO:0008631) |
| 0.3 | 3.7 | GO:0019321 | pentose metabolic process(GO:0019321) |
| 0.3 | 12.1 | GO:0015804 | neutral amino acid transport(GO:0015804) |
| 0.3 | 0.7 | GO:0007621 | negative regulation of female receptivity(GO:0007621) female courtship behavior(GO:0008050) |
| 0.3 | 1.6 | GO:0030200 | heparan sulfate proteoglycan catabolic process(GO:0030200) |
| 0.3 | 6.1 | GO:0032060 | bleb assembly(GO:0032060) |
| 0.3 | 2.8 | GO:0006552 | leucine catabolic process(GO:0006552) |
| 0.3 | 43.2 | GO:0043488 | regulation of mRNA stability(GO:0043488) |
| 0.3 | 0.9 | GO:0001826 | inner cell mass cell differentiation(GO:0001826) |
| 0.3 | 6.2 | GO:0007095 | mitotic G2 DNA damage checkpoint(GO:0007095) |
| 0.3 | 1.2 | GO:0060849 | radial pattern formation(GO:0009956) regulation of transcription involved in lymphatic endothelial cell fate commitment(GO:0060849) |
| 0.3 | 1.5 | GO:1902952 | positive regulation of dendritic spine maintenance(GO:1902952) |
| 0.3 | 0.9 | GO:0002331 | pre-B cell differentiation(GO:0002329) pre-B cell allelic exclusion(GO:0002331) |
| 0.3 | 0.9 | GO:0060152 | peroxisome localization(GO:0060151) microtubule-based peroxisome localization(GO:0060152) |
| 0.3 | 2.1 | GO:0043569 | negative regulation of insulin-like growth factor receptor signaling pathway(GO:0043569) |
| 0.3 | 6.2 | GO:0051491 | positive regulation of filopodium assembly(GO:0051491) |
| 0.3 | 25.3 | GO:0006261 | DNA-dependent DNA replication(GO:0006261) |
| 0.3 | 2.1 | GO:0071386 | cellular response to corticosterone stimulus(GO:0071386) |
| 0.3 | 2.6 | GO:0034975 | protein folding in endoplasmic reticulum(GO:0034975) |
| 0.3 | 7.9 | GO:0000083 | regulation of transcription involved in G1/S transition of mitotic cell cycle(GO:0000083) |
| 0.3 | 8.2 | GO:0045672 | positive regulation of osteoclast differentiation(GO:0045672) |
| 0.3 | 0.8 | GO:0018894 | dibenzo-p-dioxin metabolic process(GO:0018894) cellular response to luteinizing hormone stimulus(GO:0071373) |
| 0.3 | 3.8 | GO:0035020 | regulation of Rac protein signal transduction(GO:0035020) |
| 0.3 | 5.1 | GO:1902166 | negative regulation of intrinsic apoptotic signaling pathway in response to DNA damage by p53 class mediator(GO:1902166) |
| 0.3 | 16.8 | GO:0045540 | regulation of cholesterol biosynthetic process(GO:0045540) |
| 0.3 | 11.6 | GO:0010862 | positive regulation of pathway-restricted SMAD protein phosphorylation(GO:0010862) |
| 0.3 | 2.4 | GO:0048702 | embryonic neurocranium morphogenesis(GO:0048702) |
| 0.3 | 9.9 | GO:0035329 | hippo signaling(GO:0035329) |
| 0.3 | 22.1 | GO:0048207 | vesicle coating(GO:0006901) vesicle targeting, rough ER to cis-Golgi(GO:0048207) COPII vesicle coating(GO:0048208) |
| 0.3 | 4.8 | GO:0000185 | activation of MAPKKK activity(GO:0000185) |
| 0.3 | 2.8 | GO:0035095 | behavioral response to nicotine(GO:0035095) |
| 0.2 | 6.9 | GO:1901687 | glutathione derivative metabolic process(GO:1901685) glutathione derivative biosynthetic process(GO:1901687) |
| 0.2 | 1.0 | GO:0045743 | positive regulation of fibroblast growth factor receptor signaling pathway(GO:0045743) |
| 0.2 | 1.4 | GO:0008582 | regulation of synaptic growth at neuromuscular junction(GO:0008582) |
| 0.2 | 5.3 | GO:1902857 | positive regulation of nonmotile primary cilium assembly(GO:1902857) |
| 0.2 | 2.4 | GO:0060576 | intestinal epithelial cell development(GO:0060576) |
| 0.2 | 6.2 | GO:0045103 | intermediate filament-based process(GO:0045103) |
| 0.2 | 2.8 | GO:0008635 | activation of cysteine-type endopeptidase activity involved in apoptotic process by cytochrome c(GO:0008635) |
| 0.2 | 1.4 | GO:0071105 | response to interleukin-11(GO:0071105) |
| 0.2 | 1.1 | GO:0021553 | olfactory nerve development(GO:0021553) |
| 0.2 | 0.9 | GO:0006183 | GTP biosynthetic process(GO:0006183) |
| 0.2 | 8.5 | GO:0000462 | maturation of SSU-rRNA from tricistronic rRNA transcript (SSU-rRNA, 5.8S rRNA, LSU-rRNA)(GO:0000462) |
| 0.2 | 2.6 | GO:0030854 | positive regulation of granulocyte differentiation(GO:0030854) |
| 0.2 | 1.7 | GO:0035269 | protein O-linked mannosylation(GO:0035269) |
| 0.2 | 3.6 | GO:0097062 | dendritic spine maintenance(GO:0097062) |
| 0.2 | 4.2 | GO:0043388 | positive regulation of DNA binding(GO:0043388) |
| 0.2 | 1.1 | GO:0046322 | negative regulation of fatty acid oxidation(GO:0046322) |
| 0.2 | 1.1 | GO:0043353 | enucleate erythrocyte differentiation(GO:0043353) |
| 0.2 | 4.7 | GO:0036150 | phosphatidylserine acyl-chain remodeling(GO:0036150) |
| 0.2 | 3.4 | GO:0031063 | regulation of histone deacetylation(GO:0031063) |
| 0.2 | 4.9 | GO:0035025 | positive regulation of Rho protein signal transduction(GO:0035025) |
| 0.2 | 0.4 | GO:0043302 | positive regulation of myeloid leukocyte mediated immunity(GO:0002888) positive regulation of mast cell activation involved in immune response(GO:0033008) positive regulation of leukocyte degranulation(GO:0043302) positive regulation of mast cell degranulation(GO:0043306) |
| 0.2 | 1.2 | GO:0071257 | cellular response to electrical stimulus(GO:0071257) |
| 0.2 | 1.6 | GO:0031442 | positive regulation of mRNA 3'-end processing(GO:0031442) regulation of nuclear-transcribed mRNA poly(A) tail shortening(GO:0060211) positive regulation of nuclear-transcribed mRNA poly(A) tail shortening(GO:0060213) |
| 0.2 | 0.6 | GO:0006419 | alanyl-tRNA aminoacylation(GO:0006419) |
| 0.2 | 2.2 | GO:0043586 | tongue development(GO:0043586) |
| 0.2 | 22.4 | GO:0006364 | rRNA processing(GO:0006364) |
| 0.2 | 0.5 | GO:1904647 | response to rotenone(GO:1904647) |
| 0.2 | 0.5 | GO:0021514 | ventral spinal cord interneuron differentiation(GO:0021514) |
| 0.2 | 5.6 | GO:0070884 | regulation of calcineurin-NFAT signaling cascade(GO:0070884) |
| 0.2 | 6.4 | GO:0000413 | protein peptidyl-prolyl isomerization(GO:0000413) |
| 0.2 | 7.3 | GO:0000186 | activation of MAPKK activity(GO:0000186) |
| 0.2 | 0.9 | GO:0061086 | negative regulation of histone H3-K27 methylation(GO:0061086) positive regulation of histone H3-K27 methylation(GO:0061087) |
| 0.2 | 2.3 | GO:0090231 | regulation of spindle checkpoint(GO:0090231) |
| 0.2 | 0.5 | GO:2000860 | positive regulation of mineralocorticoid secretion(GO:2000857) positive regulation of aldosterone secretion(GO:2000860) |
| 0.2 | 1.2 | GO:0019317 | fucose catabolic process(GO:0019317) L-fucose metabolic process(GO:0042354) L-fucose catabolic process(GO:0042355) |
| 0.1 | 0.4 | GO:0090362 | positive regulation of platelet-derived growth factor production(GO:0090362) |
| 0.1 | 0.3 | GO:0021557 | oculomotor nerve development(GO:0021557) oculomotor nerve morphogenesis(GO:0021622) oculomotor nerve formation(GO:0021623) |
| 0.1 | 1.3 | GO:0048672 | positive regulation of collateral sprouting(GO:0048672) |
| 0.1 | 1.0 | GO:0006296 | nucleotide-excision repair, DNA incision, 5'-to lesion(GO:0006296) |
| 0.1 | 0.7 | GO:0008588 | release of cytoplasmic sequestered NF-kappaB(GO:0008588) |
| 0.1 | 0.9 | GO:0072718 | response to cisplatin(GO:0072718) |
| 0.1 | 0.4 | GO:1900383 | regulation of synaptic plasticity by receptor localization to synapse(GO:1900383) |
| 0.1 | 2.2 | GO:0046341 | CDP-diacylglycerol metabolic process(GO:0046341) |
| 0.1 | 1.4 | GO:1900017 | positive regulation of cytokine production involved in inflammatory response(GO:1900017) |
| 0.1 | 1.7 | GO:2000279 | negative regulation of DNA biosynthetic process(GO:2000279) |
| 0.1 | 2.5 | GO:0045773 | positive regulation of axon extension(GO:0045773) |
| 0.1 | 0.4 | GO:0048539 | bone marrow development(GO:0048539) |
| 0.1 | 2.1 | GO:0045292 | mRNA cis splicing, via spliceosome(GO:0045292) |
| 0.1 | 1.0 | GO:0090527 | actin filament reorganization(GO:0090527) |
| 0.1 | 1.1 | GO:0030202 | heparin metabolic process(GO:0030202) heparin biosynthetic process(GO:0030210) |
| 0.1 | 1.5 | GO:0032897 | negative regulation of viral transcription(GO:0032897) |
| 0.1 | 2.7 | GO:0007131 | reciprocal meiotic recombination(GO:0007131) reciprocal DNA recombination(GO:0035825) |
| 0.1 | 0.6 | GO:0070257 | positive regulation of mucus secretion(GO:0070257) |
| 0.1 | 25.6 | GO:0006413 | translational initiation(GO:0006413) |
| 0.1 | 1.4 | GO:0034724 | DNA replication-independent nucleosome assembly(GO:0006336) DNA replication-independent nucleosome organization(GO:0034724) |
| 0.1 | 1.3 | GO:0071803 | positive regulation of podosome assembly(GO:0071803) |
| 0.1 | 5.6 | GO:0050771 | negative regulation of axonogenesis(GO:0050771) |
| 0.1 | 5.5 | GO:0006749 | glutathione metabolic process(GO:0006749) |
| 0.1 | 3.2 | GO:1901385 | regulation of voltage-gated calcium channel activity(GO:1901385) |
| 0.1 | 0.4 | GO:1904706 | negative regulation of vascular smooth muscle cell proliferation(GO:1904706) |
| 0.1 | 0.9 | GO:0010801 | negative regulation of peptidyl-threonine phosphorylation(GO:0010801) |
| 0.1 | 0.7 | GO:0070373 | negative regulation of ERK1 and ERK2 cascade(GO:0070373) |
| 0.1 | 1.1 | GO:0097320 | membrane tubulation(GO:0097320) |
| 0.1 | 1.8 | GO:0006369 | termination of RNA polymerase II transcription(GO:0006369) |
| 0.1 | 4.3 | GO:0071349 | interleukin-12-mediated signaling pathway(GO:0035722) cellular response to interleukin-12(GO:0071349) |
| 0.1 | 1.2 | GO:0045214 | sarcomere organization(GO:0045214) |
| 0.1 | 1.6 | GO:0030042 | actin filament depolymerization(GO:0030042) |
| 0.1 | 1.3 | GO:0048935 | peripheral nervous system neuron differentiation(GO:0048934) peripheral nervous system neuron development(GO:0048935) |
| 0.1 | 1.6 | GO:0030252 | growth hormone secretion(GO:0030252) |
| 0.1 | 0.7 | GO:0042593 | carbohydrate homeostasis(GO:0033500) glucose homeostasis(GO:0042593) |
| 0.1 | 1.7 | GO:0051642 | centrosome localization(GO:0051642) |
| 0.1 | 0.3 | GO:0007023 | post-chaperonin tubulin folding pathway(GO:0007023) |
| 0.1 | 4.6 | GO:1902017 | regulation of cilium assembly(GO:1902017) |
| 0.1 | 1.8 | GO:0010972 | negative regulation of G2/M transition of mitotic cell cycle(GO:0010972) |
| 0.1 | 3.0 | GO:0007157 | heterophilic cell-cell adhesion via plasma membrane cell adhesion molecules(GO:0007157) |
| 0.1 | 1.0 | GO:0030705 | cytoskeleton-dependent intracellular transport(GO:0030705) |
| 0.1 | 0.1 | GO:0010897 | negative regulation of triglyceride catabolic process(GO:0010897) secretory granule localization(GO:0032252) negative regulation of triglyceride metabolic process(GO:0090209) |
| 0.1 | 1.5 | GO:0006622 | protein targeting to lysosome(GO:0006622) |
| 0.1 | 1.0 | GO:0030521 | androgen receptor signaling pathway(GO:0030521) |
| 0.1 | 0.5 | GO:0015865 | purine nucleotide transport(GO:0015865) purine ribonucleotide transport(GO:0015868) |
| 0.1 | 0.2 | GO:0055059 | asymmetric neuroblast division(GO:0055059) |
| 0.1 | 0.5 | GO:0007175 | negative regulation of epidermal growth factor-activated receptor activity(GO:0007175) |
| 0.1 | 2.0 | GO:0001960 | negative regulation of cytokine-mediated signaling pathway(GO:0001960) |
| 0.1 | 0.2 | GO:0018352 | glutamate decarboxylation to succinate(GO:0006540) protein-pyridoxal-5-phosphate linkage(GO:0018352) |
| 0.1 | 0.8 | GO:0045663 | positive regulation of myoblast differentiation(GO:0045663) |
| 0.1 | 0.7 | GO:0032801 | receptor catabolic process(GO:0032801) |
| 0.1 | 0.4 | GO:0007064 | mitotic sister chromatid cohesion(GO:0007064) |
| 0.1 | 1.9 | GO:0048384 | retinoic acid receptor signaling pathway(GO:0048384) |
| 0.0 | 2.2 | GO:0006383 | transcription from RNA polymerase III promoter(GO:0006383) |
| 0.0 | 0.3 | GO:0071107 | response to parathyroid hormone(GO:0071107) cellular response to parathyroid hormone stimulus(GO:0071374) |
| 0.0 | 1.0 | GO:0034629 | cellular protein complex localization(GO:0034629) |
| 0.0 | 0.1 | GO:0016559 | peroxisome fission(GO:0016559) |
| 0.0 | 0.6 | GO:0051865 | protein autoubiquitination(GO:0051865) |
| 0.0 | 12.2 | GO:0043687 | post-translational protein modification(GO:0043687) |
| 0.0 | 0.2 | GO:0002457 | T cell antigen processing and presentation(GO:0002457) |
| 0.0 | 0.5 | GO:0003416 | endochondral bone growth(GO:0003416) |
| 0.0 | 0.5 | GO:0060732 | positive regulation of inositol phosphate biosynthetic process(GO:0060732) |
| 0.0 | 0.4 | GO:0006853 | carnitine shuttle(GO:0006853) |
| 0.0 | 0.2 | GO:1902222 | L-phenylalanine metabolic process(GO:0006558) L-phenylalanine catabolic process(GO:0006559) erythrose 4-phosphate/phosphoenolpyruvate family amino acid metabolic process(GO:1902221) erythrose 4-phosphate/phosphoenolpyruvate family amino acid catabolic process(GO:1902222) |
| 0.0 | 1.6 | GO:0021510 | spinal cord development(GO:0021510) |
| 0.0 | 0.5 | GO:0034390 | smooth muscle cell apoptotic process(GO:0034390) regulation of smooth muscle cell apoptotic process(GO:0034391) |
| 0.0 | 2.1 | GO:0010389 | regulation of G2/M transition of mitotic cell cycle(GO:0010389) |
| 0.0 | 0.1 | GO:0035635 | entry of bacterium into host cell(GO:0035635) |
| 0.0 | 0.4 | GO:0043011 | myeloid dendritic cell differentiation(GO:0043011) |
| 0.0 | 0.4 | GO:0046856 | phosphatidylinositol dephosphorylation(GO:0046856) |
| 0.0 | 1.0 | GO:0043647 | inositol phosphate metabolic process(GO:0043647) |
| 0.0 | 0.1 | GO:0042118 | endothelial cell activation(GO:0042118) |
| 0.0 | 0.2 | GO:0016180 | snRNA processing(GO:0016180) |
| 0.0 | 0.8 | GO:0007368 | determination of left/right symmetry(GO:0007368) |
| 0.0 | 0.7 | GO:0042147 | retrograde transport, endosome to Golgi(GO:0042147) |
| 0.0 | 0.3 | GO:0042398 | cellular modified amino acid biosynthetic process(GO:0042398) |
| 0.0 | 2.7 | GO:0016042 | lipid catabolic process(GO:0016042) |
| 0.0 | 0.5 | GO:0065002 | intracellular protein transmembrane transport(GO:0065002) |
| 0.0 | 0.2 | GO:0009409 | response to cold(GO:0009409) |
| 0.0 | 1.6 | GO:0006457 | protein folding(GO:0006457) |
Gene overrepresentation in cellular_component category:
| Log-likelihood per target | Total log-likelihood | Term | Description |
|---|---|---|---|
| 10.4 | 41.4 | GO:0030915 | Smc5-Smc6 complex(GO:0030915) |
| 7.3 | 36.4 | GO:1990393 | 3M complex(GO:1990393) |
| 6.2 | 30.9 | GO:0045323 | interleukin-1 receptor complex(GO:0045323) |
| 5.5 | 32.7 | GO:0097129 | cyclin D2-CDK4 complex(GO:0097129) |
| 4.5 | 84.8 | GO:0005862 | muscle thin filament tropomyosin(GO:0005862) |
| 4.4 | 17.8 | GO:0005971 | ribonucleoside-diphosphate reductase complex(GO:0005971) |
| 4.4 | 21.8 | GO:0097149 | centralspindlin complex(GO:0097149) |
| 4.1 | 49.7 | GO:0097487 | multivesicular body, internal vesicle(GO:0097487) |
| 3.8 | 19.1 | GO:1990425 | ryanodine receptor complex(GO:1990425) |
| 3.2 | 16.0 | GO:0034457 | Mpp10 complex(GO:0034457) |
| 3.1 | 44.0 | GO:0034098 | VCP-NPL4-UFD1 AAA ATPase complex(GO:0034098) |
| 2.8 | 19.4 | GO:0070852 | cell body fiber(GO:0070852) |
| 2.8 | 19.4 | GO:0072669 | tRNA-splicing ligase complex(GO:0072669) |
| 2.6 | 18.4 | GO:0061617 | MICOS complex(GO:0061617) |
| 2.6 | 116.2 | GO:0045095 | keratin filament(GO:0045095) |
| 2.4 | 26.4 | GO:0005614 | interstitial matrix(GO:0005614) |
| 2.2 | 12.9 | GO:0031390 | Ctf18 RFC-like complex(GO:0031390) |
| 2.0 | 6.1 | GO:0016222 | procollagen-proline 4-dioxygenase complex(GO:0016222) |
| 2.0 | 17.8 | GO:0071541 | eukaryotic translation initiation factor 3 complex, eIF3m(GO:0071541) |
| 1.9 | 9.3 | GO:0097513 | myosin II filament(GO:0097513) |
| 1.8 | 12.3 | GO:0098575 | lumenal side of lysosomal membrane(GO:0098575) |
| 1.7 | 6.7 | GO:0043625 | delta DNA polymerase complex(GO:0043625) |
| 1.7 | 8.4 | GO:0034388 | Pwp2p-containing subcomplex of 90S preribosome(GO:0034388) |
| 1.7 | 5.0 | GO:0005960 | glycine cleavage complex(GO:0005960) |
| 1.7 | 9.9 | GO:0070381 | endosome to plasma membrane transport vesicle(GO:0070381) |
| 1.6 | 6.3 | GO:0043259 | laminin-1 complex(GO:0005606) laminin-10 complex(GO:0043259) laminin-11 complex(GO:0043260) |
| 1.5 | 15.3 | GO:0042587 | glycogen granule(GO:0042587) PTW/PP1 phosphatase complex(GO:0072357) |
| 1.4 | 20.2 | GO:0030663 | COPI-coated vesicle membrane(GO:0030663) |
| 1.3 | 10.4 | GO:0005786 | signal recognition particle, endoplasmic reticulum targeting(GO:0005786) |
| 1.2 | 3.6 | GO:0034667 | integrin alpha3-beta1 complex(GO:0034667) |
| 1.2 | 10.9 | GO:0061574 | ASAP complex(GO:0061574) |
| 1.2 | 45.7 | GO:0000421 | autophagosome membrane(GO:0000421) |
| 1.2 | 10.7 | GO:0005638 | lamin filament(GO:0005638) |
| 1.2 | 22.2 | GO:0031597 | cytosolic proteasome complex(GO:0031597) |
| 1.1 | 2.2 | GO:0005826 | actomyosin contractile ring(GO:0005826) |
| 1.1 | 5.4 | GO:1902937 | inward rectifier potassium channel complex(GO:1902937) |
| 1.1 | 6.3 | GO:0008537 | proteasome activator complex(GO:0008537) |
| 1.0 | 12.1 | GO:0060293 | P granule(GO:0043186) pole plasm(GO:0045495) germ plasm(GO:0060293) |
| 1.0 | 10.1 | GO:0008541 | proteasome regulatory particle, lid subcomplex(GO:0008541) |
| 1.0 | 7.9 | GO:0031931 | TORC1 complex(GO:0031931) |
| 1.0 | 16.5 | GO:0034709 | methylosome(GO:0034709) |
| 1.0 | 3.8 | GO:0032937 | SREBP-SCAP-Insig complex(GO:0032937) |
| 1.0 | 14.3 | GO:0005641 | nuclear envelope lumen(GO:0005641) |
| 0.9 | 7.5 | GO:0071204 | histone pre-mRNA 3'end processing complex(GO:0071204) |
| 0.9 | 24.1 | GO:0035098 | ESC/E(Z) complex(GO:0035098) |
| 0.9 | 6.4 | GO:0033269 | internode region of axon(GO:0033269) |
| 0.9 | 5.3 | GO:1990584 | cardiac Troponin complex(GO:1990584) |
| 0.9 | 11.3 | GO:0042555 | MCM complex(GO:0042555) |
| 0.9 | 12.8 | GO:0005689 | U12-type spliceosomal complex(GO:0005689) |
| 0.8 | 2.5 | GO:0043511 | inhibin complex(GO:0043511) inhibin A complex(GO:0043512) |
| 0.8 | 57.9 | GO:0032154 | cleavage furrow(GO:0032154) cell surface furrow(GO:0097610) |
| 0.8 | 19.9 | GO:0005666 | DNA-directed RNA polymerase III complex(GO:0005666) |
| 0.8 | 11.0 | GO:0031618 | nuclear pericentric heterochromatin(GO:0031618) |
| 0.8 | 3.8 | GO:0034750 | Scrib-APC-beta-catenin complex(GO:0034750) |
| 0.8 | 6.8 | GO:0019907 | cyclin-dependent protein kinase activating kinase holoenzyme complex(GO:0019907) |
| 0.7 | 20.7 | GO:0005680 | anaphase-promoting complex(GO:0005680) |
| 0.7 | 1.5 | GO:0034751 | aryl hydrocarbon receptor complex(GO:0034751) |
| 0.7 | 9.3 | GO:0097136 | Bcl-2 family protein complex(GO:0097136) |
| 0.7 | 8.5 | GO:0043219 | lateral loop(GO:0043219) |
| 0.7 | 2.0 | GO:0002139 | stereocilia coupling link(GO:0002139) |
| 0.7 | 5.9 | GO:0032059 | bleb(GO:0032059) |
| 0.7 | 45.1 | GO:0000313 | organellar ribosome(GO:0000313) mitochondrial ribosome(GO:0005761) |
| 0.6 | 5.1 | GO:0030134 | ER to Golgi transport vesicle(GO:0030134) |
| 0.6 | 7.4 | GO:0005642 | annulate lamellae(GO:0005642) |
| 0.6 | 7.9 | GO:0005840 | ribosome(GO:0005840) |
| 0.6 | 1.8 | GO:0036396 | MIS complex(GO:0036396) mRNA editing complex(GO:0045293) |
| 0.6 | 13.0 | GO:0016281 | eukaryotic translation initiation factor 4F complex(GO:0016281) |
| 0.6 | 31.4 | GO:0009295 | nucleoid(GO:0009295) mitochondrial nucleoid(GO:0042645) |
| 0.6 | 2.8 | GO:0002169 | 3-methylcrotonyl-CoA carboxylase complex, mitochondrial(GO:0002169) methylcrotonoyl-CoA carboxylase complex(GO:1905202) |
| 0.6 | 28.3 | GO:0045171 | intercellular bridge(GO:0045171) |
| 0.5 | 7.6 | GO:0005833 | hemoglobin complex(GO:0005833) |
| 0.5 | 7.2 | GO:0005751 | mitochondrial respiratory chain complex IV(GO:0005751) |
| 0.5 | 11.3 | GO:0043205 | microfibril(GO:0001527) fibril(GO:0043205) |
| 0.5 | 5.0 | GO:0045180 | basal cortex(GO:0045180) |
| 0.5 | 95.0 | GO:1904813 | ficolin-1-rich granule(GO:0101002) ficolin-1-rich granule lumen(GO:1904813) |
| 0.5 | 7.3 | GO:0030122 | AP-2 adaptor complex(GO:0030122) |
| 0.5 | 9.1 | GO:0005665 | DNA-directed RNA polymerase II, core complex(GO:0005665) |
| 0.5 | 4.3 | GO:0005955 | calcineurin complex(GO:0005955) |
| 0.5 | 4.3 | GO:0042567 | insulin-like growth factor ternary complex(GO:0042567) |
| 0.5 | 8.3 | GO:0005861 | troponin complex(GO:0005861) |
| 0.4 | 4.6 | GO:0031932 | TORC2 complex(GO:0031932) |
| 0.4 | 66.1 | GO:0000922 | spindle pole(GO:0000922) |
| 0.4 | 3.7 | GO:0031362 | anchored component of external side of plasma membrane(GO:0031362) |
| 0.4 | 2.8 | GO:0005610 | laminin-5 complex(GO:0005610) |
| 0.4 | 6.6 | GO:1990124 | messenger ribonucleoprotein complex(GO:1990124) |
| 0.4 | 4.3 | GO:0097443 | sorting endosome(GO:0097443) |
| 0.4 | 0.8 | GO:0017146 | NMDA selective glutamate receptor complex(GO:0017146) |
| 0.4 | 14.9 | GO:0043596 | nuclear replication fork(GO:0043596) |
| 0.4 | 4.3 | GO:1990454 | L-type voltage-gated calcium channel complex(GO:1990454) |
| 0.4 | 4.2 | GO:0005577 | fibrinogen complex(GO:0005577) |
| 0.4 | 7.0 | GO:0032433 | filopodium tip(GO:0032433) |
| 0.4 | 4.9 | GO:0031105 | septin complex(GO:0031105) |
| 0.3 | 22.4 | GO:0005747 | mitochondrial respiratory chain complex I(GO:0005747) NADH dehydrogenase complex(GO:0030964) respiratory chain complex I(GO:0045271) |
| 0.3 | 24.1 | GO:0016459 | myosin complex(GO:0016459) |
| 0.3 | 3.8 | GO:0005664 | origin recognition complex(GO:0000808) nuclear origin of replication recognition complex(GO:0005664) |
| 0.3 | 23.7 | GO:0000777 | condensed chromosome kinetochore(GO:0000777) |
| 0.3 | 12.8 | GO:0002102 | podosome(GO:0002102) |
| 0.3 | 1.6 | GO:0031143 | pseudopodium(GO:0031143) |
| 0.3 | 7.1 | GO:0016471 | vacuolar proton-transporting V-type ATPase complex(GO:0016471) |
| 0.3 | 4.4 | GO:0000124 | SAGA complex(GO:0000124) |
| 0.3 | 44.2 | GO:0005795 | Golgi stack(GO:0005795) |
| 0.3 | 2.6 | GO:0072546 | ER membrane protein complex(GO:0072546) |
| 0.3 | 20.5 | GO:0033116 | endoplasmic reticulum-Golgi intermediate compartment membrane(GO:0033116) |
| 0.3 | 5.9 | GO:0031307 | integral component of mitochondrial outer membrane(GO:0031307) |
| 0.3 | 4.2 | GO:0043234 | protein complex(GO:0043234) |
| 0.3 | 20.1 | GO:0097517 | stress fiber(GO:0001725) contractile actin filament bundle(GO:0097517) |
| 0.3 | 1.5 | GO:0000306 | extrinsic component of vacuolar membrane(GO:0000306) extrinsic component of endosome membrane(GO:0031313) |
| 0.2 | 5.2 | GO:0031305 | intrinsic component of mitochondrial inner membrane(GO:0031304) integral component of mitochondrial inner membrane(GO:0031305) |
| 0.2 | 0.5 | GO:0014802 | terminal cisterna(GO:0014802) |
| 0.2 | 0.7 | GO:1990851 | Wnt-Frizzled-LRP5/6 complex(GO:1990851) |
| 0.2 | 5.1 | GO:0030867 | rough endoplasmic reticulum membrane(GO:0030867) |
| 0.2 | 80.4 | GO:0005743 | mitochondrial inner membrane(GO:0005743) |
| 0.2 | 1.9 | GO:0043196 | varicosity(GO:0043196) |
| 0.2 | 2.8 | GO:0035631 | CD40 receptor complex(GO:0035631) |
| 0.2 | 1.1 | GO:0002193 | MAML1-RBP-Jkappa- ICN1 complex(GO:0002193) |
| 0.2 | 3.1 | GO:0005852 | eukaryotic translation initiation factor 3 complex(GO:0005852) |
| 0.2 | 1.7 | GO:1990909 | Wnt signalosome(GO:1990909) |
| 0.2 | 6.4 | GO:0030673 | axolemma(GO:0030673) |
| 0.2 | 4.8 | GO:0030057 | desmosome(GO:0030057) |
| 0.2 | 7.8 | GO:1990391 | DNA repair complex(GO:1990391) |
| 0.2 | 8.3 | GO:0005669 | transcription factor TFIID complex(GO:0005669) |
| 0.2 | 7.1 | GO:0005643 | nuclear pore(GO:0005643) |
| 0.2 | 0.8 | GO:0032044 | DSIF complex(GO:0032044) |
| 0.2 | 27.2 | GO:0042470 | melanosome(GO:0042470) pigment granule(GO:0048770) |
| 0.2 | 4.7 | GO:0016327 | apicolateral plasma membrane(GO:0016327) |
| 0.2 | 3.8 | GO:0034451 | centriolar satellite(GO:0034451) |
| 0.2 | 8.8 | GO:0010494 | cytoplasmic stress granule(GO:0010494) |
| 0.2 | 3.4 | GO:0000812 | Swr1 complex(GO:0000812) |
| 0.2 | 3.6 | GO:0070822 | Sin3-type complex(GO:0070822) |
| 0.2 | 1.6 | GO:0030008 | TRAPP complex(GO:0030008) |
| 0.2 | 1.5 | GO:0043198 | dendritic shaft(GO:0043198) |
| 0.2 | 2.4 | GO:0045178 | basal part of cell(GO:0045178) |
| 0.2 | 15.9 | GO:0030496 | midbody(GO:0030496) |
| 0.1 | 7.5 | GO:0005882 | intermediate filament(GO:0005882) |
| 0.1 | 43.9 | GO:0005788 | endoplasmic reticulum lumen(GO:0005788) |
| 0.1 | 1.7 | GO:0005801 | cis-Golgi network(GO:0005801) |
| 0.1 | 9.9 | GO:0036064 | ciliary basal body(GO:0036064) |
| 0.1 | 7.0 | GO:0000502 | proteasome complex(GO:0000502) |
| 0.1 | 2.7 | GO:0044322 | endoplasmic reticulum quality control compartment(GO:0044322) |
| 0.1 | 0.5 | GO:0030863 | cortical cytoskeleton(GO:0030863) |
| 0.1 | 9.1 | GO:0001726 | ruffle(GO:0001726) |
| 0.1 | 15.6 | GO:0005875 | microtubule associated complex(GO:0005875) |
| 0.1 | 1.0 | GO:0030688 | preribosome, small subunit precursor(GO:0030688) |
| 0.1 | 5.2 | GO:0032993 | protein-DNA complex(GO:0032993) |
| 0.1 | 1.3 | GO:0031095 | platelet dense tubular network membrane(GO:0031095) |
| 0.1 | 54.8 | GO:0005925 | focal adhesion(GO:0005925) |
| 0.1 | 10.4 | GO:0000781 | chromosome, telomeric region(GO:0000781) |
| 0.1 | 0.3 | GO:0016529 | sarcoplasmic reticulum(GO:0016529) |
| 0.1 | 34.3 | GO:0031965 | nuclear membrane(GO:0031965) |
| 0.1 | 5.4 | GO:0005811 | lipid particle(GO:0005811) |
| 0.1 | 10.4 | GO:0031902 | late endosome membrane(GO:0031902) |
| 0.1 | 6.8 | GO:0035578 | azurophil granule lumen(GO:0035578) |
| 0.1 | 2.7 | GO:0005892 | acetylcholine-gated channel complex(GO:0005892) |
| 0.1 | 1.9 | GO:0031594 | neuromuscular junction(GO:0031594) |
| 0.1 | 1.5 | GO:0005922 | connexon complex(GO:0005922) |
| 0.1 | 0.8 | GO:0042589 | zymogen granule membrane(GO:0042589) |
| 0.1 | 2.6 | GO:0030175 | filopodium(GO:0030175) |
| 0.1 | 5.1 | GO:0031093 | platelet alpha granule lumen(GO:0031093) |
| 0.1 | 1.5 | GO:0031519 | PcG protein complex(GO:0031519) |
| 0.1 | 5.6 | GO:0090575 | RNA polymerase II transcription factor complex(GO:0090575) |
| 0.1 | 5.5 | GO:0017053 | transcriptional repressor complex(GO:0017053) |
| 0.1 | 0.7 | GO:0005793 | endoplasmic reticulum-Golgi intermediate compartment(GO:0005793) |
| 0.1 | 0.1 | GO:0005944 | phosphatidylinositol 3-kinase complex, class IB(GO:0005944) |
| 0.1 | 7.3 | GO:0001650 | fibrillar center(GO:0001650) |
| 0.1 | 2.3 | GO:0035097 | histone methyltransferase complex(GO:0035097) |
| 0.1 | 27.7 | GO:0005694 | chromosome(GO:0005694) |
| 0.0 | 2.5 | GO:0042734 | presynaptic membrane(GO:0042734) |
| 0.0 | 0.9 | GO:0005779 | integral component of peroxisomal membrane(GO:0005779) intrinsic component of peroxisomal membrane(GO:0031231) |
| 0.0 | 3.3 | GO:0000932 | cytoplasmic mRNA processing body(GO:0000932) |
| 0.0 | 0.3 | GO:0032391 | photoreceptor connecting cilium(GO:0032391) |
| 0.0 | 0.9 | GO:0034361 | very-low-density lipoprotein particle(GO:0034361) triglyceride-rich lipoprotein particle(GO:0034385) |
| 0.0 | 0.9 | GO:0016592 | mediator complex(GO:0016592) |
| 0.0 | 0.5 | GO:0031252 | cell leading edge(GO:0031252) |
| 0.0 | 4.5 | GO:0010008 | endosome membrane(GO:0010008) |
| 0.0 | 0.4 | GO:0099501 | synaptic vesicle membrane(GO:0030672) exocytic vesicle membrane(GO:0099501) |
| 0.0 | 0.7 | GO:0005834 | heterotrimeric G-protein complex(GO:0005834) |
| 0.0 | 0.4 | GO:0031588 | nucleotide-activated protein kinase complex(GO:0031588) |
| 0.0 | 0.1 | GO:0005964 | phosphorylase kinase complex(GO:0005964) |
| 0.0 | 2.1 | GO:0005681 | spliceosomal complex(GO:0005681) |
| 0.0 | 0.8 | GO:0005819 | spindle(GO:0005819) |
| 0.0 | 0.1 | GO:0030137 | COPI-coated vesicle(GO:0030137) |
| 0.0 | 0.4 | GO:0015030 | Cajal body(GO:0015030) |
Gene overrepresentation in molecular_function category:
| Log-likelihood per target | Total log-likelihood | Term | Description |
|---|---|---|---|
| 17.2 | 51.7 | GO:0048030 | disaccharide binding(GO:0048030) |
| 15.3 | 45.9 | GO:0070320 | inward rectifier potassium channel inhibitor activity(GO:0070320) |
| 8.7 | 26.0 | GO:0003978 | UDP-N-acetylglucosamine 4-epimerase activity(GO:0003974) UDP-glucose 4-epimerase activity(GO:0003978) |
| 7.4 | 29.7 | GO:0008466 | glycogenin glucosyltransferase activity(GO:0008466) |
| 7.4 | 29.5 | GO:0004743 | pyruvate kinase activity(GO:0004743) |
| 6.8 | 20.4 | GO:0004766 | spermidine synthase activity(GO:0004766) |
| 6.8 | 33.9 | GO:0047179 | platelet-activating factor acetyltransferase activity(GO:0047179) |
| 5.3 | 16.0 | GO:0042134 | rRNA primary transcript binding(GO:0042134) |
| 4.9 | 19.5 | GO:0005046 | KDEL sequence binding(GO:0005046) |
| 4.4 | 17.8 | GO:0061731 | ribonucleoside-diphosphate reductase activity, thioredoxin disulfide as acceptor(GO:0004748) oxidoreductase activity, acting on CH or CH2 groups, disulfide as acceptor(GO:0016728) ribonucleoside-diphosphate reductase activity(GO:0061731) |
| 4.4 | 30.9 | GO:0004704 | NF-kappaB-inducing kinase activity(GO:0004704) |
| 3.7 | 14.9 | GO:0031871 | proteinase activated receptor binding(GO:0031871) |
| 3.6 | 14.3 | GO:0003990 | acetylcholinesterase activity(GO:0003990) |
| 3.5 | 10.4 | GO:0004345 | glucose-6-phosphate dehydrogenase activity(GO:0004345) |
| 3.4 | 6.7 | GO:0034061 | DNA-directed DNA polymerase activity(GO:0003887) DNA polymerase activity(GO:0034061) |
| 3.0 | 20.7 | GO:0004849 | uridine kinase activity(GO:0004849) |
| 2.8 | 8.5 | GO:0004719 | protein-L-isoaspartate (D-aspartate) O-methyltransferase activity(GO:0004719) |
| 2.8 | 5.6 | GO:0051998 | carboxyl-O-methyltransferase activity(GO:0010340) protein carboxyl O-methyltransferase activity(GO:0051998) |
| 2.8 | 11.0 | GO:0032038 | myosin II heavy chain binding(GO:0032038) |
| 2.7 | 10.9 | GO:0004466 | long-chain-acyl-CoA dehydrogenase activity(GO:0004466) |
| 2.6 | 13.0 | GO:0016403 | dimethylargininase activity(GO:0016403) |
| 2.3 | 32.1 | GO:0030280 | structural constituent of epidermis(GO:0030280) |
| 2.3 | 47.9 | GO:0070628 | proteasome binding(GO:0070628) |
| 2.2 | 50.8 | GO:0051371 | muscle alpha-actinin binding(GO:0051371) |
| 2.2 | 6.5 | GO:0004515 | nicotinate-nucleotide adenylyltransferase activity(GO:0004515) |
| 2.1 | 10.4 | GO:0030942 | endoplasmic reticulum signal peptide binding(GO:0030942) |
| 2.0 | 8.0 | GO:0016971 | flavin-linked sulfhydryl oxidase activity(GO:0016971) thiol oxidase activity(GO:0016972) |
| 2.0 | 15.6 | GO:0035251 | UDP-glucosyltransferase activity(GO:0035251) |
| 1.9 | 15.2 | GO:0008379 | thioredoxin peroxidase activity(GO:0008379) |
| 1.8 | 33.3 | GO:0017049 | GTP-Rho binding(GO:0017049) |
| 1.8 | 12.9 | GO:0003689 | DNA clamp loader activity(GO:0003689) protein-DNA loading ATPase activity(GO:0033170) |
| 1.8 | 49.2 | GO:0000400 | four-way junction DNA binding(GO:0000400) |
| 1.8 | 30.0 | GO:0008494 | translation activator activity(GO:0008494) |
| 1.7 | 1.7 | GO:0031432 | titin binding(GO:0031432) RNA polymerase II sequence-specific DNA binding transcription factor binding(GO:0061629) |
| 1.6 | 4.7 | GO:0033878 | hormone-sensitive lipase activity(GO:0033878) |
| 1.5 | 13.8 | GO:0046976 | histone methyltransferase activity (H3-K27 specific)(GO:0046976) |
| 1.5 | 3.0 | GO:0004886 | 9-cis retinoic acid receptor activity(GO:0004886) |
| 1.5 | 7.4 | GO:0050436 | microfibril binding(GO:0050436) |
| 1.4 | 10.0 | GO:0005353 | fructose transmembrane transporter activity(GO:0005353) |
| 1.4 | 7.0 | GO:0005152 | interleukin-1 receptor antagonist activity(GO:0005152) |
| 1.4 | 11.0 | GO:0050833 | pyruvate transmembrane transporter activity(GO:0050833) |
| 1.4 | 19.1 | GO:0034713 | type I transforming growth factor beta receptor binding(GO:0034713) |
| 1.4 | 5.4 | GO:0004504 | peptidylglycine monooxygenase activity(GO:0004504) peptidylamidoglycolate lyase activity(GO:0004598) |
| 1.3 | 9.1 | GO:0050815 | phosphoserine binding(GO:0050815) |
| 1.2 | 6.2 | GO:0004830 | tryptophan-tRNA ligase activity(GO:0004830) |
| 1.2 | 4.9 | GO:0015142 | citrate transmembrane transporter activity(GO:0015137) tricarboxylic acid transmembrane transporter activity(GO:0015142) |
| 1.2 | 7.3 | GO:0099602 | acetylcholine receptor regulator activity(GO:0030548) neurotransmitter receptor regulator activity(GO:0099602) |
| 1.2 | 6.1 | GO:0019798 | procollagen-proline 4-dioxygenase activity(GO:0004656) procollagen-proline dioxygenase activity(GO:0019798) |
| 1.2 | 56.7 | GO:0004864 | protein phosphatase inhibitor activity(GO:0004864) |
| 1.2 | 13.2 | GO:0004332 | fructose-bisphosphate aldolase activity(GO:0004332) |
| 1.2 | 27.7 | GO:0030898 | actin-dependent ATPase activity(GO:0030898) |
| 1.2 | 6.0 | GO:0003705 | transcription factor activity, RNA polymerase II distal enhancer sequence-specific binding(GO:0003705) |
| 1.2 | 7.1 | GO:0008553 | hydrogen-exporting ATPase activity, phosphorylative mechanism(GO:0008553) |
| 1.2 | 3.5 | GO:0001069 | regulatory region RNA binding(GO:0001069) |
| 1.1 | 97.7 | GO:0008307 | structural constituent of muscle(GO:0008307) |
| 1.1 | 11.6 | GO:0055131 | C3HC4-type RING finger domain binding(GO:0055131) |
| 1.1 | 6.3 | GO:0061133 | endopeptidase activator activity(GO:0061133) |
| 1.0 | 32.5 | GO:0070182 | DNA polymerase binding(GO:0070182) |
| 1.0 | 4.2 | GO:0052827 | inositol pentakisphosphate phosphatase activity(GO:0052827) |
| 1.0 | 22.8 | GO:0008239 | dipeptidyl-peptidase activity(GO:0008239) |
| 1.0 | 17.5 | GO:0008432 | JUN kinase binding(GO:0008432) |
| 1.0 | 6.1 | GO:0004430 | 1-phosphatidylinositol 4-kinase activity(GO:0004430) |
| 1.0 | 23.2 | GO:0098641 | cadherin binding involved in cell-cell adhesion(GO:0098641) |
| 1.0 | 7.0 | GO:0047134 | protein-disulfide reductase activity(GO:0047134) |
| 1.0 | 4.8 | GO:0070644 | vitamin D response element binding(GO:0070644) |
| 1.0 | 8.6 | GO:0086083 | cell adhesive protein binding involved in bundle of His cell-Purkinje myocyte communication(GO:0086083) |
| 0.9 | 7.4 | GO:0051425 | PTB domain binding(GO:0051425) |
| 0.9 | 5.5 | GO:0003747 | translation release factor activity(GO:0003747) translation termination factor activity(GO:0008079) |
| 0.9 | 3.7 | GO:0033906 | protein tyrosine kinase inhibitor activity(GO:0030292) hyaluronoglucuronidase activity(GO:0033906) |
| 0.9 | 9.1 | GO:0001055 | RNA polymerase II activity(GO:0001055) |
| 0.9 | 9.0 | GO:0034485 | phosphatidylinositol-3,4,5-trisphosphate 5-phosphatase activity(GO:0034485) |
| 0.9 | 19.9 | GO:0001056 | RNA polymerase III activity(GO:0001056) |
| 0.9 | 35.2 | GO:0016538 | cyclin-dependent protein serine/threonine kinase regulator activity(GO:0016538) |
| 0.8 | 33.7 | GO:0003785 | actin monomer binding(GO:0003785) |
| 0.8 | 9.9 | GO:0032050 | clathrin heavy chain binding(GO:0032050) |
| 0.8 | 2.4 | GO:0045127 | N-acetylglucosamine kinase activity(GO:0045127) |
| 0.8 | 7.7 | GO:0031013 | troponin I binding(GO:0031013) |
| 0.8 | 11.5 | GO:0035256 | G-protein coupled glutamate receptor binding(GO:0035256) |
| 0.8 | 8.5 | GO:0097016 | L27 domain binding(GO:0097016) |
| 0.8 | 6.1 | GO:0004308 | exo-alpha-sialidase activity(GO:0004308) alpha-sialidase activity(GO:0016997) |
| 0.8 | 7.7 | GO:0045545 | syndecan binding(GO:0045545) |
| 0.7 | 4.5 | GO:0008597 | calcium-dependent protein serine/threonine phosphatase regulator activity(GO:0008597) |
| 0.7 | 28.4 | GO:0008139 | nuclear localization sequence binding(GO:0008139) |
| 0.7 | 2.2 | GO:0003881 | CDP-diacylglycerol-inositol 3-phosphatidyltransferase activity(GO:0003881) |
| 0.7 | 33.2 | GO:0061631 | ubiquitin conjugating enzyme activity(GO:0061631) |
| 0.7 | 6.8 | GO:0033192 | calmodulin-dependent protein phosphatase activity(GO:0033192) |
| 0.7 | 5.4 | GO:0035312 | 5'-3' exodeoxyribonuclease activity(GO:0035312) |
| 0.7 | 6.1 | GO:0032190 | acrosin binding(GO:0032190) |
| 0.6 | 4.5 | GO:0043024 | ribosomal small subunit binding(GO:0043024) |
| 0.6 | 3.8 | GO:0043532 | angiostatin binding(GO:0043532) |
| 0.6 | 7.6 | GO:0004128 | cytochrome-b5 reductase activity, acting on NAD(P)H(GO:0004128) |
| 0.6 | 3.7 | GO:0003998 | acylphosphatase activity(GO:0003998) |
| 0.6 | 14.7 | GO:0008327 | methyl-CpG binding(GO:0008327) |
| 0.6 | 4.3 | GO:0038085 | vascular endothelial growth factor binding(GO:0038085) |
| 0.6 | 25.7 | GO:0046966 | thyroid hormone receptor binding(GO:0046966) |
| 0.6 | 1.8 | GO:0016422 | mRNA (2'-O-methyladenosine-N6-)-methyltransferase activity(GO:0016422) |
| 0.6 | 11.8 | GO:0005283 | sodium:amino acid symporter activity(GO:0005283) |
| 0.6 | 1.8 | GO:0004126 | cytidine deaminase activity(GO:0004126) |
| 0.6 | 8.2 | GO:0008093 | cytoskeletal adaptor activity(GO:0008093) |
| 0.6 | 11.6 | GO:0070273 | phosphatidylinositol-4-phosphate binding(GO:0070273) |
| 0.6 | 0.6 | GO:0015193 | L-alanine transmembrane transporter activity(GO:0015180) L-proline transmembrane transporter activity(GO:0015193) alanine transmembrane transporter activity(GO:0022858) |
| 0.6 | 2.8 | GO:0004485 | methylcrotonoyl-CoA carboxylase activity(GO:0004485) |
| 0.6 | 29.6 | GO:0050136 | NADH dehydrogenase (ubiquinone) activity(GO:0008137) NADH dehydrogenase (quinone) activity(GO:0050136) |
| 0.6 | 2.2 | GO:0004335 | galactokinase activity(GO:0004335) |
| 0.5 | 4.4 | GO:0090599 | alpha-glucosidase activity(GO:0090599) |
| 0.5 | 1.6 | GO:0070984 | SET domain binding(GO:0070984) |
| 0.5 | 5.4 | GO:0005094 | Rho GDP-dissociation inhibitor activity(GO:0005094) |
| 0.5 | 23.6 | GO:0050699 | WW domain binding(GO:0050699) |
| 0.5 | 16.1 | GO:0008574 | ATP-dependent microtubule motor activity, plus-end-directed(GO:0008574) |
| 0.5 | 1.6 | GO:0051373 | FATZ binding(GO:0051373) |
| 0.5 | 1.6 | GO:0004609 | phosphatidylserine decarboxylase activity(GO:0004609) |
| 0.5 | 9.3 | GO:0097602 | cullin family protein binding(GO:0097602) |
| 0.5 | 2.0 | GO:0047288 | monosialoganglioside sialyltransferase activity(GO:0047288) |
| 0.5 | 6.9 | GO:0034450 | ubiquitin-ubiquitin ligase activity(GO:0034450) |
| 0.5 | 5.8 | GO:0022889 | L-serine transmembrane transporter activity(GO:0015194) serine transmembrane transporter activity(GO:0022889) |
| 0.5 | 1.9 | GO:0004826 | phenylalanine-tRNA ligase activity(GO:0004826) |
| 0.5 | 5.2 | GO:0016861 | intramolecular oxidoreductase activity, interconverting aldoses and ketoses(GO:0016861) |
| 0.5 | 8.4 | GO:0043422 | protein kinase B binding(GO:0043422) |
| 0.5 | 9.3 | GO:0051400 | BH domain binding(GO:0051400) |
| 0.4 | 33.9 | GO:0003743 | translation initiation factor activity(GO:0003743) |
| 0.4 | 8.0 | GO:0016780 | phosphotransferase activity, for other substituted phosphate groups(GO:0016780) |
| 0.4 | 4.4 | GO:0001075 | transcription factor activity, RNA polymerase II core promoter sequence-specific binding involved in preinitiation complex assembly(GO:0001075) |
| 0.4 | 4.7 | GO:0001786 | phosphatidylserine binding(GO:0001786) |
| 0.4 | 1.7 | GO:0004722 | protein serine/threonine phosphatase activity(GO:0004722) |
| 0.4 | 12.3 | GO:0048027 | mRNA 5'-UTR binding(GO:0048027) |
| 0.4 | 4.6 | GO:0004645 | phosphorylase activity(GO:0004645) |
| 0.4 | 2.5 | GO:1904929 | coreceptor activity involved in Wnt signaling pathway, planar cell polarity pathway(GO:1904929) |
| 0.4 | 7.7 | GO:0008483 | transaminase activity(GO:0008483) |
| 0.4 | 7.3 | GO:0035615 | clathrin adaptor activity(GO:0035615) endocytic adaptor activity(GO:0098748) |
| 0.4 | 8.2 | GO:0005337 | nucleoside transmembrane transporter activity(GO:0005337) |
| 0.4 | 3.0 | GO:0097493 | structural molecule activity conferring elasticity(GO:0097493) |
| 0.4 | 7.8 | GO:0005112 | Notch binding(GO:0005112) |
| 0.4 | 6.3 | GO:0005095 | GTPase inhibitor activity(GO:0005095) |
| 0.4 | 5.5 | GO:0016805 | dipeptidase activity(GO:0016805) |
| 0.4 | 0.7 | GO:0071936 | coreceptor activity involved in Wnt signaling pathway(GO:0071936) |
| 0.4 | 1.5 | GO:0001094 | TFIID-class transcription factor binding(GO:0001094) |
| 0.4 | 7.4 | GO:0031404 | chloride ion binding(GO:0031404) |
| 0.4 | 6.3 | GO:0102391 | decanoate--CoA ligase activity(GO:0102391) |
| 0.3 | 2.4 | GO:0031726 | CCR1 chemokine receptor binding(GO:0031726) |
| 0.3 | 2.7 | GO:0086056 | voltage-gated calcium channel activity involved in AV node cell action potential(GO:0086056) |
| 0.3 | 7.7 | GO:0005528 | macrolide binding(GO:0005527) FK506 binding(GO:0005528) |
| 0.3 | 5.0 | GO:0035259 | glucocorticoid receptor binding(GO:0035259) |
| 0.3 | 26.3 | GO:0043130 | ubiquitin binding(GO:0043130) |
| 0.3 | 5.0 | GO:0034483 | heparan sulfate sulfotransferase activity(GO:0034483) |
| 0.3 | 1.3 | GO:0008449 | N-acetylglucosamine-6-sulfatase activity(GO:0008449) |
| 0.3 | 1.0 | GO:0008534 | oxidized purine nucleobase lesion DNA N-glycosylase activity(GO:0008534) |
| 0.3 | 15.8 | GO:0004364 | glutathione transferase activity(GO:0004364) |
| 0.3 | 2.5 | GO:0048273 | mitogen-activated protein kinase p38 binding(GO:0048273) |
| 0.3 | 4.1 | GO:0031078 | histone deacetylase activity (H3-K14 specific)(GO:0031078) NAD-dependent histone deacetylase activity (H3-K14 specific)(GO:0032041) |
| 0.3 | 22.6 | GO:0003730 | mRNA 3'-UTR binding(GO:0003730) |
| 0.3 | 1.1 | GO:0005166 | neurotrophin p75 receptor binding(GO:0005166) |
| 0.3 | 11.6 | GO:0004003 | ATP-dependent DNA helicase activity(GO:0004003) |
| 0.3 | 47.6 | GO:0001078 | transcriptional repressor activity, RNA polymerase II core promoter proximal region sequence-specific binding(GO:0001078) |
| 0.3 | 33.4 | GO:0001227 | transcriptional repressor activity, RNA polymerase II transcription regulatory region sequence-specific binding(GO:0001227) |
| 0.3 | 3.5 | GO:0030296 | protein tyrosine kinase activator activity(GO:0030296) |
| 0.3 | 4.8 | GO:0008349 | MAP kinase kinase kinase kinase activity(GO:0008349) |
| 0.3 | 0.8 | GO:0043813 | phosphatidylinositol-3,5-bisphosphate 5-phosphatase activity(GO:0043813) |
| 0.3 | 10.0 | GO:0043022 | ribosome binding(GO:0043022) |
| 0.3 | 8.9 | GO:0004407 | histone deacetylase activity(GO:0004407) |
| 0.3 | 11.0 | GO:0031491 | nucleosome binding(GO:0031491) |
| 0.3 | 4.1 | GO:0002162 | dystroglycan binding(GO:0002162) |
| 0.3 | 11.6 | GO:0000049 | tRNA binding(GO:0000049) |
| 0.3 | 35.6 | GO:0044822 | mRNA binding(GO:0003729) poly(A) RNA binding(GO:0044822) |
| 0.2 | 86.7 | GO:0031625 | ubiquitin protein ligase binding(GO:0031625) |
| 0.2 | 2.2 | GO:0030620 | U2 snRNA binding(GO:0030620) |
| 0.2 | 0.7 | GO:0008502 | melatonin receptor activity(GO:0008502) |
| 0.2 | 5.9 | GO:0070577 | lysine-acetylated histone binding(GO:0070577) |
| 0.2 | 14.1 | GO:0035064 | methylated histone binding(GO:0035064) |
| 0.2 | 11.9 | GO:0016709 | oxidoreductase activity, acting on paired donors, with incorporation or reduction of molecular oxygen, NAD(P)H as one donor, and incorporation of one atom of oxygen(GO:0016709) |
| 0.2 | 4.4 | GO:0023026 | MHC class II protein complex binding(GO:0023026) |
| 0.2 | 3.6 | GO:0019213 | deacetylase activity(GO:0019213) |
| 0.2 | 2.6 | GO:0019966 | interleukin-1 binding(GO:0019966) |
| 0.2 | 5.0 | GO:0008242 | omega peptidase activity(GO:0008242) |
| 0.2 | 7.3 | GO:0004709 | MAP kinase kinase kinase activity(GO:0004709) |
| 0.2 | 5.2 | GO:0042288 | MHC class I protein binding(GO:0042288) |
| 0.2 | 0.9 | GO:0003938 | IMP dehydrogenase activity(GO:0003938) |
| 0.2 | 1.8 | GO:0016721 | superoxide dismutase activity(GO:0004784) oxidoreductase activity, acting on superoxide radicals as acceptor(GO:0016721) |
| 0.2 | 3.5 | GO:0003688 | DNA replication origin binding(GO:0003688) |
| 0.2 | 1.7 | GO:0045504 | dynein heavy chain binding(GO:0045504) |
| 0.2 | 1.5 | GO:0072542 | protein phosphatase activator activity(GO:0072542) |
| 0.2 | 1.7 | GO:0004465 | lipoprotein lipase activity(GO:0004465) |
| 0.2 | 2.0 | GO:0005225 | volume-sensitive anion channel activity(GO:0005225) |
| 0.2 | 33.0 | GO:0005178 | integrin binding(GO:0005178) |
| 0.2 | 0.8 | GO:0004972 | NMDA glutamate receptor activity(GO:0004972) |
| 0.2 | 13.6 | GO:0003697 | single-stranded DNA binding(GO:0003697) |
| 0.2 | 33.0 | GO:0003735 | structural constituent of ribosome(GO:0003735) |
| 0.2 | 0.6 | GO:0043812 | phosphatidylinositol-4-phosphate phosphatase activity(GO:0043812) |
| 0.2 | 1.9 | GO:0031014 | troponin T binding(GO:0031014) |
| 0.2 | 4.6 | GO:0004298 | threonine-type endopeptidase activity(GO:0004298) threonine-type peptidase activity(GO:0070003) |
| 0.2 | 1.2 | GO:0046920 | alpha-(1->3)-fucosyltransferase activity(GO:0046920) |
| 0.1 | 18.7 | GO:0004725 | protein tyrosine phosphatase activity(GO:0004725) |
| 0.1 | 9.5 | GO:0008289 | lipid binding(GO:0008289) |
| 0.1 | 0.6 | GO:0004052 | arachidonate 12-lipoxygenase activity(GO:0004052) |
| 0.1 | 3.9 | GO:0008536 | Ran GTPase binding(GO:0008536) |
| 0.1 | 0.9 | GO:1903763 | gap junction channel activity involved in cell communication by electrical coupling(GO:1903763) |
| 0.1 | 1.3 | GO:0004117 | calmodulin-dependent cyclic-nucleotide phosphodiesterase activity(GO:0004117) |
| 0.1 | 2.1 | GO:0070064 | proline-rich region binding(GO:0070064) |
| 0.1 | 4.9 | GO:0001637 | G-protein coupled chemoattractant receptor activity(GO:0001637) chemokine receptor activity(GO:0004950) |
| 0.1 | 0.4 | GO:0047708 | biotinidase activity(GO:0047708) |
| 0.1 | 1.4 | GO:0035240 | dopamine binding(GO:0035240) |
| 0.1 | 2.7 | GO:0042166 | acetylcholine binding(GO:0042166) |
| 0.1 | 7.6 | GO:0017048 | Rho GTPase binding(GO:0017048) |
| 0.1 | 11.4 | GO:0004386 | helicase activity(GO:0004386) |
| 0.1 | 5.5 | GO:0004693 | cyclin-dependent protein serine/threonine kinase activity(GO:0004693) |
| 0.1 | 0.7 | GO:0005113 | patched binding(GO:0005113) |
| 0.1 | 1.6 | GO:0015037 | peptide disulfide oxidoreductase activity(GO:0015037) |
| 0.1 | 0.8 | GO:0005328 | neurotransmitter:sodium symporter activity(GO:0005328) |
| 0.1 | 2.6 | GO:0017134 | fibroblast growth factor binding(GO:0017134) |
| 0.1 | 5.7 | GO:0008276 | protein methyltransferase activity(GO:0008276) |
| 0.1 | 3.7 | GO:0016811 | hydrolase activity, acting on carbon-nitrogen (but not peptide) bonds, in linear amides(GO:0016811) |
| 0.1 | 0.5 | GO:0004991 | parathyroid hormone receptor activity(GO:0004991) |
| 0.1 | 2.5 | GO:0005388 | calcium-transporting ATPase activity(GO:0005388) |
| 0.1 | 0.4 | GO:0004090 | carbonyl reductase (NADPH) activity(GO:0004090) |
| 0.1 | 2.5 | GO:0001972 | retinoic acid binding(GO:0001972) |
| 0.1 | 2.7 | GO:0004198 | calcium-dependent cysteine-type endopeptidase activity(GO:0004198) |
| 0.1 | 4.2 | GO:0017112 | Rab guanyl-nucleotide exchange factor activity(GO:0017112) |
| 0.1 | 0.7 | GO:0001871 | pattern binding(GO:0001871) polysaccharide binding(GO:0030247) |
| 0.1 | 3.3 | GO:0005160 | transforming growth factor beta receptor binding(GO:0005160) |
| 0.1 | 21.5 | GO:0003924 | GTPase activity(GO:0003924) |
| 0.1 | 7.8 | GO:0005525 | GTP binding(GO:0005525) |
| 0.1 | 0.5 | GO:0005243 | gap junction channel activity(GO:0005243) |
| 0.1 | 3.7 | GO:0046332 | SMAD binding(GO:0046332) |
| 0.1 | 0.2 | GO:0004505 | phenylalanine 4-monooxygenase activity(GO:0004505) |
| 0.1 | 0.9 | GO:0003899 | DNA-directed RNA polymerase activity(GO:0003899) |
| 0.1 | 4.4 | GO:0004553 | hydrolase activity, hydrolyzing O-glycosyl compounds(GO:0004553) |
| 0.1 | 4.5 | GO:0003774 | motor activity(GO:0003774) |
| 0.1 | 0.2 | GO:0003956 | NAD(P)+-protein-arginine ADP-ribosyltransferase activity(GO:0003956) |
| 0.0 | 1.3 | GO:0005540 | hyaluronic acid binding(GO:0005540) |
| 0.0 | 1.4 | GO:0042056 | chemoattractant activity(GO:0042056) |
| 0.0 | 0.8 | GO:0030506 | ankyrin binding(GO:0030506) |
| 0.0 | 0.8 | GO:0034237 | protein kinase A regulatory subunit binding(GO:0034237) |
| 0.0 | 0.5 | GO:0070330 | aromatase activity(GO:0070330) |
| 0.0 | 1.4 | GO:0070491 | repressing transcription factor binding(GO:0070491) |
| 0.0 | 0.2 | GO:0003713 | transcription coactivator activity(GO:0003713) |
| 0.0 | 0.4 | GO:0004679 | AMP-activated protein kinase activity(GO:0004679) |
| 0.0 | 0.7 | GO:0031490 | chromatin DNA binding(GO:0031490) |
| 0.0 | 0.3 | GO:0070679 | inositol 1,4,5 trisphosphate binding(GO:0070679) |
| 0.0 | 6.9 | GO:0004842 | ubiquitin-protein transferase activity(GO:0004842) |
| 0.0 | 5.9 | GO:0045296 | cadherin binding(GO:0045296) |
| 0.0 | 0.3 | GO:0047617 | acyl-CoA hydrolase activity(GO:0047617) |
| 0.0 | 2.4 | GO:0008168 | methyltransferase activity(GO:0008168) |
| 0.0 | 0.4 | GO:0016881 | acid-amino acid ligase activity(GO:0016881) |
| 0.0 | 0.4 | GO:0005262 | calcium channel activity(GO:0005262) |
| 0.0 | 0.1 | GO:0035005 | 1-phosphatidylinositol-4-phosphate 3-kinase activity(GO:0035005) |
| 0.0 | 0.2 | GO:0080025 | phosphatidylinositol-3,5-bisphosphate binding(GO:0080025) |
| 0.0 | 0.2 | GO:0005344 | oxygen transporter activity(GO:0005344) |
| 0.0 | 0.3 | GO:0070742 | C2H2 zinc finger domain binding(GO:0070742) |
| 0.0 | 0.1 | GO:0004689 | phosphorylase kinase activity(GO:0004689) |
| 0.0 | 0.4 | GO:0005547 | phosphatidylinositol-3,4,5-trisphosphate binding(GO:0005547) |
| 0.0 | 11.1 | GO:0003723 | RNA binding(GO:0003723) |
Gene overrepresentation in C2:CP category:
| Log-likelihood per target | Total log-likelihood | Term | Description |
|---|---|---|---|
| 3.3 | 46.4 | SA G2 AND M PHASES | Cdc25 activates the cdc2/cyclin B complex to induce the G2/M transition. |
| 1.8 | 80.3 | PID ALK1 PATHWAY | ALK1 signaling events |
| 1.3 | 33.1 | SA REG CASCADE OF CYCLIN EXPR | Expression of cyclins regulates progression through the cell cycle by activating cyclin-dependent kinases. |
| 1.2 | 38.9 | PID TOLL ENDOGENOUS PATHWAY | Endogenous TLR signaling |
| 1.1 | 44.2 | PID LIS1 PATHWAY | Lissencephaly gene (LIS1) in neuronal migration and development |
| 1.0 | 26.8 | PID ARF 3PATHWAY | Arf1 pathway |
| 0.9 | 32.1 | PID EPHA2 FWD PATHWAY | EPHA2 forward signaling |
| 0.8 | 36.5 | PID P38 MK2 PATHWAY | p38 signaling mediated by MAPKAP kinases |
| 0.7 | 14.1 | PID PRL SIGNALING EVENTS PATHWAY | Signaling events mediated by PRL |
| 0.7 | 36.3 | PID TCR CALCIUM PATHWAY | Calcium signaling in the CD4+ TCR pathway |
| 0.5 | 43.0 | PID KIT PATHWAY | Signaling events mediated by Stem cell factor receptor (c-Kit) |
| 0.5 | 33.5 | PID ILK PATHWAY | Integrin-linked kinase signaling |
| 0.5 | 23.2 | PID CDC42 REG PATHWAY | Regulation of CDC42 activity |
| 0.4 | 21.4 | PID A6B1 A6B4 INTEGRIN PATHWAY | a6b1 and a6b4 Integrin signaling |
| 0.4 | 13.3 | PID INTEGRIN A9B1 PATHWAY | Alpha9 beta1 integrin signaling events |
| 0.4 | 50.7 | PID MYC REPRESS PATHWAY | Validated targets of C-MYC transcriptional repression |
| 0.4 | 21.8 | PID PLK1 PATHWAY | PLK1 signaling events |
| 0.4 | 18.2 | PID FANCONI PATHWAY | Fanconi anemia pathway |
| 0.4 | 30.1 | PID E2F PATHWAY | E2F transcription factor network |
| 0.4 | 10.8 | PID BARD1 PATHWAY | BARD1 signaling events |
| 0.3 | 4.4 | SIG REGULATION OF THE ACTIN CYTOSKELETON BY RHO GTPASES | Genes related to regulation of the actin cytoskeleton |
| 0.3 | 6.0 | PID HDAC CLASSIII PATHWAY | Signaling events mediated by HDAC Class III |
| 0.3 | 7.8 | PID ECADHERIN NASCENT AJ PATHWAY | E-cadherin signaling in the nascent adherens junction |
| 0.3 | 15.8 | PID ECADHERIN STABILIZATION PATHWAY | Stabilization and expansion of the E-cadherin adherens junction |
| 0.3 | 31.4 | PID SMAD2 3NUCLEAR PATHWAY | Regulation of nuclear SMAD2/3 signaling |
| 0.3 | 26.6 | PID CASPASE PATHWAY | Caspase cascade in apoptosis |
| 0.3 | 3.6 | PID VEGF VEGFR PATHWAY | VEGF and VEGFR signaling network |
| 0.3 | 2.3 | SA G1 AND S PHASES | Cdk2, 4, and 6 bind cyclin D in G1, while cdk2/cyclin E promotes the G1/S transition. |
| 0.2 | 5.1 | PID RET PATHWAY | Signaling events regulated by Ret tyrosine kinase |
| 0.2 | 12.5 | PID NOTCH PATHWAY | Notch signaling pathway |
| 0.2 | 14.3 | ST FAS SIGNALING PATHWAY | Fas Signaling Pathway |
| 0.2 | 8.6 | PID PS1 PATHWAY | Presenilin action in Notch and Wnt signaling |
| 0.2 | 5.3 | PID NCADHERIN PATHWAY | N-cadherin signaling events |
| 0.2 | 5.0 | PID FOXM1 PATHWAY | FOXM1 transcription factor network |
| 0.2 | 1.6 | PID MET PATHWAY | Signaling events mediated by Hepatocyte Growth Factor Receptor (c-Met) |
| 0.2 | 3.5 | PID MYC PATHWAY | C-MYC pathway |
| 0.2 | 2.9 | PID SMAD2 3PATHWAY | Regulation of cytoplasmic and nuclear SMAD2/3 signaling |
| 0.2 | 1.8 | PID AVB3 INTEGRIN PATHWAY | Integrins in angiogenesis |
| 0.2 | 8.0 | PID ARF6 TRAFFICKING PATHWAY | Arf6 trafficking events |
| 0.2 | 8.9 | PID HDAC CLASSI PATHWAY | Signaling events mediated by HDAC Class I |
| 0.1 | 1.5 | PID HDAC CLASSII PATHWAY | Signaling events mediated by HDAC Class II |
| 0.1 | 1.1 | SA TRKA RECEPTOR | The TrkA receptor binds nerve growth factor to activate MAP kinase pathways and promote cell growth. |
| 0.1 | 1.3 | PID GLYPICAN 1PATHWAY | Glypican 1 network |
| 0.1 | 1.8 | PID P38 ALPHA BETA DOWNSTREAM PATHWAY | Signaling mediated by p38-alpha and p38-beta |
| 0.1 | 8.7 | PID P53 DOWNSTREAM PATHWAY | Direct p53 effectors |
| 0.1 | 11.3 | NABA ECM GLYCOPROTEINS | Genes encoding structural ECM glycoproteins |
| 0.0 | 0.8 | PID VEGFR1 2 PATHWAY | Signaling events mediated by VEGFR1 and VEGFR2 |
| 0.0 | 0.7 | PID HEDGEHOG 2PATHWAY | Signaling events mediated by the Hedgehog family |
| 0.0 | 1.6 | PID MTOR 4PATHWAY | mTOR signaling pathway |
| 0.0 | 0.6 | PID TAP63 PATHWAY | Validated transcriptional targets of TAp63 isoforms |
| 0.0 | 0.4 | PID IL3 PATHWAY | IL3-mediated signaling events |
| 0.0 | 0.6 | PID IL23 PATHWAY | IL23-mediated signaling events |
| 0.0 | 0.8 | PID SYNDECAN 1 PATHWAY | Syndecan-1-mediated signaling events |
| 0.0 | 0.2 | PID TNF PATHWAY | TNF receptor signaling pathway |
Gene overrepresentation in C2:CP:REACTOME category:
| Log-likelihood per target | Total log-likelihood | Term | Description |
|---|---|---|---|
| 3.5 | 41.4 | REACTOME IRAK1 RECRUITS IKK COMPLEX | Genes involved in IRAK1 recruits IKK complex |
| 2.2 | 64.3 | REACTOME HORMONE SENSITIVE LIPASE HSL MEDIATED TRIACYLGLYCEROL HYDROLYSIS | Genes involved in Hormone-sensitive lipase (HSL)-mediated triacylglycerol hydrolysis |
| 1.9 | 53.1 | REACTOME GLYCOGEN BREAKDOWN GLYCOGENOLYSIS | Genes involved in Glycogen breakdown (glycogenolysis) |
| 1.8 | 31.2 | REACTOME REPAIR SYNTHESIS FOR GAP FILLING BY DNA POL IN TC NER | Genes involved in Repair synthesis for gap-filling by DNA polymerase in TC-NER |
| 1.7 | 46.4 | REACTOME CYCLIN A B1 ASSOCIATED EVENTS DURING G2 M TRANSITION | Genes involved in Cyclin A/B1 associated events during G2/M transition |
| 1.6 | 30.1 | REACTOME DESTABILIZATION OF MRNA BY TRISTETRAPROLIN TTP | Genes involved in Destabilization of mRNA by Tristetraprolin (TTP) |
| 1.5 | 106.3 | REACTOME STRIATED MUSCLE CONTRACTION | Genes involved in Striated Muscle Contraction |
| 1.5 | 25.5 | REACTOME DESTABILIZATION OF MRNA BY KSRP | Genes involved in Destabilization of mRNA by KSRP |
| 1.2 | 29.9 | REACTOME P130CAS LINKAGE TO MAPK SIGNALING FOR INTEGRINS | Genes involved in p130Cas linkage to MAPK signaling for integrins |
| 1.2 | 39.1 | REACTOME DOWNREGULATION OF SMAD2 3 SMAD4 TRANSCRIPTIONAL ACTIVITY | Genes involved in Downregulation of SMAD2/3:SMAD4 transcriptional activity |
| 1.0 | 20.7 | REACTOME PHOSPHORYLATION OF THE APC C | Genes involved in Phosphorylation of the APC/C |
| 1.0 | 15.6 | REACTOME SYNTHESIS OF SUBSTRATES IN N GLYCAN BIOSYTHESIS | Genes involved in Synthesis of substrates in N-glycan biosythesis |
| 1.0 | 39.9 | REACTOME TGF BETA RECEPTOR SIGNALING ACTIVATES SMADS | Genes involved in TGF-beta receptor signaling activates SMADs |
| 0.8 | 17.8 | REACTOME G1 S SPECIFIC TRANSCRIPTION | Genes involved in G1/S-Specific Transcription |
| 0.8 | 14.3 | REACTOME SYNTHESIS SECRETION AND DEACYLATION OF GHRELIN | Genes involved in Synthesis, Secretion, and Deacylation of Ghrelin |
| 0.8 | 20.4 | REACTOME METABOLISM OF POLYAMINES | Genes involved in Metabolism of polyamines |
| 0.8 | 11.3 | REACTOME UNWINDING OF DNA | Genes involved in Unwinding of DNA |
| 0.8 | 10.9 | REACTOME GLYCOPROTEIN HORMONES | Genes involved in Glycoprotein hormones |
| 0.8 | 16.1 | REACTOME SYNTHESIS OF VERY LONG CHAIN FATTY ACYL COAS | Genes involved in Synthesis of very long-chain fatty acyl-CoAs |
| 0.7 | 17.0 | REACTOME RNA POL III CHAIN ELONGATION | Genes involved in RNA Polymerase III Chain Elongation |
| 0.7 | 22.4 | REACTOME PYRIMIDINE METABOLISM | Genes involved in Pyrimidine metabolism |
| 0.7 | 15.4 | REACTOME CHYLOMICRON MEDIATED LIPID TRANSPORT | Genes involved in Chylomicron-mediated lipid transport |
| 0.7 | 4.9 | REACTOME FATTY ACYL COA BIOSYNTHESIS | Genes involved in Fatty Acyl-CoA Biosynthesis |
| 0.7 | 17.8 | REACTOME POST CHAPERONIN TUBULIN FOLDING PATHWAY | Genes involved in Post-chaperonin tubulin folding pathway |
| 0.7 | 22.1 | REACTOME DEADENYLATION OF MRNA | Genes involved in Deadenylation of mRNA |
| 0.6 | 8.0 | REACTOME VITAMIN B5 PANTOTHENATE METABOLISM | Genes involved in Vitamin B5 (pantothenate) metabolism |
| 0.6 | 4.2 | REACTOME CYCLIN E ASSOCIATED EVENTS DURING G1 S TRANSITION | Genes involved in Cyclin E associated events during G1/S transition |
| 0.6 | 30.2 | REACTOME SIGNALING BY ROBO RECEPTOR | Genes involved in Signaling by Robo receptor |
| 0.6 | 15.4 | REACTOME KINESINS | Genes involved in Kinesins |
| 0.6 | 31.3 | REACTOME G1 PHASE | Genes involved in G1 Phase |
| 0.5 | 9.9 | REACTOME SIGNALING BY HIPPO | Genes involved in Signaling by Hippo |
| 0.5 | 16.8 | REACTOME CHOLESTEROL BIOSYNTHESIS | Genes involved in Cholesterol biosynthesis |
| 0.5 | 3.5 | REACTOME CDC6 ASSOCIATION WITH THE ORC ORIGIN COMPLEX | Genes involved in CDC6 association with the ORC:origin complex |
| 0.5 | 5.0 | REACTOME G2 M DNA DAMAGE CHECKPOINT | Genes involved in G2/M DNA damage checkpoint |
| 0.5 | 9.2 | REACTOME APOPTOTIC CLEAVAGE OF CELL ADHESION PROTEINS | Genes involved in Apoptotic cleavage of cell adhesion proteins |
| 0.5 | 10.0 | REACTOME FACILITATIVE NA INDEPENDENT GLUCOSE TRANSPORTERS | Genes involved in Facilitative Na+-independent glucose transporters |
| 0.5 | 8.5 | REACTOME IONOTROPIC ACTIVITY OF KAINATE RECEPTORS | Genes involved in Ionotropic activity of Kainate Receptors |
| 0.5 | 27.0 | REACTOME APOPTOTIC CLEAVAGE OF CELLULAR PROTEINS | Genes involved in Apoptotic cleavage of cellular proteins |
| 0.4 | 9.0 | REACTOME SYNTHESIS OF PIPS AT THE GOLGI MEMBRANE | Genes involved in Synthesis of PIPs at the Golgi membrane |
| 0.4 | 8.0 | REACTOME APOPTOSIS INDUCED DNA FRAGMENTATION | Genes involved in Apoptosis induced DNA fragmentation |
| 0.4 | 7.3 | REACTOME GAP JUNCTION DEGRADATION | Genes involved in Gap junction degradation |
| 0.4 | 5.1 | REACTOME VIRAL MESSENGER RNA SYNTHESIS | Genes involved in Viral Messenger RNA Synthesis |
| 0.4 | 12.8 | REACTOME GLUTATHIONE CONJUGATION | Genes involved in Glutathione conjugation |
| 0.4 | 16.4 | REACTOME GLYCOLYSIS | Genes involved in Glycolysis |
| 0.4 | 10.4 | REACTOME SRP DEPENDENT COTRANSLATIONAL PROTEIN TARGETING TO MEMBRANE | Genes involved in SRP-dependent cotranslational protein targeting to membrane |
| 0.3 | 29.6 | REACTOME RESPIRATORY ELECTRON TRANSPORT | Genes involved in Respiratory electron transport |
| 0.3 | 4.7 | REACTOME ACTIVATION OF CHAPERONE GENES BY ATF6 ALPHA | Genes involved in Activation of Chaperone Genes by ATF6-alpha |
| 0.3 | 26.6 | REACTOME ANTIVIRAL MECHANISM BY IFN STIMULATED GENES | Genes involved in Antiviral mechanism by IFN-stimulated genes |
| 0.3 | 6.0 | REACTOME P38MAPK EVENTS | Genes involved in p38MAPK events |
| 0.3 | 3.5 | REACTOME ACTIVATION OF ATR IN RESPONSE TO REPLICATION STRESS | Genes involved in Activation of ATR in response to replication stress |
| 0.3 | 34.0 | REACTOME INFLUENZA VIRAL RNA TRANSCRIPTION AND REPLICATION | Genes involved in Influenza Viral RNA Transcription and Replication |
| 0.3 | 23.7 | REACTOME MITOTIC PROMETAPHASE | Genes involved in Mitotic Prometaphase |
| 0.3 | 5.5 | REACTOME N GLYCAN TRIMMING IN THE ER AND CALNEXIN CALRETICULIN CYCLE | Genes involved in N-glycan trimming in the ER and Calnexin/Calreticulin cycle |
| 0.3 | 1.1 | REACTOME RETROGRADE NEUROTROPHIN SIGNALLING | Genes involved in Retrograde neurotrophin signalling |
| 0.3 | 6.2 | REACTOME MITOCHONDRIAL TRNA AMINOACYLATION | Genes involved in Mitochondrial tRNA aminoacylation |
| 0.3 | 20.9 | REACTOME FORMATION OF THE TERNARY COMPLEX AND SUBSEQUENTLY THE 43S COMPLEX | Genes involved in Formation of the ternary complex, and subsequently, the 43S complex |
| 0.3 | 4.9 | REACTOME EICOSANOID LIGAND BINDING RECEPTORS | Genes involved in Eicosanoid ligand-binding receptors |
| 0.3 | 20.9 | REACTOME DESTABILIZATION OF MRNA BY AUF1 HNRNP D0 | Genes involved in Destabilization of mRNA by AUF1 (hnRNP D0) |
| 0.3 | 4.0 | REACTOME TRAFFICKING OF GLUR2 CONTAINING AMPA RECEPTORS | Genes involved in Trafficking of GluR2-containing AMPA receptors |
| 0.3 | 13.7 | REACTOME NRAGE SIGNALS DEATH THROUGH JNK | Genes involved in NRAGE signals death through JNK |
| 0.3 | 7.1 | REACTOME INSULIN RECEPTOR RECYCLING | Genes involved in Insulin receptor recycling |
| 0.2 | 9.9 | REACTOME P75 NTR RECEPTOR MEDIATED SIGNALLING | Genes involved in p75 NTR receptor-mediated signalling |
| 0.2 | 12.2 | REACTOME TRANSPORT TO THE GOLGI AND SUBSEQUENT MODIFICATION | Genes involved in Transport to the Golgi and subsequent modification |
| 0.2 | 5.5 | REACTOME TRANSLATION | Genes involved in Translation |
| 0.2 | 6.8 | REACTOME SEMA4D INDUCED CELL MIGRATION AND GROWTH CONE COLLAPSE | Genes involved in Sema4D induced cell migration and growth-cone collapse |
| 0.2 | 3.7 | REACTOME SIGNALING BY NODAL | Genes involved in Signaling by NODAL |
| 0.2 | 3.7 | REACTOME HYALURONAN UPTAKE AND DEGRADATION | Genes involved in Hyaluronan uptake and degradation |
| 0.2 | 14.3 | REACTOME MHC CLASS II ANTIGEN PRESENTATION | Genes involved in MHC class II antigen presentation |
| 0.2 | 3.6 | REACTOME VEGF LIGAND RECEPTOR INTERACTIONS | Genes involved in VEGF ligand-receptor interactions |
| 0.2 | 33.7 | REACTOME METABOLISM OF CARBOHYDRATES | Genes involved in Metabolism of carbohydrates |
| 0.2 | 4.5 | REACTOME RECYCLING PATHWAY OF L1 | Genes involved in Recycling pathway of L1 |
| 0.2 | 5.5 | REACTOME SYNTHESIS OF PIPS AT THE PLASMA MEMBRANE | Genes involved in Synthesis of PIPs at the plasma membrane |
| 0.2 | 3.8 | REACTOME FORMATION OF ATP BY CHEMIOSMOTIC COUPLING | Genes involved in Formation of ATP by chemiosmotic coupling |
| 0.2 | 2.7 | REACTOME PRESYNAPTIC NICOTINIC ACETYLCHOLINE RECEPTORS | Genes involved in Presynaptic nicotinic acetylcholine receptors |
| 0.1 | 2.7 | REACTOME PRE NOTCH TRANSCRIPTION AND TRANSLATION | Genes involved in Pre-NOTCH Transcription and Translation |
| 0.1 | 4.9 | REACTOME INHIBITION OF INSULIN SECRETION BY ADRENALINE NORADRENALINE | Genes involved in Inhibition of Insulin Secretion by Adrenaline/Noradrenaline |
| 0.1 | 9.5 | REACTOME GOLGI ASSOCIATED VESICLE BIOGENESIS | Genes involved in Golgi Associated Vesicle Biogenesis |
| 0.1 | 6.6 | REACTOME PPARA ACTIVATES GENE EXPRESSION | Genes involved in PPARA Activates Gene Expression |
| 0.1 | 6.8 | REACTOME DEPOSITION OF NEW CENPA CONTAINING NUCLEOSOMES AT THE CENTROMERE | Genes involved in Deposition of New CENPA-containing Nucleosomes at the Centromere |
| 0.1 | 5.8 | REACTOME TRANSPORT OF VITAMINS NUCLEOSIDES AND RELATED MOLECULES | Genes involved in Transport of vitamins, nucleosides, and related molecules |
| 0.1 | 3.2 | REACTOME CELL EXTRACELLULAR MATRIX INTERACTIONS | Genes involved in Cell-extracellular matrix interactions |
| 0.1 | 16.5 | REACTOME ANTIGEN PROCESSING UBIQUITINATION PROTEASOME DEGRADATION | Genes involved in Antigen processing: Ubiquitination & Proteasome degradation |
| 0.1 | 2.8 | REACTOME BRANCHED CHAIN AMINO ACID CATABOLISM | Genes involved in Branched-chain amino acid catabolism |
| 0.1 | 4.0 | REACTOME MYOGENESIS | Genes involved in Myogenesis |
| 0.1 | 0.7 | REACTOME COPI MEDIATED TRANSPORT | Genes involved in COPI Mediated Transport |
| 0.1 | 4.5 | REACTOME METABOLISM OF VITAMINS AND COFACTORS | Genes involved in Metabolism of vitamins and cofactors |
| 0.1 | 1.5 | REACTOME GAP JUNCTION ASSEMBLY | Genes involved in Gap junction assembly |
| 0.1 | 0.8 | REACTOME ABORTIVE ELONGATION OF HIV1 TRANSCRIPT IN THE ABSENCE OF TAT | Genes involved in Abortive elongation of HIV-1 transcript in the absence of Tat |
| 0.1 | 2.8 | REACTOME NETRIN1 SIGNALING | Genes involved in Netrin-1 signaling |
| 0.1 | 1.4 | REACTOME ACTIVATED POINT MUTANTS OF FGFR2 | Genes involved in Activated point mutants of FGFR2 |
| 0.1 | 2.9 | REACTOME AMINO ACID TRANSPORT ACROSS THE PLASMA MEMBRANE | Genes involved in Amino acid transport across the plasma membrane |
| 0.1 | 1.1 | REACTOME BASIGIN INTERACTIONS | Genes involved in Basigin interactions |
| 0.1 | 2.9 | REACTOME ACTIVATION OF CHAPERONE GENES BY XBP1S | Genes involved in Activation of Chaperone Genes by XBP1(S) |
| 0.1 | 1.0 | REACTOME BASE FREE SUGAR PHOSPHATE REMOVAL VIA THE SINGLE NUCLEOTIDE REPLACEMENT PATHWAY | Genes involved in Base-free sugar-phosphate removal via the single-nucleotide replacement pathway |
| 0.1 | 0.9 | REACTOME PURINE RIBONUCLEOSIDE MONOPHOSPHATE BIOSYNTHESIS | Genes involved in Purine ribonucleoside monophosphate biosynthesis |
| 0.0 | 2.9 | REACTOME DIABETES PATHWAYS | Genes involved in Diabetes pathways |
| 0.0 | 1.3 | REACTOME INTRINSIC PATHWAY FOR APOPTOSIS | Genes involved in Intrinsic Pathway for Apoptosis |
| 0.0 | 2.4 | REACTOME CHEMOKINE RECEPTORS BIND CHEMOKINES | Genes involved in Chemokine receptors bind chemokines |
| 0.0 | 4.4 | REACTOME PROCESSING OF CAPPED INTRON CONTAINING PRE MRNA | Genes involved in Processing of Capped Intron-Containing Pre-mRNA |
| 0.0 | 2.2 | REACTOME FACTORS INVOLVED IN MEGAKARYOCYTE DEVELOPMENT AND PLATELET PRODUCTION | Genes involved in Factors involved in megakaryocyte development and platelet production |
| 0.0 | 0.6 | REACTOME CYTOSOLIC TRNA AMINOACYLATION | Genes involved in Cytosolic tRNA aminoacylation |
| 0.0 | 0.4 | REACTOME REGULATION OF AMPK ACTIVITY VIA LKB1 | Genes involved in Regulation of AMPK activity via LKB1 |
| 0.0 | 0.4 | REACTOME SIGNALING BY FGFR1 FUSION MUTANTS | Genes involved in Signaling by FGFR1 fusion mutants |
| 0.0 | 0.1 | REACTOME NEF MEDIATED DOWNREGULATION OF MHC CLASS I COMPLEX CELL SURFACE EXPRESSION | Genes involved in Nef mediated downregulation of MHC class I complex cell surface expression |
| 0.0 | 0.2 | REACTOME DEFENSINS | Genes involved in Defensins |
| 0.0 | 0.4 | REACTOME STEROID HORMONES | Genes involved in Steroid hormones |