Project
GNF SymAtlas + NCI-60 cancer cell lines, comparison of cancers vs non-cancers, human (Su, 2004; Ross, 2000)
Navigation
Downloads
Results for WT1_MTF1_ZBTB7B
Z-value: 1.41
Motif logo
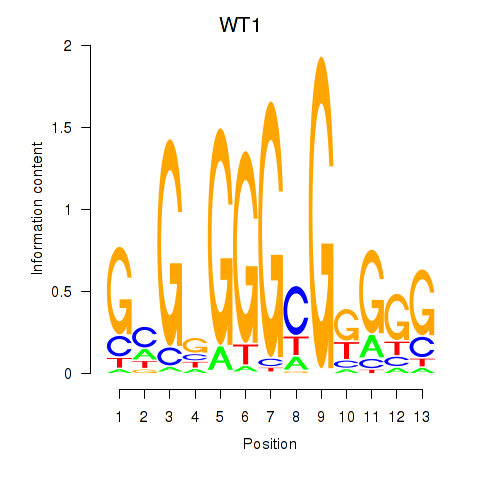
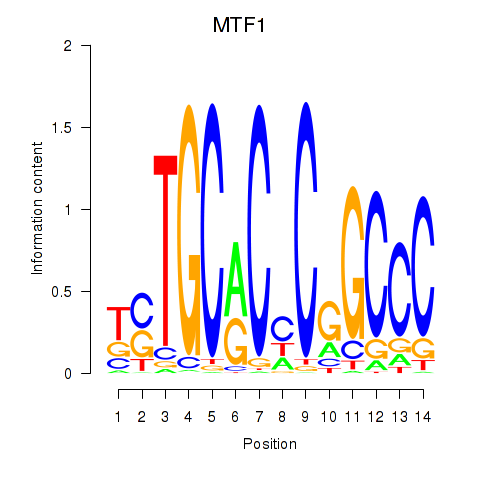
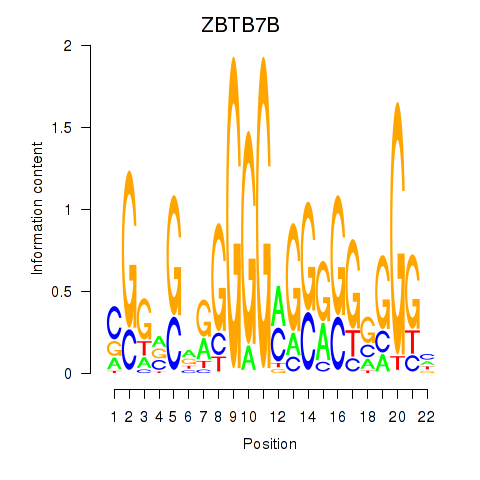
Transcription factors associated with WT1_MTF1_ZBTB7B
| Gene Symbol | Gene ID | Gene Info |
|---|---|---|
|
WT1
|
ENSG00000184937.8 | WT1 transcription factor |
|
MTF1
|
ENSG00000188786.9 | metal regulatory transcription factor 1 |
|
ZBTB7B
|
ENSG00000160685.9 | zinc finger and BTB domain containing 7B |
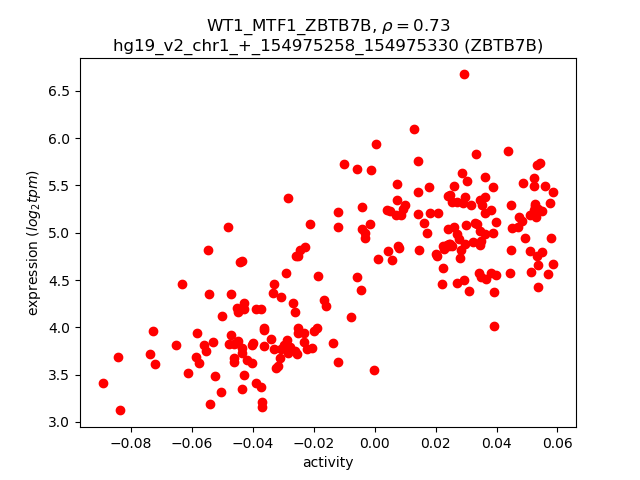
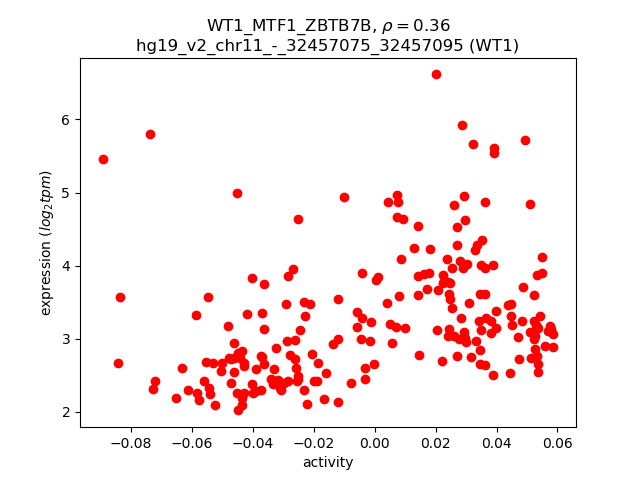
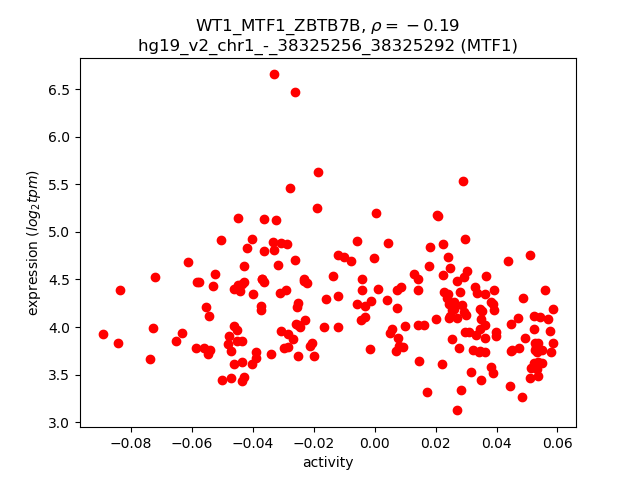
Activity-expression correlation:
| Gene | Promoter | Pearson corr. coef. | P-value | Plot |
|---|---|---|---|---|
| ZBTB7B | hg19_v2_chr1_+_154975258_154975330 | 0.73 | 7.0e-37 | Click! |
| WT1 | hg19_v2_chr11_-_32457075_32457095 | 0.36 | 4.1e-08 | Click! |
| MTF1 | hg19_v2_chr1_-_38325256_38325292 | -0.19 | 5.7e-03 | Click! |
Activity profile of WT1_MTF1_ZBTB7B motif
Sorted Z-values of WT1_MTF1_ZBTB7B motif
| Promoter | Log-likelihood | Transcript | Gene | Gene Info |
|---|---|---|---|---|
| chr11_-_2906979 | 173.24 |
ENST00000380725.1
ENST00000313407.6 ENST00000430149.2 ENST00000440480.2 ENST00000414822.3 |
CDKN1C
|
cyclin-dependent kinase inhibitor 1C (p57, Kip2) |
| chr1_+_6845384 | 159.83 |
ENST00000303635.7
|
CAMTA1
|
calmodulin binding transcription activator 1 |
| chr16_+_58497567 | 130.00 |
ENST00000258187.5
|
NDRG4
|
NDRG family member 4 |
| chr1_-_20812690 | 128.16 |
ENST00000375078.3
|
CAMK2N1
|
calcium/calmodulin-dependent protein kinase II inhibitor 1 |
| chr14_+_102027688 | 127.92 |
ENST00000510508.4
ENST00000359323.3 |
DIO3
|
deiodinase, iodothyronine, type III |
| chr16_+_226658 | 127.65 |
ENST00000320868.5
ENST00000397797.1 |
HBA1
|
hemoglobin, alpha 1 |
| chr12_-_124457257 | 126.33 |
ENST00000545891.1
|
CCDC92
|
coiled-coil domain containing 92 |
| chr11_-_12030629 | 125.62 |
ENST00000396505.2
|
DKK3
|
dickkopf WNT signaling pathway inhibitor 3 |
| chr14_-_81687197 | 124.37 |
ENST00000553612.1
|
GTF2A1
|
general transcription factor IIA, 1, 19/37kDa |
| chr9_+_139873264 | 122.47 |
ENST00000446677.1
|
PTGDS
|
prostaglandin D2 synthase 21kDa (brain) |
| chr17_+_77751931 | 121.15 |
ENST00000310942.4
ENST00000269399.5 |
CBX2
|
chromobox homolog 2 |
| chr10_+_124221036 | 117.40 |
ENST00000368984.3
|
HTRA1
|
HtrA serine peptidase 1 |
| chr16_+_222846 | 111.81 |
ENST00000251595.6
ENST00000397806.1 |
HBA2
|
hemoglobin, alpha 2 |
| chr9_+_137979506 | 105.66 |
ENST00000539529.1
ENST00000392991.4 ENST00000371793.3 |
OLFM1
|
olfactomedin 1 |
| chr12_-_124457371 | 102.92 |
ENST00000238156.3
ENST00000545037.1 |
CCDC92
|
coiled-coil domain containing 92 |
| chr20_-_35492048 | 101.33 |
ENST00000237536.4
|
SOGA1
|
suppressor of glucose, autophagy associated 1 |
| chr15_+_80696666 | 100.43 |
ENST00000303329.4
|
ARNT2
|
aryl-hydrocarbon receptor nuclear translocator 2 |
| chr19_+_708910 | 100.17 |
ENST00000264560.7
|
PALM
|
paralemmin |
| chr20_-_3154162 | 94.94 |
ENST00000360342.3
|
LZTS3
|
Homo sapiens leucine zipper, putative tumor suppressor family member 3 (LZTS3), mRNA. |
| chr7_-_44365020 | 94.63 |
ENST00000395747.2
ENST00000347193.4 ENST00000346990.4 ENST00000258682.6 ENST00000353625.4 ENST00000421607.1 ENST00000424197.1 ENST00000502837.2 ENST00000350811.3 ENST00000395749.2 |
CAMK2B
|
calcium/calmodulin-dependent protein kinase II beta |
| chr19_+_709101 | 90.41 |
ENST00000338448.5
|
PALM
|
paralemmin |
| chr9_+_130374537 | 89.20 |
ENST00000373302.3
ENST00000373299.1 |
STXBP1
|
syntaxin binding protein 1 |
| chr10_-_79397391 | 88.76 |
ENST00000286628.8
ENST00000406533.3 ENST00000354353.5 ENST00000404857.1 |
KCNMA1
|
potassium large conductance calcium-activated channel, subfamily M, alpha member 1 |
| chr8_+_144816303 | 85.84 |
ENST00000533004.1
|
FAM83H-AS1
|
FAM83H antisense RNA 1 (head to head) |
| chr4_-_5894777 | 81.15 |
ENST00000324989.7
|
CRMP1
|
collapsin response mediator protein 1 |
| chr19_+_35521616 | 81.01 |
ENST00000595652.1
|
SCN1B
|
sodium channel, voltage-gated, type I, beta subunit |
| chr6_-_46459099 | 78.68 |
ENST00000371374.1
|
RCAN2
|
regulator of calcineurin 2 |
| chr11_-_134281812 | 78.58 |
ENST00000392580.1
ENST00000312527.4 |
B3GAT1
|
beta-1,3-glucuronyltransferase 1 (glucuronosyltransferase P) |
| chr11_-_12030905 | 78.20 |
ENST00000326932.4
|
DKK3
|
dickkopf WNT signaling pathway inhibitor 3 |
| chr16_+_56623433 | 76.07 |
ENST00000570176.1
|
MT3
|
metallothionein 3 |
| chr16_+_1203194 | 74.07 |
ENST00000348261.5
ENST00000358590.4 |
CACNA1H
|
calcium channel, voltage-dependent, T type, alpha 1H subunit |
| chrX_-_2418596 | 73.92 |
ENST00000381218.3
|
ZBED1
|
zinc finger, BED-type containing 1 |
| chr1_+_169075554 | 69.50 |
ENST00000367815.4
|
ATP1B1
|
ATPase, Na+/K+ transporting, beta 1 polypeptide |
| chr7_-_44365216 | 69.34 |
ENST00000358707.3
ENST00000457475.1 ENST00000440254.2 |
CAMK2B
|
calcium/calmodulin-dependent protein kinase II beta |
| chrX_+_153237740 | 69.28 |
ENST00000369982.4
|
TMEM187
|
transmembrane protein 187 |
| chr13_-_110438914 | 69.24 |
ENST00000375856.3
|
IRS2
|
insulin receptor substrate 2 |
| chr14_-_100070363 | 69.07 |
ENST00000380243.4
|
CCDC85C
|
coiled-coil domain containing 85C |
| chr10_-_75634219 | 67.89 |
ENST00000305762.7
|
CAMK2G
|
calcium/calmodulin-dependent protein kinase II gamma |
| chr16_+_69166418 | 67.79 |
ENST00000314423.7
ENST00000562237.1 ENST00000567460.1 ENST00000566227.1 ENST00000352319.4 ENST00000563094.1 |
CIRH1A
|
cirrhosis, autosomal recessive 1A (cirhin) |
| chr20_+_34742650 | 67.74 |
ENST00000373945.1
ENST00000338074.2 |
EPB41L1
|
erythrocyte membrane protein band 4.1-like 1 |
| chr14_-_81687575 | 67.51 |
ENST00000434192.2
|
GTF2A1
|
general transcription factor IIA, 1, 19/37kDa |
| chr20_+_10199468 | 67.15 |
ENST00000254976.2
ENST00000304886.2 |
SNAP25
|
synaptosomal-associated protein, 25kDa |
| chr19_-_49944806 | 67.13 |
ENST00000221485.3
|
SLC17A7
|
solute carrier family 17 (vesicular glutamate transporter), member 7 |
| chr19_+_589893 | 66.60 |
ENST00000251287.2
|
HCN2
|
hyperpolarization activated cyclic nucleotide-gated potassium channel 2 |
| chr22_+_45898712 | 66.41 |
ENST00000455233.1
ENST00000348697.2 ENST00000402984.3 ENST00000262722.7 ENST00000327858.6 ENST00000442170.2 ENST00000340923.5 ENST00000439835.1 |
FBLN1
|
fibulin 1 |
| chr3_-_149688655 | 66.05 |
ENST00000461930.1
ENST00000423691.2 ENST00000490975.1 ENST00000461868.1 ENST00000452853.2 |
PFN2
|
profilin 2 |
| chr19_+_45409011 | 66.04 |
ENST00000252486.4
ENST00000446996.1 ENST00000434152.1 |
APOE
|
apolipoprotein E |
| chr4_+_4388805 | 65.63 |
ENST00000504171.1
|
NSG1
|
Homo sapiens neuron specific gene family member 1 (NSG1), transcript variant 3, mRNA. |
| chr4_-_84406218 | 65.60 |
ENST00000515303.1
|
FAM175A
|
family with sequence similarity 175, member A |
| chr1_-_11714700 | 65.29 |
ENST00000354287.4
|
FBXO2
|
F-box protein 2 |
| chr3_-_149688502 | 65.21 |
ENST00000481767.1
ENST00000475518.1 |
PFN2
|
profilin 2 |
| chr20_-_62130474 | 64.89 |
ENST00000217182.3
|
EEF1A2
|
eukaryotic translation elongation factor 1 alpha 2 |
| chr3_+_14989186 | 64.48 |
ENST00000435454.1
ENST00000323373.6 |
NR2C2
|
nuclear receptor subfamily 2, group C, member 2 |
| chr12_+_110718921 | 64.06 |
ENST00000308664.6
|
ATP2A2
|
ATPase, Ca++ transporting, cardiac muscle, slow twitch 2 |
| chr17_-_15903002 | 63.97 |
ENST00000399277.1
|
ZSWIM7
|
zinc finger, SWIM-type containing 7 |
| chr19_+_35521572 | 63.59 |
ENST00000262631.5
|
SCN1B
|
sodium channel, voltage-gated, type I, beta subunit |
| chr8_+_1922024 | 62.54 |
ENST00000320248.3
|
KBTBD11
|
kelch repeat and BTB (POZ) domain containing 11 |
| chr11_-_64410787 | 62.47 |
ENST00000301894.2
|
NRXN2
|
neurexin 2 |
| chr8_+_1711918 | 62.31 |
ENST00000331222.4
|
CLN8
|
ceroid-lipofuscinosis, neuronal 8 (epilepsy, progressive with mental retardation) |
| chr14_+_29236269 | 61.84 |
ENST00000313071.4
|
FOXG1
|
forkhead box G1 |
| chr7_-_105029812 | 61.65 |
ENST00000482897.1
|
SRPK2
|
SRSF protein kinase 2 |
| chr19_-_36523709 | 61.31 |
ENST00000592017.1
ENST00000360535.4 |
CLIP3
|
CAP-GLY domain containing linker protein 3 |
| chrX_+_38420783 | 61.25 |
ENST00000422612.2
ENST00000286824.6 ENST00000545599.1 |
TSPAN7
|
tetraspanin 7 |
| chr16_+_56659687 | 61.02 |
ENST00000568293.1
ENST00000330439.6 |
MT1E
|
metallothionein 1E |
| chr15_+_68871308 | 60.88 |
ENST00000261861.5
|
CORO2B
|
coronin, actin binding protein, 2B |
| chr16_-_1020849 | 60.87 |
ENST00000568897.1
|
LMF1
|
lipase maturation factor 1 |
| chr3_-_132441209 | 60.61 |
ENST00000383282.2
ENST00000326682.8 ENST00000343113.4 ENST00000337331.5 |
NPHP3
|
nephronophthisis 3 (adolescent) |
| chrX_-_13956497 | 59.66 |
ENST00000398361.3
|
GPM6B
|
glycoprotein M6B |
| chr14_+_96505659 | 59.63 |
ENST00000555004.1
|
C14orf132
|
chromosome 14 open reading frame 132 |
| chr11_-_116968987 | 59.63 |
ENST00000434315.2
ENST00000292055.4 ENST00000375288.1 ENST00000542607.1 ENST00000445177.1 ENST00000375300.1 ENST00000446921.2 |
SIK3
|
SIK family kinase 3 |
| chr16_+_58533951 | 59.58 |
ENST00000566192.1
ENST00000565088.1 ENST00000568640.1 ENST00000563978.1 ENST00000569923.1 ENST00000356752.4 ENST00000563799.1 ENST00000562999.1 ENST00000570248.1 ENST00000562731.1 ENST00000568424.1 |
NDRG4
|
NDRG family member 4 |
| chr11_-_64512273 | 59.32 |
ENST00000377497.3
ENST00000377487.1 ENST00000430645.1 |
RASGRP2
|
RAS guanyl releasing protein 2 (calcium and DAG-regulated) |
| chr4_-_8873531 | 59.22 |
ENST00000400677.3
|
HMX1
|
H6 family homeobox 1 |
| chrX_+_135229600 | 58.96 |
ENST00000370690.3
|
FHL1
|
four and a half LIM domains 1 |
| chr11_-_117747607 | 58.42 |
ENST00000540359.1
ENST00000539526.1 |
FXYD6
|
FXYD domain containing ion transport regulator 6 |
| chr16_+_56642489 | 58.36 |
ENST00000561491.1
|
MT2A
|
metallothionein 2A |
| chr22_-_38851205 | 58.34 |
ENST00000303592.3
|
KCNJ4
|
potassium inwardly-rectifying channel, subfamily J, member 4 |
| chr9_+_140513438 | 58.26 |
ENST00000462484.1
ENST00000334856.6 ENST00000460843.1 |
EHMT1
|
euchromatic histone-lysine N-methyltransferase 1 |
| chrX_+_135229559 | 58.18 |
ENST00000394155.2
|
FHL1
|
four and a half LIM domains 1 |
| chrX_+_11776410 | 57.81 |
ENST00000361672.2
|
MSL3
|
male-specific lethal 3 homolog (Drosophila) |
| chr2_+_242641442 | 57.27 |
ENST00000313552.6
ENST00000406941.1 |
ING5
|
inhibitor of growth family, member 5 |
| chr6_-_29600832 | 57.17 |
ENST00000377016.4
ENST00000376977.3 ENST00000377034.4 |
GABBR1
|
gamma-aminobutyric acid (GABA) B receptor, 1 |
| chr12_+_53773944 | 57.09 |
ENST00000551969.1
ENST00000327443.4 |
SP1
|
Sp1 transcription factor |
| chr16_+_640201 | 56.62 |
ENST00000563109.1
|
RAB40C
|
RAB40C, member RAS oncogene family |
| chr17_+_4710391 | 56.58 |
ENST00000263088.6
ENST00000572940.1 |
PLD2
|
phospholipase D2 |
| chr2_+_46524537 | 56.54 |
ENST00000263734.3
|
EPAS1
|
endothelial PAS domain protein 1 |
| chr9_-_98079965 | 56.28 |
ENST00000289081.3
|
FANCC
|
Fanconi anemia, complementation group C |
| chr12_-_54982300 | 56.28 |
ENST00000547431.1
|
PPP1R1A
|
protein phosphatase 1, regulatory (inhibitor) subunit 1A |
| chr1_+_25944341 | 56.24 |
ENST00000263979.3
|
MAN1C1
|
mannosidase, alpha, class 1C, member 1 |
| chr12_+_10365404 | 56.19 |
ENST00000266458.5
ENST00000421801.2 ENST00000544284.1 ENST00000545047.1 ENST00000543602.1 ENST00000545887.1 |
GABARAPL1
|
GABA(A) receptor-associated protein like 1 |
| chr2_+_10183651 | 56.18 |
ENST00000305883.1
|
KLF11
|
Kruppel-like factor 11 |
| chr10_+_180987 | 56.00 |
ENST00000381591.1
|
ZMYND11
|
zinc finger, MYND-type containing 11 |
| chr19_+_33685490 | 55.87 |
ENST00000253193.7
|
LRP3
|
low density lipoprotein receptor-related protein 3 |
| chr15_-_77712477 | 55.85 |
ENST00000560626.2
|
PEAK1
|
pseudopodium-enriched atypical kinase 1 |
| chr16_+_84002234 | 55.82 |
ENST00000305202.4
|
NECAB2
|
N-terminal EF-hand calcium binding protein 2 |
| chr14_-_21493649 | 55.82 |
ENST00000553442.1
ENST00000555869.1 ENST00000556457.1 ENST00000397844.2 ENST00000554415.1 |
NDRG2
|
NDRG family member 2 |
| chr22_-_39548627 | 55.81 |
ENST00000216133.5
|
CBX7
|
chromobox homolog 7 |
| chrX_+_38420623 | 55.67 |
ENST00000378482.2
|
TSPAN7
|
tetraspanin 7 |
| chr1_+_151254738 | 55.36 |
ENST00000336715.6
ENST00000324048.5 ENST00000368879.2 |
ZNF687
|
zinc finger protein 687 |
| chr7_-_158380371 | 55.34 |
ENST00000389418.4
ENST00000389416.4 |
PTPRN2
|
protein tyrosine phosphatase, receptor type, N polypeptide 2 |
| chr10_-_735553 | 55.28 |
ENST00000280886.6
ENST00000423550.1 |
DIP2C
|
DIP2 disco-interacting protein 2 homolog C (Drosophila) |
| chr19_-_16582815 | 55.09 |
ENST00000455140.2
ENST00000248070.6 ENST00000594975.1 |
EPS15L1
|
epidermal growth factor receptor pathway substrate 15-like 1 |
| chr2_+_26915584 | 54.88 |
ENST00000302909.3
|
KCNK3
|
potassium channel, subfamily K, member 3 |
| chr10_-_105452917 | 54.85 |
ENST00000427662.2
|
SH3PXD2A
|
SH3 and PX domains 2A |
| chr11_+_125774362 | 54.52 |
ENST00000530414.1
ENST00000530129.2 |
DDX25
|
DEAD (Asp-Glu-Ala-Asp) box helicase 25 |
| chr2_+_20646824 | 54.37 |
ENST00000272233.4
|
RHOB
|
ras homolog family member B |
| chr7_+_65338230 | 54.33 |
ENST00000360768.3
|
VKORC1L1
|
vitamin K epoxide reductase complex, subunit 1-like 1 |
| chr19_-_460996 | 54.19 |
ENST00000264554.6
|
SHC2
|
SHC (Src homology 2 domain containing) transforming protein 2 |
| chr5_-_11904152 | 54.13 |
ENST00000304623.8
ENST00000458100.2 |
CTNND2
|
catenin (cadherin-associated protein), delta 2 |
| chr12_+_57610562 | 54.10 |
ENST00000349394.5
|
NXPH4
|
neurexophilin 4 |
| chr16_+_85061367 | 53.93 |
ENST00000538274.1
ENST00000258180.3 |
KIAA0513
|
KIAA0513 |
| chr1_-_182360918 | 53.85 |
ENST00000339526.4
|
GLUL
|
glutamate-ammonia ligase |
| chr8_-_11725549 | 53.75 |
ENST00000505496.2
ENST00000534636.1 ENST00000524500.1 ENST00000345125.3 ENST00000453527.2 ENST00000527215.2 ENST00000532392.1 ENST00000533455.1 ENST00000534510.1 ENST00000530640.2 ENST00000531089.1 ENST00000532656.2 ENST00000531502.1 ENST00000434271.1 ENST00000353047.6 |
CTSB
|
cathepsin B |
| chr3_+_50712672 | 53.72 |
ENST00000266037.9
|
DOCK3
|
dedicator of cytokinesis 3 |
| chr13_-_30881621 | 53.52 |
ENST00000380615.3
|
KATNAL1
|
katanin p60 subunit A-like 1 |
| chr5_+_76506706 | 53.51 |
ENST00000340978.3
ENST00000346042.3 ENST00000264917.5 ENST00000342343.4 ENST00000333194.4 |
PDE8B
|
phosphodiesterase 8B |
| chr14_+_100150622 | 53.49 |
ENST00000261835.3
|
CYP46A1
|
cytochrome P450, family 46, subfamily A, polypeptide 1 |
| chr9_+_17579084 | 53.48 |
ENST00000380607.4
|
SH3GL2
|
SH3-domain GRB2-like 2 |
| chr4_-_5890145 | 53.44 |
ENST00000397890.2
|
CRMP1
|
collapsin response mediator protein 1 |
| chr1_-_235813290 | 53.09 |
ENST00000391854.2
|
GNG4
|
guanine nucleotide binding protein (G protein), gamma 4 |
| chr14_+_105781048 | 53.05 |
ENST00000458164.2
ENST00000447393.1 |
PACS2
|
phosphofurin acidic cluster sorting protein 2 |
| chr11_-_111783595 | 53.01 |
ENST00000528628.1
|
CRYAB
|
crystallin, alpha B |
| chr1_-_32229523 | 53.00 |
ENST00000398547.1
ENST00000373655.2 ENST00000373658.3 ENST00000257070.4 |
BAI2
|
brain-specific angiogenesis inhibitor 2 |
| chr9_-_138799070 | 52.91 |
ENST00000389532.4
ENST00000409386.3 |
CAMSAP1
|
calmodulin regulated spectrin-associated protein 1 |
| chr11_-_777467 | 52.73 |
ENST00000397472.2
ENST00000524550.1 ENST00000319863.8 ENST00000526325.1 ENST00000442059.2 |
PDDC1
|
Parkinson disease 7 domain containing 1 |
| chr22_+_43808014 | 52.67 |
ENST00000334209.5
ENST00000443721.1 ENST00000414469.2 ENST00000439548.1 |
MPPED1
|
metallophosphoesterase domain containing 1 |
| chr6_-_84418860 | 52.44 |
ENST00000521743.1
|
SNAP91
|
synaptosomal-associated protein, 91kDa |
| chr2_+_54198210 | 52.43 |
ENST00000607452.1
ENST00000422521.2 |
ACYP2
|
acylphosphatase 2, muscle type |
| chr16_+_1662326 | 52.42 |
ENST00000397412.3
|
CRAMP1L
|
Crm, cramped-like (Drosophila) |
| chr9_+_130965677 | 52.11 |
ENST00000393594.3
ENST00000486160.1 |
DNM1
|
dynamin 1 |
| chr22_+_17082732 | 51.84 |
ENST00000558085.2
ENST00000592918.1 ENST00000400593.2 ENST00000592107.1 ENST00000426585.1 ENST00000591299.1 |
TPTEP1
|
transmembrane phosphatase with tensin homology pseudogene 1 |
| chr6_+_31865552 | 51.82 |
ENST00000469372.1
ENST00000497706.1 |
C2
|
complement component 2 |
| chr8_-_18871159 | 51.79 |
ENST00000327040.8
ENST00000440756.2 |
PSD3
|
pleckstrin and Sec7 domain containing 3 |
| chr13_+_27131798 | 51.77 |
ENST00000361042.4
|
WASF3
|
WAS protein family, member 3 |
| chr15_-_83316254 | 51.74 |
ENST00000567678.1
ENST00000450751.2 |
CPEB1
|
cytoplasmic polyadenylation element binding protein 1 |
| chr3_-_126194707 | 51.73 |
ENST00000336332.5
ENST00000389709.3 |
ZXDC
|
ZXD family zinc finger C |
| chr14_-_103987679 | 51.69 |
ENST00000553610.1
|
CKB
|
creatine kinase, brain |
| chr10_-_75634260 | 51.34 |
ENST00000372765.1
ENST00000351293.3 |
CAMK2G
|
calcium/calmodulin-dependent protein kinase II gamma |
| chr5_-_693500 | 51.32 |
ENST00000360578.5
|
TPPP
|
tubulin polymerization promoting protein |
| chr17_-_74707037 | 51.30 |
ENST00000355797.3
ENST00000375036.2 ENST00000449428.2 |
MXRA7
|
matrix-remodelling associated 7 |
| chr4_+_1795012 | 51.22 |
ENST00000481110.2
ENST00000340107.4 ENST00000440486.2 ENST00000412135.2 |
FGFR3
|
fibroblast growth factor receptor 3 |
| chr20_-_23618582 | 50.65 |
ENST00000398411.1
ENST00000376925.3 |
CST3
|
cystatin C |
| chr1_-_32229934 | 50.48 |
ENST00000398542.1
|
BAI2
|
brain-specific angiogenesis inhibitor 2 |
| chr12_-_54982420 | 50.41 |
ENST00000257905.8
|
PPP1R1A
|
protein phosphatase 1, regulatory (inhibitor) subunit 1A |
| chr9_+_132427883 | 50.37 |
ENST00000372469.4
|
PRRX2
|
paired related homeobox 2 |
| chr5_-_11904100 | 50.34 |
ENST00000359640.2
|
CTNND2
|
catenin (cadherin-associated protein), delta 2 |
| chr22_+_19701985 | 50.21 |
ENST00000455784.2
ENST00000406395.1 |
SEPT5
|
septin 5 |
| chr8_+_142402089 | 50.12 |
ENST00000521578.1
ENST00000520105.1 ENST00000523147.1 |
PTP4A3
|
protein tyrosine phosphatase type IVA, member 3 |
| chr6_-_84419101 | 50.06 |
ENST00000520302.1
ENST00000520213.1 ENST00000439399.2 ENST00000428679.2 ENST00000437520.1 |
SNAP91
|
synaptosomal-associated protein, 91kDa |
| chr2_-_38604398 | 50.01 |
ENST00000443098.1
ENST00000449130.1 ENST00000378954.4 ENST00000539122.1 ENST00000419554.2 ENST00000451483.1 ENST00000406122.1 |
ATL2
|
atlastin GTPase 2 |
| chr15_+_68871569 | 49.83 |
ENST00000566799.1
|
CORO2B
|
coronin, actin binding protein, 2B |
| chr15_-_44829057 | 49.62 |
ENST00000559356.1
ENST00000560049.1 ENST00000313807.4 |
EIF3J-AS1
|
EIF3J antisense RNA 1 (head to head) |
| chr1_+_1981890 | 49.50 |
ENST00000378567.3
ENST00000468310.1 |
PRKCZ
|
protein kinase C, zeta |
| chr8_+_136469684 | 49.41 |
ENST00000355849.5
|
KHDRBS3
|
KH domain containing, RNA binding, signal transduction associated 3 |
| chr7_-_139477500 | 49.16 |
ENST00000406875.3
ENST00000428878.2 |
HIPK2
|
homeodomain interacting protein kinase 2 |
| chr22_+_51039098 | 49.07 |
ENST00000399912.1
ENST00000329492.3 ENST00000442429.2 ENST00000341339.4 |
MAPK8IP2
|
mitogen-activated protein kinase 8 interacting protein 2 |
| chr5_+_17217669 | 49.04 |
ENST00000322611.3
|
BASP1
|
brain abundant, membrane attached signal protein 1 |
| chr15_+_99791567 | 48.95 |
ENST00000558879.1
ENST00000301981.3 ENST00000422500.2 ENST00000447360.2 ENST00000442993.2 |
LRRC28
|
leucine rich repeat containing 28 |
| chr3_-_194991876 | 48.92 |
ENST00000310380.6
|
XXYLT1
|
xyloside xylosyltransferase 1 |
| chr22_+_41777927 | 48.88 |
ENST00000266304.4
|
TEF
|
thyrotrophic embryonic factor |
| chr18_-_78005231 | 48.84 |
ENST00000470488.2
ENST00000353265.3 |
PARD6G
|
par-6 family cell polarity regulator gamma |
| chr2_-_25896380 | 48.83 |
ENST00000545439.1
ENST00000407186.1 ENST00000406818.3 ENST00000404103.3 ENST00000407661.3 ENST00000407038.3 ENST00000405222.1 ENST00000288642.8 |
DTNB
|
dystrobrevin, beta |
| chr7_-_158622210 | 48.74 |
ENST00000251527.5
|
ESYT2
|
extended synaptotagmin-like protein 2 |
| chr2_+_17935119 | 48.62 |
ENST00000317402.7
|
GEN1
|
GEN1 Holliday junction 5' flap endonuclease |
| chr11_-_113746212 | 48.56 |
ENST00000537642.1
ENST00000537706.1 ENST00000544750.1 ENST00000260188.5 ENST00000540925.1 |
USP28
|
ubiquitin specific peptidase 28 |
| chr13_+_27131887 | 48.50 |
ENST00000335327.5
|
WASF3
|
WAS protein family, member 3 |
| chr7_+_94023873 | 48.38 |
ENST00000297268.6
|
COL1A2
|
collagen, type I, alpha 2 |
| chr19_-_18717627 | 48.37 |
ENST00000392386.3
|
CRLF1
|
cytokine receptor-like factor 1 |
| chr15_+_74833518 | 48.27 |
ENST00000346246.5
|
ARID3B
|
AT rich interactive domain 3B (BRIGHT-like) |
| chr15_+_69222827 | 48.25 |
ENST00000310673.3
ENST00000448182.3 ENST00000260364.5 |
SPESP1
NOX5
|
sperm equatorial segment protein 1 NADPH oxidase, EF-hand calcium binding domain 5 |
| chr1_+_156698708 | 48.14 |
ENST00000519086.1
|
RRNAD1
|
ribosomal RNA adenine dimethylase domain containing 1 |
| chr3_-_183543301 | 48.05 |
ENST00000318631.3
ENST00000431348.1 |
MAP6D1
|
MAP6 domain containing 1 |
| chr11_-_2160611 | 48.00 |
ENST00000416167.2
|
IGF2
|
insulin-like growth factor 2 (somatomedin A) |
| chr9_+_132934835 | 47.99 |
ENST00000372398.3
|
NCS1
|
neuronal calcium sensor 1 |
| chr1_-_182361327 | 47.98 |
ENST00000331872.6
ENST00000311223.5 |
GLUL
|
glutamate-ammonia ligase |
| chrX_-_13956737 | 47.85 |
ENST00000454189.2
|
GPM6B
|
glycoprotein M6B |
| chrX_-_17878827 | 47.84 |
ENST00000360011.1
|
RAI2
|
retinoic acid induced 2 |
| chr1_-_182360498 | 47.80 |
ENST00000417584.2
|
GLUL
|
glutamate-ammonia ligase |
| chr16_-_402639 | 47.79 |
ENST00000262320.3
|
AXIN1
|
axin 1 |
| chr9_-_99417562 | 47.71 |
ENST00000375234.3
ENST00000446045.1 |
AAED1
|
AhpC/TSA antioxidant enzyme domain containing 1 |
| chr11_-_64511789 | 47.60 |
ENST00000419843.1
ENST00000394430.1 |
RASGRP2
|
RAS guanyl releasing protein 2 (calcium and DAG-regulated) |
| chrX_+_135229731 | 47.60 |
ENST00000420362.1
|
FHL1
|
four and a half LIM domains 1 |
| chr19_+_50706866 | 47.52 |
ENST00000440075.2
ENST00000376970.2 ENST00000425460.1 ENST00000599920.1 ENST00000601313.1 |
MYH14
|
myosin, heavy chain 14, non-muscle |
| chr3_+_49507674 | 47.51 |
ENST00000431960.1
ENST00000452317.1 ENST00000435508.2 ENST00000452060.1 ENST00000428779.1 ENST00000419218.1 ENST00000430636.1 |
DAG1
|
dystroglycan 1 (dystrophin-associated glycoprotein 1) |
| chr7_-_143059780 | 47.48 |
ENST00000409578.1
ENST00000409346.1 |
FAM131B
|
family with sequence similarity 131, member B |
| chr9_-_13279589 | 47.40 |
ENST00000319217.7
|
MPDZ
|
multiple PDZ domain protein |
| chr1_+_10270863 | 47.22 |
ENST00000377093.4
ENST00000263934.6 |
KIF1B
|
kinesin family member 1B |
| chr2_+_17935383 | 47.14 |
ENST00000524465.1
ENST00000381254.2 ENST00000532257.1 |
GEN1
|
GEN1 Holliday junction 5' flap endonuclease |
| chr20_-_50385138 | 47.13 |
ENST00000338821.5
|
ATP9A
|
ATPase, class II, type 9A |
| chr7_-_105029329 | 46.78 |
ENST00000393651.3
ENST00000460391.1 |
SRPK2
|
SRSF protein kinase 2 |
| chr7_+_45613958 | 46.78 |
ENST00000297323.7
|
ADCY1
|
adenylate cyclase 1 (brain) |
| chr9_-_13279563 | 46.67 |
ENST00000541718.1
|
MPDZ
|
multiple PDZ domain protein |
| chr22_-_45559642 | 46.63 |
ENST00000426282.2
|
CTA-217C2.1
|
CTA-217C2.1 |
| chr17_-_79139817 | 46.51 |
ENST00000326724.4
|
AATK
|
apoptosis-associated tyrosine kinase |
| chr11_-_113746277 | 46.40 |
ENST00000003302.4
ENST00000545540.1 |
USP28
|
ubiquitin specific peptidase 28 |
| chr19_-_4457776 | 46.31 |
ENST00000301281.6
|
UBXN6
|
UBX domain protein 6 |
| chr9_-_13279406 | 46.18 |
ENST00000546205.1
|
MPDZ
|
multiple PDZ domain protein |
| chr2_-_175869936 | 46.11 |
ENST00000409900.3
|
CHN1
|
chimerin 1 |
| chr11_-_236326 | 45.92 |
ENST00000525237.1
ENST00000532956.1 ENST00000525319.1 ENST00000524564.1 ENST00000382743.4 |
SIRT3
|
sirtuin 3 |
| chr16_+_56225248 | 45.88 |
ENST00000262493.6
|
GNAO1
|
guanine nucleotide binding protein (G protein), alpha activating activity polypeptide O |
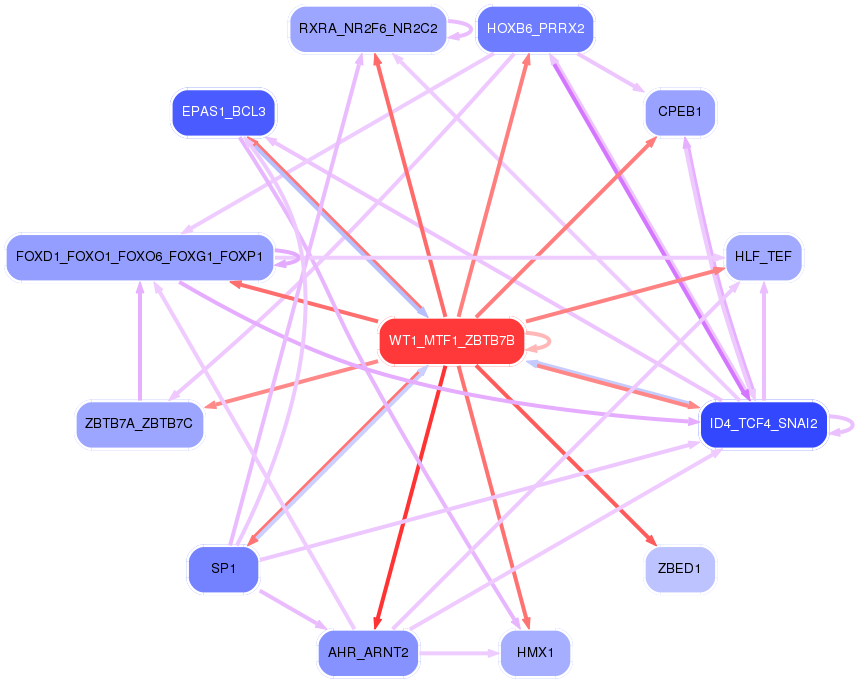
Network of associatons between targets according to the STRING database.

First level regulatory network of WT1_MTF1_ZBTB7B
Gene Ontology Analysis
Gene overrepresentation in biological_process category:
| Log-likelihood per target | Total log-likelihood | Term | Description |
|---|---|---|---|
| 51.0 | 203.8 | GO:1902612 | regulation of anti-Mullerian hormone signaling pathway(GO:1902612) negative regulation of anti-Mullerian hormone signaling pathway(GO:1902613) anti-Mullerian hormone signaling pathway(GO:1990262) |
| 50.9 | 152.8 | GO:0021966 | corticospinal neuron axon guidance(GO:0021966) |
| 46.4 | 139.1 | GO:0031630 | regulation of synaptic vesicle fusion to presynaptic membrane(GO:0031630) |
| 44.9 | 134.6 | GO:1904617 | negative regulation of actin filament binding(GO:1904530) negative regulation of actin binding(GO:1904617) |
| 44.5 | 133.4 | GO:0016185 | synaptic vesicle budding from presynaptic endocytic zone membrane(GO:0016185) |
| 38.9 | 116.7 | GO:1903697 | negative regulation of microvillus assembly(GO:1903697) |
| 38.8 | 116.4 | GO:0071140 | resolution of recombination intermediates(GO:0071139) resolution of mitotic recombination intermediates(GO:0071140) |
| 37.4 | 149.6 | GO:0006542 | glutamine biosynthetic process(GO:0006542) |
| 30.3 | 90.8 | GO:0043012 | regulation of fusion of sperm to egg plasma membrane(GO:0043012) |
| 29.3 | 263.6 | GO:0003190 | atrioventricular valve formation(GO:0003190) |
| 28.3 | 226.5 | GO:0060160 | negative regulation of dopamine receptor signaling pathway(GO:0060160) |
| 28.0 | 84.1 | GO:0042137 | sequestering of neurotransmitter(GO:0042137) |
| 27.1 | 135.3 | GO:0060718 | chorionic trophoblast cell differentiation(GO:0060718) |
| 26.6 | 53.1 | GO:0042308 | negative regulation of protein import into nucleus(GO:0042308) negative regulation of protein localization to nucleus(GO:1900181) negative regulation of protein import(GO:1904590) |
| 26.5 | 79.5 | GO:0014807 | regulation of somitogenesis(GO:0014807) |
| 26.1 | 104.3 | GO:0097114 | NMDA glutamate receptor clustering(GO:0097114) |
| 26.0 | 78.0 | GO:0033693 | neurofilament bundle assembly(GO:0033693) |
| 25.9 | 77.8 | GO:2000296 | negative regulation of hydrogen peroxide catabolic process(GO:2000296) |
| 25.9 | 77.7 | GO:0019072 | viral genome packaging(GO:0019072) viral RNA genome packaging(GO:0019074) |
| 24.6 | 172.3 | GO:0042670 | retinal cone cell differentiation(GO:0042670) retinal cone cell development(GO:0046549) |
| 24.5 | 122.3 | GO:0035063 | nuclear speck organization(GO:0035063) |
| 23.9 | 23.9 | GO:0070314 | G1 to G0 transition(GO:0070314) |
| 23.6 | 70.9 | GO:0070830 | bicellular tight junction assembly(GO:0070830) |
| 23.6 | 94.3 | GO:0072675 | multinuclear osteoclast differentiation(GO:0072674) osteoclast fusion(GO:0072675) |
| 23.0 | 69.0 | GO:0030046 | parallel actin filament bundle assembly(GO:0030046) |
| 22.9 | 91.7 | GO:0030644 | cellular chloride ion homeostasis(GO:0030644) |
| 22.9 | 160.0 | GO:1902746 | regulation of lens fiber cell differentiation(GO:1902746) |
| 22.6 | 22.6 | GO:0044333 | Wnt signaling pathway involved in digestive tract morphogenesis(GO:0044333) |
| 22.3 | 89.4 | GO:0044861 | protein transport into plasma membrane raft(GO:0044861) |
| 22.1 | 44.2 | GO:0072237 | metanephric proximal tubule development(GO:0072237) |
| 21.8 | 87.0 | GO:1904565 | response to 1-oleoyl-sn-glycerol 3-phosphate(GO:1904565) cellular response to 1-oleoyl-sn-glycerol 3-phosphate(GO:1904566) |
| 21.7 | 65.1 | GO:0006535 | cysteine biosynthetic process from serine(GO:0006535) |
| 21.6 | 64.9 | GO:0060168 | positive regulation of adenosine receptor signaling pathway(GO:0060168) |
| 21.5 | 129.1 | GO:0036016 | response to interleukin-3(GO:0036015) cellular response to interleukin-3(GO:0036016) |
| 21.2 | 106.0 | GO:0090272 | negative regulation of fibroblast growth factor production(GO:0090272) |
| 21.1 | 42.3 | GO:0045921 | positive regulation of exocytosis(GO:0045921) |
| 21.1 | 84.6 | GO:0042412 | taurine biosynthetic process(GO:0042412) |
| 20.3 | 61.0 | GO:1903233 | regulation of calcium ion-dependent exocytosis of neurotransmitter(GO:1903233) |
| 20.2 | 20.2 | GO:0060352 | cell adhesion molecule production(GO:0060352) regulation of cell adhesion molecule production(GO:0060353) positive regulation of cell adhesion molecule production(GO:0060355) |
| 20.1 | 261.2 | GO:2001135 | regulation of endocytic recycling(GO:2001135) |
| 19.7 | 118.1 | GO:0071321 | cellular response to cGMP(GO:0071321) |
| 19.5 | 58.6 | GO:2000705 | dense core granule biogenesis(GO:0061110) regulation of dense core granule biogenesis(GO:2000705) |
| 19.4 | 38.8 | GO:0072134 | nephrogenic mesenchyme morphogenesis(GO:0072134) |
| 18.7 | 37.3 | GO:2000820 | negative regulation of transcription from RNA polymerase II promoter involved in smooth muscle cell differentiation(GO:2000820) |
| 18.3 | 18.3 | GO:0050884 | neuromuscular process controlling posture(GO:0050884) |
| 18.1 | 54.4 | GO:2000182 | regulation of progesterone biosynthetic process(GO:2000182) |
| 18.0 | 72.2 | GO:0060594 | mammary gland specification(GO:0060594) |
| 18.0 | 251.3 | GO:0030007 | cellular potassium ion homeostasis(GO:0030007) |
| 17.8 | 231.4 | GO:0051823 | regulation of synapse structural plasticity(GO:0051823) |
| 17.8 | 88.8 | GO:0006041 | glucosamine metabolic process(GO:0006041) |
| 17.7 | 17.7 | GO:0010701 | positive regulation of norepinephrine secretion(GO:0010701) |
| 17.6 | 52.8 | GO:0021718 | superior olivary nucleus development(GO:0021718) superior olivary nucleus maturation(GO:0021722) |
| 17.6 | 17.6 | GO:0001954 | positive regulation of cell-matrix adhesion(GO:0001954) |
| 17.5 | 209.8 | GO:1900028 | negative regulation of ruffle assembly(GO:1900028) |
| 17.1 | 68.4 | GO:0048496 | maintenance of organ identity(GO:0048496) |
| 17.1 | 17.1 | GO:2000591 | negative regulation of phosphatidylinositol biosynthetic process(GO:0010512) cell migration involved in kidney development(GO:0035787) cell migration involved in metanephros development(GO:0035788) metanephric mesenchymal cell migration(GO:0035789) positive regulation of metanephric mesenchymal cell migration by platelet-derived growth factor receptor-beta signaling pathway(GO:0035793) regulation of metanephric mesenchymal cell migration by platelet-derived growth factor receptor-beta signaling pathway(GO:1900238) regulation of metanephric mesenchymal cell migration(GO:2000589) positive regulation of metanephric mesenchymal cell migration(GO:2000591) |
| 16.9 | 67.5 | GO:0019086 | late viral transcription(GO:0019086) |
| 16.8 | 16.8 | GO:1903350 | response to dopamine(GO:1903350) cellular response to dopamine(GO:1903351) |
| 16.8 | 50.4 | GO:1904647 | response to rotenone(GO:1904647) |
| 16.7 | 33.4 | GO:0014898 | muscle hypertrophy in response to stress(GO:0003299) cardiac muscle adaptation(GO:0014887) cardiac muscle hypertrophy in response to stress(GO:0014898) |
| 16.5 | 49.6 | GO:0008355 | olfactory learning(GO:0008355) |
| 16.5 | 164.9 | GO:1990416 | cellular response to brain-derived neurotrophic factor stimulus(GO:1990416) |
| 16.3 | 162.7 | GO:0032000 | positive regulation of fatty acid beta-oxidation(GO:0032000) |
| 16.2 | 81.1 | GO:0031580 | membrane raft polarization(GO:0001766) membrane raft distribution(GO:0031580) |
| 16.1 | 64.4 | GO:0048319 | axial mesoderm morphogenesis(GO:0048319) |
| 16.1 | 48.3 | GO:1902534 | single-organism membrane invagination(GO:1902534) |
| 16.1 | 96.4 | GO:1904381 | Golgi apparatus mannose trimming(GO:1904381) |
| 16.0 | 16.0 | GO:0075071 | autophagy of host cells involved in interaction with symbiont(GO:0075044) autophagy involved in symbiotic interaction(GO:0075071) |
| 16.0 | 16.0 | GO:0007518 | myoblast fate determination(GO:0007518) |
| 15.9 | 31.8 | GO:0060716 | labyrinthine layer blood vessel development(GO:0060716) |
| 15.9 | 111.1 | GO:0007354 | zygotic determination of anterior/posterior axis, embryo(GO:0007354) |
| 15.6 | 62.5 | GO:0060313 | negative regulation of blood vessel remodeling(GO:0060313) |
| 15.3 | 15.3 | GO:0045763 | negative regulation of cellular amino acid metabolic process(GO:0045763) |
| 15.3 | 15.3 | GO:1902809 | skeletal muscle fiber differentiation(GO:0098528) regulation of skeletal muscle fiber differentiation(GO:1902809) |
| 15.3 | 76.6 | GO:0097091 | synaptic vesicle clustering(GO:0097091) |
| 15.2 | 45.7 | GO:0048687 | modulation by virus of host transcription(GO:0019056) positive regulation of sprouting of injured axon(GO:0048687) positive regulation of axon extension involved in regeneration(GO:0048691) modulation by symbiont of host transcription(GO:0052026) |
| 14.9 | 14.9 | GO:0010807 | regulation of synaptic vesicle priming(GO:0010807) |
| 14.9 | 44.8 | GO:1990502 | dense core granule maturation(GO:1990502) |
| 14.9 | 14.9 | GO:0002265 | astrocyte activation involved in immune response(GO:0002265) |
| 14.8 | 44.4 | GO:1903401 | L-lysine transmembrane transport(GO:1903401) |
| 14.7 | 58.8 | GO:1904393 | regulation of skeletal muscle acetylcholine-gated channel clustering(GO:1904393) |
| 14.5 | 58.2 | GO:0099590 | neurotransmitter receptor internalization(GO:0099590) |
| 14.4 | 72.1 | GO:0061107 | seminal vesicle development(GO:0061107) |
| 14.4 | 43.2 | GO:0032474 | otolith morphogenesis(GO:0032474) |
| 14.4 | 14.4 | GO:0035284 | central nervous system segmentation(GO:0035283) brain segmentation(GO:0035284) |
| 14.3 | 57.4 | GO:2000672 | negative regulation of motor neuron apoptotic process(GO:2000672) |
| 14.3 | 14.3 | GO:0036118 | hyaluranon cable assembly(GO:0036118) regulation of hyaluranon cable assembly(GO:1900104) positive regulation of hyaluranon cable assembly(GO:1900106) |
| 14.3 | 71.3 | GO:0015670 | carbon dioxide transport(GO:0015670) |
| 14.3 | 14.3 | GO:1903059 | regulation of protein lipidation(GO:1903059) positive regulation of protein lipidation(GO:1903061) |
| 14.1 | 56.5 | GO:0061091 | regulation of phospholipid translocation(GO:0061091) positive regulation of phospholipid translocation(GO:0061092) |
| 14.1 | 112.8 | GO:2000766 | negative regulation of cytoplasmic translation(GO:2000766) |
| 14.1 | 126.8 | GO:2000467 | positive regulation of glycogen (starch) synthase activity(GO:2000467) |
| 14.1 | 70.4 | GO:0016476 | regulation of embryonic cell shape(GO:0016476) |
| 13.9 | 83.7 | GO:0033504 | floor plate development(GO:0033504) |
| 13.9 | 41.8 | GO:0060437 | lung growth(GO:0060437) |
| 13.9 | 41.8 | GO:0038098 | sequestering of BMP from receptor via BMP binding(GO:0038098) |
| 13.8 | 55.1 | GO:0014063 | negative regulation of serotonin secretion(GO:0014063) |
| 13.7 | 27.5 | GO:0006975 | DNA damage induced protein phosphorylation(GO:0006975) |
| 13.7 | 96.0 | GO:1902174 | positive regulation of keratinocyte apoptotic process(GO:1902174) |
| 13.7 | 41.1 | GO:0003358 | noradrenergic neuron development(GO:0003358) |
| 13.6 | 13.6 | GO:0010633 | negative regulation of epithelial cell migration(GO:0010633) |
| 13.4 | 53.5 | GO:1990535 | neuron projection maintenance(GO:1990535) |
| 13.3 | 13.3 | GO:0021798 | forebrain dorsal/ventral pattern formation(GO:0021798) |
| 13.3 | 39.9 | GO:1990504 | dense core granule exocytosis(GO:1990504) |
| 13.3 | 79.7 | GO:0036166 | phenotypic switching(GO:0036166) regulation of phenotypic switching(GO:1900239) |
| 13.2 | 131.8 | GO:0051581 | negative regulation of neurotransmitter uptake(GO:0051581) serotonin uptake(GO:0051610) regulation of serotonin uptake(GO:0051611) negative regulation of serotonin uptake(GO:0051612) |
| 13.1 | 52.6 | GO:0050882 | voluntary musculoskeletal movement(GO:0050882) |
| 13.1 | 105.1 | GO:0097116 | gephyrin clustering involved in postsynaptic density assembly(GO:0097116) |
| 13.0 | 78.2 | GO:0018095 | protein polyglutamylation(GO:0018095) |
| 12.9 | 38.8 | GO:1900454 | positive regulation of long term synaptic depression(GO:1900454) |
| 12.9 | 51.6 | GO:0010900 | negative regulation of phosphatidylcholine catabolic process(GO:0010900) |
| 12.9 | 103.1 | GO:0033578 | protein glycosylation in Golgi(GO:0033578) |
| 12.9 | 51.5 | GO:0019470 | 4-hydroxyproline catabolic process(GO:0019470) |
| 12.8 | 38.3 | GO:0070940 | dephosphorylation of RNA polymerase II C-terminal domain(GO:0070940) |
| 12.5 | 25.0 | GO:0003308 | negative regulation of Wnt signaling pathway involved in heart development(GO:0003308) |
| 12.4 | 24.8 | GO:0045715 | negative regulation of low-density lipoprotein particle receptor biosynthetic process(GO:0045715) |
| 12.4 | 86.7 | GO:2000124 | regulation of endocannabinoid signaling pathway(GO:2000124) |
| 12.3 | 37.0 | GO:0061535 | glutamate secretion, neurotransmission(GO:0061535) |
| 12.3 | 36.9 | GO:0043006 | activation of phospholipase A2 activity by calcium-mediated signaling(GO:0043006) |
| 12.3 | 12.3 | GO:0098828 | positive regulation of inhibitory postsynaptic potential(GO:0097151) modulation of inhibitory postsynaptic potential(GO:0098828) |
| 12.1 | 60.7 | GO:0036369 | transcription factor catabolic process(GO:0036369) |
| 12.0 | 36.0 | GO:1900169 | regulation of glucocorticoid mediated signaling pathway(GO:1900169) |
| 12.0 | 36.0 | GO:1901350 | cell-cell signaling involved in cell-cell junction organization(GO:1901350) |
| 12.0 | 59.9 | GO:0015891 | iron chelate transport(GO:0015688) siderophore transport(GO:0015891) |
| 12.0 | 83.8 | GO:1903818 | positive regulation of voltage-gated potassium channel activity(GO:1903818) |
| 11.9 | 35.8 | GO:0021957 | corticospinal tract morphogenesis(GO:0021957) |
| 11.9 | 11.9 | GO:0014075 | response to amine(GO:0014075) |
| 11.8 | 11.8 | GO:0072520 | seminiferous tubule development(GO:0072520) |
| 11.8 | 35.4 | GO:0051595 | response to methylglyoxal(GO:0051595) |
| 11.8 | 105.9 | GO:0019227 | neuronal action potential propagation(GO:0019227) action potential propagation(GO:0098870) |
| 11.7 | 35.2 | GO:0048170 | positive regulation of long-term neuronal synaptic plasticity(GO:0048170) |
| 11.7 | 46.9 | GO:0048749 | compound eye development(GO:0048749) |
| 11.7 | 35.1 | GO:0071883 | activation of MAPK activity by adrenergic receptor signaling pathway(GO:0071883) |
| 11.7 | 46.7 | GO:1903691 | positive regulation of wound healing, spreading of epidermal cells(GO:1903691) |
| 11.7 | 35.0 | GO:1904328 | regulation of myofibroblast contraction(GO:1904328) myofibroblast contraction(GO:1990764) |
| 11.6 | 58.0 | GO:1902075 | cellular response to salt(GO:1902075) |
| 11.6 | 34.7 | GO:1902530 | regulation of protein linear polyubiquitination(GO:1902528) positive regulation of protein linear polyubiquitination(GO:1902530) |
| 11.5 | 57.7 | GO:0060024 | rhythmic synaptic transmission(GO:0060024) |
| 11.5 | 22.9 | GO:0072014 | proximal tubule development(GO:0072014) |
| 11.4 | 79.8 | GO:2000344 | positive regulation of acrosome reaction(GO:2000344) |
| 11.4 | 11.4 | GO:0060544 | regulation of necroptotic process(GO:0060544) |
| 11.2 | 44.9 | GO:0034959 | substance P catabolic process(GO:0010814) calcitonin catabolic process(GO:0010816) endothelin maturation(GO:0034959) |
| 11.2 | 44.8 | GO:0048698 | negative regulation of collateral sprouting in absence of injury(GO:0048698) |
| 11.2 | 67.0 | GO:0052551 | response to defense-related nitric oxide production by other organism involved in symbiotic interaction(GO:0052551) response to defense-related host nitric oxide production(GO:0052565) |
| 11.2 | 11.2 | GO:0060279 | regulation of ovulation(GO:0060278) positive regulation of ovulation(GO:0060279) |
| 11.1 | 33.3 | GO:0070781 | response to biotin(GO:0070781) |
| 11.1 | 77.4 | GO:0010641 | positive regulation of platelet-derived growth factor receptor signaling pathway(GO:0010641) |
| 11.1 | 33.2 | GO:0007602 | phototransduction(GO:0007602) |
| 11.0 | 43.9 | GO:0090258 | negative regulation of mitochondrial fission(GO:0090258) |
| 10.9 | 65.7 | GO:2001224 | positive regulation of neuron migration(GO:2001224) |
| 10.9 | 21.7 | GO:0061002 | negative regulation of dendritic spine morphogenesis(GO:0061002) |
| 10.8 | 21.6 | GO:0097477 | spinal cord motor neuron migration(GO:0097476) lateral motor column neuron migration(GO:0097477) |
| 10.8 | 32.4 | GO:0038060 | nitric oxide-cGMP-mediated signaling pathway(GO:0038060) |
| 10.8 | 107.8 | GO:0048172 | regulation of short-term neuronal synaptic plasticity(GO:0048172) |
| 10.8 | 21.6 | GO:0009386 | translational attenuation(GO:0009386) |
| 10.8 | 10.8 | GO:0015870 | acetylcholine transport(GO:0015870) |
| 10.8 | 96.9 | GO:0014052 | regulation of gamma-aminobutyric acid secretion(GO:0014052) |
| 10.7 | 10.7 | GO:0021942 | radial glia guided migration of Purkinje cell(GO:0021942) |
| 10.7 | 21.4 | GO:0060052 | neurofilament cytoskeleton organization(GO:0060052) |
| 10.7 | 21.4 | GO:0045647 | negative regulation of erythrocyte differentiation(GO:0045647) |
| 10.7 | 53.3 | GO:1901621 | negative regulation of smoothened signaling pathway involved in dorsal/ventral neural tube patterning(GO:1901621) |
| 10.6 | 31.8 | GO:1903984 | positive regulation of TRAIL-activated apoptotic signaling pathway(GO:1903984) |
| 10.6 | 179.7 | GO:0019371 | cyclooxygenase pathway(GO:0019371) |
| 10.5 | 137.1 | GO:0045721 | negative regulation of gluconeogenesis(GO:0045721) |
| 10.5 | 42.0 | GO:0051533 | positive regulation of NFAT protein import into nucleus(GO:0051533) |
| 10.5 | 41.8 | GO:1904978 | regulation of endosome organization(GO:1904978) |
| 10.4 | 83.4 | GO:2000664 | positive regulation of interleukin-5 secretion(GO:2000664) |
| 10.4 | 41.6 | GO:0061762 | CAMKK-AMPK signaling cascade(GO:0061762) |
| 10.4 | 41.6 | GO:0031117 | positive regulation of microtubule depolymerization(GO:0031117) |
| 10.4 | 41.6 | GO:0072143 | mesangial cell development(GO:0072143) glomerular mesangial cell development(GO:0072144) |
| 10.4 | 10.4 | GO:0060214 | endocardium formation(GO:0060214) |
| 10.4 | 51.8 | GO:0051013 | microtubule severing(GO:0051013) |
| 10.3 | 51.5 | GO:0043589 | skin morphogenesis(GO:0043589) |
| 10.3 | 20.6 | GO:0060454 | positive regulation of gastric acid secretion(GO:0060454) |
| 10.3 | 267.3 | GO:0071294 | cellular response to zinc ion(GO:0071294) |
| 10.3 | 51.4 | GO:0009137 | purine nucleoside diphosphate catabolic process(GO:0009137) purine ribonucleoside diphosphate catabolic process(GO:0009181) |
| 10.3 | 20.5 | GO:2001202 | negative regulation of transforming growth factor-beta secretion(GO:2001202) |
| 10.2 | 30.7 | GO:0050760 | negative regulation of thymidylate synthase biosynthetic process(GO:0050760) |
| 10.2 | 10.2 | GO:0051138 | positive regulation of NK T cell differentiation(GO:0051138) |
| 10.2 | 51.1 | GO:0021869 | forebrain ventricular zone progenitor cell division(GO:0021869) |
| 10.1 | 40.5 | GO:2000562 | negative regulation of CD4-positive, alpha-beta T cell proliferation(GO:2000562) |
| 10.1 | 161.4 | GO:0090361 | platelet-derived growth factor production(GO:0090360) regulation of platelet-derived growth factor production(GO:0090361) |
| 10.1 | 40.3 | GO:0005986 | sucrose biosynthetic process(GO:0005986) |
| 10.1 | 30.2 | GO:1990108 | protein linear deubiquitination(GO:1990108) |
| 10.0 | 50.1 | GO:0070829 | response to vitamin B2(GO:0033274) heterochromatin maintenance(GO:0070829) |
| 10.0 | 60.1 | GO:0042415 | norepinephrine metabolic process(GO:0042415) |
| 10.0 | 10.0 | GO:0035359 | negative regulation of peroxisome proliferator activated receptor signaling pathway(GO:0035359) |
| 9.9 | 69.6 | GO:0043117 | positive regulation of vascular permeability(GO:0043117) |
| 9.9 | 9.9 | GO:0060125 | negative regulation of growth hormone secretion(GO:0060125) |
| 9.8 | 19.7 | GO:0048168 | regulation of neuronal synaptic plasticity(GO:0048168) |
| 9.8 | 177.1 | GO:1901897 | regulation of relaxation of cardiac muscle(GO:1901897) |
| 9.8 | 49.1 | GO:0009256 | 10-formyltetrahydrofolate metabolic process(GO:0009256) |
| 9.8 | 49.0 | GO:0015961 | diadenosine polyphosphate catabolic process(GO:0015961) diphosphoinositol polyphosphate metabolic process(GO:0071543) diadenosine pentaphosphate metabolic process(GO:1901906) diadenosine pentaphosphate catabolic process(GO:1901907) diadenosine hexaphosphate metabolic process(GO:1901908) diadenosine hexaphosphate catabolic process(GO:1901909) adenosine 5'-(hexahydrogen pentaphosphate) metabolic process(GO:1901910) adenosine 5'-(hexahydrogen pentaphosphate) catabolic process(GO:1901911) |
| 9.7 | 58.3 | GO:0072364 | regulation of cellular ketone metabolic process by regulation of transcription from RNA polymerase II promoter(GO:0072364) |
| 9.7 | 29.1 | GO:0070213 | protein auto-ADP-ribosylation(GO:0070213) |
| 9.7 | 96.9 | GO:0034983 | peptidyl-lysine deacetylation(GO:0034983) |
| 9.7 | 57.9 | GO:0055059 | asymmetric neuroblast division(GO:0055059) |
| 9.7 | 48.3 | GO:0016080 | synaptic vesicle targeting(GO:0016080) |
| 9.6 | 86.8 | GO:0048266 | behavioral response to pain(GO:0048266) |
| 9.6 | 28.8 | GO:0051946 | regulation of amino acid uptake involved in synaptic transmission(GO:0051941) regulation of glutamate uptake involved in transmission of nerve impulse(GO:0051946) regulation of L-glutamate import(GO:1900920) |
| 9.6 | 28.8 | GO:0032888 | regulation of spindle elongation(GO:0032887) regulation of mitotic spindle elongation(GO:0032888) anastral spindle assembly(GO:0055048) protein localization to spindle pole body(GO:0071988) regulation of protein localization to spindle pole body(GO:1902363) positive regulation of protein localization to spindle pole body(GO:1902365) positive regulation of mitotic spindle elongation(GO:1902846) |
| 9.6 | 48.0 | GO:0071874 | response to norepinephrine(GO:0071873) cellular response to norepinephrine stimulus(GO:0071874) |
| 9.5 | 19.0 | GO:1904504 | regulation of lipophagy(GO:1904502) positive regulation of lipophagy(GO:1904504) |
| 9.5 | 19.0 | GO:1904031 | positive regulation of cyclin-dependent protein kinase activity(GO:1904031) |
| 9.5 | 247.4 | GO:0034199 | activation of protein kinase A activity(GO:0034199) |
| 9.5 | 9.5 | GO:0097017 | renal protein absorption(GO:0097017) |
| 9.4 | 253.5 | GO:0048268 | clathrin coat assembly(GO:0048268) |
| 9.4 | 37.4 | GO:0035845 | photoreceptor cell outer segment organization(GO:0035845) |
| 9.4 | 28.1 | GO:0038188 | cholecystokinin signaling pathway(GO:0038188) |
| 9.3 | 121.5 | GO:1900273 | positive regulation of long-term synaptic potentiation(GO:1900273) |
| 9.3 | 18.7 | GO:0060086 | circadian temperature homeostasis(GO:0060086) |
| 9.3 | 83.6 | GO:1902949 | positive regulation of tau-protein kinase activity(GO:1902949) |
| 9.2 | 46.2 | GO:0048680 | positive regulation of axon regeneration(GO:0048680) |
| 9.2 | 18.4 | GO:0042026 | protein refolding(GO:0042026) |
| 9.2 | 36.8 | GO:0071279 | cellular response to cobalt ion(GO:0071279) |
| 9.2 | 36.8 | GO:0042713 | sperm ejaculation(GO:0042713) |
| 9.2 | 45.9 | GO:1903273 | regulation of sodium ion export(GO:1903273) positive regulation of sodium ion export(GO:1903275) regulation of sodium ion export from cell(GO:1903276) positive regulation of sodium ion export from cell(GO:1903278) |
| 9.2 | 82.6 | GO:0072102 | glomerulus morphogenesis(GO:0072102) |
| 9.2 | 9.2 | GO:0061031 | endodermal digestive tract morphogenesis(GO:0061031) |
| 9.1 | 18.3 | GO:0002025 | vasodilation by norepinephrine-epinephrine involved in regulation of systemic arterial blood pressure(GO:0002025) |
| 9.0 | 36.2 | GO:0060385 | axonogenesis involved in innervation(GO:0060385) |
| 8.9 | 8.9 | GO:0098773 | skin epidermis development(GO:0098773) |
| 8.9 | 35.8 | GO:2001023 | regulation of response to drug(GO:2001023) |
| 8.9 | 8.9 | GO:1902263 | apoptotic process involved in embryonic digit morphogenesis(GO:1902263) |
| 8.9 | 35.6 | GO:0030807 | positive regulation of cyclic nucleotide catabolic process(GO:0030807) positive regulation of cAMP catabolic process(GO:0030822) positive regulation of purine nucleotide catabolic process(GO:0033123) |
| 8.9 | 204.3 | GO:0045332 | lipid translocation(GO:0034204) phospholipid translocation(GO:0045332) |
| 8.9 | 35.5 | GO:0051866 | general adaptation syndrome(GO:0051866) |
| 8.8 | 79.5 | GO:0071787 | endoplasmic reticulum tubular network assembly(GO:0071787) |
| 8.8 | 70.5 | GO:0090292 | nuclear matrix anchoring at nuclear membrane(GO:0090292) |
| 8.8 | 8.8 | GO:0045792 | negative regulation of cell size(GO:0045792) |
| 8.8 | 79.1 | GO:2001016 | positive regulation of skeletal muscle cell differentiation(GO:2001016) |
| 8.8 | 131.5 | GO:0015669 | gas transport(GO:0015669) |
| 8.8 | 8.8 | GO:0009649 | entrainment of circadian clock(GO:0009649) |
| 8.7 | 8.7 | GO:0021854 | hypothalamus development(GO:0021854) |
| 8.7 | 52.2 | GO:0071786 | endoplasmic reticulum tubular network organization(GO:0071786) |
| 8.7 | 95.7 | GO:0045945 | positive regulation of transcription from RNA polymerase III promoter(GO:0045945) |
| 8.7 | 69.6 | GO:0007258 | JUN phosphorylation(GO:0007258) |
| 8.7 | 34.7 | GO:0090038 | negative regulation of protein kinase C signaling(GO:0090038) |
| 8.7 | 43.4 | GO:0016322 | neuron remodeling(GO:0016322) |
| 8.7 | 52.0 | GO:0046208 | spermine catabolic process(GO:0046208) |
| 8.7 | 51.9 | GO:1900748 | positive regulation of vascular endothelial growth factor signaling pathway(GO:1900748) |
| 8.6 | 43.1 | GO:0030070 | insulin processing(GO:0030070) |
| 8.6 | 25.8 | GO:0071529 | cementum mineralization(GO:0071529) |
| 8.6 | 8.6 | GO:0002408 | myeloid dendritic cell chemotaxis(GO:0002408) |
| 8.6 | 266.7 | GO:0009214 | cyclic nucleotide catabolic process(GO:0009214) |
| 8.6 | 34.4 | GO:0045906 | negative regulation of vasoconstriction(GO:0045906) |
| 8.6 | 34.3 | GO:0060158 | phospholipase C-activating dopamine receptor signaling pathway(GO:0060158) |
| 8.6 | 25.7 | GO:1905205 | positive regulation of connective tissue replacement(GO:1905205) |
| 8.6 | 34.3 | GO:0001994 | norepinephrine-epinephrine vasoconstriction involved in regulation of systemic arterial blood pressure(GO:0001994) |
| 8.6 | 25.7 | GO:2001034 | positive regulation of double-strand break repair via nonhomologous end joining(GO:2001034) |
| 8.6 | 34.3 | GO:0022027 | interkinetic nuclear migration(GO:0022027) |
| 8.5 | 42.7 | GO:0051388 | positive regulation of neurotrophin TRK receptor signaling pathway(GO:0051388) |
| 8.5 | 59.7 | GO:1902669 | positive regulation of axon guidance(GO:1902669) |
| 8.5 | 102.0 | GO:0046325 | negative regulation of glucose import(GO:0046325) |
| 8.5 | 25.4 | GO:0021886 | hypothalamus gonadotrophin-releasing hormone neuron differentiation(GO:0021886) hypothalamus gonadotrophin-releasing hormone neuron development(GO:0021888) |
| 8.5 | 33.8 | GO:1905232 | cellular response to L-glutamate(GO:1905232) |
| 8.4 | 16.8 | GO:2000118 | regulation of sodium-dependent phosphate transport(GO:2000118) |
| 8.4 | 67.3 | GO:1901552 | positive regulation of endothelial cell development(GO:1901552) positive regulation of establishment of endothelial barrier(GO:1903142) |
| 8.4 | 16.7 | GO:0044828 | negative regulation by host of viral genome replication(GO:0044828) |
| 8.4 | 167.2 | GO:0032011 | ARF protein signal transduction(GO:0032011) |
| 8.3 | 25.0 | GO:0032849 | positive regulation of cellular pH reduction(GO:0032849) |
| 8.3 | 16.6 | GO:0038034 | signal transduction in absence of ligand(GO:0038034) extrinsic apoptotic signaling pathway in absence of ligand(GO:0097192) |
| 8.3 | 33.2 | GO:0072139 | glomerular parietal epithelial cell differentiation(GO:0072139) |
| 8.3 | 8.3 | GO:2000364 | regulation of STAT protein import into nucleus(GO:2000364) positive regulation of STAT protein import into nucleus(GO:2000366) |
| 8.2 | 115.1 | GO:2001199 | negative regulation of dendritic cell differentiation(GO:2001199) |
| 8.2 | 81.8 | GO:0042711 | maternal behavior(GO:0042711) parental behavior(GO:0060746) |
| 8.1 | 24.4 | GO:0061760 | antifungal innate immune response(GO:0061760) |
| 8.1 | 48.8 | GO:0021999 | neural plate anterior/posterior regionalization(GO:0021999) |
| 8.1 | 24.3 | GO:0010046 | response to mycotoxin(GO:0010046) |
| 8.1 | 72.9 | GO:0061302 | smooth muscle cell-matrix adhesion(GO:0061302) |
| 8.1 | 8.1 | GO:0023035 | CD40 signaling pathway(GO:0023035) |
| 8.1 | 40.3 | GO:1903237 | negative regulation of leukocyte tethering or rolling(GO:1903237) |
| 8.0 | 16.1 | GO:0021780 | spinal cord oligodendrocyte cell differentiation(GO:0021529) spinal cord oligodendrocyte cell fate specification(GO:0021530) oligodendrocyte cell fate specification(GO:0021778) oligodendrocyte cell fate commitment(GO:0021779) glial cell fate specification(GO:0021780) |
| 8.0 | 72.0 | GO:0018026 | peptidyl-lysine monomethylation(GO:0018026) |
| 8.0 | 16.0 | GO:0021555 | midbrain-hindbrain boundary morphogenesis(GO:0021555) |
| 8.0 | 8.0 | GO:2001238 | positive regulation of extrinsic apoptotic signaling pathway(GO:2001238) |
| 8.0 | 8.0 | GO:0002043 | blood vessel endothelial cell proliferation involved in sprouting angiogenesis(GO:0002043) regulation of blood vessel endothelial cell proliferation involved in sprouting angiogenesis(GO:1903587) |
| 7.9 | 7.9 | GO:1900027 | regulation of ruffle assembly(GO:1900027) |
| 7.9 | 63.6 | GO:0006686 | sphingomyelin biosynthetic process(GO:0006686) |
| 7.9 | 55.5 | GO:0071158 | positive regulation of cell cycle arrest(GO:0071158) |
| 7.9 | 63.2 | GO:0032482 | Rab protein signal transduction(GO:0032482) |
| 7.9 | 7.9 | GO:0007412 | axon target recognition(GO:0007412) |
| 7.9 | 55.1 | GO:0032510 | endosome to lysosome transport via multivesicular body sorting pathway(GO:0032510) |
| 7.9 | 15.7 | GO:0045925 | positive regulation of female receptivity(GO:0045925) |
| 7.9 | 70.8 | GO:0015871 | choline transport(GO:0015871) |
| 7.9 | 7.9 | GO:0007089 | traversing start control point of mitotic cell cycle(GO:0007089) |
| 7.8 | 7.8 | GO:0090210 | regulation of establishment of blood-brain barrier(GO:0090210) negative regulation of establishment of blood-brain barrier(GO:0090212) |
| 7.8 | 7.8 | GO:0007521 | muscle cell fate determination(GO:0007521) |
| 7.8 | 23.3 | GO:1905073 | occluding junction disassembly(GO:1905071) regulation of occluding junction disassembly(GO:1905073) positive regulation of occluding junction disassembly(GO:1905075) |
| 7.7 | 30.9 | GO:0046958 | nonassociative learning(GO:0046958) |
| 7.7 | 331.8 | GO:0007214 | gamma-aminobutyric acid signaling pathway(GO:0007214) |
| 7.7 | 30.9 | GO:0071494 | cellular response to UV-C(GO:0071494) |
| 7.7 | 30.8 | GO:0097676 | histone H3-K36 dimethylation(GO:0097676) |
| 7.7 | 7.7 | GO:0030718 | germ-line stem cell population maintenance(GO:0030718) |
| 7.7 | 53.6 | GO:0098912 | membrane depolarization during atrial cardiac muscle cell action potential(GO:0098912) |
| 7.6 | 22.8 | GO:0046351 | lactose metabolic process(GO:0005988) lactose biosynthetic process(GO:0005989) disaccharide biosynthetic process(GO:0046351) |
| 7.6 | 30.3 | GO:0044821 | meiotic telomere tethering at nuclear periphery(GO:0044821) meiotic attachment of telomere to nuclear envelope(GO:0070197) chromosome attachment to the nuclear envelope(GO:0097240) |
| 7.6 | 7.6 | GO:0055096 | lipoprotein particle mediated signaling(GO:0055095) low-density lipoprotein particle mediated signaling(GO:0055096) |
| 7.6 | 7.6 | GO:0090035 | regulation of chaperone-mediated protein complex assembly(GO:0090034) positive regulation of chaperone-mediated protein complex assembly(GO:0090035) |
| 7.6 | 22.7 | GO:0009183 | purine deoxyribonucleoside diphosphate metabolic process(GO:0009182) purine deoxyribonucleoside diphosphate biosynthetic process(GO:0009183) |
| 7.5 | 45.2 | GO:0086046 | membrane depolarization during SA node cell action potential(GO:0086046) |
| 7.5 | 75.3 | GO:0036066 | protein O-linked fucosylation(GO:0036066) |
| 7.5 | 180.1 | GO:0046337 | phosphatidylethanolamine metabolic process(GO:0046337) |
| 7.5 | 217.4 | GO:0008045 | motor neuron axon guidance(GO:0008045) |
| 7.5 | 82.4 | GO:0001886 | endothelial cell morphogenesis(GO:0001886) |
| 7.5 | 15.0 | GO:0060684 | epithelial-mesenchymal cell signaling(GO:0060684) |
| 7.5 | 7.5 | GO:0032707 | negative regulation of interleukin-23 production(GO:0032707) |
| 7.5 | 37.3 | GO:0060770 | negative regulation of epithelial cell proliferation involved in prostate gland development(GO:0060770) |
| 7.5 | 7.5 | GO:0001743 | optic placode formation(GO:0001743) |
| 7.5 | 74.5 | GO:2000427 | positive regulation of apoptotic cell clearance(GO:2000427) |
| 7.5 | 37.3 | GO:0001957 | intramembranous ossification(GO:0001957) direct ossification(GO:0036072) |
| 7.4 | 14.9 | GO:0090187 | positive regulation of pancreatic juice secretion(GO:0090187) |
| 7.4 | 29.8 | GO:0031443 | fast-twitch skeletal muscle fiber contraction(GO:0031443) |
| 7.4 | 7.4 | GO:1904379 | protein localization to cytosolic proteasome complex(GO:1904327) protein localization to cytosolic proteasome complex involved in ERAD pathway(GO:1904379) |
| 7.4 | 96.0 | GO:0010603 | regulation of cytoplasmic mRNA processing body assembly(GO:0010603) |
| 7.4 | 44.3 | GO:0051005 | negative regulation of lipoprotein lipase activity(GO:0051005) |
| 7.3 | 22.0 | GO:0045212 | negative regulation of synaptic transmission, cholinergic(GO:0032223) neurotransmitter receptor biosynthetic process(GO:0045212) |
| 7.3 | 43.9 | GO:0060137 | maternal process involved in parturition(GO:0060137) |
| 7.3 | 43.9 | GO:0032957 | inositol trisphosphate metabolic process(GO:0032957) |
| 7.3 | 29.2 | GO:0061734 | parkin-mediated mitophagy in response to mitochondrial depolarization(GO:0061734) |
| 7.3 | 21.9 | GO:0061364 | apoptotic process involved in luteolysis(GO:0061364) |
| 7.3 | 131.2 | GO:0034389 | lipid particle organization(GO:0034389) |
| 7.3 | 65.4 | GO:0048671 | negative regulation of collateral sprouting(GO:0048671) |
| 7.3 | 7.3 | GO:0038003 | opioid receptor signaling pathway(GO:0038003) |
| 7.3 | 14.5 | GO:0042360 | vitamin E metabolic process(GO:0042360) |
| 7.2 | 21.7 | GO:0007198 | adenylate cyclase-inhibiting serotonin receptor signaling pathway(GO:0007198) |
| 7.2 | 7.2 | GO:0042560 | folic acid-containing compound catabolic process(GO:0009397) pteridine-containing compound catabolic process(GO:0042560) |
| 7.2 | 21.6 | GO:1900112 | regulation of histone H3-K9 trimethylation(GO:1900112) |
| 7.2 | 43.1 | GO:0017196 | N-terminal peptidyl-methionine acetylation(GO:0017196) |
| 7.2 | 14.4 | GO:0001842 | neural fold formation(GO:0001842) |
| 7.2 | 14.4 | GO:0021781 | glial cell fate commitment(GO:0021781) |
| 7.2 | 35.9 | GO:1902902 | negative regulation of autophagosome assembly(GO:1902902) |
| 7.2 | 114.6 | GO:0006995 | cellular response to nitrogen starvation(GO:0006995) cellular response to nitrogen levels(GO:0043562) |
| 7.2 | 43.0 | GO:0002175 | protein localization to paranode region of axon(GO:0002175) |
| 7.2 | 21.5 | GO:1903347 | negative regulation of bicellular tight junction assembly(GO:1903347) |
| 7.2 | 50.1 | GO:0070777 | D-aspartate transport(GO:0070777) D-aspartate import(GO:0070779) |
| 7.1 | 21.3 | GO:0061744 | motor behavior(GO:0061744) |
| 7.1 | 14.2 | GO:0061053 | somite development(GO:0061053) |
| 7.1 | 7.1 | GO:0035725 | sodium ion transmembrane transport(GO:0035725) |
| 7.1 | 21.2 | GO:0048243 | norepinephrine secretion(GO:0048243) |
| 7.0 | 56.3 | GO:0038007 | netrin-activated signaling pathway(GO:0038007) |
| 7.0 | 7.0 | GO:0003417 | growth plate cartilage development(GO:0003417) |
| 7.0 | 35.2 | GO:0032383 | regulation of intracellular lipid transport(GO:0032377) regulation of intracellular sterol transport(GO:0032380) regulation of intracellular cholesterol transport(GO:0032383) |
| 7.0 | 14.0 | GO:1903509 | glycolipid metabolic process(GO:0006664) liposaccharide metabolic process(GO:1903509) |
| 7.0 | 188.8 | GO:0032460 | negative regulation of protein oligomerization(GO:0032460) |
| 7.0 | 118.6 | GO:0035988 | chondrocyte proliferation(GO:0035988) |
| 7.0 | 48.8 | GO:0010735 | positive regulation of transcription via serum response element binding(GO:0010735) |
| 7.0 | 62.6 | GO:0007413 | axonal fasciculation(GO:0007413) |
| 7.0 | 83.4 | GO:0070050 | neuron cellular homeostasis(GO:0070050) |
| 6.9 | 27.8 | GO:0035633 | maintenance of blood-brain barrier(GO:0035633) |
| 6.9 | 27.8 | GO:1900154 | regulation of bone trabecula formation(GO:1900154) negative regulation of bone trabecula formation(GO:1900155) |
| 6.9 | 6.9 | GO:0097084 | vascular smooth muscle cell development(GO:0097084) |
| 6.9 | 20.7 | GO:0051066 | dihydrobiopterin metabolic process(GO:0051066) |
| 6.9 | 34.5 | GO:0070444 | oligodendrocyte progenitor proliferation(GO:0070444) regulation of oligodendrocyte progenitor proliferation(GO:0070445) |
| 6.9 | 20.6 | GO:0006566 | threonine metabolic process(GO:0006566) |
| 6.8 | 6.8 | GO:1903527 | regulation of membrane tubulation(GO:1903525) positive regulation of membrane tubulation(GO:1903527) |
| 6.8 | 20.5 | GO:0071409 | cellular response to cycloheximide(GO:0071409) |
| 6.8 | 54.6 | GO:0097647 | calcitonin family receptor signaling pathway(GO:0097646) amylin receptor signaling pathway(GO:0097647) |
| 6.8 | 68.2 | GO:0048711 | positive regulation of astrocyte differentiation(GO:0048711) |
| 6.8 | 13.6 | GO:0016557 | peroxisome membrane biogenesis(GO:0016557) |
| 6.8 | 47.5 | GO:0016127 | cholesterol catabolic process(GO:0006707) sterol catabolic process(GO:0016127) |
| 6.8 | 20.3 | GO:0014859 | negative regulation of skeletal muscle cell proliferation(GO:0014859) negative regulation of skeletal muscle satellite cell proliferation(GO:1902723) |
| 6.7 | 40.4 | GO:0006526 | arginine biosynthetic process(GO:0006526) |
| 6.7 | 20.2 | GO:0090649 | response to oxygen-glucose deprivation(GO:0090649) cellular response to oxygen-glucose deprivation(GO:0090650) |
| 6.7 | 13.4 | GO:0051446 | positive regulation of meiotic cell cycle(GO:0051446) |
| 6.7 | 33.6 | GO:0021853 | cerebral cortex GABAergic interneuron migration(GO:0021853) interneuron migration(GO:1904936) |
| 6.7 | 13.4 | GO:0002031 | G-protein coupled receptor internalization(GO:0002031) |
| 6.7 | 33.5 | GO:0021578 | hindbrain maturation(GO:0021578) central nervous system maturation(GO:0021626) |
| 6.7 | 39.9 | GO:0060453 | regulation of gastric acid secretion(GO:0060453) |
| 6.6 | 252.4 | GO:0048791 | calcium ion-regulated exocytosis of neurotransmitter(GO:0048791) |
| 6.6 | 106.2 | GO:0099514 | anterograde synaptic vesicle transport(GO:0048490) synaptic vesicle cytoskeletal transport(GO:0099514) synaptic vesicle transport along microtubule(GO:0099517) |
| 6.6 | 33.2 | GO:0070384 | Harderian gland development(GO:0070384) |
| 6.6 | 26.5 | GO:2000480 | negative regulation of cAMP-dependent protein kinase activity(GO:2000480) |
| 6.6 | 19.9 | GO:0046642 | negative regulation of alpha-beta T cell proliferation(GO:0046642) |
| 6.6 | 6.6 | GO:0014002 | astrocyte development(GO:0014002) |
| 6.6 | 26.2 | GO:0070426 | positive regulation of nucleotide-binding oligomerization domain containing signaling pathway(GO:0070426) positive regulation of nucleotide-binding oligomerization domain containing 2 signaling pathway(GO:0070434) |
| 6.5 | 45.8 | GO:0070164 | negative regulation of adiponectin secretion(GO:0070164) |
| 6.5 | 19.6 | GO:0043116 | negative regulation of vascular permeability(GO:0043116) |
| 6.5 | 32.5 | GO:0006127 | glycerophosphate shuttle(GO:0006127) |
| 6.5 | 13.0 | GO:0060501 | positive regulation of epithelial cell proliferation involved in lung morphogenesis(GO:0060501) |
| 6.5 | 32.5 | GO:0048807 | female genitalia morphogenesis(GO:0048807) |
| 6.5 | 45.4 | GO:0035093 | spermatogenesis, exchange of chromosomal proteins(GO:0035093) |
| 6.5 | 13.0 | GO:1901160 | primary amino compound metabolic process(GO:1901160) |
| 6.5 | 6.5 | GO:2000824 | negative regulation of androgen receptor activity(GO:2000824) |
| 6.5 | 12.9 | GO:0035054 | embryonic heart tube anterior/posterior pattern specification(GO:0035054) |
| 6.5 | 19.4 | GO:0035582 | sequestering of BMP in extracellular matrix(GO:0035582) |
| 6.4 | 38.6 | GO:0042985 | negative regulation of amyloid precursor protein biosynthetic process(GO:0042985) |
| 6.4 | 32.1 | GO:1904100 | regulation of protein O-linked glycosylation(GO:1904098) positive regulation of protein O-linked glycosylation(GO:1904100) |
| 6.4 | 19.2 | GO:0007200 | phospholipase C-activating G-protein coupled receptor signaling pathway(GO:0007200) |
| 6.4 | 51.3 | GO:2000601 | positive regulation of Arp2/3 complex-mediated actin nucleation(GO:2000601) |
| 6.4 | 19.1 | GO:0097112 | gamma-aminobutyric acid receptor clustering(GO:0097112) |
| 6.3 | 95.2 | GO:0034497 | protein localization to pre-autophagosomal structure(GO:0034497) |
| 6.3 | 88.7 | GO:1903830 | magnesium ion transmembrane transport(GO:1903830) |
| 6.3 | 12.7 | GO:0010882 | regulation of cardiac muscle contraction by calcium ion signaling(GO:0010882) |
| 6.3 | 44.0 | GO:2000311 | regulation of alpha-amino-3-hydroxy-5-methyl-4-isoxazole propionate selective glutamate receptor activity(GO:2000311) |
| 6.2 | 31.2 | GO:0003322 | pancreatic A cell development(GO:0003322) |
| 6.2 | 12.5 | GO:1990164 | histone H2A phosphorylation(GO:1990164) |
| 6.2 | 6.2 | GO:0010266 | response to vitamin B1(GO:0010266) |
| 6.2 | 31.1 | GO:0060800 | regulation of cell differentiation involved in embryonic placenta development(GO:0060800) |
| 6.2 | 24.8 | GO:0034334 | adherens junction maintenance(GO:0034334) |
| 6.2 | 43.4 | GO:1903689 | regulation of wound healing, spreading of epidermal cells(GO:1903689) negative regulation of wound healing, spreading of epidermal cells(GO:1903690) |
| 6.2 | 12.4 | GO:0042940 | D-amino acid transport(GO:0042940) |
| 6.2 | 18.6 | GO:0055072 | iron ion homeostasis(GO:0055072) |
| 6.2 | 18.5 | GO:0032364 | oxygen homeostasis(GO:0032364) |
| 6.2 | 6.2 | GO:1902369 | negative regulation of RNA catabolic process(GO:1902369) negative regulation of mRNA catabolic process(GO:1902373) regulation of nuclear-transcribed mRNA catabolic process, nonsense-mediated decay(GO:2000622) negative regulation of nuclear-transcribed mRNA catabolic process, nonsense-mediated decay(GO:2000623) |
| 6.2 | 12.3 | GO:0043124 | negative regulation of I-kappaB kinase/NF-kappaB signaling(GO:0043124) |
| 6.2 | 73.9 | GO:0030202 | heparin metabolic process(GO:0030202) heparin biosynthetic process(GO:0030210) |
| 6.1 | 42.9 | GO:0045602 | negative regulation of endothelial cell differentiation(GO:0045602) |
| 6.1 | 12.3 | GO:0003219 | cardiac right ventricle formation(GO:0003219) |
| 6.1 | 18.3 | GO:0023021 | termination of signal transduction(GO:0023021) |
| 6.1 | 18.2 | GO:0060081 | membrane hyperpolarization(GO:0060081) |
| 6.1 | 97.3 | GO:1902083 | negative regulation of peptidyl-cysteine S-nitrosylation(GO:1902083) |
| 6.1 | 91.1 | GO:0007196 | adenylate cyclase-inhibiting G-protein coupled glutamate receptor signaling pathway(GO:0007196) |
| 6.0 | 30.1 | GO:0000189 | MAPK import into nucleus(GO:0000189) |
| 6.0 | 144.4 | GO:0045494 | photoreceptor cell maintenance(GO:0045494) |
| 6.0 | 6.0 | GO:0008628 | hormone-mediated apoptotic signaling pathway(GO:0008628) |
| 6.0 | 72.2 | GO:0021794 | thalamus development(GO:0021794) |
| 6.0 | 6.0 | GO:1990086 | lens fiber cell apoptotic process(GO:1990086) |
| 6.0 | 12.0 | GO:0060013 | righting reflex(GO:0060013) |
| 6.0 | 6.0 | GO:0015808 | L-alanine transport(GO:0015808) |
| 6.0 | 42.0 | GO:1904354 | negative regulation of telomere capping(GO:1904354) |
| 6.0 | 54.0 | GO:0042373 | vitamin K metabolic process(GO:0042373) |
| 6.0 | 18.0 | GO:0098935 | dendritic transport(GO:0098935) anterograde dendritic transport(GO:0098937) |
| 6.0 | 29.9 | GO:1901731 | positive regulation of platelet aggregation(GO:1901731) |
| 6.0 | 59.8 | GO:0006983 | ER overload response(GO:0006983) |
| 6.0 | 17.9 | GO:1902895 | positive regulation of pri-miRNA transcription from RNA polymerase II promoter(GO:1902895) |
| 6.0 | 190.9 | GO:0014003 | oligodendrocyte development(GO:0014003) |
| 6.0 | 166.8 | GO:0050651 | dermatan sulfate proteoglycan biosynthetic process(GO:0050651) |
| 6.0 | 11.9 | GO:0007231 | osmosensory signaling pathway(GO:0007231) |
| 5.9 | 29.7 | GO:1900107 | regulation of nodal signaling pathway(GO:1900107) |
| 5.9 | 11.7 | GO:2001271 | negative regulation of cysteine-type endopeptidase activity involved in execution phase of apoptosis(GO:2001271) |
| 5.8 | 5.8 | GO:0003338 | metanephros morphogenesis(GO:0003338) |
| 5.8 | 11.6 | GO:0002513 | tolerance induction to self antigen(GO:0002513) |
| 5.8 | 23.2 | GO:0061304 | retinal blood vessel morphogenesis(GO:0061304) |
| 5.8 | 23.2 | GO:0035021 | negative regulation of Rac protein signal transduction(GO:0035021) |
| 5.8 | 17.3 | GO:2000857 | positive regulation of mineralocorticoid secretion(GO:2000857) positive regulation of aldosterone secretion(GO:2000860) |
| 5.8 | 11.5 | GO:0060033 | anatomical structure regression(GO:0060033) |
| 5.8 | 5.8 | GO:1904933 | regulation of cell proliferation in midbrain(GO:1904933) |
| 5.7 | 11.5 | GO:0061245 | establishment or maintenance of apical/basal cell polarity(GO:0035088) establishment or maintenance of epithelial cell apical/basal polarity(GO:0045197) establishment or maintenance of bipolar cell polarity(GO:0061245) |
| 5.7 | 34.5 | GO:0098535 | de novo centriole assembly(GO:0098535) |
| 5.7 | 17.2 | GO:0045957 | regulation of complement activation, alternative pathway(GO:0030451) negative regulation of complement activation, alternative pathway(GO:0045957) |
| 5.7 | 34.4 | GO:0071105 | response to interleukin-11(GO:0071105) |
| 5.7 | 51.5 | GO:0007042 | lysosomal lumen acidification(GO:0007042) |
| 5.7 | 5.7 | GO:0061732 | mitochondrial acetyl-CoA biosynthetic process from pyruvate(GO:0061732) |
| 5.7 | 28.4 | GO:0051901 | positive regulation of mitochondrial depolarization(GO:0051901) |
| 5.7 | 85.1 | GO:2000505 | regulation of energy homeostasis(GO:2000505) |
| 5.7 | 11.3 | GO:0035408 | histone H3-T6 phosphorylation(GO:0035408) |
| 5.7 | 147.4 | GO:0097503 | sialylation(GO:0097503) |
| 5.7 | 17.0 | GO:0032119 | sequestering of zinc ion(GO:0032119) regulation of sequestering of zinc ion(GO:0061088) |
| 5.7 | 17.0 | GO:0038193 | thromboxane A2 signaling pathway(GO:0038193) |
| 5.7 | 5.7 | GO:0031860 | telomeric 3' overhang formation(GO:0031860) |
| 5.6 | 22.6 | GO:0003352 | regulation of cilium movement(GO:0003352) regulation of cilium beat frequency(GO:0003356) |
| 5.6 | 33.8 | GO:0008090 | retrograde axonal transport(GO:0008090) |
| 5.6 | 39.4 | GO:0070544 | histone H3-K36 demethylation(GO:0070544) |
| 5.6 | 22.5 | GO:0061209 | cell proliferation involved in mesonephros development(GO:0061209) mesenchymal cell proliferation involved in ureteric bud development(GO:0072138) mesonephric duct morphogenesis(GO:0072180) |
| 5.6 | 33.7 | GO:0032025 | response to cobalt ion(GO:0032025) |
| 5.6 | 22.4 | GO:0002904 | positive regulation of B cell apoptotic process(GO:0002904) |
| 5.6 | 100.8 | GO:0010510 | regulation of acetyl-CoA biosynthetic process from pyruvate(GO:0010510) |
| 5.6 | 5.6 | GO:0071168 | protein localization to chromatin(GO:0071168) |
| 5.6 | 5.6 | GO:1903799 | negative regulation of production of miRNAs involved in gene silencing by miRNA(GO:1903799) |
| 5.5 | 22.2 | GO:0018094 | protein polyglycylation(GO:0018094) |
| 5.5 | 5.5 | GO:0007440 | foregut morphogenesis(GO:0007440) embryonic foregut morphogenesis(GO:0048617) |
| 5.5 | 5.5 | GO:0035801 | adrenal cortex development(GO:0035801) adrenal cortex formation(GO:0035802) |
| 5.5 | 11.0 | GO:0071711 | basement membrane organization(GO:0071711) |
| 5.5 | 11.0 | GO:0090306 | spindle assembly involved in meiosis(GO:0090306) |
| 5.5 | 44.0 | GO:0086070 | SA node cell to atrial cardiac muscle cell communication(GO:0086070) |
| 5.5 | 5.5 | GO:0045347 | negative regulation of MHC class II biosynthetic process(GO:0045347) |
| 5.5 | 5.5 | GO:1902310 | positive regulation of peptidyl-serine dephosphorylation(GO:1902310) |
| 5.5 | 16.4 | GO:0007181 | transforming growth factor beta receptor complex assembly(GO:0007181) |
| 5.4 | 38.0 | GO:0009597 | detection of virus(GO:0009597) |
| 5.4 | 16.2 | GO:0014050 | negative regulation of glutamate secretion(GO:0014050) |
| 5.4 | 10.8 | GO:0016103 | diterpenoid catabolic process(GO:0016103) retinoic acid catabolic process(GO:0034653) |
| 5.4 | 53.9 | GO:0050650 | chondroitin sulfate proteoglycan biosynthetic process(GO:0050650) |
| 5.4 | 37.7 | GO:0021740 | trigeminal sensory nucleus development(GO:0021730) principal sensory nucleus of trigeminal nerve development(GO:0021740) negative regulation of epithelial cell proliferation involved in lung morphogenesis(GO:2000795) |
| 5.4 | 102.1 | GO:0043046 | DNA methylation involved in gamete generation(GO:0043046) |
| 5.4 | 21.4 | GO:0000350 | generation of catalytic spliceosome for second transesterification step(GO:0000350) |
| 5.3 | 26.7 | GO:2000676 | positive regulation of type B pancreatic cell apoptotic process(GO:2000676) |
| 5.3 | 5.3 | GO:0051885 | positive regulation of anagen(GO:0051885) |
| 5.3 | 10.7 | GO:2000463 | positive regulation of excitatory postsynaptic potential(GO:2000463) |
| 5.3 | 10.7 | GO:0070257 | positive regulation of mucus secretion(GO:0070257) |
| 5.3 | 5.3 | GO:1900048 | positive regulation of blood coagulation(GO:0030194) positive regulation of hemostasis(GO:1900048) |
| 5.3 | 16.0 | GO:0034227 | tRNA thio-modification(GO:0034227) |
| 5.3 | 10.6 | GO:0021891 | olfactory bulb interneuron development(GO:0021891) |
| 5.3 | 10.6 | GO:1900673 | olefin metabolic process(GO:1900673) |
| 5.3 | 5.3 | GO:0090244 | Wnt signaling pathway involved in somitogenesis(GO:0090244) |
| 5.3 | 37.2 | GO:1901387 | positive regulation of voltage-gated calcium channel activity(GO:1901387) |
| 5.3 | 31.7 | GO:2000324 | positive regulation of glucocorticoid receptor signaling pathway(GO:2000324) |
| 5.3 | 15.8 | GO:0051414 | response to cortisol(GO:0051414) |
| 5.3 | 15.8 | GO:0001172 | transcription, RNA-templated(GO:0001172) |
| 5.3 | 15.8 | GO:0045085 | negative regulation of interleukin-2 biosynthetic process(GO:0045085) |
| 5.3 | 5.3 | GO:1901029 | negative regulation of mitochondrial outer membrane permeabilization involved in apoptotic signaling pathway(GO:1901029) |
| 5.2 | 5.2 | GO:0030890 | positive regulation of B cell proliferation(GO:0030890) |
| 5.2 | 10.5 | GO:0090427 | activation of meiosis(GO:0090427) |
| 5.2 | 89.1 | GO:0030539 | male genitalia development(GO:0030539) |
| 5.2 | 31.4 | GO:0060414 | aorta smooth muscle tissue morphogenesis(GO:0060414) |
| 5.2 | 78.3 | GO:0060907 | positive regulation of macrophage cytokine production(GO:0060907) |
| 5.2 | 15.7 | GO:0007497 | posterior midgut development(GO:0007497) |
| 5.2 | 10.4 | GO:0006072 | glycerol-3-phosphate metabolic process(GO:0006072) |
| 5.2 | 15.7 | GO:0043507 | positive regulation of JUN kinase activity(GO:0043507) |
| 5.2 | 15.6 | GO:0099566 | regulation of postsynaptic cytosolic calcium ion concentration(GO:0099566) |
| 5.2 | 20.8 | GO:0051386 | regulation of neurotrophin TRK receptor signaling pathway(GO:0051386) |
| 5.2 | 20.8 | GO:0010566 | regulation of ketone biosynthetic process(GO:0010566) |
| 5.2 | 10.4 | GO:0003215 | cardiac right ventricle morphogenesis(GO:0003215) |
| 5.2 | 10.4 | GO:0051944 | positive regulation of neurotransmitter uptake(GO:0051582) positive regulation of dopamine uptake involved in synaptic transmission(GO:0051586) positive regulation of catecholamine uptake involved in synaptic transmission(GO:0051944) |
| 5.2 | 56.9 | GO:0060670 | branching involved in labyrinthine layer morphogenesis(GO:0060670) |
| 5.1 | 36.0 | GO:0070278 | extracellular matrix constituent secretion(GO:0070278) |
| 5.1 | 41.1 | GO:0060267 | positive regulation of respiratory burst(GO:0060267) |
| 5.1 | 15.4 | GO:0032713 | negative regulation of interleukin-4 production(GO:0032713) |
| 5.1 | 25.6 | GO:0060346 | bone trabecula formation(GO:0060346) |
| 5.1 | 5.1 | GO:0003257 | positive regulation of transcription from RNA polymerase II promoter involved in myocardial precursor cell differentiation(GO:0003257) positive regulation of transcription from RNA polymerase II promoter involved in heart development(GO:1901228) |
| 5.1 | 10.2 | GO:0051969 | regulation of transmission of nerve impulse(GO:0051969) |
| 5.1 | 35.8 | GO:0002414 | immunoglobulin transcytosis in epithelial cells(GO:0002414) |
| 5.1 | 61.3 | GO:0021681 | cerebellar granular layer development(GO:0021681) |
| 5.1 | 25.5 | GO:0021819 | layer formation in cerebral cortex(GO:0021819) |
| 5.1 | 5.1 | GO:0098989 | NMDA selective glutamate receptor signaling pathway(GO:0098989) |
| 5.1 | 71.3 | GO:0001946 | lymphangiogenesis(GO:0001946) |
| 5.1 | 5.1 | GO:2000617 | positive regulation of histone H3-K9 acetylation(GO:2000617) |
| 5.1 | 5.1 | GO:0033326 | cerebrospinal fluid secretion(GO:0033326) |
| 5.1 | 10.1 | GO:0006452 | translational frameshifting(GO:0006452) positive regulation of translational termination(GO:0045905) |
| 5.1 | 20.3 | GO:0042335 | cuticle development(GO:0042335) |
| 5.0 | 10.1 | GO:0050777 | negative regulation of immune response(GO:0050777) |
| 5.0 | 20.2 | GO:0010829 | negative regulation of glucose transport(GO:0010829) |
| 5.0 | 25.1 | GO:1900736 | regulation of phospholipase C-activating G-protein coupled receptor signaling pathway(GO:1900736) |
| 5.0 | 5.0 | GO:0070471 | uterine smooth muscle contraction(GO:0070471) regulation of uterine smooth muscle contraction(GO:0070472) positive regulation of uterine smooth muscle contraction(GO:0070474) |
| 5.0 | 75.1 | GO:0021954 | central nervous system neuron development(GO:0021954) |
| 5.0 | 5.0 | GO:0006931 | substrate-dependent cell migration, cell attachment to substrate(GO:0006931) |
| 5.0 | 5.0 | GO:2000078 | glandular epithelial cell maturation(GO:0002071) type B pancreatic cell maturation(GO:0072560) positive regulation of type B pancreatic cell development(GO:2000078) |
| 5.0 | 5.0 | GO:2000584 | regulation of platelet-derived growth factor receptor-alpha signaling pathway(GO:2000583) negative regulation of platelet-derived growth factor receptor-alpha signaling pathway(GO:2000584) |
| 5.0 | 29.7 | GO:0006287 | base-excision repair, gap-filling(GO:0006287) |
| 5.0 | 74.3 | GO:0010457 | centriole-centriole cohesion(GO:0010457) |
| 4.9 | 14.8 | GO:0072244 | metanephric glomerular epithelium development(GO:0072244) metanephric glomerular visceral epithelial cell differentiation(GO:0072248) metanephric glomerular visceral epithelial cell development(GO:0072249) metanephric glomerular epithelial cell differentiation(GO:0072312) metanephric glomerular epithelial cell development(GO:0072313) |
| 4.9 | 137.9 | GO:0043984 | histone H4-K16 acetylation(GO:0043984) |
| 4.9 | 39.3 | GO:0046512 | diol biosynthetic process(GO:0034312) sphingosine biosynthetic process(GO:0046512) sphingoid biosynthetic process(GO:0046520) |
| 4.9 | 4.9 | GO:0035963 | cellular response to interleukin-13(GO:0035963) |
| 4.9 | 4.9 | GO:0061743 | motor learning(GO:0061743) |
| 4.9 | 9.7 | GO:0010959 | regulation of metal ion transport(GO:0010959) |
| 4.8 | 43.6 | GO:1901978 | positive regulation of cell cycle checkpoint(GO:1901978) |
| 4.8 | 4.8 | GO:0046827 | positive regulation of protein export from nucleus(GO:0046827) |
| 4.8 | 29.0 | GO:0071376 | response to corticotropin-releasing hormone(GO:0043435) cellular response to corticotropin-releasing hormone stimulus(GO:0071376) |
| 4.8 | 14.5 | GO:0051970 | negative regulation of transmission of nerve impulse(GO:0051970) |
| 4.8 | 14.5 | GO:0035610 | protein side chain deglutamylation(GO:0035610) |
| 4.8 | 24.0 | GO:0035617 | stress granule disassembly(GO:0035617) |
| 4.8 | 33.5 | GO:0098655 | cation transmembrane transport(GO:0098655) |
| 4.8 | 76.6 | GO:0060044 | negative regulation of cardiac muscle cell proliferation(GO:0060044) |
| 4.8 | 19.1 | GO:1904491 | protein localization to ciliary transition zone(GO:1904491) |
| 4.8 | 4.8 | GO:0018076 | N-terminal peptidyl-lysine acetylation(GO:0018076) |
| 4.7 | 9.5 | GO:0009134 | nucleoside diphosphate catabolic process(GO:0009134) |
| 4.7 | 37.8 | GO:0034380 | high-density lipoprotein particle assembly(GO:0034380) |
| 4.7 | 14.2 | GO:0032290 | peripheral nervous system myelin formation(GO:0032290) |
| 4.7 | 4.7 | GO:0045839 | negative regulation of mitotic nuclear division(GO:0045839) negative regulation of nuclear division(GO:0051784) |
| 4.7 | 4.7 | GO:0038165 | oncostatin-M-mediated signaling pathway(GO:0038165) |
| 4.7 | 23.3 | GO:0035694 | mitochondrial protein catabolic process(GO:0035694) |
| 4.6 | 18.6 | GO:0060294 | cilium movement involved in cell motility(GO:0060294) |
| 4.6 | 9.3 | GO:0033138 | positive regulation of peptidyl-serine phosphorylation(GO:0033138) |
| 4.6 | 23.2 | GO:1904262 | negative regulation of TORC1 signaling(GO:1904262) |
| 4.6 | 41.7 | GO:1903025 | regulation of RNA polymerase II regulatory region sequence-specific DNA binding(GO:1903025) |
| 4.6 | 129.6 | GO:0090218 | positive regulation of lipid kinase activity(GO:0090218) |
| 4.6 | 23.1 | GO:0099551 | synaptic signaling via neuropeptide(GO:0099538) trans-synaptic signaling by neuropeptide(GO:0099540) trans-synaptic signaling by neuropeptide, modulating synaptic transmission(GO:0099551) |
| 4.6 | 4.6 | GO:0035625 | epidermal growth factor-activated receptor transactivation by G-protein coupled receptor signaling pathway(GO:0035625) |
| 4.6 | 9.2 | GO:0031959 | mineralocorticoid receptor signaling pathway(GO:0031959) |
| 4.6 | 4.6 | GO:0038180 | nerve growth factor signaling pathway(GO:0038180) |
| 4.6 | 224.1 | GO:0015701 | bicarbonate transport(GO:0015701) |
| 4.5 | 45.5 | GO:0060022 | hard palate development(GO:0060022) |
| 4.5 | 4.5 | GO:0030860 | regulation of polarized epithelial cell differentiation(GO:0030860) |
| 4.5 | 68.2 | GO:0019336 | phenol-containing compound catabolic process(GO:0019336) |
| 4.5 | 68.1 | GO:0060732 | positive regulation of inositol phosphate biosynthetic process(GO:0060732) |
| 4.5 | 9.1 | GO:0021592 | fourth ventricle development(GO:0021592) third ventricle development(GO:0021678) |
| 4.5 | 13.6 | GO:1990168 | protein K33-linked deubiquitination(GO:1990168) |
| 4.5 | 4.5 | GO:0036092 | phosphatidylinositol-3-phosphate biosynthetic process(GO:0036092) |
| 4.5 | 9.0 | GO:0038145 | macrophage colony-stimulating factor signaling pathway(GO:0038145) |
| 4.5 | 72.3 | GO:0035235 | ionotropic glutamate receptor signaling pathway(GO:0035235) |
| 4.5 | 58.6 | GO:0060394 | negative regulation of pathway-restricted SMAD protein phosphorylation(GO:0060394) |
| 4.5 | 9.0 | GO:2000535 | regulation of entry of bacterium into host cell(GO:2000535) |
| 4.5 | 13.5 | GO:0060666 | dichotomous subdivision of terminal units involved in salivary gland branching(GO:0060666) |
| 4.5 | 22.4 | GO:0030517 | negative regulation of axon extension(GO:0030517) |
| 4.5 | 40.2 | GO:0051410 | detoxification of nitrogen compound(GO:0051410) |
| 4.5 | 44.6 | GO:0060068 | vagina development(GO:0060068) |
| 4.5 | 151.6 | GO:0050885 | neuromuscular process controlling balance(GO:0050885) |
| 4.5 | 8.9 | GO:0051918 | negative regulation of fibrinolysis(GO:0051918) |
| 4.5 | 182.5 | GO:0033173 | calcineurin-NFAT signaling cascade(GO:0033173) |
| 4.4 | 17.8 | GO:0010650 | positive regulation of cell communication by electrical coupling(GO:0010650) maintenance of protein location in membrane(GO:0072658) maintenance of protein location in plasma membrane(GO:0072660) positive regulation of membrane depolarization during cardiac muscle cell action potential(GO:1900827) |
| 4.4 | 44.5 | GO:0001504 | neurotransmitter uptake(GO:0001504) |
| 4.4 | 26.6 | GO:0034776 | response to histamine(GO:0034776) |
| 4.4 | 8.9 | GO:0014051 | gamma-aminobutyric acid secretion(GO:0014051) |
| 4.4 | 52.9 | GO:0098719 | sodium ion import across plasma membrane(GO:0098719) sodium ion import into cell(GO:1990118) |
| 4.4 | 13.2 | GO:1903625 | negative regulation of DNA catabolic process(GO:1903625) |
| 4.4 | 4.4 | GO:0050968 | detection of chemical stimulus involved in sensory perception of pain(GO:0050968) |
| 4.4 | 26.3 | GO:0016191 | synaptic vesicle uncoating(GO:0016191) |
| 4.4 | 8.8 | GO:0006982 | response to lipid hydroperoxide(GO:0006982) |
| 4.4 | 17.6 | GO:1902018 | negative regulation of cilium assembly(GO:1902018) |
| 4.4 | 26.2 | GO:0046465 | dolichyl diphosphate biosynthetic process(GO:0006489) dolichyl diphosphate metabolic process(GO:0046465) |
| 4.3 | 13.0 | GO:1900073 | regulation of neuromuscular synaptic transmission(GO:1900073) positive regulation of neuromuscular synaptic transmission(GO:1900075) |
| 4.3 | 8.7 | GO:0006665 | sphingolipid metabolic process(GO:0006665) |
| 4.3 | 73.6 | GO:0042417 | dopamine metabolic process(GO:0042417) |
| 4.3 | 17.3 | GO:0042539 | hypotonic salinity response(GO:0042539) cellular hypotonic salinity response(GO:0071477) |
| 4.3 | 13.0 | GO:1990403 | embryonic brain development(GO:1990403) |
| 4.3 | 17.3 | GO:0097035 | regulation of membrane lipid distribution(GO:0097035) |
| 4.3 | 17.3 | GO:0043321 | regulation of natural killer cell degranulation(GO:0043321) positive regulation of natural killer cell degranulation(GO:0043323) |
| 4.3 | 12.9 | GO:0090009 | primitive streak formation(GO:0090009) |
| 4.3 | 12.9 | GO:0038063 | collagen-activated tyrosine kinase receptor signaling pathway(GO:0038063) |
| 4.3 | 17.2 | GO:2000018 | regulation of male gonad development(GO:2000018) positive regulation of male gonad development(GO:2000020) |
| 4.3 | 34.3 | GO:2000049 | positive regulation of cell-cell adhesion mediated by cadherin(GO:2000049) |
| 4.3 | 12.9 | GO:0051725 | protein de-ADP-ribosylation(GO:0051725) |
| 4.3 | 47.0 | GO:0008038 | neuron recognition(GO:0008038) |
| 4.3 | 51.1 | GO:0090036 | regulation of protein kinase C signaling(GO:0090036) |
| 4.3 | 8.5 | GO:2001186 | regulation of T cell antigen processing and presentation(GO:0002625) negative regulation of CD8-positive, alpha-beta T cell activation(GO:2001186) |
| 4.3 | 12.8 | GO:0060084 | synaptic transmission involved in micturition(GO:0060084) |
| 4.2 | 127.5 | GO:0019228 | neuronal action potential(GO:0019228) |
| 4.2 | 21.2 | GO:0018231 | peptidyl-L-cysteine S-palmitoylation(GO:0018230) peptidyl-S-diacylglycerol-L-cysteine biosynthetic process from peptidyl-cysteine(GO:0018231) |
| 4.2 | 16.9 | GO:0010961 | cellular magnesium ion homeostasis(GO:0010961) |
| 4.2 | 33.8 | GO:0030516 | regulation of axon extension(GO:0030516) |
| 4.2 | 8.5 | GO:0060075 | regulation of resting membrane potential(GO:0060075) |
| 4.2 | 33.8 | GO:1990573 | potassium ion import across plasma membrane(GO:1990573) |
| 4.2 | 4.2 | GO:0042048 | olfactory behavior(GO:0042048) |
| 4.2 | 12.6 | GO:0043171 | peptide catabolic process(GO:0043171) |
| 4.2 | 12.6 | GO:0032074 | negative regulation of nuclease activity(GO:0032074) |
| 4.2 | 16.7 | GO:0002082 | regulation of oxidative phosphorylation(GO:0002082) |
| 4.2 | 58.4 | GO:2000291 | regulation of myoblast proliferation(GO:2000291) |
| 4.2 | 4.2 | GO:0006663 | platelet activating factor biosynthetic process(GO:0006663) |
| 4.2 | 4.2 | GO:0060157 | urinary bladder development(GO:0060157) |
| 4.2 | 78.9 | GO:0006895 | Golgi to endosome transport(GO:0006895) |
| 4.1 | 107.5 | GO:0036152 | phosphatidylethanolamine acyl-chain remodeling(GO:0036152) |
| 4.1 | 24.8 | GO:0002098 | tRNA wobble uridine modification(GO:0002098) |
| 4.1 | 24.8 | GO:0008088 | axo-dendritic transport(GO:0008088) |
| 4.1 | 8.2 | GO:1904430 | negative regulation of t-circle formation(GO:1904430) |
| 4.1 | 78.1 | GO:0097067 | cellular response to thyroid hormone stimulus(GO:0097067) |
| 4.1 | 28.7 | GO:0042574 | retinal metabolic process(GO:0042574) |
| 4.1 | 49.1 | GO:0042487 | regulation of odontogenesis of dentin-containing tooth(GO:0042487) |
| 4.1 | 36.7 | GO:0045003 | DNA recombinase assembly(GO:0000730) double-strand break repair via synthesis-dependent strand annealing(GO:0045003) |
| 4.1 | 28.5 | GO:1900449 | regulation of glutamate receptor signaling pathway(GO:1900449) |
| 4.1 | 60.8 | GO:1902259 | regulation of delayed rectifier potassium channel activity(GO:1902259) |
| 4.0 | 8.1 | GO:0051684 | maintenance of Golgi location(GO:0051684) |
| 4.0 | 16.1 | GO:0048712 | negative regulation of astrocyte differentiation(GO:0048712) |
| 4.0 | 12.0 | GO:0090315 | negative regulation of protein targeting to membrane(GO:0090315) |
| 4.0 | 24.0 | GO:0032468 | Golgi calcium ion homeostasis(GO:0032468) |
| 4.0 | 8.0 | GO:0050679 | positive regulation of epithelial cell proliferation(GO:0050679) |
| 4.0 | 4.0 | GO:0030432 | peristalsis(GO:0030432) |
| 4.0 | 15.8 | GO:0048563 | post-embryonic organ morphogenesis(GO:0048563) |
| 3.9 | 3.9 | GO:2001225 | regulation of chloride transport(GO:2001225) |
| 3.9 | 19.6 | GO:0015812 | gamma-aminobutyric acid transport(GO:0015812) |
| 3.9 | 7.8 | GO:0036159 | inner dynein arm assembly(GO:0036159) |
| 3.9 | 3.9 | GO:0015783 | GDP-fucose transport(GO:0015783) purine nucleotide-sugar transport(GO:0036079) |
| 3.9 | 23.3 | GO:0006003 | fructose 2,6-bisphosphate metabolic process(GO:0006003) |
| 3.9 | 11.6 | GO:0003416 | endochondral bone growth(GO:0003416) |
| 3.9 | 7.8 | GO:0060113 | inner ear receptor cell differentiation(GO:0060113) |
| 3.9 | 11.6 | GO:0070459 | prolactin secretion(GO:0070459) |
| 3.9 | 11.6 | GO:1902231 | positive regulation of intrinsic apoptotic signaling pathway in response to DNA damage(GO:1902231) |
| 3.8 | 19.2 | GO:0010571 | positive regulation of nuclear cell cycle DNA replication(GO:0010571) |
| 3.8 | 30.6 | GO:0010172 | embryonic body morphogenesis(GO:0010172) |
| 3.8 | 11.4 | GO:0006509 | membrane protein ectodomain proteolysis(GO:0006509) |
| 3.8 | 34.0 | GO:0021756 | striatum development(GO:0021756) |
| 3.8 | 15.0 | GO:0032496 | response to lipopolysaccharide(GO:0032496) |
| 3.8 | 3.8 | GO:0060290 | transdifferentiation(GO:0060290) |
| 3.7 | 7.5 | GO:0044340 | canonical Wnt signaling pathway involved in regulation of cell proliferation(GO:0044340) |
| 3.7 | 15.0 | GO:0030643 | cellular phosphate ion homeostasis(GO:0030643) cellular trivalent inorganic anion homeostasis(GO:0072502) |
| 3.7 | 29.8 | GO:0090042 | tubulin deacetylation(GO:0090042) |
| 3.7 | 29.8 | GO:0021904 | dorsal/ventral neural tube patterning(GO:0021904) |
| 3.7 | 3.7 | GO:2001293 | malonyl-CoA metabolic process(GO:2001293) |
| 3.7 | 3.7 | GO:1900109 | regulation of histone H3-K9 dimethylation(GO:1900109) |
| 3.7 | 11.1 | GO:0048485 | sympathetic nervous system development(GO:0048485) |
| 3.7 | 22.3 | GO:0007256 | activation of JNKK activity(GO:0007256) |
| 3.7 | 66.7 | GO:0050901 | leukocyte tethering or rolling(GO:0050901) |
| 3.7 | 18.5 | GO:0051012 | microtubule sliding(GO:0051012) |
| 3.7 | 225.0 | GO:1902476 | chloride transmembrane transport(GO:1902476) |
| 3.7 | 3.7 | GO:0032607 | interferon-alpha production(GO:0032607) |
| 3.7 | 3.7 | GO:0014005 | microglia differentiation(GO:0014004) microglia development(GO:0014005) |
| 3.7 | 18.4 | GO:0021978 | telencephalon regionalization(GO:0021978) |
| 3.7 | 3.7 | GO:0002437 | inflammatory response to antigenic stimulus(GO:0002437) |
| 3.7 | 55.2 | GO:0097484 | dendrite extension(GO:0097484) |
| 3.7 | 11.0 | GO:0060151 | peroxisome localization(GO:0060151) microtubule-based peroxisome localization(GO:0060152) |
| 3.7 | 11.0 | GO:0070317 | negative regulation of G0 to G1 transition(GO:0070317) |
| 3.7 | 11.0 | GO:0021514 | ventral spinal cord interneuron differentiation(GO:0021514) |
| 3.7 | 3.7 | GO:0036462 | TRAIL-activated apoptotic signaling pathway(GO:0036462) |
| 3.7 | 14.6 | GO:0090160 | Golgi to lysosome transport(GO:0090160) |
| 3.7 | 11.0 | GO:0010793 | regulation of mRNA export from nucleus(GO:0010793) |
| 3.6 | 10.9 | GO:1903844 | regulation of cellular response to transforming growth factor beta stimulus(GO:1903844) |
| 3.6 | 7.3 | GO:0090370 | negative regulation of cholesterol efflux(GO:0090370) |
| 3.6 | 7.3 | GO:0071442 | regulation of histone H3-K14 acetylation(GO:0071440) positive regulation of histone H3-K14 acetylation(GO:0071442) |
| 3.6 | 18.1 | GO:0030382 | sperm mitochondrion organization(GO:0030382) |
| 3.6 | 10.9 | GO:2000661 | positive regulation of interleukin-1-mediated signaling pathway(GO:2000661) |
| 3.6 | 7.2 | GO:0060050 | positive regulation of protein glycosylation(GO:0060050) |
| 3.6 | 10.8 | GO:0035524 | proline transmembrane transport(GO:0035524) |
| 3.6 | 3.6 | GO:0086036 | regulation of cardiac muscle cell membrane potential(GO:0086036) |
| 3.6 | 82.3 | GO:0003254 | regulation of membrane depolarization(GO:0003254) |
| 3.6 | 7.2 | GO:0007185 | transmembrane receptor protein tyrosine phosphatase signaling pathway(GO:0007185) |
| 3.6 | 3.6 | GO:0090219 | negative regulation of lipid kinase activity(GO:0090219) |
| 3.5 | 31.9 | GO:2000346 | negative regulation of hepatocyte proliferation(GO:2000346) |
| 3.5 | 7.1 | GO:0036018 | cellular response to erythropoietin(GO:0036018) |
| 3.5 | 10.6 | GO:0050966 | detection of mechanical stimulus involved in sensory perception of pain(GO:0050966) |
| 3.5 | 10.6 | GO:0006821 | chloride transport(GO:0006821) |
| 3.5 | 105.9 | GO:0007190 | activation of adenylate cyclase activity(GO:0007190) |
| 3.5 | 28.1 | GO:0006069 | ethanol oxidation(GO:0006069) |
| 3.5 | 14.0 | GO:2000348 | regulation of CD40 signaling pathway(GO:2000348) |
| 3.5 | 10.5 | GO:0006434 | seryl-tRNA aminoacylation(GO:0006434) selenocysteinyl-tRNA(Sec) biosynthetic process(GO:0097056) |
| 3.5 | 17.5 | GO:0048011 | neurotrophin TRK receptor signaling pathway(GO:0048011) |
| 3.5 | 3.5 | GO:0097490 | sympathetic neuron projection extension(GO:0097490) sympathetic neuron projection guidance(GO:0097491) |
| 3.5 | 20.8 | GO:0046007 | negative regulation of activated T cell proliferation(GO:0046007) |
| 3.5 | 20.8 | GO:0030322 | stabilization of membrane potential(GO:0030322) |
| 3.5 | 3.5 | GO:0051604 | protein maturation(GO:0051604) |
| 3.5 | 27.7 | GO:0097062 | dendritic spine maintenance(GO:0097062) |
| 3.5 | 51.9 | GO:0048642 | negative regulation of skeletal muscle tissue development(GO:0048642) |
| 3.4 | 17.2 | GO:0007229 | integrin-mediated signaling pathway(GO:0007229) |
| 3.4 | 51.6 | GO:1901385 | regulation of voltage-gated calcium channel activity(GO:1901385) |
| 3.4 | 44.6 | GO:0030388 | fructose 1,6-bisphosphate metabolic process(GO:0030388) |
| 3.4 | 17.2 | GO:0071638 | negative regulation of monocyte chemotactic protein-1 production(GO:0071638) |
| 3.4 | 13.7 | GO:0021895 | cerebral cortex neuron differentiation(GO:0021895) |
| 3.4 | 6.8 | GO:0061343 | cell adhesion involved in heart morphogenesis(GO:0061343) |
| 3.4 | 23.9 | GO:0048820 | hair follicle maturation(GO:0048820) |
| 3.4 | 17.0 | GO:0019323 | pentose catabolic process(GO:0019323) |
| 3.4 | 85.0 | GO:2000649 | regulation of sodium ion transmembrane transporter activity(GO:2000649) |
| 3.4 | 13.6 | GO:0042271 | susceptibility to natural killer cell mediated cytotoxicity(GO:0042271) |
| 3.4 | 64.5 | GO:0010107 | potassium ion import(GO:0010107) |
| 3.4 | 16.9 | GO:0006655 | phosphatidylglycerol biosynthetic process(GO:0006655) |
| 3.4 | 10.1 | GO:0048213 | Golgi vesicle prefusion complex stabilization(GO:0048213) |
| 3.4 | 3.4 | GO:0051549 | positive regulation of keratinocyte migration(GO:0051549) |
| 3.4 | 20.2 | GO:0016075 | rRNA catabolic process(GO:0016075) |
| 3.3 | 10.0 | GO:1902510 | regulation of apoptotic DNA fragmentation(GO:1902510) |
| 3.3 | 56.7 | GO:0045746 | negative regulation of Notch signaling pathway(GO:0045746) |
| 3.3 | 3.3 | GO:0048861 | leukemia inhibitory factor signaling pathway(GO:0048861) |
| 3.3 | 26.6 | GO:0001778 | plasma membrane repair(GO:0001778) |
| 3.3 | 16.6 | GO:0042118 | endothelial cell activation(GO:0042118) |
| 3.3 | 19.9 | GO:0007135 | meiosis II(GO:0007135) |
| 3.3 | 6.6 | GO:0007217 | tachykinin receptor signaling pathway(GO:0007217) |
| 3.3 | 16.4 | GO:0032007 | negative regulation of TOR signaling(GO:0032007) |
| 3.3 | 19.6 | GO:0019262 | N-acetylneuraminate catabolic process(GO:0019262) |
| 3.3 | 35.9 | GO:0051481 | negative regulation of cytosolic calcium ion concentration(GO:0051481) |
| 3.3 | 6.5 | GO:0030916 | otic vesicle formation(GO:0030916) |
| 3.3 | 13.0 | GO:0001661 | conditioned taste aversion(GO:0001661) |
| 3.3 | 13.0 | GO:0048102 | autophagic cell death(GO:0048102) |
| 3.2 | 19.5 | GO:0051694 | pointed-end actin filament capping(GO:0051694) |
| 3.2 | 3.2 | GO:0048841 | regulation of axon extension involved in axon guidance(GO:0048841) |
| 3.2 | 9.6 | GO:0060219 | camera-type eye photoreceptor cell differentiation(GO:0060219) |
| 3.2 | 16.0 | GO:0022011 | myelination in peripheral nervous system(GO:0022011) peripheral nervous system axon ensheathment(GO:0032292) |
| 3.2 | 22.4 | GO:0007506 | gonadal mesoderm development(GO:0007506) |
| 3.2 | 25.6 | GO:0015919 | peroxisomal membrane transport(GO:0015919) |
| 3.2 | 12.8 | GO:0015705 | iodide transport(GO:0015705) |
| 3.2 | 12.8 | GO:0038030 | non-canonical Wnt signaling pathway via MAPK cascade(GO:0038030) non-canonical Wnt signaling pathway via JNK cascade(GO:0038031) |
| 3.2 | 19.2 | GO:0035457 | cellular response to interferon-alpha(GO:0035457) |
| 3.2 | 3.2 | GO:0035469 | determination of pancreatic left/right asymmetry(GO:0035469) |
| 3.2 | 12.7 | GO:0018125 | peptidyl-cysteine methylation(GO:0018125) |
| 3.2 | 3.2 | GO:0051547 | regulation of keratinocyte migration(GO:0051547) |
| 3.2 | 12.6 | GO:0045739 | positive regulation of DNA repair(GO:0045739) |
| 3.2 | 3.2 | GO:0001992 | regulation of systemic arterial blood pressure by vasopressin(GO:0001992) |
| 3.1 | 22.0 | GO:0015791 | polyol transport(GO:0015791) |
| 3.1 | 9.4 | GO:1903244 | positive regulation of cardiac muscle adaptation(GO:0010615) positive regulation of cardiac muscle hypertrophy in response to stress(GO:1903244) |
| 3.1 | 28.2 | GO:0036158 | outer dynein arm assembly(GO:0036158) |
| 3.1 | 22.0 | GO:0016558 | protein import into peroxisome matrix(GO:0016558) |
| 3.1 | 6.2 | GO:0045646 | regulation of erythrocyte differentiation(GO:0045646) |
| 3.1 | 3.1 | GO:0055119 | relaxation of cardiac muscle(GO:0055119) |
| 3.1 | 12.4 | GO:0060662 | tube lumen cavitation(GO:0060605) salivary gland cavitation(GO:0060662) |
| 3.1 | 12.4 | GO:0072661 | protein targeting to plasma membrane(GO:0072661) |
| 3.1 | 24.8 | GO:0035418 | protein localization to synapse(GO:0035418) |
| 3.1 | 15.4 | GO:0048016 | inositol phosphate-mediated signaling(GO:0048016) |
| 3.1 | 9.2 | GO:0035621 | ER to Golgi ceramide transport(GO:0035621) |
| 3.1 | 49.2 | GO:0035493 | SNARE complex assembly(GO:0035493) |
| 3.1 | 33.8 | GO:0015886 | heme transport(GO:0015886) |
| 3.1 | 15.3 | GO:0003096 | renal sodium ion transport(GO:0003096) |
| 3.1 | 6.1 | GO:0072033 | renal vesicle formation(GO:0072033) ureteric bud invasion(GO:0072092) metanephric renal vesicle formation(GO:0072093) |
| 3.1 | 9.2 | GO:0034122 | negative regulation of toll-like receptor signaling pathway(GO:0034122) |
| 3.0 | 12.2 | GO:0006210 | pyrimidine nucleobase catabolic process(GO:0006208) thymine catabolic process(GO:0006210) thymine metabolic process(GO:0019859) |
| 3.0 | 21.3 | GO:0046604 | positive regulation of mitotic centrosome separation(GO:0046604) |
| 3.0 | 9.1 | GO:1903846 | positive regulation of transforming growth factor beta receptor signaling pathway(GO:0030511) positive regulation of cellular response to transforming growth factor beta stimulus(GO:1903846) |
| 3.0 | 3.0 | GO:0072254 | metanephric mesangial cell differentiation(GO:0072209) metanephric glomerular mesangial cell differentiation(GO:0072254) |
| 3.0 | 9.1 | GO:0071313 | cellular response to caffeine(GO:0071313) |
| 3.0 | 12.1 | GO:1903597 | negative regulation of gap junction assembly(GO:1903597) |
| 3.0 | 6.0 | GO:0043932 | ossification involved in bone remodeling(GO:0043932) |
| 3.0 | 15.1 | GO:0097152 | mesenchymal cell apoptotic process(GO:0097152) |
| 3.0 | 21.1 | GO:0018198 | peptidyl-cysteine modification(GO:0018198) |
| 3.0 | 12.1 | GO:0043615 | astrocyte cell migration(GO:0043615) |
| 3.0 | 18.0 | GO:0010533 | regulation of activation of Janus kinase activity(GO:0010533) |
| 3.0 | 12.0 | GO:0035871 | protein K11-linked deubiquitination(GO:0035871) |
| 3.0 | 3.0 | GO:0002029 | desensitization of G-protein coupled receptor protein signaling pathway(GO:0002029) negative adaptation of signaling pathway(GO:0022401) |
| 3.0 | 27.0 | GO:0033689 | negative regulation of osteoblast proliferation(GO:0033689) |
| 3.0 | 59.9 | GO:0031167 | rRNA methylation(GO:0031167) |
| 3.0 | 27.0 | GO:0044342 | type B pancreatic cell proliferation(GO:0044342) |
| 3.0 | 18.0 | GO:0048265 | response to pain(GO:0048265) |
| 3.0 | 20.9 | GO:0021772 | olfactory bulb development(GO:0021772) olfactory lobe development(GO:0021988) |
| 3.0 | 32.8 | GO:0043551 | regulation of phosphatidylinositol 3-kinase activity(GO:0043551) |
| 3.0 | 20.9 | GO:0001672 | regulation of chromatin assembly or disassembly(GO:0001672) |
| 3.0 | 6.0 | GO:1903348 | positive regulation of bicellular tight junction assembly(GO:1903348) |
| 3.0 | 14.9 | GO:0019226 | transmission of nerve impulse(GO:0019226) |
| 3.0 | 11.9 | GO:0038170 | somatostatin receptor signaling pathway(GO:0038169) somatostatin signaling pathway(GO:0038170) |
| 3.0 | 151.4 | GO:0035773 | insulin secretion involved in cellular response to glucose stimulus(GO:0035773) |
| 3.0 | 23.7 | GO:0060856 | establishment of blood-brain barrier(GO:0060856) |
| 3.0 | 14.8 | GO:0070120 | ciliary neurotrophic factor-mediated signaling pathway(GO:0070120) |
| 3.0 | 3.0 | GO:0019254 | carnitine metabolic process, CoA-linked(GO:0019254) |
| 2.9 | 5.9 | GO:0035696 | monocyte extravasation(GO:0035696) regulation of monocyte extravasation(GO:2000437) positive regulation of monocyte extravasation(GO:2000439) |
| 2.9 | 8.8 | GO:0010248 | establishment or maintenance of transmembrane electrochemical gradient(GO:0010248) |
| 2.9 | 91.0 | GO:0072378 | blood coagulation, fibrin clot formation(GO:0072378) |
| 2.9 | 17.6 | GO:0045879 | negative regulation of smoothened signaling pathway(GO:0045879) |
| 2.9 | 29.2 | GO:0070633 | transepithelial transport(GO:0070633) |
| 2.9 | 26.2 | GO:0006600 | creatine metabolic process(GO:0006600) |
| 2.9 | 40.6 | GO:0002230 | positive regulation of defense response to virus by host(GO:0002230) |
| 2.9 | 20.3 | GO:0043634 | polyadenylation-dependent ncRNA catabolic process(GO:0043634) |
| 2.9 | 17.4 | GO:0071447 | cellular response to hydroperoxide(GO:0071447) |
| 2.9 | 20.1 | GO:0035249 | synaptic transmission, glutamatergic(GO:0035249) |
| 2.9 | 11.5 | GO:0039536 | negative regulation of RIG-I signaling pathway(GO:0039536) |
| 2.9 | 2.9 | GO:0051771 | negative regulation of nitric-oxide synthase biosynthetic process(GO:0051771) |
| 2.9 | 2.9 | GO:0046113 | nucleobase catabolic process(GO:0046113) |
| 2.9 | 11.4 | GO:0051642 | centrosome localization(GO:0051642) |
| 2.8 | 5.7 | GO:0042160 | lipoprotein modification(GO:0042160) lipoprotein oxidation(GO:0042161) |
| 2.8 | 8.5 | GO:0002730 | regulation of dendritic cell cytokine production(GO:0002730) negative regulation of dendritic cell cytokine production(GO:0002731) |
| 2.8 | 8.5 | GO:0061484 | hematopoietic stem cell homeostasis(GO:0061484) |
| 2.8 | 11.3 | GO:1903963 | arachidonic acid secretion(GO:0050482) arachidonate transport(GO:1903963) |
| 2.8 | 76.2 | GO:0035428 | hexose transmembrane transport(GO:0035428) glucose transmembrane transport(GO:1904659) |
| 2.8 | 8.5 | GO:0048147 | negative regulation of fibroblast proliferation(GO:0048147) |
| 2.8 | 2.8 | GO:0051208 | sequestering of calcium ion(GO:0051208) |
| 2.8 | 112.7 | GO:0051496 | positive regulation of stress fiber assembly(GO:0051496) |
| 2.8 | 109.8 | GO:0006904 | vesicle docking involved in exocytosis(GO:0006904) |
| 2.8 | 28.1 | GO:0014742 | positive regulation of cardiac muscle hypertrophy(GO:0010613) positive regulation of muscle hypertrophy(GO:0014742) |
| 2.8 | 11.2 | GO:0018032 | peptide amidation(GO:0001519) protein amidation(GO:0018032) peptide modification(GO:0031179) |
| 2.8 | 25.2 | GO:0031112 | positive regulation of microtubule polymerization or depolymerization(GO:0031112) |
| 2.8 | 27.9 | GO:0006776 | vitamin A metabolic process(GO:0006776) |
| 2.8 | 2.8 | GO:0045112 | integrin biosynthetic process(GO:0045112) |
| 2.8 | 22.3 | GO:0045717 | negative regulation of fatty acid biosynthetic process(GO:0045717) |
| 2.8 | 11.1 | GO:0009298 | GDP-mannose biosynthetic process(GO:0009298) |
| 2.8 | 13.9 | GO:0090073 | positive regulation of protein homodimerization activity(GO:0090073) |
| 2.8 | 16.7 | GO:1901525 | negative regulation of macromitophagy(GO:1901525) |
| 2.8 | 30.5 | GO:0048251 | elastic fiber assembly(GO:0048251) |
| 2.8 | 19.4 | GO:0051384 | response to glucocorticoid(GO:0051384) |
| 2.8 | 2.8 | GO:0090298 | negative regulation of mitochondrial DNA replication(GO:0090298) negative regulation of mitochondrial DNA metabolic process(GO:1901859) |
| 2.8 | 8.3 | GO:0045631 | regulation of auditory receptor cell differentiation(GO:0045607) regulation of mechanoreceptor differentiation(GO:0045631) regulation of inner ear receptor cell differentiation(GO:2000980) |
| 2.8 | 2.8 | GO:1904684 | negative regulation of metalloendopeptidase activity(GO:1904684) |
| 2.7 | 2.7 | GO:0043569 | negative regulation of insulin-like growth factor receptor signaling pathway(GO:0043569) |
| 2.7 | 8.2 | GO:0030324 | lung development(GO:0030324) |
| 2.7 | 10.9 | GO:0034371 | chylomicron remodeling(GO:0034371) |
| 2.7 | 8.2 | GO:0046950 | cellular ketone body metabolic process(GO:0046950) |
| 2.7 | 2.7 | GO:0009396 | folic acid-containing compound biosynthetic process(GO:0009396) |
| 2.7 | 13.6 | GO:0034472 | snRNA 3'-end processing(GO:0034472) |
| 2.7 | 5.4 | GO:0030886 | negative regulation of myeloid dendritic cell activation(GO:0030886) |
| 2.7 | 32.5 | GO:0007158 | neuron cell-cell adhesion(GO:0007158) |
| 2.7 | 13.5 | GO:0043654 | recognition of apoptotic cell(GO:0043654) |
| 2.7 | 5.4 | GO:0010739 | positive regulation of protein kinase A signaling(GO:0010739) |
| 2.7 | 37.8 | GO:0034446 | substrate adhesion-dependent cell spreading(GO:0034446) |
| 2.7 | 26.9 | GO:0031284 | positive regulation of guanylate cyclase activity(GO:0031284) |
| 2.7 | 13.4 | GO:0060391 | positive regulation of SMAD protein import into nucleus(GO:0060391) |
| 2.7 | 21.3 | GO:0006044 | N-acetylglucosamine metabolic process(GO:0006044) |
| 2.7 | 13.3 | GO:1901223 | negative regulation of NIK/NF-kappaB signaling(GO:1901223) |
| 2.7 | 23.9 | GO:0032411 | positive regulation of transporter activity(GO:0032411) |
| 2.7 | 34.5 | GO:0055003 | cardiac myofibril assembly(GO:0055003) |
| 2.7 | 39.8 | GO:2000369 | regulation of clathrin-mediated endocytosis(GO:2000369) |
| 2.7 | 8.0 | GO:0052203 | modulation by symbiont of host molecular function(GO:0052055) modulation of catalytic activity in other organism involved in symbiotic interaction(GO:0052203) modulation by host of symbiont catalytic activity(GO:0052422) |
| 2.6 | 7.8 | GO:0061314 | Notch signaling involved in heart development(GO:0061314) |
| 2.6 | 10.4 | GO:0045023 | G0 to G1 transition(GO:0045023) |
| 2.6 | 5.2 | GO:0007548 | sex differentiation(GO:0007548) |
| 2.6 | 70.1 | GO:0007257 | activation of JUN kinase activity(GO:0007257) |
| 2.6 | 77.7 | GO:0016486 | peptide hormone processing(GO:0016486) |
| 2.6 | 5.2 | GO:0021558 | trochlear nerve development(GO:0021558) |
| 2.6 | 10.3 | GO:0018343 | protein farnesylation(GO:0018343) |
| 2.6 | 5.2 | GO:0006001 | fructose catabolic process(GO:0006001) fructose catabolic process to hydroxyacetone phosphate and glyceraldehyde-3-phosphate(GO:0061624) |
| 2.6 | 25.7 | GO:0036465 | synaptic vesicle recycling(GO:0036465) |
| 2.6 | 5.1 | GO:0060448 | dichotomous subdivision of terminal units involved in lung branching(GO:0060448) |
| 2.6 | 20.5 | GO:0072592 | oxygen metabolic process(GO:0072592) |
| 2.5 | 5.1 | GO:0055099 | response to high density lipoprotein particle(GO:0055099) |
| 2.5 | 15.1 | GO:0097205 | renal filtration(GO:0097205) |
| 2.5 | 7.5 | GO:0072010 | glomerular epithelium development(GO:0072010) |
| 2.5 | 69.8 | GO:0006783 | heme biosynthetic process(GO:0006783) |
| 2.5 | 14.9 | GO:0043550 | regulation of lipid kinase activity(GO:0043550) |
| 2.5 | 2.5 | GO:0002053 | positive regulation of mesenchymal cell proliferation(GO:0002053) |
| 2.5 | 24.6 | GO:0042492 | gamma-delta T cell differentiation(GO:0042492) |
| 2.4 | 205.4 | GO:0006836 | neurotransmitter transport(GO:0006836) |
| 2.4 | 44.0 | GO:0019372 | lipoxygenase pathway(GO:0019372) |
| 2.4 | 4.9 | GO:0060729 | intestinal epithelial structure maintenance(GO:0060729) |
| 2.4 | 17.1 | GO:0051415 | interphase microtubule nucleation by interphase microtubule organizing center(GO:0051415) microtubule nucleation by microtubule organizing center(GO:0051418) |
| 2.4 | 9.7 | GO:0015811 | L-cystine transport(GO:0015811) |
| 2.4 | 14.5 | GO:0030813 | positive regulation of nucleotide catabolic process(GO:0030813) |
| 2.4 | 2.4 | GO:0001696 | gastric acid secretion(GO:0001696) |
| 2.4 | 2.4 | GO:0050902 | leukocyte adhesive activation(GO:0050902) |
| 2.4 | 4.8 | GO:0090050 | positive regulation of cell migration involved in sprouting angiogenesis(GO:0090050) |
| 2.4 | 2.4 | GO:0060023 | soft palate development(GO:0060023) |
| 2.4 | 19.3 | GO:0050771 | negative regulation of axonogenesis(GO:0050771) |
| 2.4 | 7.2 | GO:0045404 | interleukin-4 biosynthetic process(GO:0042097) regulation of interleukin-4 biosynthetic process(GO:0045402) positive regulation of interleukin-4 biosynthetic process(GO:0045404) |
| 2.4 | 139.6 | GO:0042147 | retrograde transport, endosome to Golgi(GO:0042147) |
| 2.4 | 24.0 | GO:0097435 | fibril organization(GO:0097435) |
| 2.4 | 9.6 | GO:0031645 | negative regulation of myelination(GO:0031642) negative regulation of neurological system process(GO:0031645) |
| 2.4 | 2.4 | GO:0050720 | interleukin-1 beta biosynthetic process(GO:0050720) |
| 2.4 | 33.5 | GO:0071850 | mitotic cell cycle arrest(GO:0071850) |
| 2.4 | 4.8 | GO:0002371 | dendritic cell cytokine production(GO:0002371) |
| 2.4 | 4.8 | GO:0046322 | negative regulation of fatty acid oxidation(GO:0046322) |
| 2.4 | 11.9 | GO:1901660 | calcium ion export(GO:1901660) |
| 2.4 | 16.6 | GO:0007512 | adult heart development(GO:0007512) |
| 2.4 | 14.2 | GO:0035865 | cellular response to potassium ion(GO:0035865) |
| 2.4 | 80.5 | GO:0042059 | negative regulation of epidermal growth factor receptor signaling pathway(GO:0042059) |
| 2.4 | 30.8 | GO:0010738 | regulation of protein kinase A signaling(GO:0010738) |
| 2.4 | 9.4 | GO:0006689 | ganglioside catabolic process(GO:0006689) |
| 2.4 | 9.4 | GO:0060283 | negative regulation of oocyte development(GO:0060283) negative regulation of oocyte maturation(GO:1900194) |
| 2.4 | 18.8 | GO:0006704 | glucocorticoid biosynthetic process(GO:0006704) |
| 2.3 | 2.3 | GO:0061387 | regulation of extent of cell growth(GO:0061387) |
| 2.3 | 2.3 | GO:1990637 | response to prolactin(GO:1990637) |
| 2.3 | 7.0 | GO:0048312 | intracellular distribution of mitochondria(GO:0048312) |
| 2.3 | 2.3 | GO:0051167 | glucuronate catabolic process(GO:0006064) glucuronate catabolic process to xylulose 5-phosphate(GO:0019640) xylulose 5-phosphate metabolic process(GO:0051167) xylulose 5-phosphate biosynthetic process(GO:1901159) |
| 2.3 | 2.3 | GO:0046061 | dATP catabolic process(GO:0046061) |
| 2.3 | 7.0 | GO:2000503 | positive regulation of natural killer cell chemotaxis(GO:2000503) |
| 2.3 | 37.3 | GO:0090140 | regulation of mitochondrial fission(GO:0090140) |
| 2.3 | 2.3 | GO:0006533 | aspartate catabolic process(GO:0006533) |
| 2.3 | 16.1 | GO:0006384 | transcription initiation from RNA polymerase III promoter(GO:0006384) |
| 2.3 | 16.1 | GO:0009886 | post-embryonic morphogenesis(GO:0009886) |
| 2.3 | 38.9 | GO:2000785 | regulation of autophagosome assembly(GO:2000785) |
| 2.3 | 52.3 | GO:0001578 | microtubule bundle formation(GO:0001578) |
| 2.3 | 13.6 | GO:0031666 | positive regulation of lipopolysaccharide-mediated signaling pathway(GO:0031666) |
| 2.3 | 20.4 | GO:0047496 | vesicle transport along microtubule(GO:0047496) |
| 2.3 | 6.8 | GO:0048630 | skeletal muscle tissue growth(GO:0048630) |
| 2.2 | 9.0 | GO:0035616 | histone H2B conserved C-terminal lysine deubiquitination(GO:0035616) |
| 2.2 | 2.2 | GO:1990834 | response to odorant(GO:1990834) |
| 2.2 | 24.5 | GO:0030866 | cortical actin cytoskeleton organization(GO:0030866) |
| 2.2 | 4.4 | GO:0000294 | nuclear-transcribed mRNA catabolic process, endonucleolytic cleavage-dependent decay(GO:0000294) |
| 2.2 | 4.4 | GO:0046068 | cGMP metabolic process(GO:0046068) |
| 2.2 | 22.2 | GO:0030728 | ovulation(GO:0030728) |
| 2.2 | 20.0 | GO:0043162 | ubiquitin-dependent protein catabolic process via the multivesicular body sorting pathway(GO:0043162) |
| 2.2 | 111.0 | GO:0010923 | negative regulation of phosphatase activity(GO:0010923) |
| 2.2 | 13.3 | GO:0048821 | erythrocyte development(GO:0048821) |
| 2.2 | 15.5 | GO:0006685 | sphingomyelin catabolic process(GO:0006685) |
| 2.2 | 2.2 | GO:2000677 | regulation of transcription regulatory region DNA binding(GO:2000677) |
| 2.2 | 2.2 | GO:0090521 | glomerular visceral epithelial cell migration(GO:0090521) |
| 2.2 | 19.8 | GO:0048245 | eosinophil chemotaxis(GO:0048245) |
| 2.2 | 2.2 | GO:0035634 | response to stilbenoid(GO:0035634) |
| 2.2 | 4.4 | GO:0060040 | retinal bipolar neuron differentiation(GO:0060040) |
| 2.2 | 13.0 | GO:0006537 | glutamate biosynthetic process(GO:0006537) |
| 2.2 | 34.7 | GO:0048854 | brain morphogenesis(GO:0048854) |
| 2.2 | 8.7 | GO:0003091 | renal water homeostasis(GO:0003091) |
| 2.2 | 4.3 | GO:0032526 | response to retinoic acid(GO:0032526) |
| 2.2 | 8.6 | GO:0035635 | entry of bacterium into host cell(GO:0035635) |
| 2.2 | 10.8 | GO:0048104 | establishment of body hair or bristle planar orientation(GO:0048104) establishment of body hair planar orientation(GO:0048105) |
| 2.2 | 15.1 | GO:0045007 | depurination(GO:0045007) |
| 2.1 | 2.1 | GO:0035411 | catenin import into nucleus(GO:0035411) |
| 2.1 | 12.9 | GO:0097011 | cellular response to granulocyte macrophage colony-stimulating factor stimulus(GO:0097011) response to granulocyte macrophage colony-stimulating factor(GO:0097012) |
| 2.1 | 12.8 | GO:0032958 | inositol phosphate biosynthetic process(GO:0032958) |
| 2.1 | 25.6 | GO:0032515 | negative regulation of phosphoprotein phosphatase activity(GO:0032515) |
| 2.1 | 4.3 | GO:1900425 | negative regulation of defense response to bacterium(GO:1900425) |
| 2.1 | 6.4 | GO:1902490 | regulation of sperm capacitation(GO:1902490) |
| 2.1 | 14.7 | GO:0003351 | epithelial cilium movement(GO:0003351) |
| 2.1 | 16.7 | GO:0050974 | detection of mechanical stimulus involved in sensory perception(GO:0050974) |
| 2.1 | 16.6 | GO:0060736 | prostate gland growth(GO:0060736) |
| 2.1 | 2.1 | GO:0036155 | acylglycerol acyl-chain remodeling(GO:0036155) |
| 2.1 | 6.2 | GO:0070105 | regulation of interleukin-6-mediated signaling pathway(GO:0070103) positive regulation of interleukin-6-mediated signaling pathway(GO:0070105) |
| 2.1 | 37.1 | GO:0006853 | carnitine shuttle(GO:0006853) |
| 2.1 | 76.0 | GO:0071277 | cellular response to calcium ion(GO:0071277) |
| 2.0 | 6.1 | GO:0060004 | reflex(GO:0060004) |
| 2.0 | 6.1 | GO:0051102 | DNA ligation involved in DNA recombination(GO:0051102) |
| 2.0 | 4.1 | GO:0034146 | toll-like receptor 5 signaling pathway(GO:0034146) |
| 2.0 | 2.0 | GO:0010593 | negative regulation of lamellipodium assembly(GO:0010593) negative regulation of lamellipodium organization(GO:1902744) |
| 2.0 | 2.0 | GO:0002221 | pattern recognition receptor signaling pathway(GO:0002221) toll-like receptor signaling pathway(GO:0002224) |
| 2.0 | 10.1 | GO:0030500 | regulation of bone mineralization(GO:0030500) |
| 2.0 | 20.0 | GO:0035878 | nail development(GO:0035878) |
| 2.0 | 4.0 | GO:0046838 | phosphorylated carbohydrate dephosphorylation(GO:0046838) inositol phosphate dephosphorylation(GO:0046855) inositol phosphate catabolic process(GO:0071545) |
| 2.0 | 2.0 | GO:0071926 | endocannabinoid signaling pathway(GO:0071926) |
| 2.0 | 8.0 | GO:0090080 | positive regulation of MAPKKK cascade by fibroblast growth factor receptor signaling pathway(GO:0090080) |
| 2.0 | 17.9 | GO:0032836 | glomerular basement membrane development(GO:0032836) |
| 2.0 | 12.0 | GO:0042426 | choline catabolic process(GO:0042426) |
| 2.0 | 23.8 | GO:0007398 | ectoderm development(GO:0007398) |
| 2.0 | 9.9 | GO:0060042 | retina morphogenesis in camera-type eye(GO:0060042) |
| 2.0 | 2.0 | GO:0060384 | innervation(GO:0060384) |
| 2.0 | 7.9 | GO:0045741 | positive regulation of epidermal growth factor-activated receptor activity(GO:0045741) |
| 2.0 | 25.6 | GO:0043011 | myeloid dendritic cell differentiation(GO:0043011) |
| 2.0 | 2.0 | GO:1901341 | activation of store-operated calcium channel activity(GO:0032237) positive regulation of store-operated calcium channel activity(GO:1901341) |
| 2.0 | 3.9 | GO:0060748 | tertiary branching involved in mammary gland duct morphogenesis(GO:0060748) |
| 1.9 | 11.7 | GO:2000194 | regulation of female gonad development(GO:2000194) |
| 1.9 | 11.6 | GO:0070528 | protein kinase C signaling(GO:0070528) |
| 1.9 | 3.9 | GO:0001574 | ganglioside biosynthetic process(GO:0001574) |
| 1.9 | 1.9 | GO:0001955 | blood vessel maturation(GO:0001955) |
| 1.9 | 34.6 | GO:0060291 | long-term synaptic potentiation(GO:0060291) |
| 1.9 | 3.8 | GO:1902548 | negative regulation of cellular response to vascular endothelial growth factor stimulus(GO:1902548) |
| 1.9 | 26.7 | GO:0050806 | positive regulation of synaptic transmission(GO:0050806) |
| 1.9 | 3.8 | GO:0001935 | endothelial cell proliferation(GO:0001935) |
| 1.9 | 51.4 | GO:0030279 | negative regulation of ossification(GO:0030279) |
| 1.9 | 1.9 | GO:0003343 | proepicardium development(GO:0003342) septum transversum development(GO:0003343) |
| 1.9 | 11.4 | GO:0006768 | biotin metabolic process(GO:0006768) |
| 1.9 | 1.9 | GO:1900138 | negative regulation of phospholipase A2 activity(GO:1900138) |
| 1.9 | 28.3 | GO:0007130 | synaptonemal complex assembly(GO:0007130) |
| 1.9 | 101.6 | GO:0044243 | multicellular organism catabolic process(GO:0044243) |
| 1.9 | 7.5 | GO:0008626 | granzyme-mediated apoptotic signaling pathway(GO:0008626) |
| 1.9 | 11.2 | GO:0034384 | high-density lipoprotein particle clearance(GO:0034384) |
| 1.9 | 5.6 | GO:0001554 | luteolysis(GO:0001554) |
| 1.9 | 1.9 | GO:0060972 | left/right pattern formation(GO:0060972) |
| 1.9 | 1.9 | GO:2000773 | negative regulation of cellular senescence(GO:2000773) |
| 1.9 | 14.9 | GO:0006451 | selenocysteine incorporation(GO:0001514) translational readthrough(GO:0006451) |
| 1.9 | 7.4 | GO:0060762 | regulation of branching involved in mammary gland duct morphogenesis(GO:0060762) |
| 1.8 | 5.5 | GO:0071027 | nuclear RNA surveillance(GO:0071027) nuclear mRNA surveillance(GO:0071028) |
| 1.8 | 5.5 | GO:0050962 | detection of light stimulus involved in visual perception(GO:0050908) detection of light stimulus involved in sensory perception(GO:0050962) |
| 1.8 | 5.5 | GO:0001757 | somite specification(GO:0001757) |
| 1.8 | 38.6 | GO:0051482 | positive regulation of cytosolic calcium ion concentration involved in phospholipase C-activating G-protein coupled signaling pathway(GO:0051482) |
| 1.8 | 1.8 | GO:0071219 | cellular response to molecule of bacterial origin(GO:0071219) cellular response to lipopolysaccharide(GO:0071222) |
| 1.8 | 66.0 | GO:0046580 | negative regulation of Ras protein signal transduction(GO:0046580) negative regulation of small GTPase mediated signal transduction(GO:0051058) |
| 1.8 | 1.8 | GO:0070417 | cellular response to cold(GO:0070417) |
| 1.8 | 9.1 | GO:1904779 | regulation of protein localization to centrosome(GO:1904779) |
| 1.8 | 18.3 | GO:0048227 | plasma membrane to endosome transport(GO:0048227) |
| 1.8 | 125.2 | GO:0007626 | locomotory behavior(GO:0007626) |
| 1.8 | 74.1 | GO:0007218 | neuropeptide signaling pathway(GO:0007218) |
| 1.8 | 214.6 | GO:0007266 | Rho protein signal transduction(GO:0007266) |
| 1.8 | 1.8 | GO:0034427 | nuclear-transcribed mRNA catabolic process, exonucleolytic, 3'-5'(GO:0034427) |
| 1.8 | 3.6 | GO:0035405 | histone-threonine phosphorylation(GO:0035405) |
| 1.8 | 3.6 | GO:0019896 | axonal transport of mitochondrion(GO:0019896) |
| 1.8 | 3.6 | GO:2000382 | positive regulation of mesoderm development(GO:2000382) |
| 1.8 | 7.1 | GO:0042743 | hydrogen peroxide metabolic process(GO:0042743) |
| 1.8 | 1.8 | GO:0030240 | skeletal muscle thin filament assembly(GO:0030240) |
| 1.8 | 7.1 | GO:0070995 | NADPH oxidation(GO:0070995) |
| 1.8 | 28.3 | GO:0060323 | head morphogenesis(GO:0060323) |
| 1.8 | 24.7 | GO:0007340 | acrosome reaction(GO:0007340) |
| 1.8 | 21.2 | GO:0021983 | pituitary gland development(GO:0021983) |
| 1.8 | 21.1 | GO:0097034 | mitochondrial respiratory chain complex IV assembly(GO:0033617) mitochondrial respiratory chain complex IV biogenesis(GO:0097034) |
| 1.8 | 5.3 | GO:0034086 | maintenance of sister chromatid cohesion(GO:0034086) maintenance of mitotic sister chromatid cohesion(GO:0034088) |
| 1.7 | 40.2 | GO:1901687 | glutathione derivative metabolic process(GO:1901685) glutathione derivative biosynthetic process(GO:1901687) |
| 1.7 | 7.0 | GO:0032103 | positive regulation of response to external stimulus(GO:0032103) |
| 1.7 | 20.9 | GO:0060707 | trophoblast giant cell differentiation(GO:0060707) |
| 1.7 | 10.5 | GO:1990126 | retrograde transport, endosome to plasma membrane(GO:1990126) |
| 1.7 | 17.4 | GO:0032944 | regulation of mononuclear cell proliferation(GO:0032944) |
| 1.7 | 17.4 | GO:1901522 | positive regulation of transcription from RNA polymerase II promoter involved in cellular response to chemical stimulus(GO:1901522) |
| 1.7 | 17.3 | GO:0035728 | response to hepatocyte growth factor(GO:0035728) |
| 1.7 | 3.5 | GO:0035434 | copper ion transmembrane transport(GO:0035434) |
| 1.7 | 3.4 | GO:0001880 | Mullerian duct regression(GO:0001880) |
| 1.7 | 3.4 | GO:1900227 | positive regulation of NLRP3 inflammasome complex assembly(GO:1900227) |
| 1.7 | 6.9 | GO:0007468 | regulation of rhodopsin gene expression(GO:0007468) positive regulation of rhodopsin gene expression(GO:0045872) |
| 1.7 | 3.4 | GO:0048641 | regulation of skeletal muscle tissue development(GO:0048641) |
| 1.7 | 22.3 | GO:0042403 | thyroid hormone metabolic process(GO:0042403) |
| 1.7 | 6.8 | GO:2000052 | regulation of non-canonical Wnt signaling pathway(GO:2000050) positive regulation of non-canonical Wnt signaling pathway(GO:2000052) |
| 1.7 | 6.8 | GO:0010968 | regulation of microtubule nucleation(GO:0010968) |
| 1.7 | 6.8 | GO:0003341 | cilium movement(GO:0003341) |
| 1.7 | 18.6 | GO:0016576 | histone dephosphorylation(GO:0016576) |
| 1.7 | 5.1 | GO:0048280 | vesicle fusion with Golgi apparatus(GO:0048280) |
| 1.6 | 3.3 | GO:0002024 | diet induced thermogenesis(GO:0002024) |
| 1.6 | 1.6 | GO:0035590 | purinergic nucleotide receptor signaling pathway(GO:0035590) |
| 1.6 | 3.2 | GO:0016998 | cell wall macromolecule catabolic process(GO:0016998) |
| 1.6 | 17.8 | GO:0045662 | negative regulation of myoblast differentiation(GO:0045662) |
| 1.6 | 12.9 | GO:0033687 | osteoblast proliferation(GO:0033687) |
| 1.6 | 8.1 | GO:0035116 | embryonic hindlimb morphogenesis(GO:0035116) |
| 1.6 | 6.4 | GO:0051026 | chiasma assembly(GO:0051026) |
| 1.6 | 20.9 | GO:0033539 | fatty acid beta-oxidation using acyl-CoA dehydrogenase(GO:0033539) |
| 1.6 | 22.4 | GO:0071377 | cellular response to glucagon stimulus(GO:0071377) |
| 1.6 | 25.5 | GO:1902236 | negative regulation of endoplasmic reticulum stress-induced intrinsic apoptotic signaling pathway(GO:1902236) |
| 1.6 | 1.6 | GO:0002833 | positive regulation of response to biotic stimulus(GO:0002833) |
| 1.6 | 1.6 | GO:0021571 | rhombomere 5 development(GO:0021571) |
| 1.6 | 4.7 | GO:0045104 | intermediate filament cytoskeleton organization(GO:0045104) |
| 1.6 | 4.7 | GO:0048536 | spleen development(GO:0048536) |
| 1.6 | 4.7 | GO:0070131 | positive regulation of mitochondrial translation(GO:0070131) |
| 1.6 | 18.8 | GO:0002089 | lens morphogenesis in camera-type eye(GO:0002089) |
| 1.5 | 9.3 | GO:0060051 | negative regulation of protein ADP-ribosylation(GO:0010836) negative regulation of protein glycosylation(GO:0060051) |
| 1.5 | 9.2 | GO:0051189 | molybdopterin cofactor biosynthetic process(GO:0032324) molybdopterin cofactor metabolic process(GO:0043545) prosthetic group metabolic process(GO:0051189) |
| 1.5 | 15.3 | GO:0015012 | heparan sulfate proteoglycan biosynthetic process(GO:0015012) |
| 1.5 | 1.5 | GO:0032494 | response to peptidoglycan(GO:0032494) |
| 1.5 | 18.3 | GO:0033622 | integrin activation(GO:0033622) |
| 1.5 | 4.6 | GO:0030325 | adrenal gland development(GO:0030325) |
| 1.5 | 10.6 | GO:0010719 | negative regulation of epithelial to mesenchymal transition(GO:0010719) |
| 1.5 | 4.5 | GO:0071941 | nitrogen cycle metabolic process(GO:0071941) |
| 1.5 | 18.0 | GO:0002042 | cell migration involved in sprouting angiogenesis(GO:0002042) |
| 1.5 | 3.0 | GO:0006622 | protein targeting to lysosome(GO:0006622) |
| 1.5 | 4.5 | GO:0006020 | inositol metabolic process(GO:0006020) |
| 1.5 | 4.5 | GO:0009304 | tRNA transcription(GO:0009304) 5S class rRNA transcription from RNA polymerase III type 1 promoter(GO:0042791) tRNA transcription from RNA polymerase III promoter(GO:0042797) |
| 1.5 | 11.9 | GO:0048386 | positive regulation of retinoic acid receptor signaling pathway(GO:0048386) |
| 1.5 | 1.5 | GO:0033564 | anterior/posterior axon guidance(GO:0033564) |
| 1.5 | 5.9 | GO:0006880 | intracellular sequestering of iron ion(GO:0006880) sequestering of iron ion(GO:0097577) |
| 1.5 | 34.0 | GO:0003279 | cardiac septum development(GO:0003279) |
| 1.5 | 2.9 | GO:0051597 | response to methylmercury(GO:0051597) |
| 1.5 | 2.9 | GO:0002460 | adaptive immune response based on somatic recombination of immune receptors built from immunoglobulin superfamily domains(GO:0002460) |
| 1.5 | 4.4 | GO:0030311 | poly-N-acetyllactosamine metabolic process(GO:0030309) poly-N-acetyllactosamine biosynthetic process(GO:0030311) |
| 1.5 | 2.9 | GO:0032926 | negative regulation of activin receptor signaling pathway(GO:0032926) |
| 1.5 | 38.0 | GO:0009083 | branched-chain amino acid metabolic process(GO:0009081) branched-chain amino acid catabolic process(GO:0009083) |
| 1.5 | 10.2 | GO:0030166 | proteoglycan biosynthetic process(GO:0030166) |
| 1.5 | 4.4 | GO:0045919 | positive regulation of cytolysis(GO:0045919) |
| 1.5 | 27.6 | GO:0046597 | negative regulation of viral entry into host cell(GO:0046597) |
| 1.4 | 7.2 | GO:1902109 | negative regulation of mitochondrial membrane permeability involved in apoptotic process(GO:1902109) |
| 1.4 | 12.9 | GO:0045026 | plasma membrane fusion(GO:0045026) |
| 1.4 | 1.4 | GO:1903413 | cellular response to bile acid(GO:1903413) |
| 1.4 | 7.0 | GO:0006013 | mannose metabolic process(GO:0006013) |
| 1.4 | 1.4 | GO:0060708 | spongiotrophoblast differentiation(GO:0060708) |
| 1.4 | 1.4 | GO:0000393 | spliceosomal conformational changes to generate catalytic conformation(GO:0000393) |
| 1.4 | 26.4 | GO:0019369 | arachidonic acid metabolic process(GO:0019369) |
| 1.4 | 37.5 | GO:0001510 | RNA methylation(GO:0001510) |
| 1.4 | 70.6 | GO:0031338 | regulation of vesicle fusion(GO:0031338) |
| 1.4 | 2.8 | GO:0008063 | Toll signaling pathway(GO:0008063) |
| 1.4 | 2.7 | GO:0090136 | epithelial cell-cell adhesion(GO:0090136) |
| 1.3 | 1.3 | GO:0006335 | DNA replication-dependent nucleosome assembly(GO:0006335) DNA replication-dependent nucleosome organization(GO:0034723) |
| 1.3 | 10.8 | GO:0031018 | endocrine pancreas development(GO:0031018) |
| 1.3 | 10.7 | GO:0010499 | proteasomal ubiquitin-independent protein catabolic process(GO:0010499) |
| 1.3 | 1.3 | GO:0030259 | lipid glycosylation(GO:0030259) |
| 1.3 | 13.4 | GO:0019800 | peptide cross-linking via chondroitin 4-sulfate glycosaminoglycan(GO:0019800) |
| 1.3 | 10.7 | GO:0006682 | galactosylceramide biosynthetic process(GO:0006682) galactolipid biosynthetic process(GO:0019375) |
| 1.3 | 26.6 | GO:0048384 | retinoic acid receptor signaling pathway(GO:0048384) |
| 1.3 | 9.3 | GO:0009404 | toxin metabolic process(GO:0009404) |
| 1.3 | 15.9 | GO:0032720 | negative regulation of tumor necrosis factor production(GO:0032720) |
| 1.3 | 4.0 | GO:0010025 | wax biosynthetic process(GO:0010025) wax metabolic process(GO:0010166) |
| 1.3 | 1.3 | GO:0040034 | regulation of development, heterochronic(GO:0040034) regulation of timing of cell differentiation(GO:0048505) |
| 1.3 | 13.1 | GO:0034390 | smooth muscle cell apoptotic process(GO:0034390) regulation of smooth muscle cell apoptotic process(GO:0034391) positive regulation of smooth muscle cell apoptotic process(GO:0034393) |
| 1.3 | 5.2 | GO:0090200 | regulation of release of cytochrome c from mitochondria(GO:0090199) positive regulation of release of cytochrome c from mitochondria(GO:0090200) |
| 1.3 | 1.3 | GO:0032714 | negative regulation of interleukin-5 production(GO:0032714) |
| 1.3 | 11.7 | GO:0048635 | negative regulation of muscle organ development(GO:0048635) |
| 1.3 | 2.6 | GO:2001013 | epithelial cell proliferation involved in renal tubule morphogenesis(GO:2001013) |
| 1.3 | 3.9 | GO:0071351 | interleukin-18-mediated signaling pathway(GO:0035655) cellular response to interleukin-18(GO:0071351) |
| 1.3 | 15.5 | GO:0006516 | glycoprotein catabolic process(GO:0006516) |
| 1.3 | 2.6 | GO:0032906 | transforming growth factor beta2 production(GO:0032906) regulation of transforming growth factor beta2 production(GO:0032909) |
| 1.3 | 3.8 | GO:0060700 | regulation of ribonuclease activity(GO:0060700) |
| 1.3 | 11.5 | GO:0030277 | maintenance of gastrointestinal epithelium(GO:0030277) |
| 1.3 | 8.9 | GO:0040019 | positive regulation of embryonic development(GO:0040019) |
| 1.2 | 10.0 | GO:0097576 | vacuole fusion(GO:0097576) |
| 1.2 | 64.8 | GO:0006501 | C-terminal protein lipidation(GO:0006501) |
| 1.2 | 6.2 | GO:1901222 | regulation of NIK/NF-kappaB signaling(GO:1901222) |
| 1.2 | 12.4 | GO:0050770 | regulation of axonogenesis(GO:0050770) |
| 1.2 | 25.9 | GO:0021987 | cerebral cortex development(GO:0021987) |
| 1.2 | 18.4 | GO:0007193 | adenylate cyclase-inhibiting G-protein coupled receptor signaling pathway(GO:0007193) |
| 1.2 | 7.4 | GO:0048333 | mesodermal cell differentiation(GO:0048333) |
| 1.2 | 109.6 | GO:0070588 | calcium ion transmembrane transport(GO:0070588) |
| 1.2 | 6.1 | GO:0046968 | peptide antigen transport(GO:0046968) |
| 1.2 | 6.1 | GO:0006102 | isocitrate metabolic process(GO:0006102) |
| 1.2 | 1.2 | GO:0006565 | L-serine catabolic process(GO:0006565) |
| 1.2 | 7.2 | GO:0019368 | fatty acid elongation, saturated fatty acid(GO:0019367) fatty acid elongation, unsaturated fatty acid(GO:0019368) fatty acid elongation, monounsaturated fatty acid(GO:0034625) fatty acid elongation, polyunsaturated fatty acid(GO:0034626) |
| 1.2 | 3.6 | GO:0034154 | toll-like receptor 7 signaling pathway(GO:0034154) |
| 1.2 | 1.2 | GO:0001967 | suckling behavior(GO:0001967) |
| 1.2 | 3.6 | GO:0001759 | organ induction(GO:0001759) |
| 1.2 | 29.7 | GO:0007368 | determination of left/right symmetry(GO:0007368) |
| 1.2 | 9.5 | GO:0042723 | thiamine-containing compound metabolic process(GO:0042723) |
| 1.2 | 8.2 | GO:0006548 | histidine metabolic process(GO:0006547) histidine catabolic process(GO:0006548) imidazole-containing compound catabolic process(GO:0052805) |
| 1.2 | 5.8 | GO:0007617 | mating behavior(GO:0007617) multi-organism reproductive behavior(GO:0044705) |
| 1.2 | 1.2 | GO:1904294 | positive regulation of ERAD pathway(GO:1904294) |
| 1.2 | 3.5 | GO:0051710 | regulation of cytolysis in other organism(GO:0051710) |
| 1.2 | 4.6 | GO:0045657 | positive regulation of monocyte differentiation(GO:0045657) |
| 1.2 | 5.8 | GO:0030204 | chondroitin sulfate metabolic process(GO:0030204) |
| 1.1 | 4.6 | GO:0070627 | ferrous iron import(GO:0070627) |
| 1.1 | 11.5 | GO:0031033 | myosin filament organization(GO:0031033) |
| 1.1 | 6.9 | GO:0005513 | detection of calcium ion(GO:0005513) |
| 1.1 | 2.3 | GO:1904970 | brush border assembly(GO:1904970) |
| 1.1 | 3.4 | GO:0033313 | meiotic cell cycle checkpoint(GO:0033313) |
| 1.1 | 1.1 | GO:0003418 | growth plate cartilage chondrocyte differentiation(GO:0003418) |
| 1.1 | 2.2 | GO:0045348 | positive regulation of MHC class II biosynthetic process(GO:0045348) |
| 1.1 | 4.5 | GO:1902412 | regulation of mitotic cytokinesis(GO:1902412) |
| 1.1 | 1.1 | GO:0033684 | regulation of luteinizing hormone secretion(GO:0033684) |
| 1.1 | 3.3 | GO:0044804 | nucleophagy(GO:0044804) |
| 1.1 | 7.8 | GO:0061333 | renal tubule morphogenesis(GO:0061333) |
| 1.1 | 2.2 | GO:0060136 | embryonic process involved in female pregnancy(GO:0060136) |
| 1.1 | 4.4 | GO:0097089 | methyl-branched fatty acid metabolic process(GO:0097089) |
| 1.1 | 2.2 | GO:0006701 | progesterone biosynthetic process(GO:0006701) |
| 1.1 | 3.3 | GO:0034128 | negative regulation of MyD88-independent toll-like receptor signaling pathway(GO:0034128) |
| 1.1 | 12.0 | GO:0010863 | positive regulation of phospholipase C activity(GO:0010863) |
| 1.1 | 26.2 | GO:0050427 | purine ribonucleoside bisphosphate metabolic process(GO:0034035) 3'-phosphoadenosine 5'-phosphosulfate metabolic process(GO:0050427) |
| 1.1 | 1.1 | GO:0030222 | eosinophil differentiation(GO:0030222) |
| 1.1 | 4.3 | GO:0006067 | ethanol metabolic process(GO:0006067) ethanol catabolic process(GO:0006068) |
| 1.1 | 3.3 | GO:0006651 | diacylglycerol biosynthetic process(GO:0006651) |
| 1.1 | 10.8 | GO:0036035 | osteoclast development(GO:0036035) |
| 1.1 | 10.7 | GO:0070207 | protein homotrimerization(GO:0070207) |
| 1.1 | 3.2 | GO:0032330 | regulation of chondrocyte differentiation(GO:0032330) |
| 1.1 | 2.1 | GO:0006493 | protein O-linked glycosylation(GO:0006493) |
| 1.1 | 1.1 | GO:0036342 | post-anal tail morphogenesis(GO:0036342) |
| 1.1 | 2.1 | GO:0007171 | activation of transmembrane receptor protein tyrosine kinase activity(GO:0007171) |
| 1.1 | 7.5 | GO:0043691 | reverse cholesterol transport(GO:0043691) |
| 1.1 | 2.1 | GO:0007212 | dopamine receptor signaling pathway(GO:0007212) |
| 1.1 | 1.1 | GO:2000171 | negative regulation of dendrite development(GO:2000171) |
| 1.1 | 1.1 | GO:1902337 | mammary gland branching involved in pregnancy(GO:0060745) regulation of apoptotic process involved in morphogenesis(GO:1902337) regulation of apoptotic process involved in development(GO:1904748) |
| 1.0 | 1.0 | GO:0042938 | dipeptide transport(GO:0042938) |
| 1.0 | 2.1 | GO:0002088 | lens development in camera-type eye(GO:0002088) |
| 1.0 | 8.3 | GO:0002438 | acute inflammatory response to antigenic stimulus(GO:0002438) |
| 1.0 | 7.3 | GO:0031086 | nuclear-transcribed mRNA catabolic process, deadenylation-independent decay(GO:0031086) |
| 1.0 | 2.1 | GO:0045161 | neuronal ion channel clustering(GO:0045161) |
| 1.0 | 3.1 | GO:0001953 | negative regulation of cell-matrix adhesion(GO:0001953) |
| 1.0 | 10.2 | GO:0035136 | forelimb morphogenesis(GO:0035136) |
| 1.0 | 6.1 | GO:0030252 | growth hormone secretion(GO:0030252) |
| 1.0 | 10.1 | GO:0043401 | steroid hormone mediated signaling pathway(GO:0043401) |
| 1.0 | 15.1 | GO:0000186 | activation of MAPKK activity(GO:0000186) |
| 1.0 | 4.0 | GO:0018101 | protein citrullination(GO:0018101) histone citrullination(GO:0036414) |
| 1.0 | 4.0 | GO:0061025 | membrane fusion(GO:0061025) |
| 1.0 | 20.0 | GO:0097502 | mannosylation(GO:0097502) |
| 1.0 | 2.0 | GO:0034434 | steroid esterification(GO:0034433) sterol esterification(GO:0034434) cholesterol esterification(GO:0034435) |
| 1.0 | 10.9 | GO:0006030 | chitin metabolic process(GO:0006030) chitin catabolic process(GO:0006032) |
| 1.0 | 4.9 | GO:0045725 | positive regulation of glycogen biosynthetic process(GO:0045725) |
| 1.0 | 18.7 | GO:0010811 | positive regulation of cell-substrate adhesion(GO:0010811) |
| 1.0 | 28.6 | GO:0046329 | negative regulation of JNK cascade(GO:0046329) |
| 1.0 | 2.9 | GO:0046887 | positive regulation of hormone secretion(GO:0046887) |
| 1.0 | 1.0 | GO:0097119 | postsynaptic density protein 95 clustering(GO:0097119) |
| 1.0 | 5.8 | GO:0002759 | positive regulation of antimicrobial peptide production(GO:0002225) regulation of antimicrobial humoral response(GO:0002759) positive regulation of antimicrobial humoral response(GO:0002760) regulation of antimicrobial peptide production(GO:0002784) regulation of antibacterial peptide production(GO:0002786) positive regulation of antibacterial peptide production(GO:0002803) |
| 1.0 | 107.3 | GO:0006469 | negative regulation of protein kinase activity(GO:0006469) |
| 1.0 | 52.0 | GO:0071804 | cellular potassium ion transport(GO:0071804) potassium ion transmembrane transport(GO:0071805) |
| 1.0 | 8.6 | GO:0015747 | urate transport(GO:0015747) |
| 1.0 | 11.4 | GO:0070734 | histone H3-K27 methylation(GO:0070734) |
| 0.9 | 3.8 | GO:0000722 | telomere maintenance via recombination(GO:0000722) |
| 0.9 | 10.3 | GO:0030282 | bone mineralization(GO:0030282) |
| 0.9 | 2.8 | GO:0097359 | UDP-glucosylation(GO:0097359) |
| 0.9 | 0.9 | GO:0010935 | regulation of macrophage cytokine production(GO:0010935) |
| 0.9 | 6.5 | GO:0034063 | stress granule assembly(GO:0034063) |
| 0.9 | 6.5 | GO:0003073 | regulation of systemic arterial blood pressure(GO:0003073) |
| 0.9 | 16.6 | GO:0006957 | complement activation, alternative pathway(GO:0006957) |
| 0.9 | 23.0 | GO:0007565 | female pregnancy(GO:0007565) |
| 0.9 | 10.1 | GO:0030854 | positive regulation of granulocyte differentiation(GO:0030854) |
| 0.9 | 9.2 | GO:0051457 | maintenance of protein location in nucleus(GO:0051457) |
| 0.9 | 12.8 | GO:0006750 | glutathione biosynthetic process(GO:0006750) |
| 0.9 | 8.1 | GO:0042354 | fucose catabolic process(GO:0019317) L-fucose metabolic process(GO:0042354) L-fucose catabolic process(GO:0042355) |
| 0.9 | 13.5 | GO:0042340 | keratan sulfate catabolic process(GO:0042340) |
| 0.9 | 1.8 | GO:0001573 | ganglioside metabolic process(GO:0001573) |
| 0.9 | 1.8 | GO:0046777 | protein autophosphorylation(GO:0046777) |
| 0.9 | 3.5 | GO:1990253 | cellular response to leucine starvation(GO:1990253) |
| 0.9 | 4.4 | GO:0006824 | cobalt ion transport(GO:0006824) |
| 0.9 | 2.6 | GO:0030578 | PML body organization(GO:0030578) |
| 0.9 | 1.7 | GO:0001575 | globoside metabolic process(GO:0001575) |
| 0.9 | 17.2 | GO:0006636 | unsaturated fatty acid biosynthetic process(GO:0006636) |
| 0.9 | 11.2 | GO:0070306 | lens fiber cell differentiation(GO:0070306) |
| 0.9 | 6.0 | GO:0006700 | C21-steroid hormone biosynthetic process(GO:0006700) |
| 0.8 | 4.2 | GO:0090090 | negative regulation of canonical Wnt signaling pathway(GO:0090090) |
| 0.8 | 10.1 | GO:0010664 | negative regulation of striated muscle cell apoptotic process(GO:0010664) |
| 0.8 | 3.4 | GO:0045722 | positive regulation of gluconeogenesis(GO:0045722) |
| 0.8 | 1.7 | GO:0045359 | positive regulation of interferon-beta biosynthetic process(GO:0045359) |
| 0.8 | 4.2 | GO:0034058 | endosomal vesicle fusion(GO:0034058) |
| 0.8 | 0.8 | GO:0021670 | lateral ventricle development(GO:0021670) |
| 0.8 | 3.3 | GO:0044331 | cell-cell adhesion mediated by cadherin(GO:0044331) |
| 0.8 | 2.5 | GO:0034201 | response to oleic acid(GO:0034201) |
| 0.8 | 4.1 | GO:0006346 | methylation-dependent chromatin silencing(GO:0006346) |
| 0.8 | 6.5 | GO:0030050 | vesicle transport along actin filament(GO:0030050) |
| 0.8 | 12.9 | GO:0016338 | calcium-independent cell-cell adhesion via plasma membrane cell-adhesion molecules(GO:0016338) |
| 0.8 | 0.8 | GO:0035720 | intraciliary anterograde transport(GO:0035720) |
| 0.8 | 292.8 | GO:0043547 | positive regulation of GTPase activity(GO:0043547) |
| 0.8 | 3.2 | GO:0010761 | fibroblast migration(GO:0010761) |
| 0.8 | 4.0 | GO:0051601 | exocyst localization(GO:0051601) |
| 0.8 | 7.1 | GO:0030513 | positive regulation of BMP signaling pathway(GO:0030513) |
| 0.8 | 2.3 | GO:0003335 | corneocyte development(GO:0003335) |
| 0.8 | 13.9 | GO:0010862 | positive regulation of pathway-restricted SMAD protein phosphorylation(GO:0010862) |
| 0.8 | 9.2 | GO:0006706 | steroid catabolic process(GO:0006706) |
| 0.8 | 0.8 | GO:0010992 | ubiquitin homeostasis(GO:0010992) |
| 0.8 | 3.8 | GO:1990822 | basic amino acid transmembrane transport(GO:1990822) |
| 0.7 | 0.7 | GO:0060244 | negative regulation of cell proliferation involved in contact inhibition(GO:0060244) |
| 0.7 | 3.7 | GO:0007638 | mechanosensory behavior(GO:0007638) |
| 0.7 | 2.2 | GO:0051639 | actin filament network formation(GO:0051639) |
| 0.7 | 2.2 | GO:0031069 | hair follicle morphogenesis(GO:0031069) |
| 0.7 | 1.5 | GO:0048069 | eye pigmentation(GO:0048069) |
| 0.7 | 8.0 | GO:0048747 | muscle fiber development(GO:0048747) |
| 0.7 | 0.7 | GO:0010839 | negative regulation of keratinocyte proliferation(GO:0010839) |
| 0.7 | 3.6 | GO:0061668 | mitochondrial ribosome assembly(GO:0061668) mitochondrial large ribosomal subunit assembly(GO:1902775) |
| 0.7 | 5.0 | GO:0010543 | regulation of platelet activation(GO:0010543) |
| 0.7 | 4.3 | GO:0006972 | hyperosmotic response(GO:0006972) |
| 0.7 | 8.5 | GO:0016024 | CDP-diacylglycerol biosynthetic process(GO:0016024) |
| 0.7 | 0.7 | GO:0000098 | sulfur amino acid catabolic process(GO:0000098) |
| 0.7 | 15.5 | GO:0050913 | sensory perception of bitter taste(GO:0050913) |
| 0.7 | 8.4 | GO:0001829 | trophectodermal cell differentiation(GO:0001829) |
| 0.7 | 9.0 | GO:0043462 | regulation of ATPase activity(GO:0043462) |
| 0.7 | 0.7 | GO:0045829 | negative regulation of isotype switching(GO:0045829) |
| 0.7 | 61.7 | GO:0030449 | regulation of complement activation(GO:0030449) regulation of protein activation cascade(GO:2000257) |
| 0.7 | 5.5 | GO:0051926 | negative regulation of calcium ion transport(GO:0051926) |
| 0.7 | 1.4 | GO:0070863 | positive regulation of protein exit from endoplasmic reticulum(GO:0070863) |
| 0.7 | 1.3 | GO:1904528 | positive regulation of microtubule binding(GO:1904528) |
| 0.7 | 2.0 | GO:0046952 | ketone body catabolic process(GO:0046952) |
| 0.7 | 4.0 | GO:0036500 | ATF6-mediated unfolded protein response(GO:0036500) |
| 0.7 | 0.7 | GO:0048483 | autonomic nervous system development(GO:0048483) |
| 0.7 | 13.8 | GO:0007029 | endoplasmic reticulum organization(GO:0007029) |
| 0.7 | 1.3 | GO:0030223 | neutrophil differentiation(GO:0030223) |
| 0.6 | 1.9 | GO:2000096 | positive regulation of Wnt signaling pathway, planar cell polarity pathway(GO:2000096) |
| 0.6 | 2.6 | GO:0046348 | amino sugar catabolic process(GO:0046348) |
| 0.6 | 0.6 | GO:0006349 | regulation of gene expression by genetic imprinting(GO:0006349) |
| 0.6 | 2.6 | GO:0043517 | positive regulation of DNA damage response, signal transduction by p53 class mediator(GO:0043517) |
| 0.6 | 3.8 | GO:0032060 | bleb assembly(GO:0032060) |
| 0.6 | 3.2 | GO:1903441 | protein localization to ciliary membrane(GO:1903441) |
| 0.6 | 1.3 | GO:0045408 | regulation of interleukin-6 biosynthetic process(GO:0045408) |
| 0.6 | 1.2 | GO:0051127 | positive regulation of actin nucleation(GO:0051127) |
| 0.6 | 1.8 | GO:0048012 | hepatocyte growth factor receptor signaling pathway(GO:0048012) |
| 0.6 | 0.6 | GO:0043652 | engulfment of apoptotic cell(GO:0043652) |
| 0.6 | 2.4 | GO:0007431 | salivary gland development(GO:0007431) |
| 0.6 | 1.8 | GO:0036124 | histone H3-K9 trimethylation(GO:0036124) |
| 0.6 | 1.8 | GO:0048484 | enteric nervous system development(GO:0048484) |
| 0.6 | 4.1 | GO:0001867 | complement activation, lectin pathway(GO:0001867) |
| 0.6 | 9.2 | GO:0045667 | regulation of osteoblast differentiation(GO:0045667) |
| 0.6 | 8.6 | GO:0035303 | regulation of dephosphorylation(GO:0035303) |
| 0.6 | 1.1 | GO:0009409 | response to cold(GO:0009409) |
| 0.6 | 1.7 | GO:0048278 | vesicle docking(GO:0048278) |
| 0.6 | 7.9 | GO:0098754 | detoxification(GO:0098754) |
| 0.5 | 3.3 | GO:0050909 | sensory perception of taste(GO:0050909) |
| 0.5 | 1.1 | GO:0038163 | thrombopoietin-mediated signaling pathway(GO:0038163) |
| 0.5 | 1.1 | GO:2000508 | regulation of dendritic cell chemotaxis(GO:2000508) positive regulation of dendritic cell chemotaxis(GO:2000510) |
| 0.5 | 8.4 | GO:0035338 | long-chain fatty-acyl-CoA biosynthetic process(GO:0035338) |
| 0.5 | 7.3 | GO:0001505 | regulation of neurotransmitter levels(GO:0001505) |
| 0.5 | 4.2 | GO:0006692 | prostanoid metabolic process(GO:0006692) prostaglandin metabolic process(GO:0006693) |
| 0.5 | 2.6 | GO:0042733 | embryonic digit morphogenesis(GO:0042733) |
| 0.5 | 1.0 | GO:1900165 | negative regulation of interleukin-6 secretion(GO:1900165) |
| 0.5 | 0.5 | GO:0019249 | lactate biosynthetic process(GO:0019249) |
| 0.5 | 0.5 | GO:0043988 | histone H3-S28 phosphorylation(GO:0043988) |
| 0.5 | 1.0 | GO:0042551 | neuron maturation(GO:0042551) |
| 0.5 | 2.0 | GO:0010944 | negative regulation of transcription by competitive promoter binding(GO:0010944) |
| 0.5 | 1.4 | GO:0019605 | benzoate metabolic process(GO:0018874) butyrate metabolic process(GO:0019605) |
| 0.5 | 1.4 | GO:0002430 | complement receptor mediated signaling pathway(GO:0002430) |
| 0.5 | 0.5 | GO:0060711 | labyrinthine layer development(GO:0060711) |
| 0.5 | 5.0 | GO:0045599 | negative regulation of fat cell differentiation(GO:0045599) |
| 0.5 | 1.8 | GO:1903779 | regulation of cardiac conduction(GO:1903779) |
| 0.4 | 2.2 | GO:0006265 | DNA topological change(GO:0006265) |
| 0.4 | 0.4 | GO:0010040 | response to iron(II) ion(GO:0010040) |
| 0.4 | 0.4 | GO:1902603 | carnitine transmembrane transport(GO:1902603) |
| 0.4 | 0.4 | GO:0002644 | negative regulation of tolerance induction(GO:0002644) |
| 0.4 | 0.9 | GO:1901550 | regulation of endothelial cell development(GO:1901550) regulation of establishment of endothelial barrier(GO:1903140) |
| 0.4 | 2.1 | GO:0010886 | positive regulation of cholesterol storage(GO:0010886) |
| 0.4 | 0.4 | GO:0007635 | chemosensory behavior(GO:0007635) |
| 0.4 | 6.7 | GO:0008593 | regulation of Notch signaling pathway(GO:0008593) |
| 0.4 | 2.1 | GO:0072488 | ammonium transmembrane transport(GO:0072488) |
| 0.4 | 3.7 | GO:0045670 | regulation of osteoclast differentiation(GO:0045670) |
| 0.4 | 4.1 | GO:0030815 | negative regulation of cAMP metabolic process(GO:0030815) |
| 0.4 | 3.7 | GO:0050891 | multicellular organismal water homeostasis(GO:0050891) |
| 0.4 | 2.0 | GO:0050853 | B cell receptor signaling pathway(GO:0050853) |
| 0.4 | 0.8 | GO:0002778 | antimicrobial peptide production(GO:0002775) antibacterial peptide production(GO:0002778) |
| 0.4 | 2.3 | GO:2000158 | positive regulation of ubiquitin-specific protease activity(GO:2000158) |
| 0.4 | 1.5 | GO:1904706 | negative regulation of vascular smooth muscle cell proliferation(GO:1904706) |
| 0.4 | 1.9 | GO:0030889 | negative regulation of B cell proliferation(GO:0030889) |
| 0.4 | 0.8 | GO:0098543 | detection of bacterium(GO:0016045) detection of other organism(GO:0098543) detection of external biotic stimulus(GO:0098581) |
| 0.4 | 7.6 | GO:0034308 | primary alcohol metabolic process(GO:0034308) |
| 0.4 | 0.4 | GO:1903939 | regulation of TORC2 signaling(GO:1903939) |
| 0.4 | 1.4 | GO:0042983 | amyloid precursor protein biosynthetic process(GO:0042983) regulation of amyloid precursor protein biosynthetic process(GO:0042984) |
| 0.3 | 2.8 | GO:0046330 | positive regulation of JNK cascade(GO:0046330) |
| 0.3 | 1.3 | GO:0043152 | induction of bacterial agglutination(GO:0043152) |
| 0.3 | 1.6 | GO:0016926 | protein desumoylation(GO:0016926) |
| 0.3 | 1.0 | GO:0006835 | dicarboxylic acid transport(GO:0006835) |
| 0.3 | 0.6 | GO:0019935 | cyclic-nucleotide-mediated signaling(GO:0019935) |
| 0.3 | 2.2 | GO:1905097 | regulation of guanyl-nucleotide exchange factor activity(GO:1905097) |
| 0.3 | 0.6 | GO:0070932 | histone H3 deacetylation(GO:0070932) |
| 0.3 | 2.2 | GO:0008286 | insulin receptor signaling pathway(GO:0008286) |
| 0.3 | 3.1 | GO:0051480 | regulation of cytosolic calcium ion concentration(GO:0051480) |
| 0.3 | 0.9 | GO:0009106 | lipoate metabolic process(GO:0009106) |
| 0.3 | 2.7 | GO:0032780 | negative regulation of ATPase activity(GO:0032780) |
| 0.3 | 0.3 | GO:0071371 | cellular response to gonadotropin stimulus(GO:0071371) |
| 0.3 | 0.3 | GO:0035754 | B cell chemotaxis(GO:0035754) |
| 0.3 | 1.1 | GO:0008218 | bioluminescence(GO:0008218) |
| 0.3 | 5.9 | GO:0046323 | glucose import(GO:0046323) |
| 0.3 | 2.5 | GO:0006826 | iron ion transport(GO:0006826) |
| 0.3 | 1.1 | GO:0042531 | positive regulation of tyrosine phosphorylation of STAT protein(GO:0042531) |
| 0.3 | 0.6 | GO:0040036 | regulation of fibroblast growth factor receptor signaling pathway(GO:0040036) |
| 0.3 | 6.5 | GO:0001706 | endoderm formation(GO:0001706) |
| 0.3 | 0.3 | GO:0042116 | macrophage activation(GO:0042116) |
| 0.3 | 1.0 | GO:1901475 | pyruvate transport(GO:0006848) pyruvate transmembrane transport(GO:1901475) |
| 0.3 | 10.4 | GO:0006805 | xenobiotic metabolic process(GO:0006805) |
| 0.3 | 0.3 | GO:0051023 | regulation of immunoglobulin secretion(GO:0051023) |
| 0.2 | 1.4 | GO:2000189 | positive regulation of cholesterol homeostasis(GO:2000189) |
| 0.2 | 1.0 | GO:0071285 | cellular response to lithium ion(GO:0071285) |
| 0.2 | 0.9 | GO:0019852 | L-ascorbic acid metabolic process(GO:0019852) |
| 0.2 | 0.9 | GO:0007567 | parturition(GO:0007567) |
| 0.2 | 0.5 | GO:2000270 | negative regulation of fibroblast apoptotic process(GO:2000270) |
| 0.2 | 0.2 | GO:0070640 | vitamin D3 metabolic process(GO:0070640) |
| 0.2 | 1.1 | GO:0001881 | receptor recycling(GO:0001881) |
| 0.2 | 0.9 | GO:0002501 | peptide antigen assembly with MHC protein complex(GO:0002501) |
| 0.2 | 0.9 | GO:0072602 | interleukin-4 secretion(GO:0072602) |
| 0.2 | 0.2 | GO:0071609 | chemokine (C-C motif) ligand 5 production(GO:0071609) |
| 0.2 | 8.6 | GO:0010501 | RNA secondary structure unwinding(GO:0010501) |
| 0.2 | 1.3 | GO:0071715 | icosanoid transport(GO:0071715) fatty acid derivative transport(GO:1901571) |
| 0.2 | 21.4 | GO:0007156 | homophilic cell adhesion via plasma membrane adhesion molecules(GO:0007156) |
| 0.2 | 0.2 | GO:0007569 | cell aging(GO:0007569) |
| 0.2 | 1.2 | GO:0030101 | natural killer cell activation(GO:0030101) |
| 0.2 | 0.8 | GO:0032534 | regulation of microvillus assembly(GO:0032534) |
| 0.2 | 1.0 | GO:0034501 | protein localization to kinetochore(GO:0034501) |
| 0.2 | 1.0 | GO:0021563 | glossopharyngeal nerve development(GO:0021563) |
| 0.2 | 1.0 | GO:0045903 | positive regulation of translational fidelity(GO:0045903) |
| 0.2 | 3.5 | GO:0016339 | calcium-dependent cell-cell adhesion via plasma membrane cell adhesion molecules(GO:0016339) |
| 0.2 | 0.2 | GO:0007405 | neuroblast proliferation(GO:0007405) |
| 0.2 | 1.1 | GO:0009068 | aspartate family amino acid catabolic process(GO:0009068) |
| 0.2 | 0.4 | GO:1901654 | response to ketone(GO:1901654) |
| 0.2 | 0.3 | GO:1903800 | regulation of production of small RNA involved in gene silencing by RNA(GO:0070920) regulation of production of miRNAs involved in gene silencing by miRNA(GO:1903798) positive regulation of production of miRNAs involved in gene silencing by miRNA(GO:1903800) |
| 0.2 | 0.3 | GO:1904037 | positive regulation of epithelial cell apoptotic process(GO:1904037) |
| 0.2 | 0.3 | GO:0048771 | tissue remodeling(GO:0048771) |
| 0.2 | 1.6 | GO:0006942 | regulation of striated muscle contraction(GO:0006942) |
| 0.2 | 0.2 | GO:0070673 | response to interleukin-18(GO:0070673) |
| 0.2 | 0.2 | GO:0048539 | bone marrow development(GO:0048539) |
| 0.2 | 0.6 | GO:1901838 | transcription of nuclear large rRNA transcript from RNA polymerase I promoter(GO:0042790) regulation of transcription of nuclear large rRNA transcript from RNA polymerase I promoter(GO:1901836) positive regulation of transcription of nuclear large rRNA transcript from RNA polymerase I promoter(GO:1901838) |
| 0.2 | 0.6 | GO:0072348 | sulfur compound transport(GO:0072348) |
| 0.1 | 0.7 | GO:0072540 | T-helper 17 cell lineage commitment(GO:0072540) |
| 0.1 | 0.1 | GO:2001223 | negative regulation of neuron migration(GO:2001223) |
| 0.1 | 1.9 | GO:0003334 | keratinocyte development(GO:0003334) |
| 0.1 | 0.3 | GO:1904350 | regulation of protein catabolic process in the vacuole(GO:1904350) positive regulation of protein catabolic process in the vacuole(GO:1904352) |
| 0.1 | 0.9 | GO:0007000 | nucleolus organization(GO:0007000) |
| 0.1 | 0.1 | GO:1903903 | regulation of establishment of T cell polarity(GO:1903903) |
| 0.1 | 0.2 | GO:0002347 | response to tumor cell(GO:0002347) |
| 0.1 | 0.2 | GO:0045742 | positive regulation of epidermal growth factor receptor signaling pathway(GO:0045742) |
| 0.1 | 0.3 | GO:0051001 | negative regulation of nitric-oxide synthase activity(GO:0051001) |
| 0.1 | 0.1 | GO:0002076 | osteoblast development(GO:0002076) |
| 0.1 | 0.2 | GO:0034311 | sphingosine metabolic process(GO:0006670) diol metabolic process(GO:0034311) |
| 0.1 | 2.4 | GO:0007586 | digestion(GO:0007586) |
| 0.1 | 0.2 | GO:0003199 | endocardial cushion to mesenchymal transition involved in heart valve formation(GO:0003199) |
| 0.1 | 0.7 | GO:0036481 | intrinsic apoptotic signaling pathway in response to hydrogen peroxide(GO:0036481) |
| 0.1 | 0.1 | GO:0031122 | cytoplasmic microtubule organization(GO:0031122) |
| 0.1 | 0.4 | GO:0051552 | flavone metabolic process(GO:0051552) |
| 0.1 | 0.2 | GO:0032516 | positive regulation of phosphoprotein phosphatase activity(GO:0032516) |
| 0.1 | 0.3 | GO:0051924 | regulation of calcium ion transport(GO:0051924) |
| 0.1 | 0.5 | GO:0018879 | biphenyl metabolic process(GO:0018879) |
| 0.1 | 0.4 | GO:0072538 | T-helper 17 type immune response(GO:0072538) T-helper 17 cell differentiation(GO:0072539) |
| 0.1 | 0.6 | GO:0051491 | positive regulation of filopodium assembly(GO:0051491) |
| 0.1 | 0.2 | GO:0016264 | gap junction assembly(GO:0016264) |
| 0.1 | 0.3 | GO:0001180 | transcription initiation from RNA polymerase I promoter for nuclear large rRNA transcript(GO:0001180) RNA polymerase I transcriptional preinitiation complex assembly(GO:0001188) RNA polymerase I transcriptional preinitiation complex assembly at the promoter for the nuclear large rRNA transcript(GO:0001189) |
| 0.1 | 0.3 | GO:2000811 | negative regulation of anoikis(GO:2000811) |
| 0.1 | 0.8 | GO:0007223 | Wnt signaling pathway, calcium modulating pathway(GO:0007223) |
| 0.1 | 0.4 | GO:0010762 | regulation of fibroblast migration(GO:0010762) |
| 0.1 | 0.2 | GO:0034260 | negative regulation of GTPase activity(GO:0034260) |
| 0.1 | 0.3 | GO:0097178 | ruffle assembly(GO:0097178) |
| 0.1 | 0.3 | GO:2000574 | regulation of microtubule motor activity(GO:2000574) |
| 0.1 | 2.8 | GO:0050911 | detection of chemical stimulus involved in sensory perception of smell(GO:0050911) |
| 0.0 | 0.2 | GO:0036438 | maintenance of lens transparency(GO:0036438) |
| 0.0 | 0.1 | GO:0033147 | negative regulation of intracellular estrogen receptor signaling pathway(GO:0033147) |
| 0.0 | 0.9 | GO:0007187 | G-protein coupled receptor signaling pathway, coupled to cyclic nucleotide second messenger(GO:0007187) |
| 0.0 | 0.1 | GO:0002673 | regulation of acute inflammatory response(GO:0002673) |
| 0.0 | 0.3 | GO:0033141 | positive regulation of peptidyl-serine phosphorylation of STAT protein(GO:0033141) |
| 0.0 | 0.3 | GO:0048706 | embryonic skeletal system development(GO:0048706) |
| 0.0 | 0.1 | GO:0042461 | photoreceptor cell development(GO:0042461) |
Gene overrepresentation in cellular_component category:
| Log-likelihood per target | Total log-likelihood | Term | Description |
|---|---|---|---|
| 34.5 | 103.5 | GO:0038039 | G-protein coupled receptor heterodimeric complex(GO:0038039) |
| 33.3 | 133.1 | GO:0070032 | synaptobrevin 2-SNAP-25-syntaxin-1a-complexin I complex(GO:0070032) |
| 32.3 | 129.4 | GO:0031838 | haptoglobin-hemoglobin complex(GO:0031838) |
| 26.8 | 26.8 | GO:0019034 | viral replication complex(GO:0019034) |
| 23.6 | 70.7 | GO:0034365 | discoidal high-density lipoprotein particle(GO:0034365) |
| 21.0 | 126.2 | GO:0060199 | clathrin-sculpted glutamate transport vesicle(GO:0060199) clathrin-sculpted glutamate transport vesicle membrane(GO:0060203) |
| 20.9 | 83.7 | GO:0048787 | presynaptic active zone membrane(GO:0048787) |
| 19.3 | 57.9 | GO:0060053 | neurofilament cytoskeleton(GO:0060053) |
| 19.1 | 76.4 | GO:0070695 | FHF complex(GO:0070695) |
| 18.5 | 222.2 | GO:0044327 | dendritic spine head(GO:0044327) |
| 17.4 | 139.2 | GO:0005672 | transcription factor TFIIA complex(GO:0005672) |
| 17.3 | 69.2 | GO:0043293 | apoptosome(GO:0043293) |
| 17.2 | 17.2 | GO:0000145 | exocyst(GO:0000145) |
| 16.3 | 81.5 | GO:0043194 | axon initial segment(GO:0043194) |
| 16.1 | 32.2 | GO:0014802 | terminal cisterna(GO:0014802) |
| 15.4 | 77.1 | GO:1990761 | growth cone lamellipodium(GO:1990761) |
| 14.9 | 14.9 | GO:0070044 | synaptobrevin 2-SNAP-25-syntaxin-1a complex(GO:0070044) |
| 14.9 | 44.8 | GO:0097058 | CRLF-CLCF1 complex(GO:0097058) |
| 14.6 | 14.6 | GO:0016342 | catenin complex(GO:0016342) |
| 14.1 | 98.6 | GO:0072487 | MSL complex(GO:0072487) |
| 13.5 | 40.6 | GO:0008282 | ATP-sensitive potassium channel complex(GO:0008282) |
| 13.2 | 52.9 | GO:0045160 | myosin I complex(GO:0045160) |
| 13.1 | 248.4 | GO:0032591 | dendritic spine membrane(GO:0032591) |
| 12.7 | 50.7 | GO:0016533 | cyclin-dependent protein kinase 5 holoenzyme complex(GO:0016533) |
| 12.5 | 50.2 | GO:0030914 | STAGA complex(GO:0030914) |
| 12.5 | 275.5 | GO:0032809 | neuronal cell body membrane(GO:0032809) cell body membrane(GO:0044298) |
| 12.4 | 49.8 | GO:0031673 | H zone(GO:0031673) |
| 12.3 | 36.9 | GO:0097489 | multivesicular body, internal vesicle lumen(GO:0097489) |
| 12.2 | 48.8 | GO:0000333 | telomerase catalytic core complex(GO:0000333) |
| 12.1 | 72.3 | GO:0000138 | Golgi trans cisterna(GO:0000138) |
| 12.0 | 131.7 | GO:0033391 | chromatoid body(GO:0033391) |
| 11.9 | 71.5 | GO:0070775 | H3 histone acetyltransferase complex(GO:0070775) MOZ/MORF histone acetyltransferase complex(GO:0070776) |
| 11.7 | 35.0 | GO:0005652 | nuclear lamina(GO:0005652) |
| 11.7 | 46.6 | GO:0098843 | postsynaptic endocytic zone(GO:0098843) |
| 11.6 | 208.1 | GO:0097386 | glial cell projection(GO:0097386) |
| 11.5 | 321.9 | GO:0033268 | node of Ranvier(GO:0033268) |
| 11.5 | 34.4 | GO:0016938 | kinesin I complex(GO:0016938) |
| 11.3 | 45.4 | GO:0034673 | inhibin-betaglycan-ActRII complex(GO:0034673) |
| 11.3 | 56.3 | GO:0045298 | tubulin complex(GO:0045298) |
| 11.2 | 56.2 | GO:0036128 | CatSper complex(GO:0036128) |
| 11.2 | 44.9 | GO:0031302 | intrinsic component of endosome membrane(GO:0031302) |
| 11.1 | 110.8 | GO:0071953 | elastic fiber(GO:0071953) |
| 11.0 | 32.9 | GO:0097453 | mesaxon(GO:0097453) ensheathing process(GO:1990015) |
| 10.8 | 10.8 | GO:0060201 | clathrin-sculpted acetylcholine transport vesicle(GO:0060200) clathrin-sculpted acetylcholine transport vesicle membrane(GO:0060201) |
| 10.7 | 138.5 | GO:1990454 | L-type voltage-gated calcium channel complex(GO:1990454) |
| 10.6 | 31.8 | GO:0044423 | virion(GO:0019012) virion part(GO:0044423) |
| 10.5 | 31.6 | GO:0072534 | perineuronal net(GO:0072534) |
| 10.5 | 63.2 | GO:0030991 | intraciliary transport particle A(GO:0030991) |
| 10.5 | 52.6 | GO:0031256 | leading edge membrane(GO:0031256) |
| 10.4 | 62.4 | GO:0005927 | muscle tendon junction(GO:0005927) |
| 10.4 | 166.4 | GO:0097512 | cardiac myofibril(GO:0097512) |
| 10.3 | 257.1 | GO:0008074 | guanylate cyclase complex, soluble(GO:0008074) |
| 10.2 | 61.3 | GO:0033269 | internode region of axon(GO:0033269) |
| 10.1 | 181.8 | GO:0031235 | intrinsic component of the cytoplasmic side of the plasma membrane(GO:0031235) |
| 10.0 | 320.7 | GO:0005891 | voltage-gated calcium channel complex(GO:0005891) |
| 9.8 | 98.0 | GO:0097427 | microtubule bundle(GO:0097427) |
| 9.8 | 39.0 | GO:0032144 | 4-aminobutyrate transaminase complex(GO:0032144) |
| 9.4 | 131.0 | GO:0035102 | PRC1 complex(GO:0035102) |
| 9.3 | 27.8 | GO:0044354 | pinosome(GO:0044352) macropinosome(GO:0044354) |
| 9.2 | 64.4 | GO:0036021 | endolysosome lumen(GO:0036021) |
| 9.1 | 72.6 | GO:0098845 | postsynaptic endosome(GO:0098845) |
| 9.0 | 81.4 | GO:0030868 | smooth endoplasmic reticulum membrane(GO:0030868) smooth endoplasmic reticulum part(GO:0097425) |
| 9.0 | 27.1 | GO:0034991 | nuclear meiotic cohesin complex(GO:0034991) |
| 9.0 | 116.6 | GO:0097418 | neurofibrillary tangle(GO:0097418) |
| 8.9 | 733.0 | GO:0030672 | synaptic vesicle membrane(GO:0030672) exocytic vesicle membrane(GO:0099501) |
| 8.9 | 26.7 | GO:0030893 | meiotic cohesin complex(GO:0030893) |
| 8.8 | 70.6 | GO:0035253 | ciliary rootlet(GO:0035253) |
| 8.8 | 35.3 | GO:0097224 | sperm connecting piece(GO:0097224) |
| 8.7 | 70.0 | GO:0044294 | dendritic growth cone(GO:0044294) |
| 8.6 | 69.1 | GO:0033270 | paranode region of axon(GO:0033270) |
| 8.6 | 34.5 | GO:0005899 | insulin receptor complex(GO:0005899) |
| 8.4 | 33.5 | GO:0030485 | smooth muscle contractile fiber(GO:0030485) |
| 8.3 | 16.7 | GO:0005883 | neurofilament(GO:0005883) |
| 8.3 | 74.9 | GO:0016013 | syntrophin complex(GO:0016013) |
| 8.3 | 33.1 | GO:0035749 | myelin sheath adaxonal region(GO:0035749) |
| 8.2 | 427.2 | GO:0033017 | sarcoplasmic reticulum membrane(GO:0033017) |
| 8.1 | 24.4 | GO:0010370 | perinucleolar chromocenter(GO:0010370) |
| 8.1 | 24.3 | GO:0036398 | TCR signalosome(GO:0036398) |
| 8.1 | 48.5 | GO:1990130 | Iml1 complex(GO:1990130) |
| 8.1 | 40.3 | GO:0000137 | Golgi cis cisterna(GO:0000137) |
| 7.9 | 39.4 | GO:0030130 | clathrin coat of trans-Golgi network vesicle(GO:0030130) |
| 7.9 | 7.9 | GO:0070110 | ciliary neurotrophic factor receptor complex(GO:0070110) |
| 7.8 | 54.6 | GO:1903439 | calcitonin family receptor complex(GO:1903439) amylin receptor complex(GO:1903440) |
| 7.7 | 46.2 | GO:0031232 | extrinsic component of external side of plasma membrane(GO:0031232) |
| 7.7 | 115.5 | GO:0044295 | axonal growth cone(GO:0044295) |
| 7.6 | 15.2 | GO:0097059 | CNTFR-CLCF1 complex(GO:0097059) |
| 7.5 | 14.9 | GO:0032421 | stereocilium(GO:0032420) stereocilium bundle(GO:0032421) |
| 7.4 | 272.5 | GO:0048786 | presynaptic active zone(GO:0048786) |
| 7.3 | 43.7 | GO:0097443 | sorting endosome(GO:0097443) |
| 7.2 | 65.0 | GO:0043203 | axon hillock(GO:0043203) |
| 7.2 | 21.5 | GO:0002945 | cyclin K-CDK13 complex(GO:0002945) |
| 7.1 | 21.4 | GO:0071020 | post-spliceosomal complex(GO:0071020) |
| 7.0 | 126.3 | GO:0005890 | sodium:potassium-exchanging ATPase complex(GO:0005890) |
| 7.0 | 21.0 | GO:0097123 | cyclin A1-CDK2 complex(GO:0097123) |
| 7.0 | 48.7 | GO:0043240 | Fanconi anaemia nuclear complex(GO:0043240) |
| 7.0 | 278.1 | GO:0097546 | ciliary base(GO:0097546) |
| 6.8 | 13.7 | GO:0000125 | PCAF complex(GO:0000125) |
| 6.8 | 27.4 | GO:1990604 | IRE1-TRAF2-ASK1 complex(GO:1990604) |
| 6.8 | 6.8 | GO:0002139 | stereocilia coupling link(GO:0002139) |
| 6.7 | 20.1 | GO:0031233 | intrinsic component of external side of plasma membrane(GO:0031233) |
| 6.5 | 19.6 | GO:0098536 | deuterosome(GO:0098536) |
| 6.5 | 71.1 | GO:0031362 | anchored component of external side of plasma membrane(GO:0031362) |
| 6.4 | 19.3 | GO:0000308 | cytoplasmic cyclin-dependent protein kinase holoenzyme complex(GO:0000308) |
| 6.4 | 12.8 | GO:0033010 | paranodal junction(GO:0033010) |
| 6.4 | 19.2 | GO:0097440 | apical dendrite(GO:0097440) |
| 6.3 | 38.0 | GO:0065010 | extracellular membrane-bounded organelle(GO:0065010) |
| 6.3 | 44.2 | GO:0000813 | ESCRT I complex(GO:0000813) |
| 6.3 | 44.1 | GO:0060077 | inhibitory synapse(GO:0060077) |
| 6.2 | 93.6 | GO:0030877 | beta-catenin destruction complex(GO:0030877) |
| 6.2 | 68.1 | GO:0031045 | dense core granule(GO:0031045) |
| 6.1 | 18.3 | GO:0044609 | DBIRD complex(GO:0044609) |
| 6.1 | 6.1 | GO:0090498 | extrinsic component of Golgi membrane(GO:0090498) |
| 6.1 | 48.4 | GO:0005593 | FACIT collagen trimer(GO:0005593) |
| 6.0 | 603.7 | GO:0034705 | voltage-gated potassium channel complex(GO:0008076) potassium channel complex(GO:0034705) |
| 6.0 | 17.9 | GO:0034686 | integrin alphav-beta8 complex(GO:0034686) |
| 5.9 | 11.8 | GO:0035189 | Rb-E2F complex(GO:0035189) |
| 5.9 | 64.4 | GO:0002116 | semaphorin receptor complex(GO:0002116) |
| 5.8 | 104.9 | GO:0043218 | compact myelin(GO:0043218) |
| 5.8 | 11.5 | GO:0044308 | axonal spine(GO:0044308) |
| 5.7 | 22.7 | GO:0033596 | TSC1-TSC2 complex(GO:0033596) |
| 5.7 | 67.9 | GO:0005583 | fibrillar collagen trimer(GO:0005583) banded collagen fibril(GO:0098643) |
| 5.6 | 62.0 | GO:0034993 | microtubule organizing center attachment site(GO:0034992) LINC complex(GO:0034993) |
| 5.6 | 28.1 | GO:0036038 | MKS complex(GO:0036038) |
| 5.6 | 5.6 | GO:0043291 | RAVE complex(GO:0043291) |
| 5.5 | 302.3 | GO:0042734 | presynaptic membrane(GO:0042734) |
| 5.5 | 21.9 | GO:0042583 | chromaffin granule(GO:0042583) |
| 5.5 | 109.0 | GO:0032839 | dendrite cytoplasm(GO:0032839) |
| 5.4 | 70.8 | GO:0031209 | SCAR complex(GO:0031209) |
| 5.4 | 65.2 | GO:0043190 | ATP-binding cassette (ABC) transporter complex(GO:0043190) |
| 5.4 | 32.5 | GO:0009331 | glycerol-3-phosphate dehydrogenase complex(GO:0009331) |
| 5.4 | 27.1 | GO:0030061 | mitochondrial crista(GO:0030061) |
| 5.4 | 70.2 | GO:0043083 | synaptic cleft(GO:0043083) |
| 5.4 | 156.2 | GO:0001917 | photoreceptor inner segment(GO:0001917) |
| 5.4 | 37.7 | GO:0044300 | cerebellar mossy fiber(GO:0044300) |
| 5.3 | 42.7 | GO:0097208 | alveolar lamellar body(GO:0097208) |
| 5.3 | 5.3 | GO:0034666 | integrin alpha2-beta1 complex(GO:0034666) |
| 5.2 | 20.8 | GO:0097165 | nuclear stress granule(GO:0097165) |
| 5.2 | 15.5 | GO:0016935 | glycine-gated chloride channel complex(GO:0016935) |
| 5.1 | 303.6 | GO:0043195 | terminal bouton(GO:0043195) |
| 5.0 | 450.3 | GO:0005604 | basement membrane(GO:0005604) |
| 5.0 | 5.0 | GO:1990851 | Wnt-Frizzled-LRP5/6 complex(GO:1990851) |
| 4.9 | 14.8 | GO:0060187 | cell pole(GO:0060187) |
| 4.8 | 459.3 | GO:0043204 | perikaryon(GO:0043204) |
| 4.8 | 19.0 | GO:1990578 | perinuclear endoplasmic reticulum membrane(GO:1990578) |
| 4.7 | 4.7 | GO:0032593 | insulin-responsive compartment(GO:0032593) |
| 4.6 | 32.2 | GO:0070382 | exocytic vesicle(GO:0070382) |
| 4.6 | 22.8 | GO:0034451 | centriolar satellite(GO:0034451) |
| 4.5 | 40.5 | GO:0005955 | calcineurin complex(GO:0005955) |
| 4.5 | 45.0 | GO:0045180 | basal cortex(GO:0045180) |
| 4.5 | 75.9 | GO:0046658 | anchored component of plasma membrane(GO:0046658) |
| 4.5 | 66.8 | GO:0031083 | BLOC-1 complex(GO:0031083) |
| 4.4 | 39.9 | GO:0000220 | vacuolar proton-transporting V-type ATPase, V0 domain(GO:0000220) |
| 4.3 | 13.0 | GO:0099634 | postsynaptic specialization membrane(GO:0099634) |
| 4.3 | 159.4 | GO:0030173 | integral component of Golgi membrane(GO:0030173) |
| 4.3 | 55.9 | GO:0030478 | actin cap(GO:0030478) |
| 4.3 | 290.0 | GO:0005905 | clathrin-coated pit(GO:0005905) |
| 4.2 | 46.1 | GO:0030119 | AP-type membrane coat adaptor complex(GO:0030119) |
| 4.2 | 8.4 | GO:0071062 | alphav-beta3 integrin-vitronectin complex(GO:0071062) |
| 4.2 | 8.3 | GO:0034657 | GID complex(GO:0034657) |
| 4.2 | 41.6 | GO:0030123 | AP-3 adaptor complex(GO:0030123) |
| 4.1 | 16.6 | GO:1990745 | EARP complex(GO:1990745) |
| 4.1 | 844.6 | GO:0060076 | excitatory synapse(GO:0060076) |
| 4.1 | 24.7 | GO:0033061 | DNA recombinase mediator complex(GO:0033061) Rad51B-Rad51C-Rad51D-XRCC2 complex(GO:0033063) |
| 4.1 | 28.8 | GO:0000421 | autophagosome membrane(GO:0000421) |
| 4.1 | 16.4 | GO:0097129 | cyclin D2-CDK4 complex(GO:0097129) |
| 4.1 | 16.4 | GO:0072687 | meiotic spindle(GO:0072687) |
| 4.1 | 24.5 | GO:0070022 | transforming growth factor beta receptor homodimeric complex(GO:0070022) |
| 4.1 | 56.8 | GO:0031588 | nucleotide-activated protein kinase complex(GO:0031588) |
| 4.0 | 20.1 | GO:1990909 | Wnt signalosome(GO:1990909) |
| 4.0 | 23.9 | GO:0016461 | unconventional myosin complex(GO:0016461) |
| 4.0 | 7.9 | GO:0098592 | cytoplasmic side of apical plasma membrane(GO:0098592) |
| 4.0 | 31.6 | GO:0030133 | transport vesicle(GO:0030133) |
| 3.9 | 11.7 | GO:0031251 | PAN complex(GO:0031251) |
| 3.8 | 19.1 | GO:0070847 | core mediator complex(GO:0070847) |
| 3.8 | 94.6 | GO:1902710 | GABA receptor complex(GO:1902710) |
| 3.7 | 44.9 | GO:0032045 | guanyl-nucleotide exchange factor complex(GO:0032045) |
| 3.7 | 29.6 | GO:0090576 | RNA polymerase III transcription factor complex(GO:0090576) |
| 3.7 | 3.7 | GO:1990589 | ATF4-CREB1 transcription factor complex(GO:1990589) |
| 3.7 | 32.9 | GO:0042622 | photoreceptor outer segment membrane(GO:0042622) |
| 3.6 | 21.8 | GO:0032444 | activin responsive factor complex(GO:0032444) |
| 3.6 | 18.1 | GO:0097227 | sperm annulus(GO:0097227) |
| 3.6 | 18.1 | GO:0005602 | complement component C1 complex(GO:0005602) |
| 3.5 | 173.9 | GO:0005834 | heterotrimeric G-protein complex(GO:0005834) |
| 3.5 | 13.9 | GO:0060091 | kinocilium(GO:0060091) |
| 3.5 | 31.1 | GO:0001518 | voltage-gated sodium channel complex(GO:0001518) |
| 3.4 | 27.3 | GO:0008024 | cyclin/CDK positive transcription elongation factor complex(GO:0008024) |
| 3.4 | 367.9 | GO:0098793 | presynapse(GO:0098793) |
| 3.4 | 17.0 | GO:0005947 | mitochondrial alpha-ketoglutarate dehydrogenase complex(GO:0005947) |
| 3.4 | 10.1 | GO:0017119 | Golgi transport complex(GO:0017119) |
| 3.4 | 10.1 | GO:0031515 | tRNA (m1A) methyltransferase complex(GO:0031515) |
| 3.3 | 16.7 | GO:0008275 | gamma-tubulin small complex(GO:0008275) |
| 3.3 | 33.2 | GO:0000800 | lateral element(GO:0000800) |
| 3.3 | 314.2 | GO:0005814 | centriole(GO:0005814) |
| 3.3 | 144.4 | GO:0045334 | clathrin-coated endocytic vesicle(GO:0045334) |
| 3.3 | 144.4 | GO:0036064 | ciliary basal body(GO:0036064) |
| 3.3 | 29.3 | GO:0005964 | phosphorylase kinase complex(GO:0005964) |
| 3.2 | 22.5 | GO:0001520 | outer dense fiber(GO:0001520) |
| 3.1 | 18.9 | GO:1990682 | CSF1-CSF1R complex(GO:1990682) |
| 3.1 | 34.4 | GO:0016471 | vacuolar proton-transporting V-type ATPase complex(GO:0016471) |
| 3.1 | 12.4 | GO:0014731 | spectrin-associated cytoskeleton(GO:0014731) |
| 3.1 | 27.8 | GO:0032281 | AMPA glutamate receptor complex(GO:0032281) |
| 3.1 | 67.4 | GO:0042627 | chylomicron(GO:0042627) |
| 3.1 | 320.7 | GO:0005796 | Golgi lumen(GO:0005796) |
| 3.0 | 9.0 | GO:0032584 | growth cone membrane(GO:0032584) |
| 3.0 | 48.1 | GO:0031527 | filopodium membrane(GO:0031527) |
| 3.0 | 6.0 | GO:0071546 | pi-body(GO:0071546) |
| 3.0 | 157.6 | GO:0005581 | collagen trimer(GO:0005581) |
| 3.0 | 29.7 | GO:0036454 | insulin-like growth factor binding protein complex(GO:0016942) growth factor complex(GO:0036454) |
| 3.0 | 53.2 | GO:0005922 | connexon complex(GO:0005922) |
| 2.9 | 8.8 | GO:1990622 | CHOP-ATF3 complex(GO:1990622) |
| 2.9 | 8.8 | GO:0000806 | Y chromosome(GO:0000806) |
| 2.9 | 105.0 | GO:0001750 | photoreceptor outer segment(GO:0001750) |
| 2.9 | 14.5 | GO:0042406 | extrinsic component of endoplasmic reticulum membrane(GO:0042406) |
| 2.9 | 8.7 | GO:0014704 | intercalated disc(GO:0014704) |
| 2.9 | 14.4 | GO:0097513 | myosin II filament(GO:0097513) |
| 2.9 | 25.7 | GO:0008091 | spectrin(GO:0008091) |
| 2.9 | 2.9 | GO:0005953 | CAAX-protein geranylgeranyltransferase complex(GO:0005953) |
| 2.8 | 48.0 | GO:0097225 | sperm midpiece(GO:0097225) |
| 2.8 | 365.6 | GO:0055037 | recycling endosome(GO:0055037) |
| 2.7 | 8.1 | GO:0000818 | nuclear MIS12/MIND complex(GO:0000818) |
| 2.7 | 248.3 | GO:0032587 | ruffle membrane(GO:0032587) |
| 2.7 | 21.5 | GO:0036157 | outer dynein arm(GO:0036157) |
| 2.7 | 16.0 | GO:0005858 | axonemal dynein complex(GO:0005858) |
| 2.6 | 12.9 | GO:0005945 | 6-phosphofructokinase complex(GO:0005945) |
| 2.6 | 25.6 | GO:0042599 | lamellar body(GO:0042599) |
| 2.6 | 551.4 | GO:0016323 | basolateral plasma membrane(GO:0016323) |
| 2.5 | 34.9 | GO:0043679 | axon terminus(GO:0043679) |
| 2.5 | 17.3 | GO:0005827 | polar microtubule(GO:0005827) |
| 2.5 | 29.4 | GO:0044232 | organelle membrane contact site(GO:0044232) |
| 2.4 | 19.6 | GO:0031462 | Cul2-RING ubiquitin ligase complex(GO:0031462) |
| 2.4 | 7.2 | GO:0019008 | molybdopterin synthase complex(GO:0019008) |
| 2.4 | 113.1 | GO:0016324 | apical plasma membrane(GO:0016324) |
| 2.4 | 40.4 | GO:0043198 | dendritic shaft(GO:0043198) |
| 2.3 | 16.2 | GO:0005854 | nascent polypeptide-associated complex(GO:0005854) |
| 2.3 | 219.9 | GO:0030426 | growth cone(GO:0030426) |
| 2.3 | 48.1 | GO:0031092 | platelet alpha granule membrane(GO:0031092) |
| 2.3 | 2.3 | GO:0030008 | TRAPP complex(GO:0030008) |
| 2.3 | 18.1 | GO:0030665 | clathrin-coated vesicle membrane(GO:0030665) |
| 2.3 | 11.3 | GO:0071148 | TEAD-1-YAP complex(GO:0071148) |
| 2.3 | 469.8 | GO:0005578 | proteinaceous extracellular matrix(GO:0005578) |
| 2.2 | 8.9 | GO:0097136 | Bcl-2 family protein complex(GO:0097136) |
| 2.2 | 42.1 | GO:0016459 | myosin complex(GO:0016459) |
| 2.2 | 6.5 | GO:0044447 | axoneme part(GO:0044447) |
| 2.1 | 8.6 | GO:0000836 | ER ubiquitin ligase complex(GO:0000835) Hrd1p ubiquitin ligase complex(GO:0000836) |
| 2.1 | 35.6 | GO:0071141 | SMAD protein complex(GO:0071141) |
| 2.1 | 22.6 | GO:0035686 | sperm fibrous sheath(GO:0035686) |
| 2.1 | 6.2 | GO:0071437 | invadopodium(GO:0071437) |
| 2.0 | 26.6 | GO:0001772 | immunological synapse(GO:0001772) |
| 2.0 | 10.2 | GO:0036057 | filtration diaphragm(GO:0036056) slit diaphragm(GO:0036057) |
| 2.0 | 16.0 | GO:0034706 | sodium channel complex(GO:0034706) |
| 1.9 | 5.7 | GO:0034362 | low-density lipoprotein particle(GO:0034362) |
| 1.9 | 24.6 | GO:0000242 | pericentriolar material(GO:0000242) |
| 1.8 | 1.8 | GO:0031201 | SNARE complex(GO:0031201) |
| 1.8 | 47.4 | GO:0030057 | desmosome(GO:0030057) |
| 1.8 | 10.7 | GO:0031985 | Golgi cisterna(GO:0031985) |
| 1.8 | 21.1 | GO:0030673 | axolemma(GO:0030673) |
| 1.8 | 19.3 | GO:0008385 | IkappaB kinase complex(GO:0008385) |
| 1.8 | 423.6 | GO:0045202 | synapse(GO:0045202) |
| 1.7 | 7.0 | GO:0031417 | NatC complex(GO:0031417) |
| 1.7 | 297.8 | GO:0043025 | neuronal cell body(GO:0043025) |
| 1.7 | 3.5 | GO:0032009 | early phagosome(GO:0032009) |
| 1.7 | 6.9 | GO:0032311 | angiogenin-PRI complex(GO:0032311) |
| 1.7 | 6.9 | GO:0070821 | tertiary granule membrane(GO:0070821) |
| 1.7 | 6.8 | GO:0005965 | protein farnesyltransferase complex(GO:0005965) |
| 1.6 | 11.2 | GO:0035976 | AP1 complex(GO:0035976) |
| 1.6 | 14.0 | GO:0002080 | acrosomal membrane(GO:0002080) |
| 1.5 | 102.3 | GO:0030424 | axon(GO:0030424) |
| 1.5 | 84.8 | GO:0005791 | rough endoplasmic reticulum(GO:0005791) |
| 1.5 | 13.8 | GO:0005579 | membrane attack complex(GO:0005579) |
| 1.5 | 6.1 | GO:0002177 | manchette(GO:0002177) |
| 1.5 | 3.0 | GO:0043159 | acrosomal matrix(GO:0043159) |
| 1.5 | 23.9 | GO:0044322 | endoplasmic reticulum quality control compartment(GO:0044322) |
| 1.5 | 56.6 | GO:0016460 | myosin II complex(GO:0016460) |
| 1.5 | 7.4 | GO:0008622 | epsilon DNA polymerase complex(GO:0008622) |
| 1.5 | 5.9 | GO:0070288 | intracellular ferritin complex(GO:0008043) ferritin complex(GO:0070288) |
| 1.4 | 62.1 | GO:0005801 | cis-Golgi network(GO:0005801) |
| 1.4 | 51.2 | GO:0016235 | aggresome(GO:0016235) |
| 1.4 | 20.7 | GO:0000974 | Prp19 complex(GO:0000974) |
| 1.3 | 1.3 | GO:0035032 | phosphatidylinositol 3-kinase complex, class III(GO:0035032) |
| 1.3 | 79.4 | GO:0001726 | ruffle(GO:0001726) |
| 1.3 | 1.3 | GO:0036020 | endolysosome membrane(GO:0036020) |
| 1.3 | 2.6 | GO:0034366 | spherical high-density lipoprotein particle(GO:0034366) |
| 1.3 | 235.7 | GO:0043235 | receptor complex(GO:0043235) |
| 1.3 | 117.9 | GO:0031227 | intrinsic component of endoplasmic reticulum membrane(GO:0031227) |
| 1.3 | 15.2 | GO:0043020 | NADPH oxidase complex(GO:0043020) |
| 1.2 | 4155.6 | GO:0031224 | intrinsic component of membrane(GO:0031224) |
| 1.2 | 128.2 | GO:0005802 | trans-Golgi network(GO:0005802) |
| 1.2 | 13.0 | GO:0031089 | platelet dense granule lumen(GO:0031089) |
| 1.2 | 52.2 | GO:0008023 | transcription elongation factor complex(GO:0008023) |
| 1.1 | 5.7 | GO:0034457 | Mpp10 complex(GO:0034457) |
| 1.1 | 13.4 | GO:0005902 | microvillus(GO:0005902) |
| 1.1 | 4.4 | GO:0031467 | Cul7-RING ubiquitin ligase complex(GO:0031467) |
| 1.1 | 4.4 | GO:0030896 | checkpoint clamp complex(GO:0030896) |
| 1.1 | 7.5 | GO:0030870 | Mre11 complex(GO:0030870) |
| 1.0 | 4.2 | GO:0033263 | CORVET complex(GO:0033263) |
| 1.0 | 2.0 | GO:0045179 | apical cortex(GO:0045179) |
| 1.0 | 14.3 | GO:0016529 | sarcoplasmic reticulum(GO:0016529) |
| 1.0 | 2.0 | GO:0034361 | very-low-density lipoprotein particle(GO:0034361) triglyceride-rich lipoprotein particle(GO:0034385) |
| 1.0 | 3.0 | GO:0005944 | phosphatidylinositol 3-kinase complex, class IB(GO:0005944) |
| 1.0 | 4.0 | GO:0070436 | Grb2-EGFR complex(GO:0070436) |
| 1.0 | 7.0 | GO:0000120 | RNA polymerase I transcription factor complex(GO:0000120) |
| 1.0 | 10.9 | GO:0005671 | Ada2/Gcn5/Ada3 transcription activator complex(GO:0005671) |
| 1.0 | 7.7 | GO:0042587 | glycogen granule(GO:0042587) |
| 0.9 | 16.7 | GO:0097610 | cleavage furrow(GO:0032154) cell surface furrow(GO:0097610) |
| 0.9 | 3.7 | GO:0005967 | mitochondrial pyruvate dehydrogenase complex(GO:0005967) |
| 0.9 | 1.8 | GO:0000923 | equatorial microtubule organizing center(GO:0000923) |
| 0.8 | 5.6 | GO:0005869 | dynactin complex(GO:0005869) |
| 0.8 | 44.2 | GO:0031463 | Cul3-RING ubiquitin ligase complex(GO:0031463) |
| 0.8 | 7.0 | GO:0030670 | phagocytic vesicle membrane(GO:0030670) |
| 0.8 | 1.5 | GO:0030136 | clathrin-coated vesicle(GO:0030136) |
| 0.7 | 15.5 | GO:0035145 | exon-exon junction complex(GO:0035145) |
| 0.7 | 2.2 | GO:1990393 | 3M complex(GO:1990393) |
| 0.7 | 16.6 | GO:0031903 | peroxisomal membrane(GO:0005778) microbody membrane(GO:0031903) |
| 0.7 | 10.0 | GO:0031904 | endosome lumen(GO:0031904) |
| 0.7 | 1.4 | GO:0042588 | zymogen granule(GO:0042588) |
| 0.6 | 19.7 | GO:0005793 | endoplasmic reticulum-Golgi intermediate compartment(GO:0005793) |
| 0.6 | 91.0 | GO:0005789 | endoplasmic reticulum membrane(GO:0005789) |
| 0.6 | 6.7 | GO:0005833 | hemoglobin complex(GO:0005833) |
| 0.6 | 3.9 | GO:0042788 | polysomal ribosome(GO:0042788) |
| 0.5 | 11.1 | GO:0000407 | pre-autophagosomal structure(GO:0000407) |
| 0.4 | 26.0 | GO:0005770 | late endosome(GO:0005770) |
| 0.4 | 1.3 | GO:0031313 | extrinsic component of endosome membrane(GO:0031313) |
| 0.4 | 3.1 | GO:0035985 | senescence-associated heterochromatin focus(GO:0035985) |
| 0.4 | 2.5 | GO:0097169 | AIM2 inflammasome complex(GO:0097169) |
| 0.4 | 2.0 | GO:0097524 | sperm plasma membrane(GO:0097524) |
| 0.4 | 1.2 | GO:0001931 | uropod(GO:0001931) cell trailing edge(GO:0031254) |
| 0.4 | 0.7 | GO:0055087 | Ski complex(GO:0055087) |
| 0.3 | 2.3 | GO:0031464 | Cul4A-RING E3 ubiquitin ligase complex(GO:0031464) |
| 0.3 | 1.3 | GO:0070876 | SOSS complex(GO:0070876) |
| 0.3 | 1.0 | GO:0071749 | IgA immunoglobulin complex(GO:0071745) IgA immunoglobulin complex, circulating(GO:0071746) monomeric IgA immunoglobulin complex(GO:0071748) polymeric IgA immunoglobulin complex(GO:0071749) secretory IgA immunoglobulin complex(GO:0071751) |
| 0.2 | 0.7 | GO:0044279 | other organism cell membrane(GO:0044218) other organism membrane(GO:0044279) |
| 0.2 | 4.1 | GO:0080008 | Cul4-RING E3 ubiquitin ligase complex(GO:0080008) |
| 0.2 | 2.1 | GO:0005942 | phosphatidylinositol 3-kinase complex(GO:0005942) |
| 0.2 | 0.6 | GO:0070419 | nonhomologous end joining complex(GO:0070419) |
| 0.2 | 11.8 | GO:0009897 | external side of plasma membrane(GO:0009897) |
| 0.2 | 2.0 | GO:0034364 | high-density lipoprotein particle(GO:0034364) |
| 0.1 | 0.4 | GO:0034464 | BBSome(GO:0034464) |
| 0.1 | 0.5 | GO:0032449 | CBM complex(GO:0032449) |
| 0.1 | 2.5 | GO:0051233 | spindle midzone(GO:0051233) |
| 0.1 | 0.6 | GO:0005577 | fibrinogen complex(GO:0005577) |
| 0.1 | 4.7 | GO:0005923 | bicellular tight junction(GO:0005923) |
| 0.1 | 104.5 | GO:0005615 | extracellular space(GO:0005615) |
| 0.1 | 7.0 | GO:0030018 | Z disc(GO:0030018) |
| 0.1 | 0.5 | GO:0005968 | Rab-protein geranylgeranyltransferase complex(GO:0005968) |
| 0.0 | 0.1 | GO:0030895 | apolipoprotein B mRNA editing enzyme complex(GO:0030895) |
| 0.0 | 0.6 | GO:0000177 | cytoplasmic exosome (RNase complex)(GO:0000177) |
| 0.0 | 0.2 | GO:0031082 | BLOC complex(GO:0031082) |
Gene overrepresentation in molecular_function category:
| Log-likelihood per target | Total log-likelihood | Term | Description |
|---|---|---|---|
| 48.7 | 146.2 | GO:0086062 | voltage-gated sodium channel activity involved in Purkinje myocyte action potential(GO:0086062) |
| 44.5 | 178.1 | GO:0004667 | prostaglandin-D synthase activity(GO:0004667) |
| 37.4 | 149.6 | GO:0004356 | glutamate-ammonia ligase activity(GO:0004356) ammonia ligase activity(GO:0016211) acid-ammonia (or amide) ligase activity(GO:0016880) |
| 36.0 | 108.1 | GO:0015018 | galactosylgalactosylxylosylprotein 3-beta-glucuronosyltransferase activity(GO:0015018) |
| 34.5 | 103.5 | GO:0004965 | G-protein coupled GABA receptor activity(GO:0004965) |
| 33.4 | 100.2 | GO:0070326 | very-low-density lipoprotein particle receptor binding(GO:0070326) |
| 29.3 | 87.8 | GO:0004676 | 3-phosphoinositide-dependent protein kinase activity(GO:0004676) |
| 27.7 | 83.2 | GO:0008332 | low voltage-gated calcium channel activity(GO:0008332) |
| 26.0 | 182.3 | GO:0060072 | large conductance calcium-activated potassium channel activity(GO:0060072) |
| 24.7 | 148.1 | GO:0004741 | [pyruvate dehydrogenase (lipoamide)] phosphatase activity(GO:0004741) |
| 24.2 | 96.8 | GO:0070290 | N-acylphosphatidylethanolamine-specific phospholipase D activity(GO:0070290) |
| 23.5 | 94.0 | GO:0004803 | transposase activity(GO:0004803) |
| 23.4 | 23.4 | GO:0050998 | nitric-oxide synthase binding(GO:0050998) |
| 23.3 | 139.9 | GO:0008597 | calcium-dependent protein serine/threonine phosphatase regulator activity(GO:0008597) |
| 23.1 | 69.2 | GO:0004157 | dihydropyrimidinase activity(GO:0004157) |
| 23.0 | 69.1 | GO:0047493 | sphingomyelin synthase activity(GO:0033188) ceramide cholinephosphotransferase activity(GO:0047493) |
| 22.5 | 134.8 | GO:0004800 | thyroxine 5'-deiodinase activity(GO:0004800) |
| 21.7 | 65.1 | GO:0070025 | cystathionine beta-synthase activity(GO:0004122) oxidoreductase activity, acting on other nitrogenous compounds as donors, cytochrome as acceptor(GO:0016662) nitrite reductase (NO-forming) activity(GO:0050421) carbon monoxide binding(GO:0070025) nitrite reductase activity(GO:0098809) |
| 21.6 | 86.2 | GO:0031694 | alpha-2A adrenergic receptor binding(GO:0031694) |
| 21.0 | 83.9 | GO:0035939 | microsatellite binding(GO:0035939) |
| 19.6 | 78.4 | GO:0061628 | H3K27me3 modified histone binding(GO:0061628) |
| 19.4 | 38.7 | GO:0030618 | transforming growth factor beta receptor, pathway-specific cytoplasmic mediator activity(GO:0030618) |
| 18.8 | 75.3 | GO:0005222 | intracellular cAMP activated cation channel activity(GO:0005222) |
| 18.8 | 169.0 | GO:0032051 | clathrin light chain binding(GO:0032051) |
| 18.0 | 90.0 | GO:0070097 | delta-catenin binding(GO:0070097) |
| 18.0 | 53.9 | GO:0098640 | integrin binding involved in cell-matrix adhesion(GO:0098640) |
| 17.7 | 70.8 | GO:0004782 | sulfinoalanine decarboxylase activity(GO:0004782) |
| 17.6 | 70.5 | GO:0097001 | ceramide binding(GO:0097001) |
| 17.6 | 52.8 | GO:0016534 | cyclin-dependent protein kinase 5 activator activity(GO:0016534) |
| 17.4 | 52.2 | GO:0032093 | SAM domain binding(GO:0032093) |
| 17.4 | 86.8 | GO:0004999 | vasoactive intestinal polypeptide receptor activity(GO:0004999) |
| 17.1 | 68.6 | GO:0070051 | fibrinogen binding(GO:0070051) |
| 17.1 | 85.7 | GO:0035252 | UDP-xylosyltransferase activity(GO:0035252) xylosyltransferase activity(GO:0042285) |
| 17.1 | 68.4 | GO:0050119 | N-acetylglucosamine deacetylase activity(GO:0050119) |
| 16.9 | 84.3 | GO:0000179 | rRNA (adenine-N6,N6-)-dimethyltransferase activity(GO:0000179) |
| 16.8 | 16.8 | GO:0015166 | polyol transmembrane transporter activity(GO:0015166) |
| 16.8 | 168.0 | GO:0005007 | fibroblast growth factor-activated receptor activity(GO:0005007) |
| 16.8 | 50.4 | GO:0035403 | histone kinase activity (H3-T6 specific)(GO:0035403) |
| 16.5 | 131.7 | GO:0031802 | type 5 metabotropic glutamate receptor binding(GO:0031802) |
| 15.9 | 79.4 | GO:0046974 | histone methyltransferase activity (H3-K9 specific)(GO:0046974) |
| 15.8 | 63.0 | GO:0004634 | phosphopyruvate hydratase activity(GO:0004634) |
| 15.5 | 62.0 | GO:0047288 | monosialoganglioside sialyltransferase activity(GO:0047288) |
| 15.3 | 91.8 | GO:0015252 | hydrogen ion channel activity(GO:0015252) |
| 14.9 | 14.9 | GO:0030226 | apolipoprotein receptor activity(GO:0030226) |
| 14.9 | 44.7 | GO:0008321 | Ral guanyl-nucleotide exchange factor activity(GO:0008321) |
| 14.8 | 44.4 | GO:0015189 | L-lysine transmembrane transporter activity(GO:0015189) |
| 14.8 | 74.0 | GO:0005315 | inorganic phosphate transmembrane transporter activity(GO:0005315) |
| 14.4 | 43.2 | GO:0005150 | interleukin-1, Type I receptor binding(GO:0005150) |
| 14.3 | 42.8 | GO:0004103 | choline kinase activity(GO:0004103) |
| 13.8 | 55.0 | GO:0061769 | ribosylnicotinamide kinase activity(GO:0050262) ribosylnicotinate kinase activity(GO:0061769) |
| 13.7 | 82.4 | GO:0043237 | laminin-1 binding(GO:0043237) |
| 13.6 | 81.6 | GO:0003998 | acylphosphatase activity(GO:0003998) |
| 13.6 | 40.8 | GO:0016838 | carbon-oxygen lyase activity, acting on phosphates(GO:0016838) |
| 13.5 | 67.5 | GO:0001641 | group II metabotropic glutamate receptor activity(GO:0001641) |
| 13.5 | 26.9 | GO:0004477 | methenyltetrahydrofolate cyclohydrolase activity(GO:0004477) methylenetetrahydrofolate dehydrogenase (NAD+) activity(GO:0004487) methylenetetrahydrofolate dehydrogenase (NADP+) activity(GO:0004488) |
| 13.4 | 26.8 | GO:0086006 | voltage-gated sodium channel activity involved in cardiac muscle cell action potential(GO:0086006) |
| 13.4 | 80.2 | GO:0072320 | volume-sensitive chloride channel activity(GO:0072320) |
| 13.3 | 66.5 | GO:0004306 | ethanolamine-phosphate cytidylyltransferase activity(GO:0004306) |
| 12.9 | 25.9 | GO:0035033 | histone deacetylase regulator activity(GO:0035033) |
| 12.8 | 64.2 | GO:0044729 | hemi-methylated DNA-binding(GO:0044729) |
| 12.8 | 167.0 | GO:0046870 | cadmium ion binding(GO:0046870) |
| 12.8 | 154.0 | GO:0019911 | structural constituent of myelin sheath(GO:0019911) |
| 12.8 | 38.4 | GO:0042799 | histone methyltransferase activity (H4-K20 specific)(GO:0042799) |
| 12.8 | 12.8 | GO:0052812 | phosphatidylinositol-3,4-bisphosphate 5-kinase activity(GO:0052812) |
| 12.6 | 37.9 | GO:0047325 | inositol tetrakisphosphate 1-kinase activity(GO:0047325) inositol tetrakisphosphate kinase activity(GO:0051765) inositol-1,3,4-trisphosphate 6-kinase activity(GO:0052725) inositol-1,3,4-trisphosphate 5-kinase activity(GO:0052726) inositol-1,3,4,5,6-pentakisphosphate 1-phosphatase activity(GO:0052825) inositol-1,3,4,6-tetrakisphosphate 6-phosphatase activity(GO:0052830) inositol-1,3,4,6-tetrakisphosphate 1-phosphatase activity(GO:0052831) inositol-3,4,6-trisphosphate 1-kinase activity(GO:0052835) |
| 12.6 | 37.8 | GO:0032184 | SUMO polymer binding(GO:0032184) |
| 12.5 | 25.0 | GO:0043559 | insulin binding(GO:0043559) |
| 12.4 | 62.1 | GO:0038062 | protein tyrosine kinase collagen receptor activity(GO:0038062) |
| 12.3 | 36.8 | GO:0000026 | alpha-1,2-mannosyltransferase activity(GO:0000026) |
| 11.9 | 47.6 | GO:0016900 | oxidoreductase activity, acting on the CH-OH group of donors, disulfide as acceptor(GO:0016900) vitamin-K-epoxide reductase (warfarin-sensitive) activity(GO:0047057) |
| 11.7 | 35.0 | GO:0001225 | RNA polymerase II transcription coactivator binding(GO:0001225) |
| 11.5 | 161.6 | GO:0004723 | calcium-dependent protein serine/threonine phosphatase activity(GO:0004723) |
| 11.4 | 91.0 | GO:0008821 | crossover junction endodeoxyribonuclease activity(GO:0008821) |
| 11.3 | 79.2 | GO:0017002 | activin-activated receptor activity(GO:0017002) |
| 11.3 | 67.8 | GO:0000285 | 1-phosphatidylinositol-3-phosphate 5-kinase activity(GO:0000285) |
| 11.3 | 45.1 | GO:0051430 | corticotropin-releasing hormone receptor binding(GO:0051429) corticotropin-releasing hormone receptor 1 binding(GO:0051430) |
| 11.2 | 78.6 | GO:0031681 | G-protein beta-subunit binding(GO:0031681) |
| 11.2 | 145.2 | GO:0005344 | oxygen transporter activity(GO:0005344) |
| 11.1 | 300.8 | GO:0050780 | dopamine receptor binding(GO:0050780) |
| 11.1 | 422.8 | GO:0005245 | voltage-gated calcium channel activity(GO:0005245) |
| 11.1 | 33.4 | GO:0016309 | 1-phosphatidylinositol-5-phosphate 4-kinase activity(GO:0016309) |
| 11.0 | 32.9 | GO:0052895 | norspermine:oxygen oxidoreductase activity(GO:0052894) N1-acetylspermine:oxygen oxidoreductase (N1-acetylspermidine-forming) activity(GO:0052895) |
| 10.9 | 98.4 | GO:0070915 | lysophosphatidic acid receptor activity(GO:0070915) |
| 10.9 | 43.4 | GO:0008273 | calcium, potassium:sodium antiporter activity(GO:0008273) |
| 10.8 | 10.8 | GO:0005277 | acetylcholine transmembrane transporter activity(GO:0005277) acetate ester transmembrane transporter activity(GO:1901375) |
| 10.7 | 32.1 | GO:0034584 | piRNA binding(GO:0034584) |
| 10.6 | 42.6 | GO:0033829 | O-fucosylpeptide 3-beta-N-acetylglucosaminyltransferase activity(GO:0033829) |
| 10.6 | 10.6 | GO:0030506 | ankyrin binding(GO:0030506) |
| 10.5 | 52.6 | GO:0005127 | ciliary neurotrophic factor receptor binding(GO:0005127) |
| 10.5 | 52.4 | GO:0005006 | epidermal growth factor-activated receptor activity(GO:0005006) |
| 10.5 | 31.4 | GO:0098519 | nucleotide phosphatase activity, acting on free nucleotides(GO:0098519) |
| 10.4 | 260.8 | GO:0004012 | phospholipid-translocating ATPase activity(GO:0004012) |
| 10.3 | 216.5 | GO:0031005 | filamin binding(GO:0031005) |
| 10.3 | 257.1 | GO:0004383 | guanylate cyclase activity(GO:0004383) |
| 10.3 | 61.5 | GO:0016176 | superoxide-generating NADPH oxidase activator activity(GO:0016176) |
| 10.2 | 51.1 | GO:0001135 | transcription factor activity, RNA polymerase II transcription factor recruiting(GO:0001135) |
| 10.2 | 50.9 | GO:0061665 | SUMO ligase activity(GO:0061665) |
| 10.2 | 10.2 | GO:0032794 | GTPase activating protein binding(GO:0032794) |
| 10.1 | 10.1 | GO:1904264 | ubiquitin protein ligase activity involved in ERAD pathway(GO:1904264) |
| 10.1 | 60.6 | GO:0008568 | microtubule-severing ATPase activity(GO:0008568) |
| 10.1 | 40.3 | GO:0042132 | fructose 1,6-bisphosphate 1-phosphatase activity(GO:0042132) |
| 10.1 | 30.2 | GO:0030350 | iron-responsive element binding(GO:0030350) |
| 10.1 | 10.1 | GO:0031697 | beta-1 adrenergic receptor binding(GO:0031697) |
| 10.0 | 50.1 | GO:0004489 | methylenetetrahydrofolate reductase (NAD(P)H) activity(GO:0004489) |
| 10.0 | 40.0 | GO:0047066 | phospholipid-hydroperoxide glutathione peroxidase activity(GO:0047066) |
| 9.9 | 59.5 | GO:0071837 | HMG box domain binding(GO:0071837) |
| 9.8 | 206.1 | GO:0050811 | GABA receptor binding(GO:0050811) |
| 9.8 | 49.0 | GO:0034431 | endopolyphosphatase activity(GO:0000298) diphosphoinositol-polyphosphate diphosphatase activity(GO:0008486) bis(5'-adenosyl)-hexaphosphatase activity(GO:0034431) bis(5'-adenosyl)-pentaphosphatase activity(GO:0034432) inositol diphosphate tetrakisphosphate diphosphatase activity(GO:0052840) inositol bisdiphosphate tetrakisphosphate diphosphatase activity(GO:0052841) inositol diphosphate pentakisphosphate diphosphatase activity(GO:0052842) inositol-1-diphosphate-2,3,4,5,6-pentakisphosphate diphosphatase activity(GO:0052843) inositol-3-diphosphate-1,2,4,5,6-pentakisphosphate diphosphatase activity(GO:0052844) inositol-5-diphosphate-1,2,3,4,6-pentakisphosphate diphosphatase activity(GO:0052845) inositol-1,5-bisdiphosphate-2,3,4,6-tetrakisphosphate 1-diphosphatase activity(GO:0052846) inositol-1,5-bisdiphosphate-2,3,4,6-tetrakisphosphate 5-diphosphatase activity(GO:0052847) inositol-3,5-bisdiphosphate-2,3,4,6-tetrakisphosphate 5-diphosphatase activity(GO:0052848) |
| 9.8 | 39.1 | GO:0043812 | phosphatidylinositol-4-phosphate phosphatase activity(GO:0043812) |
| 9.8 | 39.0 | GO:0047298 | 4-aminobutyrate transaminase activity(GO:0003867) succinate-semialdehyde dehydrogenase binding(GO:0032145) (S)-3-amino-2-methylpropionate transaminase activity(GO:0047298) |
| 9.7 | 29.2 | GO:0047757 | chondroitin-glucuronate 5-epimerase activity(GO:0047757) |
| 9.7 | 125.9 | GO:0097109 | neuroligin family protein binding(GO:0097109) |
| 9.6 | 76.9 | GO:0036312 | phosphatidylinositol 3-kinase regulatory subunit binding(GO:0036312) |
| 9.6 | 9.6 | GO:0035276 | ethanol binding(GO:0035276) |
| 9.5 | 19.0 | GO:0019912 | cyclin-dependent protein kinase activating kinase activity(GO:0019912) |
| 9.5 | 28.5 | GO:0005330 | dopamine:sodium symporter activity(GO:0005330) |
| 9.4 | 28.1 | GO:0004937 | alpha1-adrenergic receptor activity(GO:0004937) |
| 9.4 | 28.1 | GO:0004951 | cholecystokinin receptor activity(GO:0004951) |
| 9.3 | 56.0 | GO:0016015 | morphogen activity(GO:0016015) |
| 9.3 | 129.9 | GO:0048407 | platelet-derived growth factor binding(GO:0048407) |
| 9.1 | 73.2 | GO:0004865 | protein serine/threonine phosphatase inhibitor activity(GO:0004865) |
| 9.1 | 63.6 | GO:0043533 | inositol 1,3,4,5 tetrakisphosphate binding(GO:0043533) |
| 9.0 | 54.0 | GO:0039552 | RIG-I binding(GO:0039552) |
| 8.9 | 35.6 | GO:0005219 | ryanodine-sensitive calcium-release channel activity(GO:0005219) |
| 8.9 | 35.6 | GO:0001591 | dopamine neurotransmitter receptor activity, coupled via Gi/Go(GO:0001591) |
| 8.9 | 35.4 | GO:0019770 | IgG receptor activity(GO:0019770) |
| 8.8 | 159.2 | GO:0004861 | cyclin-dependent protein serine/threonine kinase inhibitor activity(GO:0004861) |
| 8.8 | 17.6 | GO:0052901 | polyamine oxidase activity(GO:0046592) spermine:oxygen oxidoreductase (spermidine-forming) activity(GO:0052901) |
| 8.8 | 44.0 | GO:0004703 | G-protein coupled receptor kinase activity(GO:0004703) |
| 8.8 | 272.3 | GO:0017075 | syntaxin-1 binding(GO:0017075) |
| 8.7 | 8.7 | GO:0097677 | STAT family protein binding(GO:0097677) |
| 8.6 | 8.6 | GO:0098518 | polynucleotide phosphatase activity(GO:0098518) |
| 8.6 | 25.8 | GO:0008798 | beta-aspartyl-peptidase activity(GO:0008798) |
| 8.5 | 34.0 | GO:0004740 | pyruvate dehydrogenase (acetyl-transferring) kinase activity(GO:0004740) |
| 8.4 | 92.9 | GO:0004571 | mannosyl-oligosaccharide 1,2-alpha-mannosidase activity(GO:0004571) |
| 8.4 | 25.2 | GO:0000995 | transcription factor activity, core RNA polymerase III binding(GO:0000995) |
| 8.2 | 49.1 | GO:0030368 | interleukin-17 receptor activity(GO:0030368) |
| 8.2 | 81.7 | GO:0022841 | potassium ion leak channel activity(GO:0022841) |
| 8.2 | 32.7 | GO:0031716 | calcitonin receptor binding(GO:0031716) |
| 8.1 | 32.5 | GO:0052590 | sn-glycerol-3-phosphate:ubiquinone oxidoreductase activity(GO:0052590) sn-glycerol-3-phosphate:ubiquinone-8 oxidoreductase activity(GO:0052591) |
| 8.1 | 40.5 | GO:0004995 | tachykinin receptor activity(GO:0004995) |
| 8.1 | 56.5 | GO:0060228 | phosphatidylcholine-sterol O-acyltransferase activator activity(GO:0060228) |
| 8.0 | 40.1 | GO:0070740 | tubulin-glutamic acid ligase activity(GO:0070740) |
| 8.0 | 40.0 | GO:0004991 | parathyroid hormone receptor activity(GO:0004991) |
| 8.0 | 104.1 | GO:0047372 | acylglycerol lipase activity(GO:0047372) |
| 8.0 | 48.0 | GO:0004118 | cGMP-stimulated cyclic-nucleotide phosphodiesterase activity(GO:0004118) |
| 8.0 | 24.0 | GO:0070984 | SET domain binding(GO:0070984) |
| 8.0 | 24.0 | GO:0070404 | NADH binding(GO:0070404) |
| 8.0 | 47.9 | GO:0005332 | gamma-aminobutyric acid:sodium symporter activity(GO:0005332) gamma-aminobutyric acid transmembrane transporter activity(GO:0015185) |
| 8.0 | 111.4 | GO:0017162 | aryl hydrocarbon receptor binding(GO:0017162) |
| 7.8 | 78.3 | GO:0009374 | biotin binding(GO:0009374) |
| 7.8 | 31.3 | GO:0004657 | proline dehydrogenase activity(GO:0004657) |
| 7.8 | 155.4 | GO:0005545 | 1-phosphatidylinositol binding(GO:0005545) |
| 7.8 | 31.0 | GO:0001025 | RNA polymerase III transcription factor binding(GO:0001025) |
| 7.7 | 7.7 | GO:0005017 | platelet-derived growth factor-activated receptor activity(GO:0005017) |
| 7.7 | 92.2 | GO:0005078 | MAP-kinase scaffold activity(GO:0005078) |
| 7.7 | 46.0 | GO:0015272 | ATP-activated inward rectifier potassium channel activity(GO:0015272) |
| 7.7 | 46.0 | GO:0005025 | transforming growth factor beta receptor activity, type I(GO:0005025) |
| 7.6 | 30.4 | GO:0005502 | 11-cis retinal binding(GO:0005502) |
| 7.5 | 97.8 | GO:0097371 | MDM2/MDM4 family protein binding(GO:0097371) |
| 7.4 | 88.9 | GO:1903136 | cuprous ion binding(GO:1903136) |
| 7.4 | 22.2 | GO:0016155 | formyltetrahydrofolate dehydrogenase activity(GO:0016155) |
| 7.4 | 22.1 | GO:0047322 | [hydroxymethylglutaryl-CoA reductase (NADPH)] kinase activity(GO:0047322) [acetyl-CoA carboxylase] kinase activity(GO:0050405) |
| 7.3 | 73.4 | GO:1990380 | Lys48-specific deubiquitinase activity(GO:1990380) |
| 7.3 | 14.6 | GO:0045294 | alpha-catenin binding(GO:0045294) |
| 7.3 | 131.4 | GO:0008510 | sodium:bicarbonate symporter activity(GO:0008510) |
| 7.2 | 50.1 | GO:0015501 | glutamate:sodium symporter activity(GO:0015501) |
| 7.1 | 21.4 | GO:0035501 | MH1 domain binding(GO:0035501) |
| 7.1 | 21.2 | GO:0004119 | cGMP-inhibited cyclic-nucleotide phosphodiesterase activity(GO:0004119) |
| 7.0 | 140.9 | GO:0043121 | neurotrophin binding(GO:0043121) |
| 7.0 | 42.1 | GO:0048495 | Roundabout binding(GO:0048495) |
| 6.9 | 117.8 | GO:0004089 | carbonate dehydratase activity(GO:0004089) |
| 6.9 | 34.4 | GO:0016300 | tRNA (uracil) methyltransferase activity(GO:0016300) |
| 6.8 | 27.4 | GO:0005105 | type 1 fibroblast growth factor receptor binding(GO:0005105) |
| 6.8 | 135.5 | GO:0004862 | cAMP-dependent protein kinase inhibitor activity(GO:0004862) |
| 6.8 | 27.1 | GO:0042903 | tubulin deacetylase activity(GO:0042903) |
| 6.7 | 33.6 | GO:0005329 | dopamine transmembrane transporter activity(GO:0005329) |
| 6.7 | 40.2 | GO:0070742 | C2H2 zinc finger domain binding(GO:0070742) |
| 6.6 | 106.1 | GO:0070411 | I-SMAD binding(GO:0070411) |
| 6.6 | 33.0 | GO:0005052 | peroxisome matrix targeting signal-1 binding(GO:0005052) |
| 6.6 | 85.9 | GO:0070700 | BMP receptor binding(GO:0070700) |
| 6.6 | 132.0 | GO:0050321 | tau-protein kinase activity(GO:0050321) |
| 6.6 | 39.3 | GO:1990829 | C-rich single-stranded DNA binding(GO:1990829) |
| 6.5 | 19.5 | GO:0061663 | NEDD8 ligase activity(GO:0061663) |
| 6.5 | 71.4 | GO:0001042 | RNA polymerase I core binding(GO:0001042) |
| 6.5 | 12.9 | GO:0051525 | NFAT protein binding(GO:0051525) |
| 6.4 | 19.3 | GO:0003826 | alpha-ketoacid dehydrogenase activity(GO:0003826) 3-methyl-2-oxobutanoate dehydrogenase (2-methylpropanoyl-transferring) activity(GO:0003863) |
| 6.4 | 50.8 | GO:0008131 | primary amine oxidase activity(GO:0008131) |
| 6.3 | 88.7 | GO:0015095 | magnesium ion transmembrane transporter activity(GO:0015095) |
| 6.3 | 183.0 | GO:0005388 | calcium-transporting ATPase activity(GO:0005388) |
| 6.3 | 31.4 | GO:0004687 | myosin light chain kinase activity(GO:0004687) |
| 6.2 | 25.0 | GO:0099609 | microtubule lateral binding(GO:0099609) |
| 6.2 | 25.0 | GO:0008940 | nitrate reductase activity(GO:0008940) |
| 6.2 | 18.7 | GO:0047429 | nucleoside-triphosphate diphosphatase activity(GO:0047429) |
| 6.2 | 55.9 | GO:0004969 | histamine receptor activity(GO:0004969) |
| 6.2 | 86.9 | GO:0030306 | ADP-ribosylation factor binding(GO:0030306) |
| 6.1 | 30.7 | GO:0030552 | cAMP binding(GO:0030552) |
| 6.1 | 30.4 | GO:0004591 | oxoglutarate dehydrogenase (succinyl-transferring) activity(GO:0004591) |
| 6.1 | 103.4 | GO:0015250 | water channel activity(GO:0015250) |
| 6.0 | 283.9 | GO:0005158 | insulin receptor binding(GO:0005158) |
| 6.0 | 24.2 | GO:0017040 | ceramidase activity(GO:0017040) |
| 6.0 | 198.5 | GO:0004683 | calmodulin-dependent protein kinase activity(GO:0004683) |
| 6.0 | 72.0 | GO:0008179 | adenylate cyclase binding(GO:0008179) |
| 6.0 | 18.0 | GO:0086089 | voltage-gated potassium channel activity involved in atrial cardiac muscle cell action potential repolarization(GO:0086089) |
| 6.0 | 18.0 | GO:0031826 | type 2A serotonin receptor binding(GO:0031826) |
| 6.0 | 71.7 | GO:0017034 | Rap guanyl-nucleotide exchange factor activity(GO:0017034) |
| 6.0 | 405.1 | GO:0001540 | beta-amyloid binding(GO:0001540) |
| 6.0 | 41.7 | GO:0016206 | catechol O-methyltransferase activity(GO:0016206) |
| 5.9 | 35.6 | GO:0008467 | [heparan sulfate]-glucosamine 3-sulfotransferase 1 activity(GO:0008467) |
| 5.9 | 71.2 | GO:0019841 | retinol binding(GO:0019841) |
| 5.9 | 70.9 | GO:0043995 | histone acetyltransferase activity (H4-K5 specific)(GO:0043995) histone acetyltransferase activity (H4-K8 specific)(GO:0043996) histone acetyltransferase activity (H4-K16 specific)(GO:0046972) |
| 5.9 | 17.6 | GO:0003845 | 11-beta-hydroxysteroid dehydrogenase [NAD(P)] activity(GO:0003845) |
| 5.9 | 135.1 | GO:0019198 | transmembrane receptor protein tyrosine phosphatase activity(GO:0005001) transmembrane receptor protein phosphatase activity(GO:0019198) |
| 5.9 | 88.0 | GO:0008556 | potassium-transporting ATPase activity(GO:0008556) |
| 5.9 | 87.9 | GO:0005003 | ephrin receptor activity(GO:0005003) |
| 5.8 | 81.6 | GO:0055056 | D-glucose transmembrane transporter activity(GO:0055056) |
| 5.8 | 17.5 | GO:0008386 | cholesterol monooxygenase (side-chain-cleaving) activity(GO:0008386) |
| 5.8 | 17.3 | GO:0004983 | neuropeptide Y receptor activity(GO:0004983) |
| 5.7 | 17.2 | GO:0001861 | complement component C4b receptor activity(GO:0001861) complement component C3b receptor activity(GO:0004877) |
| 5.7 | 97.6 | GO:0019992 | diacylglycerol binding(GO:0019992) |
| 5.7 | 17.0 | GO:0004961 | thromboxane receptor activity(GO:0004960) thromboxane A2 receptor activity(GO:0004961) |
| 5.6 | 33.8 | GO:0003777 | microtubule motor activity(GO:0003777) |
| 5.6 | 73.1 | GO:0008429 | phosphatidylethanolamine binding(GO:0008429) |
| 5.6 | 11.2 | GO:0005137 | interleukin-5 receptor binding(GO:0005137) |
| 5.6 | 22.5 | GO:0060422 | peptidyl-dipeptidase inhibitor activity(GO:0060422) |
| 5.6 | 39.0 | GO:0097322 | 7SK snRNA binding(GO:0097322) |
| 5.6 | 155.9 | GO:0043394 | proteoglycan binding(GO:0043394) |
| 5.5 | 38.8 | GO:0003828 | alpha-N-acetylneuraminate alpha-2,8-sialyltransferase activity(GO:0003828) |
| 5.5 | 22.2 | GO:0070735 | protein-glycine ligase activity(GO:0070735) |
| 5.5 | 94.0 | GO:0070300 | phosphatidic acid binding(GO:0070300) |
| 5.5 | 38.7 | GO:0042975 | peroxisome proliferator activated receptor binding(GO:0042975) |
| 5.5 | 60.7 | GO:0005021 | vascular endothelial growth factor-activated receptor activity(GO:0005021) |
| 5.5 | 71.6 | GO:0047555 | 3',5'-cyclic-GMP phosphodiesterase activity(GO:0047555) |
| 5.5 | 5.5 | GO:0098988 | adenylate cyclase inhibiting G-protein coupled glutamate receptor activity(GO:0001640) G-protein coupled glutamate receptor activity(GO:0098988) |
| 5.5 | 5.5 | GO:0051538 | 3 iron, 4 sulfur cluster binding(GO:0051538) |
| 5.5 | 163.8 | GO:0017147 | Wnt-protein binding(GO:0017147) |
| 5.4 | 16.3 | GO:0019961 | interferon binding(GO:0019961) |
| 5.4 | 130.5 | GO:0005086 | ARF guanyl-nucleotide exchange factor activity(GO:0005086) |
| 5.4 | 108.4 | GO:0045504 | dynein heavy chain binding(GO:0045504) |
| 5.4 | 86.7 | GO:0035925 | mRNA 3'-UTR AU-rich region binding(GO:0035925) |
| 5.3 | 155.0 | GO:0004115 | 3',5'-cyclic-AMP phosphodiesterase activity(GO:0004115) |
| 5.3 | 10.6 | GO:0008410 | CoA-transferase activity(GO:0008410) |
| 5.3 | 37.1 | GO:0043426 | MRF binding(GO:0043426) |
| 5.3 | 10.6 | GO:0015924 | mannosyl-oligosaccharide mannosidase activity(GO:0015924) |
| 5.3 | 5.3 | GO:0038064 | collagen receptor activity(GO:0038064) |
| 5.3 | 15.8 | GO:0003968 | RNA-directed RNA polymerase activity(GO:0003968) |
| 5.2 | 36.7 | GO:0001517 | N-acetylglucosamine 6-O-sulfotransferase activity(GO:0001517) |
| 5.2 | 20.9 | GO:0031821 | G-protein coupled serotonin receptor binding(GO:0031821) |
| 5.2 | 15.7 | GO:0003865 | 3-oxo-5-alpha-steroid 4-dehydrogenase activity(GO:0003865) steroid dehydrogenase activity, acting on the CH-CH group of donors(GO:0033765) cholestenone 5-alpha-reductase activity(GO:0047751) |
| 5.2 | 57.4 | GO:0017154 | semaphorin receptor activity(GO:0017154) |
| 5.2 | 15.6 | GO:0035473 | lipase binding(GO:0035473) |
| 5.2 | 72.6 | GO:0099604 | calcium-release channel activity(GO:0015278) ligand-gated calcium channel activity(GO:0099604) |
| 5.2 | 15.5 | GO:0005174 | CD40 receptor binding(GO:0005174) |
| 5.1 | 30.8 | GO:0030023 | extracellular matrix constituent conferring elasticity(GO:0030023) |
| 5.1 | 30.8 | GO:0042577 | lipid phosphatase activity(GO:0042577) |
| 5.1 | 15.4 | GO:0008267 | poly-glutamine tract binding(GO:0008267) |
| 5.1 | 35.9 | GO:1990459 | transferrin receptor binding(GO:1990459) |
| 5.1 | 15.3 | GO:0010857 | calcium-dependent protein kinase activity(GO:0010857) |
| 5.0 | 70.2 | GO:0030898 | actin-dependent ATPase activity(GO:0030898) |
| 5.0 | 105.1 | GO:0004714 | transmembrane receptor protein tyrosine kinase activity(GO:0004714) |
| 5.0 | 9.9 | GO:0030272 | 5-formyltetrahydrofolate cyclo-ligase activity(GO:0030272) |
| 5.0 | 24.8 | GO:1904315 | neurotransmitter receptor activity involved in regulation of postsynaptic membrane potential(GO:0099529) transmitter-gated ion channel activity involved in regulation of postsynaptic membrane potential(GO:1904315) |
| 4.9 | 34.6 | GO:0097642 | calcitonin family receptor activity(GO:0097642) |
| 4.9 | 49.4 | GO:0008432 | JUN kinase binding(GO:0008432) |
| 4.9 | 9.9 | GO:0050656 | 3'-phosphoadenosine 5'-phosphosulfate binding(GO:0050656) |
| 4.9 | 39.4 | GO:0051864 | histone demethylase activity (H3-K36 specific)(GO:0051864) |
| 4.9 | 24.6 | GO:0060002 | plus-end directed microfilament motor activity(GO:0060002) |
| 4.9 | 4.9 | GO:0047631 | ADP-ribose diphosphatase activity(GO:0047631) |
| 4.9 | 19.6 | GO:0008526 | phosphatidylinositol transporter activity(GO:0008526) |
| 4.9 | 19.6 | GO:0008431 | vitamin E binding(GO:0008431) |
| 4.9 | 4.9 | GO:0032183 | SUMO binding(GO:0032183) |
| 4.8 | 19.2 | GO:0004706 | JUN kinase kinase kinase activity(GO:0004706) |
| 4.8 | 43.0 | GO:0004985 | opioid receptor activity(GO:0004985) |
| 4.8 | 52.6 | GO:0022820 | potassium:chloride symporter activity(GO:0015379) potassium ion symporter activity(GO:0022820) |
| 4.8 | 28.6 | GO:0004305 | ethanolamine kinase activity(GO:0004305) |
| 4.7 | 14.2 | GO:0015439 | heme-transporting ATPase activity(GO:0015439) |
| 4.7 | 23.7 | GO:0030169 | low-density lipoprotein particle binding(GO:0030169) |
| 4.7 | 9.4 | GO:0015111 | iodide transmembrane transporter activity(GO:0015111) |
| 4.7 | 9.4 | GO:0004515 | nicotinate-nucleotide adenylyltransferase activity(GO:0004515) |
| 4.7 | 28.3 | GO:0030020 | extracellular matrix structural constituent conferring tensile strength(GO:0030020) |
| 4.7 | 112.9 | GO:0004890 | GABA-A receptor activity(GO:0004890) GABA receptor activity(GO:0016917) |
| 4.7 | 4.7 | GO:0004924 | oncostatin-M receptor activity(GO:0004924) |
| 4.7 | 14.1 | GO:0047391 | alkylglycerophosphoethanolamine phosphodiesterase activity(GO:0047391) |
| 4.7 | 4.7 | GO:0043532 | angiostatin binding(GO:0043532) |
| 4.7 | 79.4 | GO:0015467 | G-protein activated inward rectifier potassium channel activity(GO:0015467) |
| 4.7 | 32.7 | GO:0050682 | AF-2 domain binding(GO:0050682) |
| 4.7 | 32.6 | GO:0004112 | cyclic-nucleotide phosphodiesterase activity(GO:0004112) |
| 4.6 | 83.5 | GO:0005247 | voltage-gated chloride channel activity(GO:0005247) |
| 4.6 | 203.9 | GO:0030507 | spectrin binding(GO:0030507) |
| 4.6 | 198.7 | GO:0017080 | sodium channel regulator activity(GO:0017080) |
| 4.6 | 4.6 | GO:0030296 | protein tyrosine kinase activator activity(GO:0030296) |
| 4.6 | 59.7 | GO:0017151 | DEAD/H-box RNA helicase binding(GO:0017151) |
| 4.6 | 13.8 | GO:0000822 | inositol hexakisphosphate binding(GO:0000822) |
| 4.6 | 9.1 | GO:0005168 | neurotrophin TRKA receptor binding(GO:0005168) |
| 4.6 | 50.3 | GO:0005451 | monovalent cation:proton antiporter activity(GO:0005451) |
| 4.6 | 18.2 | GO:0000702 | oxidized base lesion DNA N-glycosylase activity(GO:0000702) |
| 4.5 | 4.5 | GO:0016433 | rRNA (adenine) methyltransferase activity(GO:0016433) |
| 4.5 | 13.6 | GO:0070095 | fructose-6-phosphate binding(GO:0070095) |
| 4.5 | 94.9 | GO:0005112 | Notch binding(GO:0005112) |
| 4.4 | 44.5 | GO:0017166 | vinculin binding(GO:0017166) |
| 4.4 | 53.1 | GO:0045125 | bioactive lipid receptor activity(GO:0045125) |
| 4.4 | 52.9 | GO:0022889 | L-serine transmembrane transporter activity(GO:0015194) serine transmembrane transporter activity(GO:0022889) |
| 4.4 | 132.2 | GO:0005212 | structural constituent of eye lens(GO:0005212) |
| 4.4 | 30.8 | GO:0010385 | double-stranded methylated DNA binding(GO:0010385) |
| 4.4 | 13.2 | GO:0004045 | aminoacyl-tRNA hydrolase activity(GO:0004045) |
| 4.4 | 52.4 | GO:0051011 | microtubule minus-end binding(GO:0051011) |
| 4.4 | 13.1 | GO:0036134 | thromboxane-A synthase activity(GO:0004796) 12-hydroxyheptadecatrienoic acid synthase activity(GO:0036134) |
| 4.4 | 13.1 | GO:0008502 | melatonin receptor activity(GO:0008502) |
| 4.4 | 30.5 | GO:0000150 | recombinase activity(GO:0000150) |
| 4.3 | 13.0 | GO:0004949 | cannabinoid receptor activity(GO:0004949) |
| 4.3 | 17.3 | GO:0008384 | IkappaB kinase activity(GO:0008384) |
| 4.3 | 77.8 | GO:0043522 | leucine zipper domain binding(GO:0043522) |
| 4.3 | 17.3 | GO:0017128 | phospholipid scramblase activity(GO:0017128) |
| 4.3 | 8.6 | GO:0004936 | alpha-adrenergic receptor activity(GO:0004936) alpha2-adrenergic receptor activity(GO:0004938) |
| 4.3 | 12.9 | GO:0032422 | purine-rich negative regulatory element binding(GO:0032422) |
| 4.3 | 21.5 | GO:0015056 | corticotrophin-releasing factor receptor activity(GO:0015056) |
| 4.3 | 17.1 | GO:0016639 | oxidoreductase activity, acting on the CH-NH2 group of donors, NAD or NADP as acceptor(GO:0016639) |
| 4.3 | 38.3 | GO:0001530 | lipopolysaccharide binding(GO:0001530) |
| 4.3 | 76.5 | GO:0043015 | gamma-tubulin binding(GO:0043015) |
| 4.2 | 21.2 | GO:0043548 | phosphatidylinositol 3-kinase binding(GO:0043548) |
| 4.2 | 63.0 | GO:0043560 | insulin receptor substrate binding(GO:0043560) |
| 4.2 | 16.8 | GO:0015220 | choline transmembrane transporter activity(GO:0015220) |
| 4.2 | 16.7 | GO:0047708 | biotinidase activity(GO:0047708) |
| 4.2 | 12.5 | GO:0004605 | phosphatidate cytidylyltransferase activity(GO:0004605) |
| 4.1 | 16.6 | GO:0042500 | aspartic endopeptidase activity, intramembrane cleaving(GO:0042500) |
| 4.1 | 28.9 | GO:0004035 | alkaline phosphatase activity(GO:0004035) |
| 4.1 | 399.7 | GO:0005089 | Rho guanyl-nucleotide exchange factor activity(GO:0005089) |
| 4.1 | 140.0 | GO:0070412 | R-SMAD binding(GO:0070412) |
| 4.1 | 138.4 | GO:0005520 | insulin-like growth factor binding(GO:0005520) |
| 4.1 | 268.5 | GO:0005249 | voltage-gated potassium channel activity(GO:0005249) |
| 4.0 | 44.0 | GO:0019215 | intermediate filament binding(GO:0019215) |
| 4.0 | 16.0 | GO:0019828 | aspartic-type endopeptidase inhibitor activity(GO:0019828) |
| 3.9 | 11.8 | GO:0000182 | rDNA binding(GO:0000182) |
| 3.9 | 11.8 | GO:0016833 | oxo-acid-lyase activity(GO:0016833) |
| 3.9 | 86.0 | GO:0046875 | ephrin receptor binding(GO:0046875) |
| 3.9 | 7.8 | GO:0008184 | glycogen phosphorylase activity(GO:0008184) |
| 3.9 | 23.3 | GO:0003873 | 6-phosphofructo-2-kinase activity(GO:0003873) fructose-2,6-bisphosphate 2-phosphatase activity(GO:0004331) |
| 3.9 | 100.9 | GO:0031489 | myosin V binding(GO:0031489) |
| 3.9 | 19.4 | GO:0016402 | pristanoyl-CoA oxidase activity(GO:0016402) |
| 3.9 | 15.5 | GO:0004449 | isocitrate dehydrogenase (NAD+) activity(GO:0004449) |
| 3.9 | 15.4 | GO:0042030 | ATPase inhibitor activity(GO:0042030) |
| 3.9 | 7.7 | GO:0005072 | transforming growth factor beta receptor, cytoplasmic mediator activity(GO:0005072) |
| 3.8 | 30.7 | GO:0034235 | GPI anchor binding(GO:0034235) |
| 3.8 | 26.9 | GO:0010853 | cyclase activator activity(GO:0010853) guanylate cyclase activator activity(GO:0030250) |
| 3.8 | 26.7 | GO:0032036 | myosin heavy chain binding(GO:0032036) |
| 3.8 | 15.2 | GO:0016971 | flavin-linked sulfhydryl oxidase activity(GO:0016971) thiol oxidase activity(GO:0016972) |
| 3.8 | 3.8 | GO:0016312 | inositol bisphosphate phosphatase activity(GO:0016312) |
| 3.8 | 34.1 | GO:0003836 | beta-galactoside (CMP) alpha-2,3-sialyltransferase activity(GO:0003836) |
| 3.8 | 22.7 | GO:0031705 | bombesin receptor binding(GO:0031705) |
| 3.7 | 18.5 | GO:0097108 | hedgehog family protein binding(GO:0097108) |
| 3.7 | 74.1 | GO:0008093 | cytoskeletal adaptor activity(GO:0008093) |
| 3.7 | 14.8 | GO:0004897 | ciliary neurotrophic factor receptor activity(GO:0004897) |
| 3.7 | 40.6 | GO:0043325 | phosphatidylinositol-3,4-bisphosphate binding(GO:0043325) |
| 3.7 | 29.4 | GO:0004111 | creatine kinase activity(GO:0004111) |
| 3.7 | 22.1 | GO:0008430 | selenium binding(GO:0008430) |
| 3.7 | 58.4 | GO:0004185 | serine-type carboxypeptidase activity(GO:0004185) |
| 3.7 | 32.9 | GO:0033691 | sialic acid binding(GO:0033691) |
| 3.6 | 10.9 | GO:0047977 | hepoxilin-epoxide hydrolase activity(GO:0047977) |
| 3.6 | 7.3 | GO:0022897 | peptide:proton symporter activity(GO:0015333) proton-dependent peptide secondary active transmembrane transporter activity(GO:0022897) |
| 3.6 | 14.5 | GO:0004461 | lactose synthase activity(GO:0004461) |
| 3.6 | 28.9 | GO:0008172 | S-methyltransferase activity(GO:0008172) |
| 3.6 | 10.8 | GO:0015193 | L-proline transmembrane transporter activity(GO:0015193) |
| 3.6 | 39.4 | GO:0004030 | aldehyde dehydrogenase [NAD(P)+] activity(GO:0004030) |
| 3.6 | 17.9 | GO:0034483 | heparan sulfate sulfotransferase activity(GO:0034483) |
| 3.6 | 14.3 | GO:0072349 | modified amino acid transmembrane transporter activity(GO:0072349) |
| 3.6 | 117.7 | GO:0035035 | histone acetyltransferase binding(GO:0035035) |
| 3.6 | 21.3 | GO:0045499 | chemorepellent activity(GO:0045499) |
| 3.6 | 10.7 | GO:0004967 | glucagon receptor activity(GO:0004967) |
| 3.5 | 14.2 | GO:0004140 | dephospho-CoA kinase activity(GO:0004140) |
| 3.5 | 17.6 | GO:0070573 | metallodipeptidase activity(GO:0070573) |
| 3.5 | 10.5 | GO:0004828 | serine-tRNA ligase activity(GO:0004828) |
| 3.5 | 20.9 | GO:0050816 | phosphothreonine binding(GO:0050816) |
| 3.5 | 10.4 | GO:0001665 | alpha-N-acetylgalactosaminide alpha-2,6-sialyltransferase activity(GO:0001665) |
| 3.5 | 86.9 | GO:0004806 | triglyceride lipase activity(GO:0004806) |
| 3.4 | 3.4 | GO:0070569 | uridylyltransferase activity(GO:0070569) |
| 3.4 | 13.8 | GO:0004505 | phenylalanine 4-monooxygenase activity(GO:0004505) |
| 3.4 | 10.3 | GO:0030375 | thyroid hormone receptor activator activity(GO:0010861) thyroid hormone receptor coactivator activity(GO:0030375) |
| 3.4 | 40.9 | GO:0005229 | intracellular calcium activated chloride channel activity(GO:0005229) |
| 3.4 | 20.4 | GO:0046975 | histone methyltransferase activity (H3-K36 specific)(GO:0046975) |
| 3.4 | 40.6 | GO:0086080 | protein binding involved in heterotypic cell-cell adhesion(GO:0086080) |
| 3.4 | 10.1 | GO:0016426 | tRNA (adenine) methyltransferase activity(GO:0016426) tRNA (adenine-N1-)-methyltransferase activity(GO:0016429) |
| 3.4 | 50.3 | GO:0001223 | transcription coactivator binding(GO:0001223) |
| 3.3 | 26.8 | GO:0045545 | syndecan binding(GO:0045545) |
| 3.3 | 13.4 | GO:0017081 | chloride channel regulator activity(GO:0017081) chloride channel inhibitor activity(GO:0019869) |
| 3.3 | 10.0 | GO:0008955 | peptidoglycan glycosyltransferase activity(GO:0008955) |
| 3.3 | 23.2 | GO:0001515 | opioid peptide activity(GO:0001515) |
| 3.3 | 16.5 | GO:0001010 | transcription factor activity, sequence-specific DNA binding transcription factor recruiting(GO:0001010) |
| 3.3 | 19.7 | GO:0004522 | ribonuclease A activity(GO:0004522) |
| 3.3 | 65.4 | GO:0050431 | transforming growth factor beta binding(GO:0050431) |
| 3.3 | 19.6 | GO:0004169 | dolichyl-phosphate-mannose-protein mannosyltransferase activity(GO:0004169) |
| 3.3 | 16.3 | GO:0016934 | inhibitory extracellular ligand-gated ion channel activity(GO:0005237) extracellular-glycine-gated ion channel activity(GO:0016933) extracellular-glycine-gated chloride channel activity(GO:0016934) |
| 3.3 | 3.3 | GO:0001855 | complement component C4b binding(GO:0001855) |
| 3.2 | 13.0 | GO:0008889 | glycerophosphodiester phosphodiesterase activity(GO:0008889) |
| 3.2 | 6.5 | GO:0030151 | molybdenum ion binding(GO:0030151) |
| 3.2 | 142.7 | GO:0005546 | phosphatidylinositol-4,5-bisphosphate binding(GO:0005546) |
| 3.2 | 13.0 | GO:0004468 | lysine N-acetyltransferase activity, acting on acetyl phosphate as donor(GO:0004468) |
| 3.2 | 12.9 | GO:0004952 | dopamine neurotransmitter receptor activity(GO:0004952) |
| 3.2 | 16.1 | GO:0086020 | gap junction channel activity involved in SA node cell-atrial cardiac muscle cell electrical coupling(GO:0086020) gap junction channel activity involved in AV node cell-bundle of His cell electrical coupling(GO:0086077) |
| 3.2 | 41.9 | GO:0008140 | cAMP response element binding protein binding(GO:0008140) |
| 3.2 | 15.9 | GO:0004994 | somatostatin receptor activity(GO:0004994) |
| 3.2 | 9.5 | GO:0015651 | quaternary ammonium group transmembrane transporter activity(GO:0015651) |
| 3.2 | 15.8 | GO:0016717 | oxidoreductase activity, acting on paired donors, with oxidation of a pair of donors resulting in the reduction of molecular oxygen to two molecules of water(GO:0016717) |
| 3.1 | 15.7 | GO:0052740 | 1-acyl-2-lysophosphatidylserine acylhydrolase activity(GO:0052740) |
| 3.1 | 18.8 | GO:0035368 | selenocysteine insertion sequence binding(GO:0035368) |
| 3.1 | 9.4 | GO:0022850 | serotonin-gated cation channel activity(GO:0022850) |
| 3.1 | 65.5 | GO:0001948 | glycoprotein binding(GO:0001948) |
| 3.1 | 341.3 | GO:0004222 | metalloendopeptidase activity(GO:0004222) |
| 3.1 | 9.3 | GO:0030627 | pre-mRNA 5'-splice site binding(GO:0030627) |
| 3.1 | 18.4 | GO:0004679 | AMP-activated protein kinase activity(GO:0004679) |
| 3.0 | 27.4 | GO:0005243 | gap junction channel activity(GO:0005243) |
| 3.0 | 27.4 | GO:0004691 | cAMP-dependent protein kinase activity(GO:0004691) |
| 3.0 | 3.0 | GO:0043199 | sulfate binding(GO:0043199) |
| 3.0 | 3.0 | GO:0042806 | fucose binding(GO:0042806) |
| 3.0 | 18.1 | GO:0008853 | exodeoxyribonuclease III activity(GO:0008853) |
| 3.0 | 6.0 | GO:0000268 | peroxisome targeting sequence binding(GO:0000268) |
| 3.0 | 42.1 | GO:0017110 | nucleoside-diphosphatase activity(GO:0017110) |
| 3.0 | 8.9 | GO:0017057 | 6-phosphogluconolactonase activity(GO:0017057) |
| 3.0 | 11.8 | GO:0003997 | acyl-CoA oxidase activity(GO:0003997) |
| 3.0 | 14.8 | GO:0070815 | peptidyl-lysine 5-dioxygenase activity(GO:0070815) |
| 2.9 | 8.8 | GO:0050501 | hyaluronan synthase activity(GO:0050501) |
| 2.9 | 8.8 | GO:0015275 | stretch-activated, cation-selective, calcium channel activity(GO:0015275) |
| 2.9 | 5.8 | GO:0061629 | RNA polymerase II sequence-specific DNA binding transcription factor binding(GO:0061629) |
| 2.9 | 14.4 | GO:0008420 | CTD phosphatase activity(GO:0008420) |
| 2.9 | 28.8 | GO:0070016 | armadillo repeat domain binding(GO:0070016) |
| 2.9 | 34.4 | GO:0004029 | aldehyde dehydrogenase (NAD) activity(GO:0004029) |
| 2.9 | 20.0 | GO:0015277 | kainate selective glutamate receptor activity(GO:0015277) |
| 2.9 | 2.9 | GO:0004662 | CAAX-protein geranylgeranyltransferase activity(GO:0004662) |
| 2.9 | 2.9 | GO:0004031 | aldehyde oxidase activity(GO:0004031) |
| 2.8 | 56.9 | GO:1990939 | ATP-dependent microtubule motor activity(GO:1990939) |
| 2.8 | 31.1 | GO:0004332 | fructose-bisphosphate aldolase activity(GO:0004332) |
| 2.8 | 11.2 | GO:0004504 | peptidylglycine monooxygenase activity(GO:0004504) peptidylamidoglycolate lyase activity(GO:0004598) |
| 2.8 | 151.7 | GO:0005262 | calcium channel activity(GO:0005262) |
| 2.8 | 19.5 | GO:0015232 | heme transporter activity(GO:0015232) |
| 2.8 | 13.8 | GO:0035014 | phosphatidylinositol 3-kinase regulator activity(GO:0035014) |
| 2.8 | 63.6 | GO:0005521 | lamin binding(GO:0005521) |
| 2.8 | 22.1 | GO:0033130 | acetylcholine receptor binding(GO:0033130) |
| 2.8 | 289.6 | GO:0003707 | steroid hormone receptor activity(GO:0003707) |
| 2.8 | 27.6 | GO:0046790 | virion binding(GO:0046790) |
| 2.7 | 10.9 | GO:0004909 | interleukin-1, Type I, activating receptor activity(GO:0004909) |
| 2.7 | 40.6 | GO:0008349 | MAP kinase kinase kinase kinase activity(GO:0008349) |
| 2.7 | 16.2 | GO:0004430 | 1-phosphatidylinositol 4-kinase activity(GO:0004430) |
| 2.7 | 16.1 | GO:0005157 | macrophage colony-stimulating factor receptor binding(GO:0005157) |
| 2.7 | 216.9 | GO:0005201 | extracellular matrix structural constituent(GO:0005201) |
| 2.7 | 10.7 | GO:0004351 | glutamate decarboxylase activity(GO:0004351) |
| 2.7 | 37.4 | GO:0034979 | NAD-dependent protein deacetylase activity(GO:0034979) |
| 2.6 | 36.9 | GO:0015280 | ligand-gated sodium channel activity(GO:0015280) |
| 2.6 | 34.1 | GO:0005547 | phosphatidylinositol-3,4,5-trisphosphate binding(GO:0005547) |
| 2.6 | 18.2 | GO:0050694 | galactosylceramide sulfotransferase activity(GO:0001733) galactose 3-O-sulfotransferase activity(GO:0050694) |
| 2.6 | 5.1 | GO:0050473 | arachidonate 15-lipoxygenase activity(GO:0050473) |
| 2.6 | 5.1 | GO:0045322 | unmethylated CpG binding(GO:0045322) |
| 2.6 | 7.7 | GO:0004574 | oligo-1,6-glucosidase activity(GO:0004574) |
| 2.5 | 30.6 | GO:0004017 | adenylate kinase activity(GO:0004017) |
| 2.5 | 35.7 | GO:0004065 | arylsulfatase activity(GO:0004065) |
| 2.5 | 15.2 | GO:0008310 | single-stranded DNA 3'-5' exodeoxyribonuclease activity(GO:0008310) |
| 2.5 | 10.1 | GO:0051734 | ATP-dependent polydeoxyribonucleotide 5'-hydroxyl-kinase activity(GO:0046404) polydeoxyribonucleotide kinase activity(GO:0051733) ATP-dependent polynucleotide kinase activity(GO:0051734) |
| 2.5 | 42.8 | GO:0043014 | alpha-tubulin binding(GO:0043014) |
| 2.5 | 37.2 | GO:0048018 | receptor agonist activity(GO:0048018) |
| 2.5 | 12.4 | GO:0047374 | methylumbelliferyl-acetate deacetylase activity(GO:0047374) |
| 2.5 | 24.6 | GO:0004767 | sphingomyelin phosphodiesterase activity(GO:0004767) |
| 2.5 | 4.9 | GO:0047760 | butyrate-CoA ligase activity(GO:0047760) |
| 2.4 | 9.7 | GO:0004963 | follicle-stimulating hormone receptor activity(GO:0004963) |
| 2.4 | 4.9 | GO:0033743 | peptide-methionine (R)-S-oxide reductase activity(GO:0033743) |
| 2.4 | 9.7 | GO:0015184 | L-cystine transmembrane transporter activity(GO:0015184) |
| 2.4 | 12.1 | GO:0004359 | glutaminase activity(GO:0004359) |
| 2.4 | 12.0 | GO:0003906 | DNA-(apurinic or apyrimidinic site) lyase activity(GO:0003906) |
| 2.4 | 28.5 | GO:0043176 | amine binding(GO:0043176) serotonin binding(GO:0051378) |
| 2.4 | 7.1 | GO:0042731 | PH domain binding(GO:0042731) |
| 2.4 | 73.6 | GO:0008395 | steroid hydroxylase activity(GO:0008395) |
| 2.4 | 2.4 | GO:0016701 | oxidoreductase activity, acting on single donors with incorporation of molecular oxygen(GO:0016701) |
| 2.4 | 35.4 | GO:0016174 | NAD(P)H oxidase activity(GO:0016174) |
| 2.4 | 9.4 | GO:0052794 | exo-alpha-(2->3)-sialidase activity(GO:0052794) exo-alpha-(2->6)-sialidase activity(GO:0052795) exo-alpha-(2->8)-sialidase activity(GO:0052796) |
| 2.3 | 4.7 | GO:0004660 | protein farnesyltransferase activity(GO:0004660) |
| 2.3 | 2.3 | GO:0005166 | neurotrophin p75 receptor binding(GO:0005166) |
| 2.3 | 11.7 | GO:0001594 | trace-amine receptor activity(GO:0001594) |
| 2.3 | 72.2 | GO:0001103 | RNA polymerase II repressing transcription factor binding(GO:0001103) |
| 2.3 | 36.8 | GO:0004143 | diacylglycerol kinase activity(GO:0004143) |
| 2.3 | 6.9 | GO:0002046 | opsin binding(GO:0002046) |
| 2.3 | 120.7 | GO:0019905 | syntaxin binding(GO:0019905) |
| 2.3 | 11.3 | GO:0030060 | L-malate dehydrogenase activity(GO:0030060) |
| 2.2 | 4.5 | GO:0032795 | heterotrimeric G-protein binding(GO:0032795) |
| 2.2 | 11.2 | GO:0004705 | JUN kinase activity(GO:0004705) SAP kinase activity(GO:0016909) |
| 2.2 | 4.5 | GO:0019870 | potassium channel inhibitor activity(GO:0019870) |
| 2.2 | 8.9 | GO:0050693 | LBD domain binding(GO:0050693) |
| 2.2 | 2.2 | GO:0004913 | interleukin-4 receptor activity(GO:0004913) |
| 2.2 | 28.8 | GO:0005544 | calcium-dependent phospholipid binding(GO:0005544) |
| 2.2 | 17.7 | GO:0051018 | protein kinase A binding(GO:0051018) |
| 2.2 | 219.1 | GO:0004867 | serine-type endopeptidase inhibitor activity(GO:0004867) |
| 2.2 | 72.9 | GO:0001784 | phosphotyrosine binding(GO:0001784) |
| 2.2 | 6.6 | GO:0003846 | 2-acylglycerol O-acyltransferase activity(GO:0003846) |
| 2.2 | 6.6 | GO:0035241 | protein-arginine omega-N monomethyltransferase activity(GO:0035241) |
| 2.2 | 6.6 | GO:0019166 | trans-2-enoyl-CoA reductase (NADPH) activity(GO:0019166) |
| 2.2 | 15.3 | GO:0016594 | glycine binding(GO:0016594) |
| 2.2 | 45.5 | GO:0003785 | actin monomer binding(GO:0003785) |
| 2.2 | 2.2 | GO:0034056 | estrogen response element binding(GO:0034056) |
| 2.2 | 10.8 | GO:0016427 | tRNA (cytosine) methyltransferase activity(GO:0016427) |
| 2.2 | 12.9 | GO:0005087 | Ran guanyl-nucleotide exchange factor activity(GO:0005087) |
| 2.1 | 17.2 | GO:0030172 | troponin C binding(GO:0030172) |
| 2.1 | 12.8 | GO:0004614 | phosphoglucomutase activity(GO:0004614) |
| 2.1 | 2.1 | GO:0016262 | protein N-acetylglucosaminyltransferase activity(GO:0016262) |
| 2.1 | 23.3 | GO:0045159 | myosin II binding(GO:0045159) |
| 2.1 | 8.5 | GO:0000701 | purine-specific mismatch base pair DNA N-glycosylase activity(GO:0000701) MutLbeta complex binding(GO:0032406) MutSbeta complex binding(GO:0032408) |
| 2.1 | 31.7 | GO:0045236 | CXCR chemokine receptor binding(GO:0045236) |
| 2.1 | 8.3 | GO:0015057 | thrombin receptor activity(GO:0015057) |
| 2.1 | 10.3 | GO:0005068 | transmembrane receptor protein tyrosine kinase adaptor activity(GO:0005068) |
| 2.0 | 47.1 | GO:0045502 | dynein binding(GO:0045502) |
| 2.0 | 26.5 | GO:0005272 | sodium channel activity(GO:0005272) |
| 2.0 | 2.0 | GO:0044323 | retinoic acid-responsive element binding(GO:0044323) |
| 2.0 | 18.1 | GO:0050700 | CARD domain binding(GO:0050700) |
| 2.0 | 12.0 | GO:0004859 | phospholipase inhibitor activity(GO:0004859) |
| 2.0 | 22.0 | GO:0003996 | acyl-CoA ligase activity(GO:0003996) |
| 2.0 | 2.0 | GO:1990239 | steroid hormone binding(GO:1990239) |
| 2.0 | 12.0 | GO:0045029 | UDP-activated nucleotide receptor activity(GO:0045029) |
| 2.0 | 33.8 | GO:0071889 | 14-3-3 protein binding(GO:0071889) |
| 2.0 | 4.0 | GO:0001968 | fibronectin binding(GO:0001968) |
| 2.0 | 61.3 | GO:0008146 | sulfotransferase activity(GO:0008146) |
| 2.0 | 19.6 | GO:0047498 | calcium-dependent phospholipase A2 activity(GO:0047498) |
| 2.0 | 88.3 | GO:0042162 | telomeric DNA binding(GO:0042162) |
| 2.0 | 2.0 | GO:0008253 | 5'-nucleotidase activity(GO:0008253) |
| 2.0 | 21.5 | GO:0097016 | L27 domain binding(GO:0097016) |
| 1.9 | 1.9 | GO:0050613 | delta14-sterol reductase activity(GO:0050613) |
| 1.9 | 35.0 | GO:0022839 | calcium activated cation channel activity(GO:0005227) ion gated channel activity(GO:0022839) |
| 1.9 | 15.6 | GO:0032027 | myosin light chain binding(GO:0032027) |
| 1.9 | 3.9 | GO:0070325 | lipoprotein particle receptor binding(GO:0070325) |
| 1.9 | 1.9 | GO:0035497 | cAMP response element binding(GO:0035497) |
| 1.9 | 9.5 | GO:0005499 | vitamin D binding(GO:0005499) |
| 1.9 | 9.4 | GO:0004925 | prolactin receptor activity(GO:0004925) |
| 1.9 | 11.3 | GO:0034711 | inhibin binding(GO:0034711) |
| 1.9 | 11.2 | GO:0047045 | testosterone 17-beta-dehydrogenase (NADP+) activity(GO:0047045) |
| 1.8 | 5.5 | GO:0034353 | RNA pyrophosphohydrolase activity(GO:0034353) |
| 1.8 | 225.9 | GO:0017137 | Rab GTPase binding(GO:0017137) |
| 1.8 | 5.5 | GO:0005165 | neurotrophin receptor binding(GO:0005165) |
| 1.8 | 3.6 | GO:0001134 | transcription factor activity, transcription factor recruiting(GO:0001134) |
| 1.8 | 5.5 | GO:0031685 | adenosine receptor binding(GO:0031685) |
| 1.8 | 28.9 | GO:0008239 | dipeptidyl-peptidase activity(GO:0008239) |
| 1.8 | 23.4 | GO:0043295 | glutathione binding(GO:0043295) |
| 1.8 | 3.6 | GO:0070052 | collagen V binding(GO:0070052) |
| 1.8 | 354.4 | GO:0005085 | guanyl-nucleotide exchange factor activity(GO:0005085) |
| 1.8 | 19.4 | GO:0008066 | glutamate receptor activity(GO:0008066) |
| 1.7 | 7.0 | GO:0022865 | transmembrane electron transfer carrier(GO:0022865) |
| 1.7 | 3.5 | GO:0016019 | peptidoglycan receptor activity(GO:0016019) |
| 1.7 | 3.5 | GO:0005375 | copper ion transmembrane transporter activity(GO:0005375) |
| 1.7 | 34.3 | GO:0005109 | frizzled binding(GO:0005109) |
| 1.7 | 162.8 | GO:0003705 | transcription factor activity, RNA polymerase II distal enhancer sequence-specific binding(GO:0003705) |
| 1.6 | 16.2 | GO:0005094 | Rho GDP-dissociation inhibitor activity(GO:0005094) |
| 1.6 | 24.3 | GO:0008417 | fucosyltransferase activity(GO:0008417) |
| 1.6 | 4.9 | GO:0034041 | sterol-transporting ATPase activity(GO:0034041) |
| 1.6 | 6.5 | GO:0016499 | orexin receptor activity(GO:0016499) |
| 1.6 | 17.6 | GO:0015368 | calcium:cation antiporter activity(GO:0015368) |
| 1.6 | 4.8 | GO:0042954 | lipoprotein transporter activity(GO:0042954) |
| 1.6 | 3.2 | GO:0043891 | glyceraldehyde-3-phosphate dehydrogenase (NAD+) (phosphorylating) activity(GO:0004365) glyceraldehyde-3-phosphate dehydrogenase (NAD(P)+) (phosphorylating) activity(GO:0043891) |
| 1.6 | 23.8 | GO:0009881 | photoreceptor activity(GO:0009881) |
| 1.6 | 7.9 | GO:0004105 | choline-phosphate cytidylyltransferase activity(GO:0004105) |
| 1.6 | 11.0 | GO:0051787 | misfolded protein binding(GO:0051787) |
| 1.6 | 20.3 | GO:0001011 | transcription factor activity, sequence-specific DNA binding, RNA polymerase recruiting(GO:0001011) transcription factor activity, TFIIB-class binding(GO:0001087) TFIIB-class transcription factor binding(GO:0001093) |
| 1.6 | 3.1 | GO:0098770 | FBXO family protein binding(GO:0098770) |
| 1.6 | 3.1 | GO:0070888 | E-box binding(GO:0070888) |
| 1.5 | 13.9 | GO:0016494 | C-X-C chemokine receptor activity(GO:0016494) |
| 1.5 | 1.5 | GO:0004935 | adrenergic receptor activity(GO:0004935) |
| 1.5 | 4.6 | GO:0001596 | angiotensin type I receptor activity(GO:0001596) |
| 1.5 | 7.6 | GO:0019531 | oxalate transmembrane transporter activity(GO:0019531) |
| 1.5 | 4.5 | GO:0008523 | sodium-dependent multivitamin transmembrane transporter activity(GO:0008523) |
| 1.5 | 60.5 | GO:0008138 | protein tyrosine/serine/threonine phosphatase activity(GO:0008138) |
| 1.5 | 33.9 | GO:0004709 | MAP kinase kinase kinase activity(GO:0004709) |
| 1.5 | 4.4 | GO:0008532 | N-acetyllactosaminide beta-1,3-N-acetylglucosaminyltransferase activity(GO:0008532) |
| 1.5 | 10.3 | GO:0004439 | phosphatidylinositol-4,5-bisphosphate 5-phosphatase activity(GO:0004439) |
| 1.5 | 111.5 | GO:0004860 | protein kinase inhibitor activity(GO:0004860) |
| 1.5 | 276.0 | GO:0005096 | GTPase activator activity(GO:0005096) |
| 1.4 | 43.3 | GO:0097200 | cysteine-type endopeptidase activity involved in execution phase of apoptosis(GO:0097200) |
| 1.4 | 20.0 | GO:0016805 | dipeptidase activity(GO:0016805) |
| 1.4 | 11.4 | GO:0004957 | prostaglandin E receptor activity(GO:0004957) |
| 1.4 | 5.5 | GO:0030274 | LIM domain binding(GO:0030274) |
| 1.4 | 4.1 | GO:0046997 | sarcosine dehydrogenase activity(GO:0008480) oxidoreductase activity, acting on the CH-NH group of donors, flavin as acceptor(GO:0046997) |
| 1.4 | 63.8 | GO:0044325 | ion channel binding(GO:0044325) |
| 1.3 | 1.3 | GO:0008376 | acetylgalactosaminyltransferase activity(GO:0008376) |
| 1.3 | 1.3 | GO:0098847 | sequence-specific single stranded DNA binding(GO:0098847) |
| 1.3 | 215.1 | GO:0008017 | microtubule binding(GO:0008017) |
| 1.3 | 2.6 | GO:0031893 | vasopressin receptor binding(GO:0031893) |
| 1.3 | 4.0 | GO:0080019 | fatty-acyl-CoA reductase (alcohol-forming) activity(GO:0080019) |
| 1.3 | 13.0 | GO:0052742 | phosphatidylinositol kinase activity(GO:0052742) |
| 1.3 | 3.9 | GO:0047273 | galactosylgalactosylglucosylceramide beta-D-acetylgalactosaminyltransferase activity(GO:0047273) |
| 1.3 | 6.4 | GO:0060230 | lipoprotein lipase activator activity(GO:0060230) |
| 1.3 | 13.8 | GO:0035381 | extracellular ATP-gated cation channel activity(GO:0004931) ATP-gated ion channel activity(GO:0035381) |
| 1.3 | 65.2 | GO:0004712 | protein serine/threonine/tyrosine kinase activity(GO:0004712) |
| 1.2 | 8.7 | GO:0004198 | calcium-dependent cysteine-type endopeptidase activity(GO:0004198) |
| 1.2 | 8.7 | GO:0070891 | lipoteichoic acid binding(GO:0070891) |
| 1.2 | 29.8 | GO:0005184 | neuropeptide hormone activity(GO:0005184) |
| 1.2 | 320.0 | GO:0004930 | G-protein coupled receptor activity(GO:0004930) |
| 1.2 | 9.8 | GO:0016406 | carnitine O-acyltransferase activity(GO:0016406) |
| 1.2 | 8.5 | GO:0032454 | histone demethylase activity (H3-K9 specific)(GO:0032454) |
| 1.2 | 14.6 | GO:0000149 | SNARE binding(GO:0000149) |
| 1.2 | 9.7 | GO:1990405 | protein antigen binding(GO:1990405) |
| 1.2 | 6.0 | GO:0036122 | BMP binding(GO:0036122) |
| 1.2 | 1.2 | GO:0032142 | single guanine insertion binding(GO:0032142) |
| 1.2 | 2.3 | GO:0042289 | MHC class II protein binding(GO:0042289) |
| 1.2 | 5.8 | GO:1901567 | icosanoid binding(GO:0050542) arachidonic acid binding(GO:0050544) fatty acid derivative binding(GO:1901567) |
| 1.2 | 3.5 | GO:0003976 | UDP-N-acetylglucosamine-lysosomal-enzyme N-acetylglucosaminephosphotransferase activity(GO:0003976) |
| 1.1 | 11.4 | GO:0042809 | vitamin D receptor binding(GO:0042809) |
| 1.1 | 35.1 | GO:0005044 | scavenger receptor activity(GO:0005044) |
| 1.1 | 2.2 | GO:0051575 | 5'-deoxyribose-5-phosphate lyase activity(GO:0051575) |
| 1.1 | 11.2 | GO:0031683 | G-protein beta/gamma-subunit complex binding(GO:0031683) |
| 1.1 | 55.7 | GO:0048306 | calcium-dependent protein binding(GO:0048306) |
| 1.1 | 7.8 | GO:0008656 | cysteine-type endopeptidase activator activity involved in apoptotic process(GO:0008656) |
| 1.1 | 3.3 | GO:0051377 | mannose-ethanolamine phosphotransferase activity(GO:0051377) |
| 1.1 | 3.2 | GO:0004645 | phosphorylase activity(GO:0004645) |
| 1.1 | 4.3 | GO:0030976 | thiamine pyrophosphate binding(GO:0030976) |
| 1.1 | 2.1 | GO:0070653 | high-density lipoprotein particle receptor binding(GO:0070653) |
| 1.0 | 53.3 | GO:0008080 | N-acetyltransferase activity(GO:0008080) |
| 1.0 | 2.0 | GO:0004797 | thymidine kinase activity(GO:0004797) |
| 1.0 | 5.9 | GO:0052650 | NADP-retinol dehydrogenase activity(GO:0052650) |
| 1.0 | 15.8 | GO:0004181 | metallocarboxypeptidase activity(GO:0004181) |
| 1.0 | 8.8 | GO:0050840 | extracellular matrix binding(GO:0050840) |
| 1.0 | 18.6 | GO:0004602 | glutathione peroxidase activity(GO:0004602) |
| 1.0 | 11.8 | GO:0005070 | SH3/SH2 adaptor activity(GO:0005070) |
| 1.0 | 4.9 | GO:0008113 | peptide-methionine (S)-S-oxide reductase activity(GO:0008113) |
| 1.0 | 2.9 | GO:0016841 | ammonia-lyase activity(GO:0016841) |
| 1.0 | 274.4 | GO:0001077 | transcriptional activator activity, RNA polymerase II core promoter proximal region sequence-specific binding(GO:0001077) |
| 0.9 | 21.8 | GO:0015276 | ligand-gated ion channel activity(GO:0015276) ligand-gated channel activity(GO:0022834) |
| 0.9 | 13.2 | GO:0005518 | collagen binding(GO:0005518) |
| 0.9 | 2.8 | GO:0003980 | UDP-glucose:glycoprotein glucosyltransferase activity(GO:0003980) |
| 0.9 | 17.7 | GO:0005484 | SNAP receptor activity(GO:0005484) |
| 0.9 | 2.8 | GO:0045118 | azole transporter activity(GO:0045118) azole transmembrane transporter activity(GO:1901474) |
| 0.9 | 3.7 | GO:0015375 | glycine:sodium symporter activity(GO:0015375) |
| 0.9 | 11.0 | GO:0038191 | neuropilin binding(GO:0038191) |
| 0.9 | 7.2 | GO:0032451 | demethylase activity(GO:0032451) |
| 0.9 | 1.8 | GO:0005151 | interleukin-1, Type II receptor binding(GO:0005151) |
| 0.9 | 30.6 | GO:0008374 | O-acyltransferase activity(GO:0008374) |
| 0.9 | 3.6 | GO:0035325 | Toll-like receptor binding(GO:0035325) |
| 0.9 | 1.8 | GO:1990430 | extracellular matrix protein binding(GO:1990430) |
| 0.9 | 12.5 | GO:0005452 | inorganic anion exchanger activity(GO:0005452) |
| 0.9 | 29.4 | GO:0016709 | oxidoreductase activity, acting on paired donors, with incorporation or reduction of molecular oxygen, NAD(P)H as one donor, and incorporation of one atom of oxygen(GO:0016709) |
| 0.9 | 2.7 | GO:0070728 | leucine binding(GO:0070728) |
| 0.9 | 5.3 | GO:0045569 | TRAIL binding(GO:0045569) |
| 0.9 | 7.9 | GO:0047499 | calcium-independent phospholipase A2 activity(GO:0047499) |
| 0.9 | 4.4 | GO:0004910 | interleukin-1, Type II, blocking receptor activity(GO:0004910) |
| 0.9 | 432.3 | GO:0005509 | calcium ion binding(GO:0005509) |
| 0.9 | 12.1 | GO:0008519 | ammonium transmembrane transporter activity(GO:0008519) |
| 0.9 | 8.6 | GO:0001730 | 2'-5'-oligoadenylate synthetase activity(GO:0001730) |
| 0.8 | 5.0 | GO:0003696 | satellite DNA binding(GO:0003696) |
| 0.8 | 1.7 | GO:0016715 | oxidoreductase activity, acting on paired donors, with incorporation or reduction of molecular oxygen, reduced ascorbate as one donor, and incorporation of one atom of oxygen(GO:0016715) |
| 0.8 | 6.6 | GO:0030275 | LRR domain binding(GO:0030275) |
| 0.8 | 51.6 | GO:0005179 | hormone activity(GO:0005179) |
| 0.8 | 5.6 | GO:0035312 | 5'-3' exodeoxyribonuclease activity(GO:0035312) |
| 0.8 | 11.1 | GO:0001105 | RNA polymerase II transcription coactivator activity(GO:0001105) |
| 0.8 | 9.4 | GO:0001104 | RNA polymerase II transcription cofactor activity(GO:0001104) |
| 0.8 | 4.7 | GO:0070008 | serine-type exopeptidase activity(GO:0070008) |
| 0.8 | 151.5 | GO:0004252 | serine-type endopeptidase activity(GO:0004252) |
| 0.8 | 0.8 | GO:0016004 | phospholipase activator activity(GO:0016004) lipase activator activity(GO:0060229) |
| 0.8 | 0.8 | GO:0048185 | activin binding(GO:0048185) |
| 0.7 | 3.7 | GO:0008440 | inositol-1,4,5-trisphosphate 3-kinase activity(GO:0008440) |
| 0.7 | 2.2 | GO:0003916 | DNA topoisomerase activity(GO:0003916) |
| 0.7 | 4.4 | GO:0031419 | cobalamin binding(GO:0031419) |
| 0.7 | 34.0 | GO:0008013 | beta-catenin binding(GO:0008013) |
| 0.7 | 1.4 | GO:0016670 | oxidoreductase activity, acting on a sulfur group of donors, oxygen as acceptor(GO:0016670) |
| 0.7 | 5.7 | GO:0070330 | oxidoreductase activity, acting on paired donors, with incorporation or reduction of molecular oxygen, reduced flavin or flavoprotein as one donor, and incorporation of one atom of oxygen(GO:0016712) aromatase activity(GO:0070330) |
| 0.7 | 6.4 | GO:0003910 | DNA ligase (ATP) activity(GO:0003910) |
| 0.7 | 15.6 | GO:0051393 | alpha-actinin binding(GO:0051393) |
| 0.7 | 10.5 | GO:0070566 | adenylyltransferase activity(GO:0070566) |
| 0.7 | 9.0 | GO:0005154 | epidermal growth factor receptor binding(GO:0005154) |
| 0.7 | 5.5 | GO:0004565 | beta-galactosidase activity(GO:0004565) |
| 0.7 | 4.8 | GO:0019200 | carbohydrate kinase activity(GO:0019200) |
| 0.7 | 4.8 | GO:0004908 | interleukin-1 receptor activity(GO:0004908) |
| 0.7 | 2.0 | GO:0003835 | beta-galactoside alpha-2,6-sialyltransferase activity(GO:0003835) |
| 0.7 | 1.3 | GO:0031013 | troponin I binding(GO:0031013) |
| 0.7 | 2.7 | GO:0003886 | DNA (cytosine-5-)-methyltransferase activity(GO:0003886) |
| 0.6 | 3.2 | GO:0003796 | lysozyme activity(GO:0003796) |
| 0.6 | 2.6 | GO:0003827 | alpha-1,3-mannosylglycoprotein 2-beta-N-acetylglucosaminyltransferase activity(GO:0003827) |
| 0.6 | 2.6 | GO:0008112 | nicotinamide N-methyltransferase activity(GO:0008112) pyridine N-methyltransferase activity(GO:0030760) |
| 0.6 | 35.7 | GO:0035064 | methylated histone binding(GO:0035064) |
| 0.6 | 2.5 | GO:0008158 | hedgehog receptor activity(GO:0008158) |
| 0.6 | 2.4 | GO:0042020 | interleukin-23 binding(GO:0042019) interleukin-23 receptor activity(GO:0042020) |
| 0.6 | 0.6 | GO:0015295 | solute:proton symporter activity(GO:0015295) |
| 0.6 | 0.6 | GO:0001007 | transcription factor activity, RNA polymerase III transcription factor binding(GO:0001007) |
| 0.6 | 1.7 | GO:0003829 | beta-1,3-galactosyl-O-glycosyl-glycoprotein beta-1,6-N-acetylglucosaminyltransferase activity(GO:0003829) |
| 0.6 | 3.5 | GO:0003774 | motor activity(GO:0003774) |
| 0.6 | 3.4 | GO:0005254 | chloride channel activity(GO:0005254) |
| 0.6 | 3.4 | GO:0042805 | actinin binding(GO:0042805) |
| 0.6 | 474.2 | GO:0003700 | nucleic acid binding transcription factor activity(GO:0001071) transcription factor activity, sequence-specific DNA binding(GO:0003700) |
| 0.5 | 4.4 | GO:0055131 | C3HC4-type RING finger domain binding(GO:0055131) |
| 0.5 | 7.1 | GO:0042056 | chemoattractant activity(GO:0042056) |
| 0.5 | 1.1 | GO:0032135 | DNA insertion or deletion binding(GO:0032135) single base insertion or deletion binding(GO:0032138) |
| 0.5 | 4.2 | GO:0015459 | potassium channel regulator activity(GO:0015459) |
| 0.5 | 2.6 | GO:0005326 | neurotransmitter transporter activity(GO:0005326) |
| 0.5 | 4.1 | GO:0004568 | chitinase activity(GO:0004568) chitin binding(GO:0008061) |
| 0.5 | 3.1 | GO:0048039 | ubiquinone binding(GO:0048039) |
| 0.5 | 2.0 | GO:0004525 | ribonuclease III activity(GO:0004525) double-stranded RNA-specific ribonuclease activity(GO:0032296) |
| 0.5 | 1.5 | GO:0004376 | glycolipid mannosyltransferase activity(GO:0004376) |
| 0.5 | 13.1 | GO:0046961 | proton-transporting ATPase activity, rotational mechanism(GO:0046961) |
| 0.5 | 3.3 | GO:0070181 | small ribosomal subunit rRNA binding(GO:0070181) |
| 0.5 | 31.6 | GO:0035091 | phosphatidylinositol binding(GO:0035091) |
| 0.5 | 5.5 | GO:0008190 | eukaryotic initiation factor 4E binding(GO:0008190) |
| 0.4 | 0.9 | GO:0035650 | AP-1 adaptor complex binding(GO:0035650) |
| 0.4 | 11.5 | GO:0004364 | glutathione transferase activity(GO:0004364) |
| 0.4 | 8.4 | GO:0017022 | myosin binding(GO:0017022) |
| 0.4 | 1.7 | GO:0030492 | hemoglobin binding(GO:0030492) |
| 0.4 | 2.5 | GO:0008499 | UDP-galactose:beta-N-acetylglucosamine beta-1,3-galactosyltransferase activity(GO:0008499) |
| 0.4 | 2.5 | GO:0035198 | miRNA binding(GO:0035198) |
| 0.4 | 2.3 | GO:0035800 | deubiquitinase activator activity(GO:0035800) |
| 0.4 | 10.0 | GO:0008009 | chemokine activity(GO:0008009) |
| 0.4 | 3.7 | GO:0008428 | ribonuclease inhibitor activity(GO:0008428) |
| 0.3 | 0.3 | GO:0016713 | oxidoreductase activity, acting on paired donors, with incorporation or reduction of molecular oxygen, reduced iron-sulfur protein as one donor, and incorporation of one atom of oxygen(GO:0016713) |
| 0.3 | 1.7 | GO:0015643 | toxic substance binding(GO:0015643) |
| 0.3 | 1.7 | GO:0039706 | co-receptor binding(GO:0039706) |
| 0.3 | 1.4 | GO:0008336 | gamma-butyrobetaine dioxygenase activity(GO:0008336) |
| 0.3 | 2.3 | GO:0035614 | snRNA stem-loop binding(GO:0035614) |
| 0.3 | 1.0 | GO:0015361 | low-affinity sodium:dicarboxylate symporter activity(GO:0015361) |
| 0.3 | 0.9 | GO:0016434 | rRNA (cytosine) methyltransferase activity(GO:0016434) |
| 0.3 | 4.6 | GO:0030742 | GTP-dependent protein binding(GO:0030742) |
| 0.3 | 0.9 | GO:0070283 | lipoate synthase activity(GO:0016992) radical SAM enzyme activity(GO:0070283) |
| 0.3 | 1.2 | GO:0016889 | endodeoxyribonuclease activity, producing 3'-phosphomonoesters(GO:0016889) |
| 0.3 | 1.4 | GO:0000828 | inositol-1,3,4,5,6-pentakisphosphate kinase activity(GO:0000827) inositol hexakisphosphate kinase activity(GO:0000828) inositol heptakisphosphate kinase activity(GO:0000829) inositol hexakisphosphate 5-kinase activity(GO:0000832) inositol hexakisphosphate 1-kinase activity(GO:0052723) inositol hexakisphosphate 3-kinase activity(GO:0052724) |
| 0.3 | 1.1 | GO:0008466 | glycogenin glucosyltransferase activity(GO:0008466) |
| 0.3 | 1.9 | GO:0003810 | protein-glutamine gamma-glutamyltransferase activity(GO:0003810) |
| 0.3 | 1.1 | GO:0005412 | glucose:sodium symporter activity(GO:0005412) |
| 0.3 | 1.0 | GO:0005477 | pyruvate secondary active transmembrane transporter activity(GO:0005477) |
| 0.3 | 0.3 | GO:0000990 | transcription factor activity, core RNA polymerase binding(GO:0000990) |
| 0.3 | 3.3 | GO:0032395 | MHC class II receptor activity(GO:0032395) |
| 0.2 | 14.2 | GO:0005516 | calmodulin binding(GO:0005516) |
| 0.2 | 1.9 | GO:1990381 | ubiquitin-specific protease binding(GO:1990381) |
| 0.2 | 0.5 | GO:0005104 | fibroblast growth factor receptor binding(GO:0005104) |
| 0.2 | 3.1 | GO:0036374 | glutathione hydrolase activity(GO:0036374) |
| 0.2 | 0.8 | GO:0051916 | granulocyte colony-stimulating factor binding(GO:0051916) |
| 0.2 | 2.7 | GO:0004190 | aspartic-type endopeptidase activity(GO:0004190) aspartic-type peptidase activity(GO:0070001) |
| 0.2 | 0.6 | GO:0071209 | U7 snRNA binding(GO:0071209) |
| 0.2 | 0.4 | GO:0004000 | adenosine deaminase activity(GO:0004000) |
| 0.2 | 0.4 | GO:0016422 | mRNA (2'-O-methyladenosine-N6-)-methyltransferase activity(GO:0016422) |
| 0.2 | 0.9 | GO:0032050 | clathrin heavy chain binding(GO:0032050) |
| 0.2 | 3.7 | GO:0005035 | tumor necrosis factor-activated receptor activity(GO:0005031) death receptor activity(GO:0005035) |
| 0.2 | 0.6 | GO:0042015 | interleukin-20 binding(GO:0042015) |
| 0.2 | 1.2 | GO:0042043 | neurexin family protein binding(GO:0042043) |
| 0.1 | 0.5 | GO:0070087 | chromo shadow domain binding(GO:0070087) |
| 0.1 | 1.2 | GO:0016813 | hydrolase activity, acting on carbon-nitrogen (but not peptide) bonds, in linear amidines(GO:0016813) |
| 0.1 | 7.9 | GO:0016820 | hydrolase activity, acting on acid anhydrides, catalyzing transmembrane movement of substances(GO:0016820) |
| 0.1 | 1.6 | GO:0005149 | interleukin-1 receptor binding(GO:0005149) |
| 0.1 | 1.7 | GO:0004497 | monooxygenase activity(GO:0004497) |
| 0.1 | 2.7 | GO:0015347 | sodium-independent organic anion transmembrane transporter activity(GO:0015347) |
| 0.1 | 0.5 | GO:0031435 | mitogen-activated protein kinase kinase kinase binding(GO:0031435) |
| 0.1 | 0.7 | GO:0051033 | nucleic acid transmembrane transporter activity(GO:0051032) RNA transmembrane transporter activity(GO:0051033) |
| 0.1 | 0.5 | GO:0030553 | cGMP binding(GO:0030553) |
| 0.1 | 0.9 | GO:0016724 | ferroxidase activity(GO:0004322) oxidoreductase activity, oxidizing metal ions, oxygen as acceptor(GO:0016724) |
| 0.1 | 0.8 | GO:0032396 | inhibitory MHC class I receptor activity(GO:0032396) |
| 0.1 | 0.3 | GO:0016405 | CoA-ligase activity(GO:0016405) |
| 0.1 | 0.4 | GO:0102336 | fatty acid elongase activity(GO:0009922) 3-oxo-arachidoyl-CoA synthase activity(GO:0102336) 3-oxo-cerotoyl-CoA synthase activity(GO:0102337) 3-oxo-lignoceronyl-CoA synthase activity(GO:0102338) |
| 0.1 | 0.3 | GO:0005415 | nucleoside:sodium symporter activity(GO:0005415) |
| 0.1 | 0.1 | GO:0016882 | cyclo-ligase activity(GO:0016882) |
| 0.1 | 0.5 | GO:0019864 | IgG binding(GO:0019864) |
| 0.0 | 0.2 | GO:0008109 | N-acetyllactosaminide beta-1,6-N-acetylglucosaminyltransferase activity(GO:0008109) |
| 0.0 | 0.2 | GO:0034596 | phosphatidylinositol phosphate 4-phosphatase activity(GO:0034596) |
| 0.0 | 0.1 | GO:0017129 | triglyceride binding(GO:0017129) |
| 0.0 | 0.1 | GO:0043495 | protein anchor(GO:0043495) |
| 0.0 | 0.5 | GO:0030374 | ligand-dependent nuclear receptor transcription coactivator activity(GO:0030374) |
| 0.0 | 0.0 | GO:0047223 | beta-1,3-galactosyl-O-glycosyl-glycoprotein beta-1,3-N-acetylglucosaminyltransferase activity(GO:0047223) |
Gene overrepresentation in C2:CP category:
| Log-likelihood per target | Total log-likelihood | Term | Description |
|---|---|---|---|
| 22.4 | 22.4 | NABA BASEMENT MEMBRANES | Genes encoding structural components of basement membranes |
| 18.6 | 37.2 | PID VEGFR1 PATHWAY | VEGFR1 specific signals |
| 16.5 | 33.0 | PID IFNG PATHWAY | IFN-gamma pathway |
| 12.8 | 460.4 | ST WNT CA2 CYCLIC GMP PATHWAY | Wnt/Ca2+/cyclic GMP signaling. |
| 12.6 | 50.4 | PID ARF6 DOWNSTREAM PATHWAY | Arf6 downstream pathway |
| 8.8 | 17.6 | SA TRKA RECEPTOR | The TrkA receptor binds nerve growth factor to activate MAP kinase pathways and promote cell growth. |
| 8.5 | 85.2 | PID PI3K PLC TRK PATHWAY | Trk receptor signaling mediated by PI3K and PLC-gamma |
| 8.3 | 83.2 | PID INTEGRIN A4B1 PATHWAY | Alpha4 beta1 integrin signaling events |
| 8.2 | 24.7 | PID PDGFRA PATHWAY | PDGFR-alpha signaling pathway |
| 7.6 | 189.9 | PID LPA4 PATHWAY | LPA4-mediated signaling events |
| 7.6 | 334.2 | ST WNT BETA CATENIN PATHWAY | Wnt/beta-catenin Pathway |
| 6.7 | 287.6 | PID S1P S1P3 PATHWAY | S1P3 pathway |
| 6.2 | 172.7 | ST GAQ PATHWAY | G alpha q Pathway |
| 6.0 | 282.7 | PID RAS PATHWAY | Regulation of Ras family activation |
| 5.7 | 268.7 | NABA COLLAGENS | Genes encoding collagen proteins |
| 5.5 | 5.5 | PID S1P S1P2 PATHWAY | S1P2 pathway |
| 5.3 | 210.7 | SIG CD40PATHWAYMAP | Genes related to CD40 signaling |
| 5.2 | 146.2 | PID WNT SIGNALING PATHWAY | Wnt signaling network |
| 5.2 | 348.1 | PID ERBB1 INTERNALIZATION PATHWAY | Internalization of ErbB1 |
| 4.8 | 72.6 | PID EPHA FWDPATHWAY | EPHA forward signaling |
| 4.7 | 118.1 | PID INTEGRIN5 PATHWAY | Beta5 beta6 beta7 and beta8 integrin cell surface interactions |
| 4.6 | 23.2 | PID LYMPH ANGIOGENESIS PATHWAY | VEGFR3 signaling in lymphatic endothelium |
| 4.6 | 73.9 | PID ALK2 PATHWAY | ALK2 signaling events |
| 4.5 | 22.7 | SA G2 AND M PHASES | Cdc25 activates the cdc2/cyclin B complex to induce the G2/M transition. |
| 4.5 | 72.1 | ST G ALPHA S PATHWAY | G alpha s Pathway |
| 4.2 | 105.9 | PID INTEGRIN1 PATHWAY | Beta1 integrin cell surface interactions |
| 4.1 | 8.3 | PID THROMBIN PAR4 PATHWAY | PAR4-mediated thrombin signaling events |
| 4.0 | 12.1 | PID CD8 TCR PATHWAY | TCR signaling in naïve CD8+ T cells |
| 4.0 | 7.9 | SA PROGRAMMED CELL DEATH | Programmed cell death, or apoptosis, eliminates damaged or unneeded cells. |
| 4.0 | 51.4 | PID GLYPICAN 1PATHWAY | Glypican 1 network |
| 3.9 | 282.0 | PID FGF PATHWAY | FGF signaling pathway |
| 3.8 | 184.8 | PID HIF2PATHWAY | HIF-2-alpha transcription factor network |
| 3.6 | 69.0 | SIG IL4RECEPTOR IN B LYPHOCYTES | Genes related to IL4 rceptor signaling in B lymphocytes |
| 3.6 | 183.4 | PID TCR CALCIUM PATHWAY | Calcium signaling in the CD4+ TCR pathway |
| 3.6 | 32.2 | PID PI3KCI PATHWAY | Class I PI3K signaling events |
| 3.4 | 769.8 | NABA ECM GLYCOPROTEINS | Genes encoding structural ECM glycoproteins |
| 3.4 | 34.0 | PID FAK PATHWAY | Signaling events mediated by focal adhesion kinase |
| 3.3 | 146.7 | PID FRA PATHWAY | Validated transcriptional targets of AP1 family members Fra1 and Fra2 |
| 3.2 | 102.0 | PID NETRIN PATHWAY | Netrin-mediated signaling events |
| 3.1 | 6.3 | SA PTEN PATHWAY | PTEN is a tumor suppressor that dephosphorylates the lipid messenger phosphatidylinositol triphosphate. |
| 3.1 | 125.3 | ST JNK MAPK PATHWAY | JNK MAPK Pathway |
| 3.1 | 27.6 | PID INSULIN GLUCOSE PATHWAY | Insulin-mediated glucose transport |
| 2.9 | 20.2 | PID AR NONGENOMIC PATHWAY | Nongenotropic Androgen signaling |
| 2.9 | 117.8 | PID RXR VDR PATHWAY | RXR and RAR heterodimerization with other nuclear receptor |
| 2.8 | 96.5 | PID ALPHA SYNUCLEIN PATHWAY | Alpha-synuclein signaling |
| 2.8 | 13.9 | ST STAT3 PATHWAY | STAT3 Pathway |
| 2.8 | 121.9 | PID SHP2 PATHWAY | SHP2 signaling |
| 2.8 | 44.2 | PID ERBB1 RECEPTOR PROXIMAL PATHWAY | EGF receptor (ErbB1) signaling pathway |
| 2.7 | 21.8 | ST MYOCYTE AD PATHWAY | Myocyte Adrenergic Pathway is a specific case of the generalized Adrenergic Pathway. |
| 2.6 | 115.6 | NABA CORE MATRISOME | Ensemble of genes encoding core extracellular matrix including ECM glycoproteins, collagens and proteoglycans |
| 2.5 | 43.1 | ST G ALPHA I PATHWAY | G alpha i Pathway |
| 2.5 | 296.9 | PID MYC REPRESS PATHWAY | Validated targets of C-MYC transcriptional repression |
| 2.5 | 32.1 | PID PDGFRB PATHWAY | PDGFR-beta signaling pathway |
| 2.4 | 58.7 | PID REELIN PATHWAY | Reelin signaling pathway |
| 2.4 | 29.1 | ST GA13 PATHWAY | G alpha 13 Pathway |
| 2.4 | 585.3 | NABA ECM REGULATORS | Genes encoding enzymes and their regulators involved in the remodeling of the extracellular matrix |
| 2.4 | 51.8 | PID RET PATHWAY | Signaling events regulated by Ret tyrosine kinase |
| 2.3 | 93.6 | PID ARF6 PATHWAY | Arf6 signaling events |
| 2.3 | 160.0 | PID RHOA REG PATHWAY | Regulation of RhoA activity |
| 2.2 | 42.6 | PID HEDGEHOG 2PATHWAY | Signaling events mediated by the Hedgehog family |
| 2.2 | 26.2 | PID ERBB2 ERBB3 PATHWAY | ErbB2/ErbB3 signaling events |
| 2.1 | 25.3 | PID NEPHRIN NEPH1 PATHWAY | Nephrin/Neph1 signaling in the kidney podocyte |
| 2.1 | 151.0 | PID P75 NTR PATHWAY | p75(NTR)-mediated signaling |
| 2.0 | 54.4 | PID HDAC CLASSIII PATHWAY | Signaling events mediated by HDAC Class III |
| 2.0 | 2.0 | ST JAK STAT PATHWAY | Jak-STAT Pathway |
| 1.9 | 11.7 | ST TYPE I INTERFERON PATHWAY | Type I Interferon (alpha/beta IFN) Pathway |
| 1.9 | 40.3 | PID INSULIN PATHWAY | Insulin Pathway |
| 1.9 | 631.8 | NABA SECRETED FACTORS | Genes encoding secreted soluble factors |
| 1.9 | 37.7 | PID LYSOPHOSPHOLIPID PATHWAY | LPA receptor mediated events |
| 1.9 | 41.1 | PID RAC1 REG PATHWAY | Regulation of RAC1 activity |
| 1.8 | 7.2 | PID ER NONGENOMIC PATHWAY | Plasma membrane estrogen receptor signaling |
| 1.7 | 43.2 | PID RHODOPSIN PATHWAY | Visual signal transduction: Rods |
| 1.5 | 15.3 | PID A6B1 A6B4 INTEGRIN PATHWAY | a6b1 and a6b4 Integrin signaling |
| 1.5 | 29.0 | PID ENDOTHELIN PATHWAY | Endothelins |
| 1.5 | 10.6 | PID NECTIN PATHWAY | Nectin adhesion pathway |
| 1.5 | 241.6 | NABA ECM AFFILIATED | Genes encoding proteins affiliated structurally or functionally to extracellular matrix proteins |
| 1.5 | 9.0 | PID ECADHERIN KERATINOCYTE PATHWAY | E-cadherin signaling in keratinocytes |
| 1.5 | 8.9 | PID VEGF VEGFR PATHWAY | VEGF and VEGFR signaling network |
| 1.4 | 50.6 | PID NFAT TFPATHWAY | Calcineurin-regulated NFAT-dependent transcription in lymphocytes |
| 1.4 | 17.9 | PID RAC1 PATHWAY | RAC1 signaling pathway |
| 1.3 | 15.8 | PID INTEGRIN A9B1 PATHWAY | Alpha9 beta1 integrin signaling events |
| 1.3 | 16.9 | PID CDC42 PATHWAY | CDC42 signaling events |
| 1.3 | 69.3 | PID HNF3A PATHWAY | FOXA1 transcription factor network |
| 1.3 | 38.0 | PID INTEGRIN2 PATHWAY | Beta2 integrin cell surface interactions |
| 1.2 | 8.6 | PID SYNDECAN 4 PATHWAY | Syndecan-4-mediated signaling events |
| 1.2 | 25.4 | PID WNT CANONICAL PATHWAY | Canonical Wnt signaling pathway |
| 1.2 | 13.9 | PID EPHRINB REV PATHWAY | Ephrin B reverse signaling |
| 1.1 | 12.0 | PID NOTCH PATHWAY | Notch signaling pathway |
| 1.1 | 34.6 | PID ECADHERIN STABILIZATION PATHWAY | Stabilization and expansion of the E-cadherin adherens junction |
| 1.0 | 25.9 | PID IL12 2PATHWAY | IL12-mediated signaling events |
| 1.0 | 25.4 | PID HEDGEHOG GLI PATHWAY | Hedgehog signaling events mediated by Gli proteins |
| 1.0 | 20.4 | PID IL1 PATHWAY | IL1-mediated signaling events |
| 1.0 | 16.4 | PID ARF6 TRAFFICKING PATHWAY | Arf6 trafficking events |
| 0.9 | 15.0 | PID NCADHERIN PATHWAY | N-cadherin signaling events |
| 0.8 | 5.1 | PID IL23 PATHWAY | IL23-mediated signaling events |
| 0.8 | 22.0 | PID IL12 STAT4 PATHWAY | IL12 signaling mediated by STAT4 |
| 0.8 | 26.0 | PID CDC42 REG PATHWAY | Regulation of CDC42 activity |
| 0.7 | 24.6 | PID FCER1 PATHWAY | Fc-epsilon receptor I signaling in mast cells |
| 0.7 | 4.2 | PID TCR JNK PATHWAY | JNK signaling in the CD4+ TCR pathway |
| 0.6 | 17.6 | PID MTOR 4PATHWAY | mTOR signaling pathway |
| 0.6 | 2.4 | SA G1 AND S PHASES | Cdk2, 4, and 6 bind cyclin D in G1, while cdk2/cyclin E promotes the G1/S transition. |
| 0.6 | 3.0 | PID RETINOIC ACID PATHWAY | Retinoic acid receptors-mediated signaling |
| 0.6 | 5.2 | PID ECADHERIN NASCENT AJ PATHWAY | E-cadherin signaling in the nascent adherens junction |
| 0.5 | 6.5 | PID P38 ALPHA BETA PATHWAY | Regulation of p38-alpha and p38-beta |
| 0.5 | 0.5 | PID IL27 PATHWAY | IL27-mediated signaling events |
| 0.5 | 6.9 | PID MET PATHWAY | Signaling events mediated by Hepatocyte Growth Factor Receptor (c-Met) |
| 0.5 | 17.2 | PID AURORA A PATHWAY | Aurora A signaling |
| 0.5 | 0.9 | PID CD8 TCR DOWNSTREAM PATHWAY | Downstream signaling in naïve CD8+ T cells |
| 0.4 | 28.8 | PID HDAC CLASSI PATHWAY | Signaling events mediated by HDAC Class I |
| 0.3 | 2.2 | PID UPA UPAR PATHWAY | Urokinase-type plasminogen activator (uPA) and uPAR-mediated signaling |
| 0.3 | 5.1 | SIG PIP3 SIGNALING IN B LYMPHOCYTES | Genes related to PIP3 signaling in B lymphocytes |
| 0.1 | 0.2 | PID S1P S1P4 PATHWAY | S1P4 pathway |
| 0.1 | 0.5 | PID CXCR4 PATHWAY | CXCR4-mediated signaling events |
| 0.1 | 0.5 | SIG PIP3 SIGNALING IN CARDIAC MYOCTES | Genes related to PIP3 signaling in cardiac myocytes |
| 0.1 | 1.2 | PID CIRCADIAN PATHWAY | Circadian rhythm pathway |
| 0.0 | 0.1 | PID P38 GAMMA DELTA PATHWAY | Signaling mediated by p38-gamma and p38-delta |
Gene overrepresentation in C2:CP:REACTOME category:
| Log-likelihood per target | Total log-likelihood | Term | Description |
|---|---|---|---|
| 26.1 | 26.1 | REACTOME JNK C JUN KINASES PHOSPHORYLATION AND ACTIVATION MEDIATED BY ACTIVATED HUMAN TAK1 | Genes involved in JNK (c-Jun kinases) phosphorylation and activation mediated by activated human TAK1 |
| 22.9 | 45.9 | REACTOME INHIBITION OF INSULIN SECRETION BY ADRENALINE NORADRENALINE | Genes involved in Inhibition of Insulin Secretion by Adrenaline/Noradrenaline |
| 20.4 | 20.4 | REACTOME FRS2 MEDIATED CASCADE | Genes involved in FRS2-mediated cascade |
| 18.9 | 340.4 | REACTOME DOPAMINE NEUROTRANSMITTER RELEASE CYCLE | Genes involved in Dopamine Neurotransmitter Release Cycle |
| 13.0 | 38.9 | REACTOME FGFR2C LIGAND BINDING AND ACTIVATION | Genes involved in FGFR2c ligand binding and activation |
| 12.8 | 357.3 | REACTOME CRMPS IN SEMA3A SIGNALING | Genes involved in CRMPs in Sema3A signaling |
| 12.5 | 149.4 | REACTOME ADENYLATE CYCLASE ACTIVATING PATHWAY | Genes involved in Adenylate cyclase activating pathway |
| 11.5 | 11.5 | REACTOME SIGNALING BY FGFR | Genes involved in Signaling by FGFR |
| 11.3 | 202.8 | REACTOME CLASS C 3 METABOTROPIC GLUTAMATE PHEROMONE RECEPTORS | Genes involved in Class C/3 (Metabotropic glutamate/pheromone receptors) |
| 11.2 | 78.4 | REACTOME TRAFFICKING OF GLUR2 CONTAINING AMPA RECEPTORS | Genes involved in Trafficking of GluR2-containing AMPA receptors |
| 11.1 | 99.5 | REACTOME RETROGRADE NEUROTROPHIN SIGNALLING | Genes involved in Retrograde neurotrophin signalling |
| 10.9 | 10.9 | REACTOME NEGATIVE REGULATION OF THE PI3K AKT NETWORK | Genes involved in Negative regulation of the PI3K/AKT network |
| 10.8 | 54.1 | REACTOME SIGNALING BY ACTIVATED POINT MUTANTS OF FGFR1 | Genes involved in Signaling by activated point mutants of FGFR1 |
| 10.7 | 256.1 | REACTOME UNBLOCKING OF NMDA RECEPTOR GLUTAMATE BINDING AND ACTIVATION | Genes involved in Unblocking of NMDA receptor, glutamate binding and activation |
| 10.5 | 569.4 | REACTOME ION TRANSPORT BY P TYPE ATPASES | Genes involved in Ion transport by P-type ATPases |
| 10.4 | 354.6 | REACTOME INTERACTION BETWEEN L1 AND ANKYRINS | Genes involved in Interaction between L1 and Ankyrins |
| 9.7 | 29.2 | REACTOME NRAGE SIGNALS DEATH THROUGH JNK | Genes involved in NRAGE signals death through JNK |
| 9.5 | 66.8 | REACTOME TANDEM PORE DOMAIN POTASSIUM CHANNELS | Genes involved in Tandem pore domain potassium channels |
| 8.8 | 8.8 | REACTOME G ALPHA Z SIGNALLING EVENTS | Genes involved in G alpha (z) signalling events |
| 8.7 | 52.3 | REACTOME IRAK2 MEDIATED ACTIVATION OF TAK1 COMPLEX UPON TLR7 8 OR 9 STIMULATION | Genes involved in IRAK2 mediated activation of TAK1 complex upon TLR7/8 or 9 stimulation |
| 8.7 | 182.9 | REACTOME SIGNAL ATTENUATION | Genes involved in Signal attenuation |
| 8.6 | 17.2 | REACTOME ACYL CHAIN REMODELLING OF PI | Genes involved in Acyl chain remodelling of PI |
| 8.3 | 16.7 | REACTOME NOREPINEPHRINE NEUROTRANSMITTER RELEASE CYCLE | Genes involved in Norepinephrine Neurotransmitter Release Cycle |
| 7.4 | 44.5 | REACTOME SEMA3A PLEXIN REPULSION SIGNALING BY INHIBITING INTEGRIN ADHESION | Genes involved in SEMA3A-Plexin repulsion signaling by inhibiting Integrin adhesion |
| 7.3 | 87.1 | REACTOME GLUTAMATE NEUROTRANSMITTER RELEASE CYCLE | Genes involved in Glutamate Neurotransmitter Release Cycle |
| 7.3 | 94.3 | REACTOME SIGNALING BY FGFR3 MUTANTS | Genes involved in Signaling by FGFR3 mutants |
| 7.1 | 114.2 | REACTOME SYNTHESIS OF SUBSTRATES IN N GLYCAN BIOSYTHESIS | Genes involved in Synthesis of substrates in N-glycan biosythesis |
| 7.1 | 149.5 | REACTOME TRAFFICKING OF AMPA RECEPTORS | Genes involved in Trafficking of AMPA receptors |
| 6.9 | 103.4 | REACTOME REVERSIBLE HYDRATION OF CARBON DIOXIDE | Genes involved in Reversible Hydration of Carbon Dioxide |
| 6.8 | 252.9 | REACTOME EGFR DOWNREGULATION | Genes involved in EGFR downregulation |
| 6.8 | 176.8 | REACTOME REGULATION OF INSULIN LIKE GROWTH FACTOR IGF ACTIVITY BY INSULIN LIKE GROWTH FACTOR BINDING PROTEINS IGFBPS | Genes involved in Regulation of Insulin-like Growth Factor (IGF) Activity by Insulin-like Growth Factor Binding Proteins (IGFBPs) |
| 6.7 | 128.0 | REACTOME SYNTHESIS OF PE | Genes involved in Synthesis of PE |
| 6.7 | 254.0 | REACTOME A TETRASACCHARIDE LINKER SEQUENCE IS REQUIRED FOR GAG SYNTHESIS | Genes involved in A tetrasaccharide linker sequence is required for GAG synthesis |
| 6.7 | 207.2 | REACTOME GABA A RECEPTOR ACTIVATION | Genes involved in GABA A receptor activation |
| 6.6 | 417.3 | REACTOME NCAM1 INTERACTIONS | Genes involved in NCAM1 interactions |
| 6.4 | 102.5 | REACTOME AKT PHOSPHORYLATES TARGETS IN THE CYTOSOL | Genes involved in AKT phosphorylates targets in the cytosol |
| 6.4 | 275.1 | REACTOME EFFECTS OF PIP2 HYDROLYSIS | Genes involved in Effects of PIP2 hydrolysis |
| 6.3 | 12.6 | REACTOME MRNA CAPPING | Genes involved in mRNA Capping |
| 6.2 | 43.1 | REACTOME RECEPTOR LIGAND BINDING INITIATES THE SECOND PROTEOLYTIC CLEAVAGE OF NOTCH RECEPTOR | Genes involved in Receptor-ligand binding initiates the second proteolytic cleavage of Notch receptor |
| 6.1 | 30.3 | REACTOME ABORTIVE ELONGATION OF HIV1 TRANSCRIPT IN THE ABSENCE OF TAT | Genes involved in Abortive elongation of HIV-1 transcript in the absence of Tat |
| 5.9 | 100.8 | REACTOME REGULATION OF PYRUVATE DEHYDROGENASE PDH COMPLEX | Genes involved in Regulation of pyruvate dehydrogenase (PDH) complex |
| 5.8 | 116.9 | REACTOME HS GAG BIOSYNTHESIS | Genes involved in HS-GAG biosynthesis |
| 5.8 | 139.5 | REACTOME AMINE DERIVED HORMONES | Genes involved in Amine-derived hormones |
| 5.7 | 135.8 | REACTOME ACYL CHAIN REMODELLING OF PE | Genes involved in Acyl chain remodelling of PE |
| 5.4 | 32.2 | REACTOME ADP SIGNALLING THROUGH P2RY1 | Genes involved in ADP signalling through P2Y purinoceptor 1 |
| 5.2 | 10.3 | REACTOME PHOSPHORYLATION OF CD3 AND TCR ZETA CHAINS | Genes involved in Phosphorylation of CD3 and TCR zeta chains |
| 5.1 | 128.2 | REACTOME HDL MEDIATED LIPID TRANSPORT | Genes involved in HDL-mediated lipid transport |
| 5.1 | 280.2 | REACTOME NITRIC OXIDE STIMULATES GUANYLATE CYCLASE | Genes involved in Nitric oxide stimulates guanylate cyclase |
| 5.0 | 34.8 | REACTOME GAP JUNCTION DEGRADATION | Genes involved in Gap junction degradation |
| 4.9 | 68.4 | REACTOME PASSIVE TRANSPORT BY AQUAPORINS | Genes involved in Passive Transport by Aquaporins |
| 4.9 | 121.5 | REACTOME GLUCAGON TYPE LIGAND RECEPTORS | Genes involved in Glucagon-type ligand receptors |
| 4.8 | 19.2 | REACTOME THROMBOXANE SIGNALLING THROUGH TP RECEPTOR | Genes involved in Thromboxane signalling through TP receptor |
| 4.8 | 33.5 | REACTOME SIGNALING BY GPCR | Genes involved in Signaling by GPCR |
| 4.7 | 220.8 | REACTOME VOLTAGE GATED POTASSIUM CHANNELS | Genes involved in Voltage gated Potassium channels |
| 4.6 | 64.7 | REACTOME SPRY REGULATION OF FGF SIGNALING | Genes involved in Spry regulation of FGF signaling |
| 4.6 | 4.6 | REACTOME PROLONGED ERK ACTIVATION EVENTS | Genes involved in Prolonged ERK activation events |
| 4.6 | 114.7 | REACTOME PKA MEDIATED PHOSPHORYLATION OF CREB | Genes involved in PKA-mediated phosphorylation of CREB |
| 4.5 | 86.0 | REACTOME SIGNALING BY BMP | Genes involved in Signaling by BMP |
| 4.4 | 71.1 | REACTOME ACTIVATION OF THE AP1 FAMILY OF TRANSCRIPTION FACTORS | Genes involved in Activation of the AP-1 family of transcription factors |
| 4.4 | 92.4 | REACTOME INITIAL TRIGGERING OF COMPLEMENT | Genes involved in Initial triggering of complement |
| 4.4 | 87.1 | REACTOME NA CL DEPENDENT NEUROTRANSMITTER TRANSPORTERS | Genes involved in Na+/Cl- dependent neurotransmitter transporters |
| 4.3 | 59.5 | REACTOME PRE NOTCH PROCESSING IN GOLGI | Genes involved in Pre-NOTCH Processing in Golgi |
| 4.2 | 8.5 | REACTOME RORA ACTIVATES CIRCADIAN EXPRESSION | Genes involved in RORA Activates Circadian Expression |
| 4.2 | 4.2 | REACTOME ACYL CHAIN REMODELLING OF PC | Genes involved in Acyl chain remodelling of PC |
| 4.1 | 175.1 | REACTOME AMINE LIGAND BINDING RECEPTORS | Genes involved in Amine ligand-binding receptors |
| 3.9 | 27.3 | REACTOME PLATELET CALCIUM HOMEOSTASIS | Genes involved in Platelet calcium homeostasis |
| 3.9 | 752.1 | REACTOME NEURONAL SYSTEM | Genes involved in Neuronal System |
| 3.8 | 65.1 | REACTOME REGULATION OF RHEB GTPASE ACTIVITY BY AMPK | Genes involved in Regulation of Rheb GTPase activity by AMPK |
| 3.7 | 63.1 | REACTOME ABCA TRANSPORTERS IN LIPID HOMEOSTASIS | Genes involved in ABCA transporters in lipid homeostasis |
| 3.7 | 18.5 | REACTOME SIGNALING BY ERBB2 | Genes involved in Signaling by ERBB2 |
| 3.6 | 43.6 | REACTOME P75 NTR RECEPTOR MEDIATED SIGNALLING | Genes involved in p75 NTR receptor-mediated signalling |
| 3.5 | 13.9 | REACTOME CONVERSION FROM APC C CDC20 TO APC C CDH1 IN LATE ANAPHASE | Genes involved in Conversion from APC/C:Cdc20 to APC/C:Cdh1 in late anaphase |
| 3.4 | 27.4 | REACTOME DSCAM INTERACTIONS | Genes involved in DSCAM interactions |
| 3.4 | 73.9 | REACTOME DCC MEDIATED ATTRACTIVE SIGNALING | Genes involved in DCC mediated attractive signaling |
| 3.3 | 33.3 | REACTOME SYNTHESIS OF BILE ACIDS AND BILE SALTS VIA 24 HYDROXYCHOLESTEROL | Genes involved in Synthesis of bile acids and bile salts via 24-hydroxycholesterol |
| 3.3 | 9.9 | REACTOME REGULATION OF KIT SIGNALING | Genes involved in Regulation of KIT signaling |
| 3.3 | 68.5 | REACTOME FACILITATIVE NA INDEPENDENT GLUCOSE TRANSPORTERS | Genes involved in Facilitative Na+-independent glucose transporters |
| 3.1 | 40.7 | REACTOME ACTIVATION OF RAC | Genes involved in Activation of Rac |
| 3.0 | 20.7 | REACTOME RNA POL I PROMOTER OPENING | Genes involved in RNA Polymerase I Promoter Opening |
| 3.0 | 100.4 | REACTOME REGULATION OF BETA CELL DEVELOPMENT | Genes involved in Regulation of beta-cell development |
| 2.9 | 270.9 | REACTOME TRANSPORT OF INORGANIC CATIONS ANIONS AND AMINO ACIDS OLIGOPEPTIDES | Genes involved in Transport of inorganic cations/anions and amino acids/oligopeptides |
| 2.9 | 210.2 | REACTOME CLASS B 2 SECRETIN FAMILY RECEPTORS | Genes involved in Class B/2 (Secretin family receptors) |
| 2.7 | 68.2 | REACTOME SIGNALING BY ROBO RECEPTOR | Genes involved in Signaling by Robo receptor |
| 2.7 | 54.4 | REACTOME TGF BETA RECEPTOR SIGNALING IN EMT EPITHELIAL TO MESENCHYMAL TRANSITION | Genes involved in TGF-beta receptor signaling in EMT (epithelial to mesenchymal transition) |
| 2.7 | 32.5 | REACTOME THE ACTIVATION OF ARYLSULFATASES | Genes involved in The activation of arylsulfatases |
| 2.7 | 74.5 | REACTOME REGULATION OF HYPOXIA INDUCIBLE FACTOR HIF BY OXYGEN | Genes involved in Regulation of Hypoxia-inducible Factor (HIF) by Oxygen |
| 2.6 | 28.1 | REACTOME ROLE OF DCC IN REGULATING APOPTOSIS | Genes involved in Role of DCC in regulating apoptosis |
| 2.5 | 35.4 | REACTOME TRAFFICKING AND PROCESSING OF ENDOSOMAL TLR | Genes involved in Trafficking and processing of endosomal TLR |
| 2.5 | 79.0 | REACTOME ADHERENS JUNCTIONS INTERACTIONS | Genes involved in Adherens junctions interactions |
| 2.5 | 86.2 | REACTOME CELL CELL JUNCTION ORGANIZATION | Genes involved in Cell-cell junction organization |
| 2.5 | 95.7 | REACTOME BMAL1 CLOCK NPAS2 ACTIVATES CIRCADIAN EXPRESSION | Genes involved in BMAL1:CLOCK/NPAS2 Activates Circadian Expression |
| 2.3 | 16.3 | REACTOME LIGAND GATED ION CHANNEL TRANSPORT | Genes involved in Ligand-gated ion channel transport |
| 2.2 | 65.2 | REACTOME NUCLEAR SIGNALING BY ERBB4 | Genes involved in Nuclear signaling by ERBB4 |
| 2.2 | 9.0 | REACTOME PROSTANOID LIGAND RECEPTORS | Genes involved in Prostanoid ligand receptors |
| 2.2 | 42.5 | REACTOME TERMINATION OF O GLYCAN BIOSYNTHESIS | Genes involved in Termination of O-glycan biosynthesis |
| 2.2 | 8.8 | REACTOME SYNTHESIS SECRETION AND DEACYLATION OF GHRELIN | Genes involved in Synthesis, Secretion, and Deacylation of Ghrelin |
| 2.1 | 25.8 | REACTOME SYNTHESIS OF PIPS AT THE GOLGI MEMBRANE | Genes involved in Synthesis of PIPs at the Golgi membrane |
| 2.1 | 83.2 | REACTOME SEMA4D INDUCED CELL MIGRATION AND GROWTH CONE COLLAPSE | Genes involved in Sema4D induced cell migration and growth-cone collapse |
| 2.1 | 112.6 | REACTOME G ALPHA S SIGNALLING EVENTS | Genes involved in G alpha (s) signalling events |
| 2.1 | 181.5 | REACTOME NUCLEAR RECEPTOR TRANSCRIPTION PATHWAY | Genes involved in Nuclear Receptor transcription pathway |
| 2.0 | 157.4 | REACTOME PEPTIDE LIGAND BINDING RECEPTORS | Genes involved in Peptide ligand-binding receptors |
| 2.0 | 28.3 | REACTOME GAP JUNCTION TRAFFICKING | Genes involved in Gap junction trafficking |
| 2.0 | 64.7 | REACTOME DEGRADATION OF THE EXTRACELLULAR MATRIX | Genes involved in Degradation of the extracellular matrix |
| 2.0 | 40.3 | REACTOME ORGANIC CATION ANION ZWITTERION TRANSPORT | Genes involved in Organic cation/anion/zwitterion transport |
| 2.0 | 329.2 | REACTOME G ALPHA I SIGNALLING EVENTS | Genes involved in G alpha (i) signalling events |
| 2.0 | 19.8 | REACTOME IKK COMPLEX RECRUITMENT MEDIATED BY RIP1 | Genes involved in IKK complex recruitment mediated by RIP1 |
| 2.0 | 67.0 | REACTOME FORMATION OF FIBRIN CLOT CLOTTING CASCADE | Genes involved in Formation of Fibrin Clot (Clotting Cascade) |
| 2.0 | 15.7 | REACTOME ANDROGEN BIOSYNTHESIS | Genes involved in Androgen biosynthesis |
| 1.9 | 62.1 | REACTOME CASPASE MEDIATED CLEAVAGE OF CYTOSKELETAL PROTEINS | Genes involved in Caspase-mediated cleavage of cytoskeletal proteins |
| 1.9 | 92.7 | REACTOME G ALPHA1213 SIGNALLING EVENTS | Genes involved in G alpha (12/13) signalling events |
| 1.9 | 1.9 | REACTOME DESTABILIZATION OF MRNA BY BRF1 | Genes involved in Destabilization of mRNA by Butyrate Response Factor 1 (BRF1) |
| 1.9 | 22.6 | REACTOME P2Y RECEPTORS | Genes involved in P2Y receptors |
| 1.8 | 3.6 | REACTOME PI3K EVENTS IN ERBB4 SIGNALING | Genes involved in PI3K events in ERBB4 signaling |
| 1.8 | 30.4 | REACTOME ERK MAPK TARGETS | Genes involved in ERK/MAPK targets |
| 1.8 | 8.9 | REACTOME SIGNALING BY EGFR IN CANCER | Genes involved in Signaling by EGFR in Cancer |
| 1.7 | 5.2 | REACTOME INTEGRATION OF ENERGY METABOLISM | Genes involved in Integration of energy metabolism |
| 1.7 | 13.7 | REACTOME AMINE COMPOUND SLC TRANSPORTERS | Genes involved in Amine compound SLC transporters |
| 1.7 | 69.8 | REACTOME NOTCH1 INTRACELLULAR DOMAIN REGULATES TRANSCRIPTION | Genes involved in NOTCH1 Intracellular Domain Regulates Transcription |
| 1.7 | 42.2 | REACTOME KERATAN SULFATE BIOSYNTHESIS | Genes involved in Keratan sulfate biosynthesis |
| 1.6 | 25.6 | REACTOME ACTIVATED NOTCH1 TRANSMITS SIGNAL TO THE NUCLEUS | Genes involved in Activated NOTCH1 Transmits Signal to the Nucleus |
| 1.5 | 21.4 | REACTOME RNA POL I TRANSCRIPTION INITIATION | Genes involved in RNA Polymerase I Transcription Initiation |
| 1.5 | 115.6 | REACTOME PHASE1 FUNCTIONALIZATION OF COMPOUNDS | Genes involved in Phase 1 - Functionalization of compounds |
| 1.5 | 30.6 | REACTOME SIGNAL REGULATORY PROTEIN SIRP FAMILY INTERACTIONS | Genes involved in Signal regulatory protein (SIRP) family interactions |
| 1.4 | 41.5 | REACTOME SIGNALING BY NODAL | Genes involved in Signaling by NODAL |
| 1.4 | 24.9 | REACTOME SYNTHESIS OF PA | Genes involved in Synthesis of PA |
| 1.4 | 17.7 | REACTOME SIGNALING BY HIPPO | Genes involved in Signaling by Hippo |
| 1.3 | 2.7 | REACTOME RIG I MDA5 MEDIATED INDUCTION OF IFN ALPHA BETA PATHWAYS | Genes involved in RIG-I/MDA5 mediated induction of IFN-alpha/beta pathways |
| 1.3 | 14.5 | REACTOME PACKAGING OF TELOMERE ENDS | Genes involved in Packaging Of Telomere Ends |
| 1.3 | 11.8 | REACTOME NEGATIVE REGULATION OF FGFR SIGNALING | Genes involved in Negative regulation of FGFR signaling |
| 1.3 | 12.9 | REACTOME BIOSYNTHESIS OF THE N GLYCAN PRECURSOR DOLICHOL LIPID LINKED OLIGOSACCHARIDE LLO AND TRANSFER TO A NASCENT PROTEIN | Genes involved in Biosynthesis of the N-glycan precursor (dolichol lipid-linked oligosaccharide, LLO) and transfer to a nascent protein |
| 1.2 | 19.9 | REACTOME ACTIVATED AMPK STIMULATES FATTY ACID OXIDATION IN MUSCLE | Genes involved in Activated AMPK stimulates fatty-acid oxidation in muscle |
| 1.2 | 21.3 | REACTOME CELL DEATH SIGNALLING VIA NRAGE NRIF AND NADE | Genes involved in Cell death signalling via NRAGE, NRIF and NADE |
| 1.2 | 15.1 | REACTOME METABOLISM OF STEROID HORMONES AND VITAMINS A AND D | Genes involved in Metabolism of steroid hormones and vitamins A and D |
| 1.1 | 29.8 | REACTOME BRANCHED CHAIN AMINO ACID CATABOLISM | Genes involved in Branched-chain amino acid catabolism |
| 1.0 | 3.0 | REACTOME G BETA GAMMA SIGNALLING THROUGH PI3KGAMMA | Genes involved in G beta:gamma signalling through PI3Kgamma |
| 1.0 | 20.9 | REACTOME INSULIN SYNTHESIS AND PROCESSING | Genes involved in Insulin Synthesis and Processing |
| 1.0 | 1.0 | REACTOME ALPHA LINOLENIC ACID ALA METABOLISM | Genes involved in alpha-linolenic acid (ALA) metabolism |
| 1.0 | 22.0 | REACTOME FANCONI ANEMIA PATHWAY | Genes involved in Fanconi Anemia pathway |
| 0.9 | 23.3 | REACTOME COMPLEMENT CASCADE | Genes involved in Complement cascade |
| 0.9 | 44.1 | REACTOME SMOOTH MUSCLE CONTRACTION | Genes involved in Smooth Muscle Contraction |
| 0.8 | 8.5 | REACTOME IL 7 SIGNALING | Genes involved in Interleukin-7 signaling |
| 0.8 | 7.6 | REACTOME NFKB ACTIVATION THROUGH FADD RIP1 PATHWAY MEDIATED BY CASPASE 8 AND10 | Genes involved in NF-kB activation through FADD/RIP-1 pathway mediated by caspase-8 and -10 |
| 0.8 | 14.8 | REACTOME PI3K CASCADE | Genes involved in PI3K Cascade |
| 0.8 | 8.4 | REACTOME NGF SIGNALLING VIA TRKA FROM THE PLASMA MEMBRANE | Genes involved in NGF signalling via TRKA from the plasma membrane |
| 0.7 | 11.1 | REACTOME IL RECEPTOR SHC SIGNALING | Genes involved in Interleukin receptor SHC signaling |
| 0.7 | 7.4 | REACTOME SYNTHESIS OF PIPS AT THE LATE ENDOSOME MEMBRANE | Genes involved in Synthesis of PIPs at the late endosome membrane |
| 0.7 | 19.8 | REACTOME CYTOSOLIC SULFONATION OF SMALL MOLECULES | Genes involved in Cytosolic sulfonation of small molecules |
| 0.7 | 0.7 | REACTOME RNA POL I TRANSCRIPTION TERMINATION | Genes involved in RNA Polymerase I Transcription Termination |
| 0.6 | 5.8 | REACTOME REGULATION OF SIGNALING BY CBL | Genes involved in Regulation of signaling by CBL |
| 0.6 | 5.7 | REACTOME GLYCOPROTEIN HORMONES | Genes involved in Glycoprotein hormones |
| 0.6 | 8.9 | REACTOME ACTIVATION OF CHAPERONES BY ATF6 ALPHA | Genes involved in Activation of Chaperones by ATF6-alpha |
| 0.6 | 8.9 | REACTOME COSTIMULATION BY THE CD28 FAMILY | Genes involved in Costimulation by the CD28 family |
| 0.6 | 3.4 | REACTOME THE ROLE OF NEF IN HIV1 REPLICATION AND DISEASE PATHOGENESIS | Genes involved in The role of Nef in HIV-1 replication and disease pathogenesis |
| 0.6 | 20.4 | REACTOME MEIOTIC SYNAPSIS | Genes involved in Meiotic Synapsis |
| 0.5 | 1.1 | REACTOME PLATELET AGGREGATION PLUG FORMATION | Genes involved in Platelet Aggregation (Plug Formation) |
| 0.5 | 7.8 | REACTOME DOWNREGULATION OF ERBB2 ERBB3 SIGNALING | Genes involved in Downregulation of ERBB2:ERBB3 signaling |
| 0.5 | 1.0 | REACTOME ENDOSOMAL VACUOLAR PATHWAY | Genes involved in Endosomal/Vacuolar pathway |
| 0.5 | 125.6 | REACTOME GENERIC TRANSCRIPTION PATHWAY | Genes involved in Generic Transcription Pathway |
| 0.4 | 3.4 | REACTOME CS DS DEGRADATION | Genes involved in CS/DS degradation |
| 0.4 | 18.7 | REACTOME MUSCLE CONTRACTION | Genes involved in Muscle contraction |
| 0.4 | 7.7 | REACTOME GLYCOGEN BREAKDOWN GLYCOGENOLYSIS | Genes involved in Glycogen breakdown (glycogenolysis) |
| 0.3 | 6.7 | REACTOME GPCR LIGAND BINDING | Genes involved in GPCR ligand binding |
| 0.3 | 0.3 | REACTOME BILE ACID AND BILE SALT METABOLISM | Genes involved in Bile acid and bile salt metabolism |
| 0.3 | 11.0 | REACTOME COLLAGEN FORMATION | Genes involved in Collagen formation |
| 0.3 | 7.2 | REACTOME INSULIN RECEPTOR RECYCLING | Genes involved in Insulin receptor recycling |
| 0.2 | 0.7 | REACTOME ROLE OF SECOND MESSENGERS IN NETRIN1 SIGNALING | Genes involved in Role of second messengers in netrin-1 signaling |
| 0.2 | 4.0 | REACTOME EXTRINSIC PATHWAY FOR APOPTOSIS | Genes involved in Extrinsic Pathway for Apoptosis |
| 0.1 | 0.4 | REACTOME PD1 SIGNALING | Genes involved in PD-1 signaling |
| 0.1 | 2.4 | REACTOME TRAF6 MEDIATED IRF7 ACTIVATION | Genes involved in TRAF6 mediated IRF7 activation |
| 0.1 | 0.1 | REACTOME VIF MEDIATED DEGRADATION OF APOBEC3G | Genes involved in Vif-mediated degradation of APOBEC3G |
| 0.1 | 2.2 | REACTOME TRANSPORT OF ORGANIC ANIONS | Genes involved in Transport of organic anions |
| 0.1 | 1.1 | REACTOME CTNNB1 PHOSPHORYLATION CASCADE | Genes involved in Beta-catenin phosphorylation cascade |
| 0.1 | 1.4 | REACTOME OTHER SEMAPHORIN INTERACTIONS | Genes involved in Other semaphorin interactions |
| 0.1 | 1.0 | REACTOME ANTIGEN ACTIVATES B CELL RECEPTOR LEADING TO GENERATION OF SECOND MESSENGERS | Genes involved in Antigen Activates B Cell Receptor Leading to Generation of Second Messengers |
| 0.1 | 2.8 | REACTOME OLFACTORY SIGNALING PATHWAY | Genes involved in Olfactory Signaling Pathway |
| 0.1 | 0.1 | REACTOME SIGNALLING BY NGF | Genes involved in Signalling by NGF |
| 0.0 | 2.7 | REACTOME AMYLOIDS | Genes involved in Amyloids |
| 0.0 | 0.4 | REACTOME DEFENSINS | Genes involved in Defensins |