Project
GNF SymAtlas + NCI-60 cancer cell lines, comparison of cancers vs non-cancers, human (Su, 2004; Ross, 2000)
Navigation
Downloads
Results for YY1_YY2
Z-value: 1.19
Motif logo
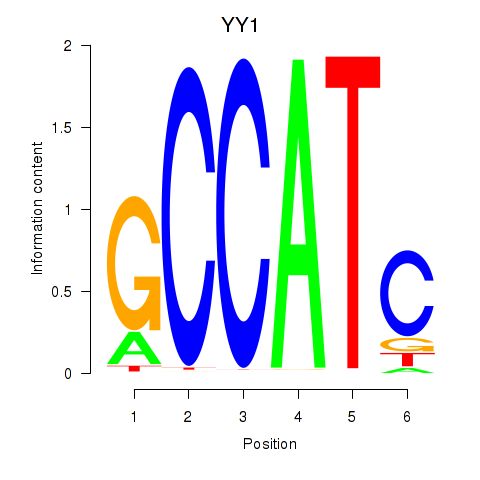
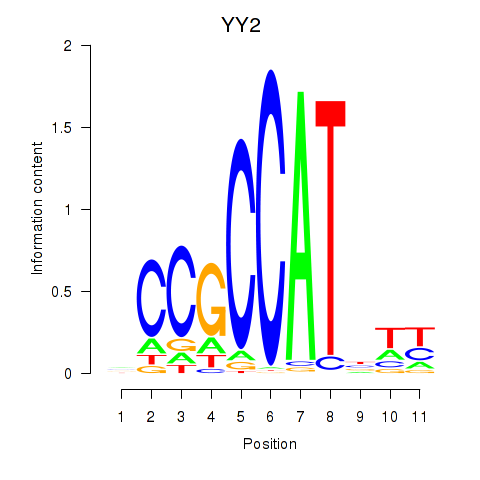
Transcription factors associated with YY1_YY2
| Gene Symbol | Gene ID | Gene Info |
|---|---|---|
|
YY1
|
ENSG00000100811.6 | YY1 transcription factor |
|
YY2
|
ENSG00000230797.2 | YY2 transcription factor |
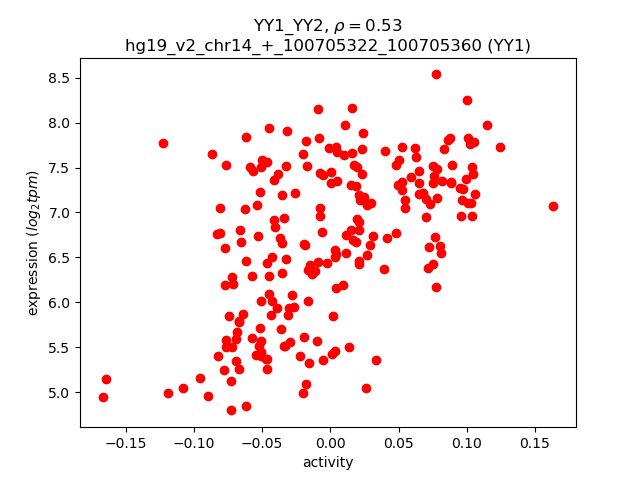
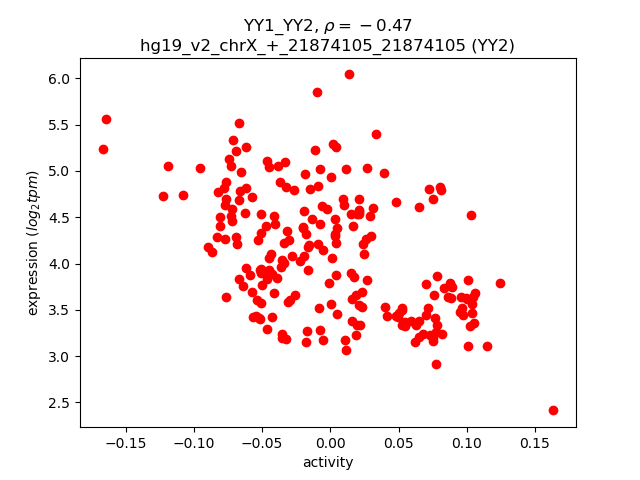
Activity-expression correlation:
| Gene | Promoter | Pearson corr. coef. | P-value | Plot |
|---|---|---|---|---|
| YY1 | hg19_v2_chr14_+_100705322_100705360 | 0.53 | 1.9e-17 | Click! |
| YY2 | hg19_v2_chrX_+_21874105_21874105 | -0.47 | 2.2e-13 | Click! |
Activity profile of YY1_YY2 motif
Sorted Z-values of YY1_YY2 motif
| Promoter | Log-likelihood | Transcript | Gene | Gene Info |
|---|---|---|---|---|
| chr17_-_1303462 | 72.71 |
ENST00000573026.1
ENST00000575977.1 ENST00000571732.1 ENST00000264335.8 |
YWHAE
|
tyrosine 3-monooxygenase/tryptophan 5-monooxygenase activation protein, epsilon |
| chr14_-_69864993 | 67.50 |
ENST00000555373.1
|
ERH
|
enhancer of rudimentary homolog (Drosophila) |
| chr19_-_13044494 | 67.02 |
ENST00000593021.1
ENST00000587981.1 ENST00000423140.2 ENST00000314606.4 |
FARSA
|
phenylalanyl-tRNA synthetase, alpha subunit |
| chr16_-_87903079 | 52.70 |
ENST00000261622.4
|
SLC7A5
|
solute carrier family 7 (amino acid transporter light chain, L system), member 5 |
| chr14_-_23504337 | 45.49 |
ENST00000361611.6
|
PSMB5
|
proteasome (prosome, macropain) subunit, beta type, 5 |
| chr14_-_23504087 | 44.06 |
ENST00000493471.2
ENST00000460922.2 |
PSMB5
|
proteasome (prosome, macropain) subunit, beta type, 5 |
| chr14_-_23504432 | 43.50 |
ENST00000425762.2
|
PSMB5
|
proteasome (prosome, macropain) subunit, beta type, 5 |
| chr13_-_37679803 | 42.93 |
ENST00000379800.3
|
CSNK1A1L
|
casein kinase 1, alpha 1-like |
| chr1_-_149900122 | 41.22 |
ENST00000271628.8
|
SF3B4
|
splicing factor 3b, subunit 4, 49kDa |
| chr7_+_73097890 | 40.90 |
ENST00000265758.2
ENST00000423166.2 ENST00000423497.1 |
WBSCR22
|
Williams Beuren syndrome chromosome region 22 |
| chr3_-_149688896 | 39.35 |
ENST00000239940.7
|
PFN2
|
profilin 2 |
| chr2_+_27851863 | 38.71 |
ENST00000264718.3
ENST00000610189.1 |
GPN1
|
GPN-loop GTPase 1 |
| chr3_-_149688502 | 37.10 |
ENST00000481767.1
ENST00000475518.1 |
PFN2
|
profilin 2 |
| chr1_-_222885770 | 36.79 |
ENST00000355727.2
ENST00000340020.6 |
AIDA
|
axin interactor, dorsalization associated |
| chr12_+_7079944 | 34.90 |
ENST00000261406.6
|
EMG1
|
EMG1 N1-specific pseudouridine methyltransferase |
| chr15_-_89010607 | 34.10 |
ENST00000312475.4
|
MRPL46
|
mitochondrial ribosomal protein L46 |
| chr11_+_75110530 | 34.07 |
ENST00000531188.1
ENST00000530164.1 ENST00000422465.2 ENST00000278572.6 ENST00000534440.1 ENST00000527446.1 ENST00000526608.1 ENST00000527273.1 ENST00000524851.1 |
RPS3
|
ribosomal protein S3 |
| chr14_+_103801140 | 33.66 |
ENST00000561325.1
ENST00000392715.2 ENST00000559130.1 ENST00000559532.1 ENST00000558506.1 |
EIF5
|
eukaryotic translation initiation factor 5 |
| chr1_+_156756667 | 33.41 |
ENST00000526188.1
ENST00000454659.1 |
PRCC
|
papillary renal cell carcinoma (translocation-associated) |
| chr3_-_149688655 | 33.30 |
ENST00000461930.1
ENST00000423691.2 ENST00000490975.1 ENST00000461868.1 ENST00000452853.2 |
PFN2
|
profilin 2 |
| chr1_-_153949751 | 33.20 |
ENST00000428469.1
|
JTB
|
jumping translocation breakpoint |
| chr12_+_56211703 | 32.96 |
ENST00000243045.5
ENST00000552672.1 ENST00000550836.1 |
ORMDL2
|
ORM1-like 2 (S. cerevisiae) |
| chr1_+_46769303 | 32.87 |
ENST00000311672.5
|
UQCRH
|
ubiquinol-cytochrome c reductase hinge protein |
| chr14_+_78174414 | 32.71 |
ENST00000557342.1
ENST00000238688.5 ENST00000557623.1 ENST00000557431.1 ENST00000556831.1 ENST00000556375.1 ENST00000553981.1 |
SLIRP
|
SRA stem-loop interacting RNA binding protein |
| chr14_-_23398565 | 32.66 |
ENST00000397440.4
ENST00000538452.1 ENST00000421938.2 ENST00000554867.1 ENST00000556616.1 ENST00000216350.8 ENST00000553550.1 ENST00000397441.2 ENST00000553897.1 |
PRMT5
|
protein arginine methyltransferase 5 |
| chr5_-_71616043 | 31.81 |
ENST00000508863.2
ENST00000522095.1 ENST00000513900.1 ENST00000515404.1 ENST00000457646.4 ENST00000261413.5 |
MRPS27
|
mitochondrial ribosomal protein S27 |
| chr19_-_2456922 | 31.26 |
ENST00000582871.1
ENST00000325327.3 |
LMNB2
|
lamin B2 |
| chr11_+_57480046 | 31.17 |
ENST00000378312.4
ENST00000278422.4 |
TMX2
|
thioredoxin-related transmembrane protein 2 |
| chr20_-_49547731 | 31.09 |
ENST00000396029.3
|
ADNP
|
activity-dependent neuroprotector homeobox |
| chr11_-_122929699 | 30.70 |
ENST00000526686.1
|
HSPA8
|
heat shock 70kDa protein 8 |
| chr7_-_6523688 | 30.49 |
ENST00000490996.1
|
KDELR2
|
KDEL (Lys-Asp-Glu-Leu) endoplasmic reticulum protein retention receptor 2 |
| chr11_-_66206260 | 30.39 |
ENST00000329819.4
ENST00000310999.7 ENST00000430466.2 |
MRPL11
|
mitochondrial ribosomal protein L11 |
| chr1_-_161087802 | 30.30 |
ENST00000368010.3
|
PFDN2
|
prefoldin subunit 2 |
| chr11_-_14380664 | 30.00 |
ENST00000545643.1
ENST00000256196.4 |
RRAS2
|
related RAS viral (r-ras) oncogene homolog 2 |
| chr2_+_86426478 | 29.70 |
ENST00000254644.8
ENST00000605125.1 ENST00000337109.4 ENST00000409180.1 |
MRPL35
|
mitochondrial ribosomal protein L35 |
| chr3_+_160117418 | 29.66 |
ENST00000465903.1
ENST00000485645.1 ENST00000360111.2 ENST00000472991.1 ENST00000467468.1 ENST00000469762.1 ENST00000489573.1 ENST00000462787.1 ENST00000490207.1 ENST00000485867.1 |
SMC4
|
structural maintenance of chromosomes 4 |
| chr2_-_190044480 | 29.09 |
ENST00000374866.3
|
COL5A2
|
collagen, type V, alpha 2 |
| chr5_-_180670880 | 29.01 |
ENST00000511566.1
ENST00000511900.1 ENST00000504726.1 ENST00000512968.1 ENST00000376817.4 ENST00000513027.1 ENST00000503081.1 ENST00000456394.2 |
GNB2L1
|
guanine nucleotide binding protein (G protein), beta polypeptide 2-like 1 |
| chr19_+_38865398 | 28.97 |
ENST00000585598.1
ENST00000602911.1 ENST00000592561.1 |
PSMD8
|
proteasome (prosome, macropain) 26S subunit, non-ATPase, 8 |
| chr5_+_154320623 | 28.94 |
ENST00000523037.1
ENST00000265229.8 ENST00000439747.3 ENST00000522038.1 |
MRPL22
|
mitochondrial ribosomal protein L22 |
| chr1_-_153950164 | 28.71 |
ENST00000271843.4
|
JTB
|
jumping translocation breakpoint |
| chr14_-_54908043 | 28.63 |
ENST00000556113.1
ENST00000553660.1 ENST00000395573.4 ENST00000557690.1 ENST00000216416.4 |
CNIH1
|
cornichon family AMPA receptor auxiliary protein 1 |
| chr1_-_153950098 | 27.89 |
ENST00000356648.1
|
JTB
|
jumping translocation breakpoint |
| chr19_+_16178317 | 27.68 |
ENST00000344824.6
ENST00000538887.1 |
TPM4
|
tropomyosin 4 |
| chr3_+_160117087 | 27.39 |
ENST00000357388.3
|
SMC4
|
structural maintenance of chromosomes 4 |
| chrX_+_119005399 | 27.38 |
ENST00000371437.4
|
NDUFA1
|
NADH dehydrogenase (ubiquinone) 1 alpha subcomplex, 1, 7.5kDa |
| chr19_+_38865176 | 26.42 |
ENST00000215071.4
|
PSMD8
|
proteasome (prosome, macropain) 26S subunit, non-ATPase, 8 |
| chr1_-_153950116 | 26.25 |
ENST00000368589.1
|
JTB
|
jumping translocation breakpoint |
| chr10_-_120938303 | 25.62 |
ENST00000356951.3
ENST00000298510.2 |
PRDX3
|
peroxiredoxin 3 |
| chr11_+_74660278 | 25.55 |
ENST00000263672.6
ENST00000530257.1 ENST00000526361.1 ENST00000532972.1 |
SPCS2
|
signal peptidase complex subunit 2 homolog (S. cerevisiae) |
| chr1_+_166808692 | 25.37 |
ENST00000367876.4
|
POGK
|
pogo transposable element with KRAB domain |
| chr6_-_8102714 | 25.11 |
ENST00000502429.1
ENST00000429723.2 ENST00000507463.1 ENST00000379715.5 |
EEF1E1
|
eukaryotic translation elongation factor 1 epsilon 1 |
| chr11_-_122930121 | 25.07 |
ENST00000524552.1
|
HSPA8
|
heat shock 70kDa protein 8 |
| chrX_-_109561294 | 24.88 |
ENST00000372059.2
ENST00000262844.5 |
AMMECR1
|
Alport syndrome, mental retardation, midface hypoplasia and elliptocytosis chromosomal region gene 1 |
| chr3_-_12705600 | 24.87 |
ENST00000542177.1
ENST00000442415.2 ENST00000251849.4 |
RAF1
|
v-raf-1 murine leukemia viral oncogene homolog 1 |
| chr5_+_52856456 | 24.76 |
ENST00000296684.5
ENST00000506765.1 |
NDUFS4
|
NADH dehydrogenase (ubiquinone) Fe-S protein 4, 18kDa (NADH-coenzyme Q reductase) |
| chr12_+_98987369 | 24.76 |
ENST00000401722.3
ENST00000188376.5 ENST00000228318.3 ENST00000551917.1 ENST00000548046.1 ENST00000552981.1 ENST00000551265.1 ENST00000550695.1 ENST00000547534.1 ENST00000549338.1 ENST00000548847.1 |
SLC25A3
|
solute carrier family 25 (mitochondrial carrier; phosphate carrier), member 3 |
| chr3_+_197677379 | 24.74 |
ENST00000442341.1
|
RPL35A
|
ribosomal protein L35a |
| chr6_-_8102279 | 24.67 |
ENST00000488226.2
|
EEF1E1
|
eukaryotic translation elongation factor 1 epsilon 1 |
| chr11_+_65686802 | 24.30 |
ENST00000376991.2
|
DRAP1
|
DR1-associated protein 1 (negative cofactor 2 alpha) |
| chr5_-_180671172 | 24.24 |
ENST00000512805.1
|
GNB2L1
|
guanine nucleotide binding protein (G protein), beta polypeptide 2-like 1 |
| chr4_-_103747011 | 24.10 |
ENST00000350435.7
|
UBE2D3
|
ubiquitin-conjugating enzyme E2D 3 |
| chr3_-_123304017 | 23.98 |
ENST00000383657.5
|
PTPLB
|
protein tyrosine phosphatase-like (proline instead of catalytic arginine), member b |
| chr7_-_72936531 | 23.91 |
ENST00000339594.4
|
BAZ1B
|
bromodomain adjacent to zinc finger domain, 1B |
| chr3_-_183966717 | 23.78 |
ENST00000446569.1
ENST00000418734.2 ENST00000397676.3 |
ALG3
|
ALG3, alpha-1,3- mannosyltransferase |
| chrX_+_154444643 | 23.63 |
ENST00000286428.5
|
VBP1
|
von Hippel-Lindau binding protein 1 |
| chr9_-_127177703 | 23.58 |
ENST00000259457.3
ENST00000536392.1 ENST00000441097.1 |
PSMB7
|
proteasome (prosome, macropain) subunit, beta type, 7 |
| chr7_-_6523755 | 23.41 |
ENST00000436575.1
ENST00000258739.4 |
DAGLB
KDELR2
|
diacylglycerol lipase, beta KDEL (Lys-Asp-Glu-Leu) endoplasmic reticulum protein retention receptor 2 |
| chr12_+_12966250 | 23.39 |
ENST00000352940.4
ENST00000358007.3 ENST00000544400.1 |
DDX47
|
DEAD (Asp-Glu-Ala-Asp) box polypeptide 47 |
| chrX_+_106871713 | 23.24 |
ENST00000372435.4
ENST00000372428.4 ENST00000372419.3 ENST00000543248.1 |
PRPS1
|
phosphoribosyl pyrophosphate synthetase 1 |
| chr17_-_40169429 | 22.83 |
ENST00000316603.7
ENST00000588641.1 |
DNAJC7
|
DnaJ (Hsp40) homolog, subfamily C, member 7 |
| chrX_+_70503037 | 22.74 |
ENST00000535149.1
|
NONO
|
non-POU domain containing, octamer-binding |
| chr16_-_28857677 | 22.68 |
ENST00000313511.3
|
TUFM
|
Tu translation elongation factor, mitochondrial |
| chr1_+_228270361 | 22.64 |
ENST00000272102.5
ENST00000540651.1 |
ARF1
|
ADP-ribosylation factor 1 |
| chr11_-_14379997 | 22.54 |
ENST00000526063.1
ENST00000532814.1 |
RRAS2
|
related RAS viral (r-ras) oncogene homolog 2 |
| chr3_+_197677047 | 22.46 |
ENST00000448864.1
|
RPL35A
|
ribosomal protein L35a |
| chr7_+_135242652 | 22.11 |
ENST00000285968.6
ENST00000440390.2 |
NUP205
|
nucleoporin 205kDa |
| chr15_+_89010923 | 21.99 |
ENST00000353598.6
|
MRPS11
|
mitochondrial ribosomal protein S11 |
| chr6_-_43027105 | 21.95 |
ENST00000230413.5
ENST00000487429.1 ENST00000489623.1 ENST00000468957.1 |
MRPL2
|
mitochondrial ribosomal protein L2 |
| chr17_-_40169659 | 21.70 |
ENST00000457167.4
|
DNAJC7
|
DnaJ (Hsp40) homolog, subfamily C, member 7 |
| chr9_+_131452239 | 21.66 |
ENST00000372688.4
ENST00000372686.5 |
SET
|
SET nuclear oncogene |
| chr20_+_30193083 | 21.58 |
ENST00000376112.3
ENST00000376105.3 |
ID1
|
inhibitor of DNA binding 1, dominant negative helix-loop-helix protein |
| chr3_+_184079492 | 21.29 |
ENST00000456318.1
ENST00000412877.1 ENST00000438240.1 |
POLR2H
|
polymerase (RNA) II (DNA directed) polypeptide H |
| chr20_-_49547910 | 21.22 |
ENST00000396032.3
|
ADNP
|
activity-dependent neuroprotector homeobox |
| chr17_+_4699439 | 21.18 |
ENST00000270586.3
|
PSMB6
|
proteasome (prosome, macropain) subunit, beta type, 6 |
| chr7_+_116502605 | 21.12 |
ENST00000458284.2
ENST00000490693.1 |
CAPZA2
|
capping protein (actin filament) muscle Z-line, alpha 2 |
| chr19_-_4670345 | 21.05 |
ENST00000599630.1
ENST00000262947.3 |
C19orf10
|
chromosome 19 open reading frame 10 |
| chr1_+_228270784 | 21.05 |
ENST00000541182.1
|
ARF1
|
ADP-ribosylation factor 1 |
| chr1_+_155178518 | 21.04 |
ENST00000316721.4
|
MTX1
|
metaxin 1 |
| chr3_-_48647470 | 21.01 |
ENST00000203407.5
|
UQCRC1
|
ubiquinol-cytochrome c reductase core protein I |
| chr4_-_103746683 | 20.89 |
ENST00000504211.1
ENST00000508476.1 |
UBE2D3
|
ubiquitin-conjugating enzyme E2D 3 |
| chr7_+_2394445 | 20.81 |
ENST00000360876.4
ENST00000413917.1 ENST00000397011.2 |
EIF3B
|
eukaryotic translation initiation factor 3, subunit B |
| chr2_+_114647504 | 20.80 |
ENST00000263238.2
|
ACTR3
|
ARP3 actin-related protein 3 homolog (yeast) |
| chr4_-_103746924 | 20.55 |
ENST00000505207.1
ENST00000502404.1 ENST00000507845.1 |
UBE2D3
|
ubiquitin-conjugating enzyme E2D 3 |
| chr1_+_113161778 | 20.52 |
ENST00000263168.3
|
CAPZA1
|
capping protein (actin filament) muscle Z-line, alpha 1 |
| chr6_+_160211481 | 20.51 |
ENST00000367034.4
|
MRPL18
|
mitochondrial ribosomal protein L18 |
| chr19_+_12848299 | 20.28 |
ENST00000357332.3
|
ASNA1
|
arsA arsenite transporter, ATP-binding, homolog 1 (bacterial) |
| chrX_+_48433326 | 20.23 |
ENST00000376755.1
|
RBM3
|
RNA binding motif (RNP1, RRM) protein 3 |
| chr12_-_49075941 | 20.18 |
ENST00000553086.1
ENST00000548304.1 |
KANSL2
|
KAT8 regulatory NSL complex subunit 2 |
| chr11_+_4116054 | 20.17 |
ENST00000423050.2
|
RRM1
|
ribonucleotide reductase M1 |
| chr19_-_13068012 | 20.11 |
ENST00000316939.1
|
GADD45GIP1
|
growth arrest and DNA-damage-inducible, gamma interacting protein 1 |
| chr9_+_140135665 | 19.95 |
ENST00000340384.4
|
TUBB4B
|
tubulin, beta 4B class IVb |
| chr20_+_44441626 | 19.92 |
ENST00000372568.4
|
UBE2C
|
ubiquitin-conjugating enzyme E2C |
| chr11_+_4116005 | 19.83 |
ENST00000300738.5
|
RRM1
|
ribonucleotide reductase M1 |
| chr17_-_3571934 | 19.76 |
ENST00000225525.3
|
TAX1BP3
|
Tax1 (human T-cell leukemia virus type I) binding protein 3 |
| chr12_+_93861264 | 19.71 |
ENST00000549982.1
ENST00000361630.2 |
MRPL42
|
mitochondrial ribosomal protein L42 |
| chr14_+_23235886 | 19.71 |
ENST00000604262.1
ENST00000431881.2 ENST00000412791.1 ENST00000358043.5 |
OXA1L
|
oxidase (cytochrome c) assembly 1-like |
| chr2_+_242255275 | 19.63 |
ENST00000391971.2
|
SEPT2
|
septin 2 |
| chr12_+_93861282 | 19.61 |
ENST00000552217.1
ENST00000393128.4 ENST00000547098.1 |
MRPL42
|
mitochondrial ribosomal protein L42 |
| chr17_-_685559 | 19.57 |
ENST00000301329.6
|
GLOD4
|
glyoxalase domain containing 4 |
| chr11_-_64013663 | 19.50 |
ENST00000392210.2
|
PPP1R14B
|
protein phosphatase 1, regulatory (inhibitor) subunit 14B |
| chr17_-_78120936 | 19.49 |
ENST00000576547.1
ENST00000269349.3 |
EIF4A3
|
eukaryotic translation initiation factor 4A3 |
| chr1_+_225965518 | 19.28 |
ENST00000304786.7
ENST00000366839.4 ENST00000366838.1 |
SRP9
|
signal recognition particle 9kDa |
| chr17_-_40169161 | 19.23 |
ENST00000589586.2
ENST00000426588.3 ENST00000589576.1 |
DNAJC7
|
DnaJ (Hsp40) homolog, subfamily C, member 7 |
| chr18_-_812517 | 19.10 |
ENST00000584307.1
|
YES1
|
v-yes-1 Yamaguchi sarcoma viral oncogene homolog 1 |
| chr3_-_52567792 | 18.98 |
ENST00000307092.4
ENST00000422318.2 ENST00000459839.1 |
NT5DC2
|
5'-nucleotidase domain containing 2 |
| chrX_+_47053208 | 18.97 |
ENST00000442035.1
ENST00000457753.1 ENST00000335972.6 |
UBA1
|
ubiquitin-like modifier activating enzyme 1 |
| chr11_-_111957451 | 18.88 |
ENST00000504148.2
ENST00000541231.1 |
TIMM8B
|
translocase of inner mitochondrial membrane 8 homolog B (yeast) |
| chr17_-_685493 | 18.85 |
ENST00000536578.1
ENST00000301328.5 ENST00000576419.1 |
GLOD4
|
glyoxalase domain containing 4 |
| chr19_+_36631867 | 18.77 |
ENST00000588780.1
|
CAPNS1
|
calpain, small subunit 1 |
| chr17_+_1733276 | 18.77 |
ENST00000254719.5
|
RPA1
|
replication protein A1, 70kDa |
| chr6_-_31509714 | 18.66 |
ENST00000456662.1
ENST00000431908.1 ENST00000456976.1 ENST00000428450.1 ENST00000453105.2 ENST00000418897.1 ENST00000415382.2 ENST00000449074.2 ENST00000419020.1 ENST00000428098.1 |
DDX39B
|
DEAD (Asp-Glu-Ala-Asp) box polypeptide 39B |
| chr6_-_42185583 | 18.62 |
ENST00000053468.3
|
MRPS10
|
mitochondrial ribosomal protein S10 |
| chr4_+_83956312 | 18.53 |
ENST00000509317.1
ENST00000503682.1 ENST00000511653.1 |
COPS4
|
COP9 signalosome subunit 4 |
| chr14_-_45603657 | 18.49 |
ENST00000396062.3
|
FKBP3
|
FK506 binding protein 3, 25kDa |
| chr5_+_170814803 | 18.42 |
ENST00000521672.1
ENST00000351986.6 ENST00000393820.2 ENST00000523622.1 |
NPM1
|
nucleophosmin (nucleolar phosphoprotein B23, numatrin) |
| chr3_+_23959185 | 18.40 |
ENST00000354811.5
|
RPL15
|
ribosomal protein L15 |
| chr4_+_83956237 | 18.39 |
ENST00000264389.2
|
COPS4
|
COP9 signalosome subunit 4 |
| chr3_-_49142178 | 18.32 |
ENST00000452739.1
ENST00000414533.1 ENST00000417025.1 |
QARS
|
glutaminyl-tRNA synthetase |
| chr17_+_66509019 | 18.27 |
ENST00000585981.1
ENST00000589480.1 ENST00000585815.1 |
PRKAR1A
|
protein kinase, cAMP-dependent, regulatory, type I, alpha |
| chr22_-_36236265 | 18.21 |
ENST00000414461.2
ENST00000416721.2 ENST00000449924.2 ENST00000262829.7 ENST00000397305.3 |
RBFOX2
|
RNA binding protein, fox-1 homolog (C. elegans) 2 |
| chr21_-_27107344 | 18.15 |
ENST00000457143.2
|
ATP5J
|
ATP synthase, H+ transporting, mitochondrial Fo complex, subunit F6 |
| chr19_-_55791058 | 18.14 |
ENST00000587959.1
ENST00000585927.1 ENST00000587922.1 ENST00000585698.1 |
HSPBP1
|
HSPA (heat shock 70kDa) binding protein, cytoplasmic cochaperone 1 |
| chr7_+_99686577 | 18.09 |
ENST00000303904.3
ENST00000419210.1 ENST00000418625.1 |
COPS6
|
COP9 signalosome subunit 6 |
| chr19_-_44031341 | 18.07 |
ENST00000600651.1
|
ETHE1
|
ethylmalonic encephalopathy 1 |
| chr5_+_134094461 | 18.05 |
ENST00000452510.2
ENST00000354283.4 |
DDX46
|
DEAD (Asp-Glu-Ala-Asp) box polypeptide 46 |
| chr9_+_91926103 | 18.01 |
ENST00000314355.6
|
CKS2
|
CDC28 protein kinase regulatory subunit 2 |
| chr20_-_524415 | 17.94 |
ENST00000400217.2
|
CSNK2A1
|
casein kinase 2, alpha 1 polypeptide |
| chr17_-_79481666 | 17.92 |
ENST00000575659.1
|
ACTG1
|
actin, gamma 1 |
| chr17_-_61905005 | 17.67 |
ENST00000584574.1
ENST00000585145.1 ENST00000427159.2 |
FTSJ3
|
FtsJ homolog 3 (E. coli) |
| chr16_+_67261008 | 17.60 |
ENST00000304800.9
ENST00000563953.1 ENST00000565201.1 |
TMEM208
|
transmembrane protein 208 |
| chr7_-_42971759 | 17.57 |
ENST00000538645.1
ENST00000445517.1 ENST00000223321.4 |
PSMA2
|
proteasome (prosome, macropain) subunit, alpha type, 2 |
| chr3_+_172468505 | 17.52 |
ENST00000427830.1
ENST00000417960.1 ENST00000428567.1 ENST00000366090.2 ENST00000426894.1 |
ECT2
|
epithelial cell transforming sequence 2 oncogene |
| chr21_-_27107198 | 17.48 |
ENST00000400094.1
|
ATP5J
|
ATP synthase, H+ transporting, mitochondrial Fo complex, subunit F6 |
| chrX_+_67718863 | 17.43 |
ENST00000374622.2
|
YIPF6
|
Yip1 domain family, member 6 |
| chr11_-_34937858 | 17.43 |
ENST00000278359.5
|
APIP
|
APAF1 interacting protein |
| chr17_-_5322786 | 17.38 |
ENST00000225696.4
|
NUP88
|
nucleoporin 88kDa |
| chr15_+_63340647 | 17.30 |
ENST00000404484.4
|
TPM1
|
tropomyosin 1 (alpha) |
| chr19_-_39322299 | 17.29 |
ENST00000601094.1
ENST00000595567.1 ENST00000602115.1 ENST00000601778.1 ENST00000597205.1 ENST00000595470.1 |
ECH1
|
enoyl CoA hydratase 1, peroxisomal |
| chr8_+_145149930 | 17.26 |
ENST00000318911.4
|
CYC1
|
cytochrome c-1 |
| chrX_-_48980098 | 17.23 |
ENST00000156109.5
|
GPKOW
|
G patch domain and KOW motifs |
| chr20_-_49575058 | 17.18 |
ENST00000371584.4
ENST00000371583.5 ENST00000413082.1 |
DPM1
|
dolichyl-phosphate mannosyltransferase polypeptide 1, catalytic subunit |
| chrX_-_114953669 | 17.16 |
ENST00000449327.1
|
RP1-241P17.4
|
Uncharacterized protein |
| chr19_+_39214797 | 17.12 |
ENST00000440400.1
|
ACTN4
|
actinin, alpha 4 |
| chr22_+_21921994 | 17.10 |
ENST00000545681.1
|
UBE2L3
|
ubiquitin-conjugating enzyme E2L 3 |
| chr19_-_8386238 | 17.07 |
ENST00000301457.2
|
NDUFA7
|
NADH dehydrogenase (ubiquinone) 1 alpha subcomplex, 7, 14.5kDa |
| chr7_+_116502527 | 17.07 |
ENST00000361183.3
|
CAPZA2
|
capping protein (actin filament) muscle Z-line, alpha 2 |
| chr11_+_34938119 | 17.06 |
ENST00000227868.4
ENST00000430469.2 ENST00000533262.1 |
PDHX
|
pyruvate dehydrogenase complex, component X |
| chrX_+_49028265 | 17.06 |
ENST00000376322.3
ENST00000376327.5 |
PLP2
|
proteolipid protein 2 (colonic epithelium-enriched) |
| chr21_-_27107283 | 16.93 |
ENST00000284971.3
ENST00000400099.1 |
ATP5J
|
ATP synthase, H+ transporting, mitochondrial Fo complex, subunit F6 |
| chr1_-_89357179 | 16.88 |
ENST00000448623.1
ENST00000418217.1 ENST00000370500.5 |
GTF2B
|
general transcription factor IIB |
| chr3_+_23958632 | 16.88 |
ENST00000412097.1
ENST00000415719.1 ENST00000435882.1 |
RPL15
|
ribosomal protein L15 |
| chr20_+_44441304 | 16.87 |
ENST00000352551.5
|
UBE2C
|
ubiquitin-conjugating enzyme E2C |
| chr10_+_75910960 | 16.70 |
ENST00000539909.1
ENST00000286621.2 |
ADK
|
adenosine kinase |
| chr3_+_172468472 | 16.63 |
ENST00000232458.5
ENST00000392692.3 |
ECT2
|
epithelial cell transforming sequence 2 oncogene |
| chr6_-_170862322 | 16.62 |
ENST00000262193.6
|
PSMB1
|
proteasome (prosome, macropain) subunit, beta type, 1 |
| chr6_+_36562132 | 16.55 |
ENST00000373715.6
ENST00000339436.7 |
SRSF3
|
serine/arginine-rich splicing factor 3 |
| chr17_-_4843206 | 16.54 |
ENST00000576951.1
|
SLC25A11
|
solute carrier family 25 (mitochondrial carrier; oxoglutarate carrier), member 11 |
| chrX_-_153285251 | 16.42 |
ENST00000444230.1
ENST00000393682.1 ENST00000393687.2 ENST00000429936.2 ENST00000369974.2 |
IRAK1
|
interleukin-1 receptor-associated kinase 1 |
| chr16_-_18801582 | 16.35 |
ENST00000565420.1
|
RPS15A
|
ribosomal protein S15a |
| chr1_+_155179012 | 16.31 |
ENST00000609421.1
|
MTX1
|
metaxin 1 |
| chr5_+_137514687 | 16.29 |
ENST00000394894.3
|
KIF20A
|
kinesin family member 20A |
| chr20_+_44441215 | 16.15 |
ENST00000356455.4
ENST00000405520.1 |
UBE2C
|
ubiquitin-conjugating enzyme E2C |
| chr19_-_44031375 | 16.07 |
ENST00000292147.2
|
ETHE1
|
ethylmalonic encephalopathy 1 |
| chr12_-_117628333 | 16.06 |
ENST00000427718.2
|
FBXO21
|
F-box protein 21 |
| chr3_-_58419537 | 16.06 |
ENST00000474765.1
ENST00000485460.1 ENST00000302746.6 ENST00000383714.4 |
PDHB
|
pyruvate dehydrogenase (lipoamide) beta |
| chr19_+_55897699 | 16.04 |
ENST00000558131.1
ENST00000558752.1 ENST00000458349.2 |
RPL28
|
ribosomal protein L28 |
| chr3_-_67705006 | 16.02 |
ENST00000492795.1
ENST00000493112.1 ENST00000307227.5 |
SUCLG2
|
succinate-CoA ligase, GDP-forming, beta subunit |
| chrX_+_153060090 | 16.01 |
ENST00000370086.3
ENST00000370085.3 |
SSR4
|
signal sequence receptor, delta |
| chr10_+_75936444 | 15.99 |
ENST00000372734.3
ENST00000541550.1 |
ADK
|
adenosine kinase |
| chr11_-_34938039 | 15.97 |
ENST00000395787.3
|
APIP
|
APAF1 interacting protein |
| chr17_+_73257945 | 15.89 |
ENST00000579002.1
|
MRPS7
|
mitochondrial ribosomal protein S7 |
| chr17_+_61904766 | 15.85 |
ENST00000581842.1
ENST00000582130.1 ENST00000584320.1 ENST00000585123.1 ENST00000580864.1 |
PSMC5
|
proteasome (prosome, macropain) 26S subunit, ATPase, 5 |
| chr16_-_18801643 | 15.84 |
ENST00000322989.4
ENST00000563390.1 |
RPS15A
|
ribosomal protein S15a |
| chr15_+_63340858 | 15.70 |
ENST00000560615.1
|
TPM1
|
tropomyosin 1 (alpha) |
| chr20_-_524455 | 15.69 |
ENST00000349736.5
ENST00000217244.3 |
CSNK2A1
|
casein kinase 2, alpha 1 polypeptide |
| chr17_+_7487146 | 15.67 |
ENST00000396501.4
ENST00000584378.1 ENST00000423172.2 ENST00000579445.1 ENST00000585217.1 ENST00000581380.1 |
MPDU1
|
mannose-P-dolichol utilization defect 1 |
| chr2_+_242255297 | 15.58 |
ENST00000401990.1
ENST00000407971.1 ENST00000436795.1 ENST00000411484.1 ENST00000434955.1 ENST00000402092.2 ENST00000441533.1 ENST00000443492.1 ENST00000437066.1 ENST00000429791.1 |
SEPT2
|
septin 2 |
| chr12_+_120875910 | 15.53 |
ENST00000551806.1
|
AL021546.6
|
Glutamyl-tRNA(Gln) amidotransferase subunit C, mitochondrial |
| chr16_+_57481382 | 15.51 |
ENST00000564655.1
ENST00000567072.1 ENST00000567933.1 ENST00000563166.1 |
COQ9
|
coenzyme Q9 |
| chr1_+_42921761 | 15.50 |
ENST00000372562.1
|
PPCS
|
phosphopantothenoylcysteine synthetase |
| chr5_-_180669197 | 15.49 |
ENST00000502905.1
|
GNB2L1
|
guanine nucleotide binding protein (G protein), beta polypeptide 2-like 1 |
| chr11_+_16760161 | 15.44 |
ENST00000524439.1
ENST00000422258.2 ENST00000528634.1 ENST00000525684.1 |
C11orf58
|
chromosome 11 open reading frame 58 |
| chr17_+_30677136 | 15.43 |
ENST00000394670.4
ENST00000321233.6 ENST00000394673.2 ENST00000341711.6 ENST00000579634.1 ENST00000580759.1 ENST00000342555.6 ENST00000577908.1 ENST00000394679.5 ENST00000582165.1 |
ZNF207
|
zinc finger protein 207 |
| chr17_+_7476136 | 15.40 |
ENST00000582169.1
ENST00000578754.1 ENST00000578495.1 ENST00000293831.8 ENST00000380512.5 ENST00000585024.1 ENST00000583802.1 ENST00000577269.1 ENST00000584784.1 ENST00000582746.1 |
EIF4A1
|
eukaryotic translation initiation factor 4A1 |
| chr20_+_52824367 | 15.36 |
ENST00000371419.2
|
PFDN4
|
prefoldin subunit 4 |
| chrX_-_153285395 | 15.31 |
ENST00000369980.3
|
IRAK1
|
interleukin-1 receptor-associated kinase 1 |
| chrX_+_118370288 | 15.28 |
ENST00000535419.1
|
PGRMC1
|
progesterone receptor membrane component 1 |
| chr19_+_19626531 | 15.25 |
ENST00000507754.4
|
NDUFA13
|
NADH dehydrogenase (ubiquinone) 1 alpha subcomplex, 13 |
| chr5_-_140070897 | 15.22 |
ENST00000448240.1
ENST00000438307.2 ENST00000415192.2 ENST00000457527.2 ENST00000307633.3 ENST00000507746.1 ENST00000431330.2 |
HARS
|
histidyl-tRNA synthetase |
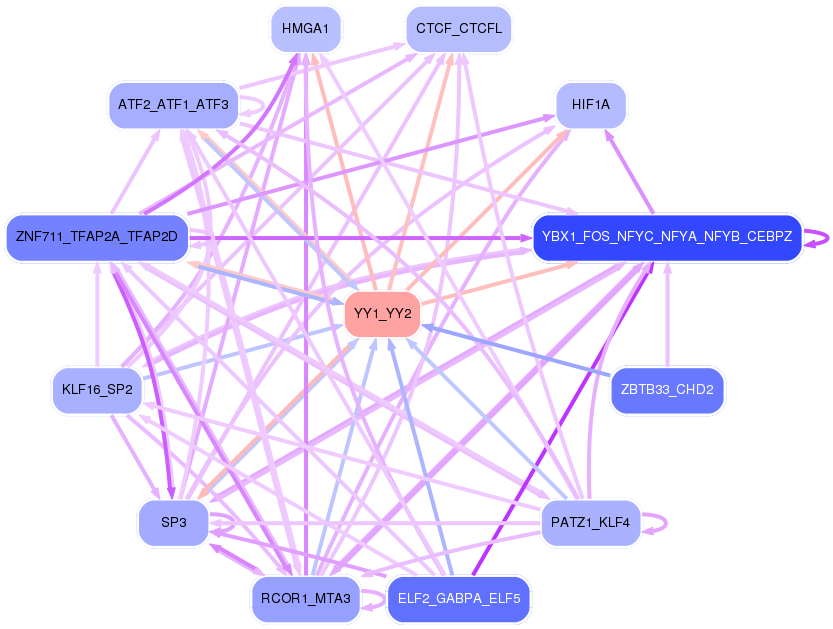
Network of associatons between targets according to the STRING database.

First level regulatory network of YY1_YY2
Gene Ontology Analysis
Gene overrepresentation in biological_process category:
| Log-likelihood per target | Total log-likelihood | Term | Description |
|---|---|---|---|
| 24.2 | 72.7 | GO:1902309 | regulation of heart rate by hormone(GO:0003064) negative regulation of peptidyl-serine dephosphorylation(GO:1902309) |
| 16.0 | 64.0 | GO:0006432 | phenylalanyl-tRNA aminoacylation(GO:0006432) |
| 14.6 | 43.7 | GO:1902822 | lysosomal membrane organization(GO:0097212) regulation of late endosome to lysosome transport(GO:1902822) |
| 13.7 | 13.7 | GO:0006679 | glucosylceramide biosynthetic process(GO:0006679) |
| 12.9 | 38.8 | GO:0045900 | negative regulation of translational elongation(GO:0045900) |
| 12.9 | 38.7 | GO:1990022 | RNA polymerase II complex import to nucleus(GO:0044376) RNA polymerase III complex localization to nucleus(GO:1990022) |
| 12.4 | 49.5 | GO:1903377 | negative regulation of oxidative stress-induced neuron intrinsic apoptotic signaling pathway(GO:1903377) |
| 11.2 | 55.8 | GO:1902904 | negative regulation of fibril organization(GO:1902904) chaperone-mediated autophagy translocation complex disassembly(GO:1904764) |
| 10.9 | 32.7 | GO:0044209 | AMP salvage(GO:0044209) |
| 10.8 | 32.4 | GO:0071790 | spindle pole body duplication(GO:0030474) spindle pole body organization(GO:0051300) spindle pole body localization(GO:0070631) establishment of spindle pole body localization(GO:0070632) spindle pole body localization to nuclear envelope(GO:0071789) establishment of spindle pole body localization to nuclear envelope(GO:0071790) |
| 10.7 | 32.0 | GO:0006425 | glutaminyl-tRNA aminoacylation(GO:0006425) |
| 10.6 | 84.8 | GO:0003065 | positive regulation of heart rate by epinephrine(GO:0003065) |
| 10.3 | 20.5 | GO:0035928 | rRNA import into mitochondrion(GO:0035928) |
| 9.6 | 48.0 | GO:0019348 | dolichol metabolic process(GO:0019348) |
| 9.5 | 75.9 | GO:0031536 | positive regulation of exit from mitosis(GO:0031536) |
| 9.4 | 28.1 | GO:0001732 | formation of cytoplasmic translation initiation complex(GO:0001732) |
| 9.3 | 111.2 | GO:1900028 | negative regulation of ruffle assembly(GO:1900028) |
| 8.9 | 26.7 | GO:0018312 | peptidyl-serine ADP-ribosylation(GO:0018312) |
| 8.9 | 70.9 | GO:0010032 | meiotic chromosome condensation(GO:0010032) |
| 8.8 | 26.5 | GO:0051086 | chaperone mediated protein folding independent of cofactor(GO:0051086) |
| 8.5 | 25.6 | GO:0018171 | peptidyl-cysteine oxidation(GO:0018171) |
| 8.5 | 34.1 | GO:1902544 | regulation of DNA N-glycosylase activity(GO:1902544) |
| 8.3 | 24.9 | GO:1900060 | negative regulation of sphingolipid biosynthetic process(GO:0090155) negative regulation of ceramide biosynthetic process(GO:1900060) |
| 8.2 | 32.7 | GO:0000960 | mitochondrial RNA catabolic process(GO:0000957) regulation of mitochondrial RNA catabolic process(GO:0000960) |
| 8.1 | 32.3 | GO:0019918 | peptidyl-arginine methylation, to symmetrical-dimethyl arginine(GO:0019918) |
| 8.0 | 16.0 | GO:1903862 | positive regulation of oxidative phosphorylation(GO:1903862) |
| 7.7 | 23.2 | GO:0006121 | mitochondrial electron transport, succinate to ubiquinone(GO:0006121) |
| 7.7 | 30.6 | GO:0043981 | histone H4-K5 acetylation(GO:0043981) histone H4-K8 acetylation(GO:0043982) |
| 7.5 | 52.3 | GO:0033484 | nitric oxide homeostasis(GO:0033484) |
| 7.3 | 29.1 | GO:1903224 | regulation of endodermal cell differentiation(GO:1903224) |
| 7.2 | 21.6 | GO:0010621 | negative regulation of transcription by transcription factor localization(GO:0010621) |
| 7.1 | 21.4 | GO:0006427 | histidyl-tRNA aminoacylation(GO:0006427) |
| 7.1 | 21.3 | GO:0070901 | mitochondrial tRNA methylation(GO:0070901) |
| 6.9 | 20.8 | GO:0016344 | meiotic chromosome movement towards spindle pole(GO:0016344) |
| 6.7 | 33.6 | GO:0006015 | 5-phosphoribose 1-diphosphate biosynthetic process(GO:0006015) 5-phosphoribose 1-diphosphate metabolic process(GO:0046391) |
| 6.6 | 26.3 | GO:1904715 | negative regulation of chaperone-mediated autophagy(GO:1904715) |
| 6.4 | 19.2 | GO:0043461 | proton-transporting ATP synthase complex assembly(GO:0043461) proton-transporting ATP synthase complex biogenesis(GO:0070272) |
| 6.3 | 87.5 | GO:0006122 | mitochondrial electron transport, ubiquinol to cytochrome c(GO:0006122) |
| 6.1 | 30.6 | GO:0006616 | SRP-dependent cotranslational protein targeting to membrane, translocation(GO:0006616) |
| 6.0 | 17.9 | GO:1904247 | positive regulation of polynucleotide adenylyltransferase activity(GO:1904247) |
| 5.9 | 17.6 | GO:0006624 | vacuolar protein processing(GO:0006624) |
| 5.8 | 40.7 | GO:0070934 | CRD-mediated mRNA stabilization(GO:0070934) |
| 5.8 | 5.8 | GO:1904815 | negative regulation of protein localization to chromosome, telomeric region(GO:1904815) |
| 5.7 | 17.1 | GO:1902396 | protein localization to bicellular tight junction(GO:1902396) |
| 5.7 | 34.1 | GO:0070221 | sulfide oxidation(GO:0019418) sulfide oxidation, using sulfide:quinone oxidoreductase(GO:0070221) |
| 5.7 | 403.6 | GO:0070126 | mitochondrial translational elongation(GO:0070125) mitochondrial translational termination(GO:0070126) |
| 5.6 | 39.5 | GO:0043144 | snoRNA processing(GO:0043144) |
| 5.6 | 16.7 | GO:0008611 | ether lipid biosynthetic process(GO:0008611) glycerol ether biosynthetic process(GO:0046504) ether biosynthetic process(GO:1901503) |
| 5.5 | 55.0 | GO:0006268 | DNA unwinding involved in DNA replication(GO:0006268) |
| 5.4 | 37.6 | GO:0000056 | ribosomal small subunit export from nucleus(GO:0000056) |
| 5.3 | 84.1 | GO:0043248 | proteasome assembly(GO:0043248) |
| 5.2 | 10.4 | GO:0006627 | protein processing involved in protein targeting to mitochondrion(GO:0006627) |
| 5.2 | 57.2 | GO:0006621 | protein retention in ER lumen(GO:0006621) |
| 5.2 | 25.9 | GO:0006104 | succinyl-CoA metabolic process(GO:0006104) |
| 5.1 | 30.6 | GO:0010724 | regulation of definitive erythrocyte differentiation(GO:0010724) |
| 5.1 | 25.5 | GO:0071035 | nuclear ncRNA surveillance(GO:0071029) nuclear polyadenylation-dependent rRNA catabolic process(GO:0071035) nuclear polyadenylation-dependent ncRNA catabolic process(GO:0071046) |
| 4.9 | 44.1 | GO:0061732 | mitochondrial acetyl-CoA biosynthetic process from pyruvate(GO:0061732) |
| 4.8 | 19.1 | GO:0019747 | regulation of isoprenoid metabolic process(GO:0019747) |
| 4.8 | 33.4 | GO:0070269 | pyroptosis(GO:0070269) |
| 4.8 | 310.0 | GO:0006120 | mitochondrial electron transport, NADH to ubiquinone(GO:0006120) |
| 4.7 | 52.1 | GO:0045040 | protein import into mitochondrial outer membrane(GO:0045040) |
| 4.7 | 9.5 | GO:2000177 | regulation of neural precursor cell proliferation(GO:2000177) |
| 4.5 | 13.5 | GO:0007057 | spindle assembly involved in female meiosis I(GO:0007057) |
| 4.5 | 139.7 | GO:0042776 | mitochondrial ATP synthesis coupled proton transport(GO:0042776) |
| 4.3 | 12.8 | GO:1903542 | negative regulation of exosomal secretion(GO:1903542) |
| 4.3 | 59.6 | GO:0070389 | chaperone cofactor-dependent protein refolding(GO:0070389) |
| 4.2 | 16.9 | GO:1904798 | positive regulation of core promoter binding(GO:1904798) |
| 4.2 | 67.5 | GO:0000338 | protein deneddylation(GO:0000338) |
| 4.2 | 20.8 | GO:0075525 | viral translational termination-reinitiation(GO:0075525) |
| 4.1 | 16.6 | GO:1904046 | negative regulation of vascular endothelial growth factor production(GO:1904046) |
| 4.0 | 12.0 | GO:0032707 | negative regulation of interleukin-23 production(GO:0032707) |
| 3.9 | 7.9 | GO:1901983 | regulation of protein acetylation(GO:1901983) |
| 3.9 | 357.1 | GO:0006521 | regulation of cellular amino acid metabolic process(GO:0006521) |
| 3.9 | 27.1 | GO:1902416 | positive regulation of mRNA binding(GO:1902416) |
| 3.8 | 18.9 | GO:0000389 | mRNA 3'-splice site recognition(GO:0000389) |
| 3.8 | 11.3 | GO:0060920 | atrioventricular node development(GO:0003162) cardiac pacemaker cell differentiation(GO:0060920) cardiac pacemaker cell development(GO:0060926) |
| 3.7 | 14.7 | GO:0048205 | COPI-coated vesicle budding(GO:0035964) Golgi transport vesicle coating(GO:0048200) COPI coating of Golgi vesicle(GO:0048205) |
| 3.5 | 14.2 | GO:0045218 | zonula adherens maintenance(GO:0045218) |
| 3.5 | 10.6 | GO:0002276 | basophil activation involved in immune response(GO:0002276) |
| 3.5 | 14.0 | GO:0061086 | negative regulation of histone H3-K27 methylation(GO:0061086) |
| 3.5 | 14.0 | GO:2001206 | positive regulation of osteoclast development(GO:2001206) |
| 3.4 | 13.8 | GO:0071894 | histone H2B conserved C-terminal lysine ubiquitination(GO:0071894) |
| 3.4 | 3.4 | GO:1902954 | regulation of early endosome to recycling endosome transport(GO:1902954) |
| 3.4 | 17.0 | GO:0010286 | heat acclimation(GO:0010286) cellular heat acclimation(GO:0070370) |
| 3.4 | 20.4 | GO:0015742 | alpha-ketoglutarate transport(GO:0015742) |
| 3.4 | 37.2 | GO:0048262 | determination of dorsal/ventral asymmetry(GO:0048262) |
| 3.3 | 9.9 | GO:0070602 | regulation of centromeric sister chromatid cohesion(GO:0070602) |
| 3.3 | 9.9 | GO:0043490 | malate-aspartate shuttle(GO:0043490) |
| 3.3 | 23.1 | GO:0070900 | mitochondrial tRNA modification(GO:0070900) mitochondrial RNA modification(GO:1900864) |
| 3.3 | 19.8 | GO:0051305 | chromosome movement towards spindle pole(GO:0051305) |
| 3.3 | 19.7 | GO:0045876 | positive regulation of sister chromatid cohesion(GO:0045876) |
| 3.2 | 45.3 | GO:0048026 | positive regulation of mRNA splicing, via spliceosome(GO:0048026) |
| 3.2 | 53.8 | GO:2000774 | positive regulation of cellular senescence(GO:2000774) |
| 3.1 | 12.5 | GO:2000435 | regulation of protein neddylation(GO:2000434) negative regulation of protein neddylation(GO:2000435) |
| 3.1 | 21.9 | GO:0097577 | intracellular sequestering of iron ion(GO:0006880) sequestering of iron ion(GO:0097577) |
| 3.0 | 15.1 | GO:0006311 | meiotic gene conversion(GO:0006311) regulation of reciprocal meiotic recombination(GO:0010520) |
| 3.0 | 3.0 | GO:0045053 | protein retention in Golgi apparatus(GO:0045053) |
| 3.0 | 23.8 | GO:1902255 | positive regulation of intrinsic apoptotic signaling pathway by p53 class mediator(GO:1902255) |
| 2.9 | 8.8 | GO:0006167 | AMP biosynthetic process(GO:0006167) |
| 2.9 | 8.8 | GO:0003164 | His-Purkinje system development(GO:0003164) |
| 2.9 | 14.5 | GO:0009181 | purine nucleoside diphosphate catabolic process(GO:0009137) purine ribonucleoside diphosphate catabolic process(GO:0009181) |
| 2.9 | 11.6 | GO:0070131 | positive regulation of mitochondrial translation(GO:0070131) |
| 2.8 | 47.9 | GO:0002192 | IRES-dependent translational initiation(GO:0002192) |
| 2.8 | 24.8 | GO:2000002 | negative regulation of DNA damage checkpoint(GO:2000002) |
| 2.7 | 35.6 | GO:0034975 | protein folding in endoplasmic reticulum(GO:0034975) |
| 2.7 | 77.3 | GO:0006221 | pyrimidine nucleotide biosynthetic process(GO:0006221) |
| 2.6 | 13.2 | GO:0035617 | stress granule disassembly(GO:0035617) |
| 2.6 | 28.9 | GO:1904263 | positive regulation of TORC1 signaling(GO:1904263) |
| 2.6 | 18.4 | GO:0060699 | regulation of endoribonuclease activity(GO:0060699) |
| 2.6 | 7.9 | GO:0090149 | mitochondrial membrane fission(GO:0090149) |
| 2.6 | 20.7 | GO:0070475 | rRNA base methylation(GO:0070475) |
| 2.6 | 7.7 | GO:0046166 | glyceraldehyde-3-phosphate biosynthetic process(GO:0046166) |
| 2.5 | 101.3 | GO:0070979 | protein K11-linked ubiquitination(GO:0070979) |
| 2.5 | 72.7 | GO:0000460 | maturation of 5.8S rRNA(GO:0000460) |
| 2.5 | 24.8 | GO:1904871 | regulation of protein localization to Cajal body(GO:1904869) positive regulation of protein localization to Cajal body(GO:1904871) |
| 2.4 | 9.7 | GO:0043555 | regulation of translation in response to stress(GO:0043555) |
| 2.4 | 7.3 | GO:0052047 | interaction with other organism via secreted substance involved in symbiotic interaction(GO:0052047) |
| 2.4 | 16.9 | GO:1901314 | negative regulation of histone ubiquitination(GO:0033183) negative regulation of protein K63-linked ubiquitination(GO:1900045) regulation of histone H2A K63-linked ubiquitination(GO:1901314) negative regulation of histone H2A K63-linked ubiquitination(GO:1901315) negative regulation of protein polyubiquitination(GO:1902915) |
| 2.4 | 19.2 | GO:0043353 | enucleate erythrocyte differentiation(GO:0043353) |
| 2.4 | 9.5 | GO:0045715 | negative regulation of low-density lipoprotein particle receptor biosynthetic process(GO:0045715) |
| 2.4 | 16.6 | GO:0001731 | formation of translation preinitiation complex(GO:0001731) |
| 2.4 | 4.7 | GO:0072204 | cell-cell signaling involved in kidney development(GO:0060995) Wnt signaling pathway involved in kidney development(GO:0061289) canonical Wnt signaling pathway involved in metanephric kidney development(GO:0061290) cell-cell signaling involved in metanephros development(GO:0072204) |
| 2.4 | 4.7 | GO:2001168 | regulation of histone H2B ubiquitination(GO:2001166) positive regulation of histone H2B ubiquitination(GO:2001168) |
| 2.4 | 49.4 | GO:0009263 | deoxyribonucleotide biosynthetic process(GO:0009263) |
| 2.3 | 9.4 | GO:0021691 | cerebellar Purkinje cell layer maturation(GO:0021691) |
| 2.3 | 7.0 | GO:2000681 | negative regulation of rubidium ion transport(GO:2000681) negative regulation of rubidium ion transmembrane transporter activity(GO:2000687) |
| 2.3 | 11.6 | GO:0090343 | positive regulation of cell aging(GO:0090343) |
| 2.3 | 77.6 | GO:0051016 | barbed-end actin filament capping(GO:0051016) |
| 2.2 | 13.1 | GO:0071763 | nuclear membrane organization(GO:0071763) |
| 2.1 | 8.5 | GO:1902963 | regulation of metalloendopeptidase activity involved in amyloid precursor protein catabolic process(GO:1902962) negative regulation of metalloendopeptidase activity involved in amyloid precursor protein catabolic process(GO:1902963) |
| 2.1 | 4.2 | GO:0035407 | histone H3-T11 phosphorylation(GO:0035407) |
| 2.1 | 21.0 | GO:0034723 | DNA replication-dependent nucleosome assembly(GO:0006335) DNA replication-dependent nucleosome organization(GO:0034723) |
| 2.1 | 2.1 | GO:2000157 | regulation of protein K48-linked deubiquitination(GO:1903093) negative regulation of protein K48-linked deubiquitination(GO:1903094) negative regulation of ubiquitin-specific protease activity(GO:2000157) |
| 2.1 | 10.4 | GO:0070601 | centromeric sister chromatid cohesion(GO:0070601) |
| 2.1 | 24.7 | GO:0071550 | death-inducing signaling complex assembly(GO:0071550) |
| 2.1 | 304.6 | GO:0045047 | protein targeting to ER(GO:0045047) |
| 2.1 | 10.3 | GO:1901838 | positive regulation of transcription of nuclear large rRNA transcript from RNA polymerase I promoter(GO:1901838) |
| 2.0 | 6.1 | GO:0016259 | selenocysteine metabolic process(GO:0016259) selenocysteine biosynthetic process(GO:0016260) |
| 2.0 | 6.1 | GO:0060278 | regulation of ovulation(GO:0060278) positive regulation of ovulation(GO:0060279) |
| 2.0 | 26.2 | GO:0070863 | positive regulation of protein exit from endoplasmic reticulum(GO:0070863) |
| 1.9 | 34.9 | GO:0034162 | toll-like receptor 9 signaling pathway(GO:0034162) |
| 1.9 | 1.9 | GO:0060623 | regulation of chromosome condensation(GO:0060623) |
| 1.9 | 89.8 | GO:0006370 | 7-methylguanosine mRNA capping(GO:0006370) |
| 1.9 | 1.9 | GO:1900110 | negative regulation of histone H3-K9 dimethylation(GO:1900110) |
| 1.8 | 8.9 | GO:0008204 | ergosterol biosynthetic process(GO:0006696) ergosterol metabolic process(GO:0008204) |
| 1.8 | 10.6 | GO:1903265 | positive regulation of tumor necrosis factor-mediated signaling pathway(GO:1903265) |
| 1.7 | 15.7 | GO:0030091 | protein repair(GO:0030091) |
| 1.7 | 28.0 | GO:0072321 | chaperone-mediated protein transport(GO:0072321) |
| 1.7 | 7.0 | GO:0090063 | positive regulation of microtubule nucleation(GO:0090063) |
| 1.7 | 32.6 | GO:0006295 | nucleotide-excision repair, preincision complex stabilization(GO:0006293) nucleotide-excision repair, DNA incision, 3'-to lesion(GO:0006295) |
| 1.7 | 5.1 | GO:0097084 | vascular smooth muscle cell development(GO:0097084) |
| 1.7 | 44.1 | GO:0042255 | ribosome assembly(GO:0042255) |
| 1.7 | 60.9 | GO:1902475 | L-alpha-amino acid transmembrane transport(GO:1902475) |
| 1.7 | 3.4 | GO:0034971 | histone H3-R17 methylation(GO:0034971) |
| 1.7 | 13.4 | GO:1900364 | negative regulation of mRNA polyadenylation(GO:1900364) |
| 1.7 | 13.3 | GO:0006189 | 'de novo' IMP biosynthetic process(GO:0006189) |
| 1.7 | 18.3 | GO:0008216 | spermidine metabolic process(GO:0008216) |
| 1.6 | 6.6 | GO:0007621 | negative regulation of female receptivity(GO:0007621) |
| 1.6 | 3.3 | GO:0035989 | tendon development(GO:0035989) |
| 1.6 | 8.2 | GO:0032417 | positive regulation of sodium:proton antiporter activity(GO:0032417) |
| 1.6 | 1.6 | GO:0043335 | protein unfolding(GO:0043335) |
| 1.6 | 16.3 | GO:0010265 | SCF complex assembly(GO:0010265) |
| 1.6 | 17.9 | GO:0045116 | protein neddylation(GO:0045116) |
| 1.6 | 6.5 | GO:1903786 | mycotoxin catabolic process(GO:0043387) aflatoxin catabolic process(GO:0046223) organic heteropentacyclic compound catabolic process(GO:1901377) regulation of glutathione biosynthetic process(GO:1903786) positive regulation of glutathione biosynthetic process(GO:1903788) |
| 1.6 | 8.1 | GO:0007221 | positive regulation of transcription of Notch receptor target(GO:0007221) |
| 1.6 | 4.8 | GO:0018008 | N-terminal peptidyl-glycine N-myristoylation(GO:0018008) peptidyl-glycine modification(GO:0018201) |
| 1.6 | 17.4 | GO:0060576 | intestinal epithelial cell development(GO:0060576) |
| 1.6 | 22.1 | GO:0006378 | mRNA polyadenylation(GO:0006378) |
| 1.6 | 7.9 | GO:0042374 | phylloquinone metabolic process(GO:0042374) phylloquinone catabolic process(GO:0042376) quinone catabolic process(GO:1901662) |
| 1.6 | 4.7 | GO:0060528 | secretory columnal luminar epithelial cell differentiation involved in prostate glandular acinus development(GO:0060528) |
| 1.6 | 9.4 | GO:0019367 | fatty acid elongation, saturated fatty acid(GO:0019367) fatty acid elongation, unsaturated fatty acid(GO:0019368) fatty acid elongation, monounsaturated fatty acid(GO:0034625) fatty acid elongation, polyunsaturated fatty acid(GO:0034626) |
| 1.6 | 4.7 | GO:0006447 | regulation of translational initiation by iron(GO:0006447) |
| 1.6 | 14.1 | GO:0050703 | interleukin-1 alpha secretion(GO:0050703) |
| 1.6 | 11.0 | GO:0003150 | muscular septum morphogenesis(GO:0003150) |
| 1.6 | 15.7 | GO:0030263 | apoptotic chromosome condensation(GO:0030263) |
| 1.5 | 15.4 | GO:1904424 | regulation of GTP binding(GO:1904424) |
| 1.5 | 3.1 | GO:1900363 | regulation of mRNA polyadenylation(GO:1900363) |
| 1.5 | 1.5 | GO:0035973 | aggrephagy(GO:0035973) |
| 1.5 | 18.3 | GO:0045835 | negative regulation of meiotic nuclear division(GO:0045835) |
| 1.5 | 6.0 | GO:0090646 | mitochondrial tRNA processing(GO:0090646) |
| 1.5 | 31.5 | GO:2000637 | positive regulation of posttranscriptional gene silencing(GO:0060148) positive regulation of gene silencing by miRNA(GO:2000637) |
| 1.5 | 4.5 | GO:0034453 | microtubule anchoring(GO:0034453) |
| 1.5 | 35.6 | GO:0006337 | nucleosome disassembly(GO:0006337) |
| 1.5 | 7.3 | GO:1902952 | positive regulation of dendritic spine maintenance(GO:1902952) |
| 1.5 | 16.1 | GO:0060628 | regulation of ER to Golgi vesicle-mediated transport(GO:0060628) |
| 1.4 | 10.1 | GO:1905049 | negative regulation of metallopeptidase activity(GO:1905049) |
| 1.4 | 11.5 | GO:0017182 | peptidyl-diphthamide metabolic process(GO:0017182) peptidyl-diphthamide biosynthetic process from peptidyl-histidine(GO:0017183) |
| 1.4 | 4.3 | GO:1900039 | positive regulation of cellular response to hypoxia(GO:1900039) |
| 1.4 | 8.6 | GO:0046826 | negative regulation of protein export from nucleus(GO:0046826) |
| 1.4 | 11.5 | GO:0033523 | histone H2B ubiquitination(GO:0033523) |
| 1.4 | 2.8 | GO:0070940 | dephosphorylation of RNA polymerase II C-terminal domain(GO:0070940) |
| 1.4 | 4.1 | GO:1902965 | regulation of protein localization to early endosome(GO:1902965) positive regulation of protein localization to early endosome(GO:1902966) |
| 1.3 | 9.4 | GO:0070141 | response to UV-A(GO:0070141) |
| 1.3 | 14.8 | GO:0051151 | negative regulation of smooth muscle cell differentiation(GO:0051151) |
| 1.3 | 9.4 | GO:1990564 | protein polyufmylation(GO:1990564) protein K69-linked ufmylation(GO:1990592) |
| 1.3 | 4.0 | GO:1902902 | negative regulation of autophagosome assembly(GO:1902902) |
| 1.3 | 24.8 | GO:0032802 | low-density lipoprotein particle receptor catabolic process(GO:0032802) |
| 1.3 | 13.0 | GO:0031468 | nuclear envelope reassembly(GO:0031468) |
| 1.3 | 11.7 | GO:2000270 | negative regulation of fibroblast apoptotic process(GO:2000270) |
| 1.3 | 22.0 | GO:0035435 | phosphate ion transmembrane transport(GO:0035435) |
| 1.3 | 46.5 | GO:0045841 | negative regulation of mitotic metaphase/anaphase transition(GO:0045841) mitotic spindle checkpoint(GO:0071174) negative regulation of metaphase/anaphase transition of cell cycle(GO:1902100) |
| 1.3 | 2.5 | GO:0014878 | response to electrical stimulus involved in regulation of muscle adaptation(GO:0014878) |
| 1.3 | 5.0 | GO:0070427 | nucleotide-binding oligomerization domain containing 1 signaling pathway(GO:0070427) |
| 1.2 | 17.2 | GO:0006488 | dolichol-linked oligosaccharide biosynthetic process(GO:0006488) |
| 1.2 | 7.3 | GO:0039526 | suppression by virus of host apoptotic process(GO:0019050) modulation by virus of host apoptotic process(GO:0039526) |
| 1.2 | 15.7 | GO:0019388 | galactose catabolic process(GO:0019388) |
| 1.2 | 9.6 | GO:0009162 | deoxyribonucleoside monophosphate metabolic process(GO:0009162) |
| 1.2 | 12.0 | GO:0045008 | depyrimidination(GO:0045008) |
| 1.2 | 4.8 | GO:0060054 | positive regulation of epithelial cell proliferation involved in wound healing(GO:0060054) |
| 1.2 | 55.5 | GO:0000413 | protein peptidyl-prolyl isomerization(GO:0000413) |
| 1.2 | 19.8 | GO:2000009 | negative regulation of protein localization to cell surface(GO:2000009) |
| 1.2 | 4.6 | GO:0008333 | endosome to lysosome transport(GO:0008333) |
| 1.2 | 13.8 | GO:0007084 | mitotic nuclear envelope reassembly(GO:0007084) |
| 1.1 | 9.1 | GO:0001675 | acrosome assembly(GO:0001675) |
| 1.1 | 1.1 | GO:0043984 | histone H4-K16 acetylation(GO:0043984) |
| 1.1 | 14.6 | GO:0000462 | maturation of SSU-rRNA from tricistronic rRNA transcript (SSU-rRNA, 5.8S rRNA, LSU-rRNA)(GO:0000462) |
| 1.1 | 195.2 | GO:0000910 | cytokinesis(GO:0000910) |
| 1.1 | 4.5 | GO:1904059 | regulation of locomotor rhythm(GO:1904059) |
| 1.1 | 10.1 | GO:0001878 | response to yeast(GO:0001878) |
| 1.1 | 101.1 | GO:0048208 | vesicle coating(GO:0006901) vesicle targeting, rough ER to cis-Golgi(GO:0048207) COPII vesicle coating(GO:0048208) |
| 1.1 | 3.3 | GO:0016561 | protein import into peroxisome matrix, translocation(GO:0016561) |
| 1.1 | 3.3 | GO:0080009 | mRNA methylation(GO:0080009) |
| 1.1 | 11.8 | GO:0032876 | negative regulation of DNA endoreduplication(GO:0032876) |
| 1.1 | 19.2 | GO:0010257 | NADH dehydrogenase complex assembly(GO:0010257) mitochondrial respiratory chain complex I assembly(GO:0032981) mitochondrial respiratory chain complex I biogenesis(GO:0097031) |
| 1.1 | 3.2 | GO:0019626 | short-chain fatty acid catabolic process(GO:0019626) |
| 1.1 | 9.5 | GO:0048096 | chromatin-mediated maintenance of transcription(GO:0048096) |
| 1.0 | 10.5 | GO:0034498 | early endosome to Golgi transport(GO:0034498) |
| 1.0 | 4.2 | GO:0042182 | ketone catabolic process(GO:0042182) |
| 1.0 | 4.0 | GO:0090261 | positive regulation of inclusion body assembly(GO:0090261) |
| 1.0 | 5.0 | GO:0051182 | coenzyme transport(GO:0051182) |
| 1.0 | 71.6 | GO:0045454 | cell redox homeostasis(GO:0045454) |
| 1.0 | 10.9 | GO:0045292 | mRNA cis splicing, via spliceosome(GO:0045292) |
| 1.0 | 12.8 | GO:0006782 | protoporphyrinogen IX biosynthetic process(GO:0006782) |
| 1.0 | 3.9 | GO:1990090 | cellular response to nerve growth factor stimulus(GO:1990090) |
| 1.0 | 29.1 | GO:0015988 | energy coupled proton transmembrane transport, against electrochemical gradient(GO:0015988) ATP hydrolysis coupled proton transport(GO:0015991) |
| 1.0 | 1.9 | GO:0061394 | regulation of transcription from RNA polymerase II promoter in response to arsenic-containing substance(GO:0061394) |
| 1.0 | 32.8 | GO:0090503 | RNA phosphodiester bond hydrolysis, exonucleolytic(GO:0090503) |
| 1.0 | 2.9 | GO:0006423 | cysteinyl-tRNA aminoacylation(GO:0006423) |
| 0.9 | 17.0 | GO:0033689 | negative regulation of osteoblast proliferation(GO:0033689) |
| 0.9 | 3.7 | GO:2001295 | malonyl-CoA biosynthetic process(GO:2001295) |
| 0.9 | 3.7 | GO:0051090 | regulation of sequence-specific DNA binding transcription factor activity(GO:0051090) |
| 0.9 | 3.6 | GO:1903660 | negative regulation of complement-dependent cytotoxicity(GO:1903660) |
| 0.9 | 22.7 | GO:0070536 | protein K63-linked deubiquitination(GO:0070536) |
| 0.9 | 38.9 | GO:0000387 | spliceosomal snRNP assembly(GO:0000387) |
| 0.9 | 23.4 | GO:0006491 | N-glycan processing(GO:0006491) |
| 0.9 | 3.5 | GO:0010936 | negative regulation of macrophage cytokine production(GO:0010936) |
| 0.9 | 0.9 | GO:0060462 | lung lobe development(GO:0060462) lung lobe morphogenesis(GO:0060463) |
| 0.9 | 25.4 | GO:0031581 | hemidesmosome assembly(GO:0031581) |
| 0.9 | 2.6 | GO:0045896 | regulation of transcription during mitosis(GO:0045896) positive regulation of transcription during mitosis(GO:0045897) |
| 0.8 | 2.5 | GO:0061073 | ciliary body morphogenesis(GO:0061073) |
| 0.8 | 24.3 | GO:0036120 | cellular response to platelet-derived growth factor stimulus(GO:0036120) |
| 0.8 | 4.2 | GO:0002084 | protein depalmitoylation(GO:0002084) |
| 0.8 | 17.6 | GO:0046697 | decidualization(GO:0046697) |
| 0.8 | 2.4 | GO:0048250 | mitochondrial iron ion transport(GO:0048250) |
| 0.8 | 9.6 | GO:0045921 | positive regulation of exocytosis(GO:0045921) |
| 0.8 | 3.2 | GO:0048199 | vesicle targeting, to, from or within Golgi(GO:0048199) |
| 0.8 | 11.0 | GO:0032486 | Rap protein signal transduction(GO:0032486) |
| 0.8 | 3.2 | GO:0060671 | epithelial cell differentiation involved in embryonic placenta development(GO:0060671) epithelial cell morphogenesis involved in placental branching(GO:0060672) |
| 0.8 | 23.5 | GO:0070534 | protein K63-linked ubiquitination(GO:0070534) |
| 0.8 | 2.4 | GO:1902499 | regulation of protein autoubiquitination(GO:1902498) positive regulation of protein autoubiquitination(GO:1902499) |
| 0.8 | 2.3 | GO:0032627 | interleukin-23 production(GO:0032627) regulation of interleukin-23 production(GO:0032667) |
| 0.8 | 10.1 | GO:0010288 | response to lead ion(GO:0010288) |
| 0.8 | 4.7 | GO:1903232 | melanosome assembly(GO:1903232) |
| 0.8 | 6.2 | GO:0009650 | UV protection(GO:0009650) |
| 0.8 | 6.2 | GO:0002051 | osteoblast fate commitment(GO:0002051) |
| 0.8 | 4.6 | GO:0016255 | attachment of GPI anchor to protein(GO:0016255) |
| 0.8 | 8.4 | GO:0006694 | steroid biosynthetic process(GO:0006694) |
| 0.8 | 2.3 | GO:0032511 | late endosome to vacuole transport via multivesicular body sorting pathway(GO:0032511) protein targeting to vacuole involved in ubiquitin-dependent protein catabolic process via the multivesicular body sorting pathway(GO:0043328) ubiquitin-dependent endocytosis(GO:0070086) regulation of ubiquitin-dependent endocytosis(GO:2000395) positive regulation of ubiquitin-dependent endocytosis(GO:2000397) |
| 0.8 | 3.0 | GO:0046627 | negative regulation of insulin receptor signaling pathway(GO:0046627) negative regulation of cellular response to insulin stimulus(GO:1900077) |
| 0.7 | 6.7 | GO:0019375 | galactosylceramide biosynthetic process(GO:0006682) galactolipid biosynthetic process(GO:0019375) glycosylceramide biosynthetic process(GO:0046476) |
| 0.7 | 11.9 | GO:0043562 | cellular response to nitrogen starvation(GO:0006995) cellular response to nitrogen levels(GO:0043562) |
| 0.7 | 5.2 | GO:1904925 | positive regulation of macromitophagy(GO:1901526) positive regulation of mitophagy in response to mitochondrial depolarization(GO:1904925) |
| 0.7 | 5.2 | GO:0032786 | positive regulation of DNA-templated transcription, elongation(GO:0032786) |
| 0.7 | 3.7 | GO:0003322 | pancreatic A cell development(GO:0003322) |
| 0.7 | 3.7 | GO:1903361 | protein localization to basolateral plasma membrane(GO:1903361) |
| 0.7 | 4.4 | GO:0031022 | nuclear migration along microfilament(GO:0031022) |
| 0.7 | 0.7 | GO:1902445 | regulation of nitrogen utilization(GO:0006808) nitrogen utilization(GO:0019740) apoptotic process involved in mammary gland involution(GO:0060057) positive regulation of apoptotic process involved in mammary gland involution(GO:0060058) positive regulation of apoptotic process involved in morphogenesis(GO:1902339) regulation of mitochondrial membrane permeability involved in programmed necrotic cell death(GO:1902445) regulation of mammary gland involution(GO:1903519) positive regulation of mammary gland involution(GO:1903521) positive regulation of apoptotic process involved in development(GO:1904747) |
| 0.7 | 10.8 | GO:0006449 | regulation of translational termination(GO:0006449) |
| 0.7 | 5.0 | GO:0006264 | mitochondrial DNA replication(GO:0006264) |
| 0.7 | 4.3 | GO:0016560 | protein import into peroxisome matrix, docking(GO:0016560) |
| 0.7 | 4.3 | GO:0042373 | vitamin K metabolic process(GO:0042373) |
| 0.7 | 2.1 | GO:0072599 | establishment of protein localization to endoplasmic reticulum(GO:0072599) |
| 0.7 | 11.8 | GO:0006123 | mitochondrial electron transport, cytochrome c to oxygen(GO:0006123) |
| 0.7 | 5.5 | GO:0060056 | mammary gland involution(GO:0060056) |
| 0.7 | 6.8 | GO:0009414 | response to water deprivation(GO:0009414) |
| 0.7 | 3.4 | GO:0097428 | protein maturation by iron-sulfur cluster transfer(GO:0097428) |
| 0.7 | 2.7 | GO:0060434 | bronchus morphogenesis(GO:0060434) |
| 0.7 | 2.0 | GO:0060718 | chorionic trophoblast cell differentiation(GO:0060718) |
| 0.7 | 2.0 | GO:0002752 | leukocyte chemotaxis involved in inflammatory response(GO:0002232) cell surface pattern recognition receptor signaling pathway(GO:0002752) |
| 0.7 | 70.6 | GO:0006413 | translational initiation(GO:0006413) |
| 0.7 | 5.9 | GO:0038007 | netrin-activated signaling pathway(GO:0038007) |
| 0.6 | 7.1 | GO:0021514 | ventral spinal cord interneuron differentiation(GO:0021514) |
| 0.6 | 10.3 | GO:0022904 | respiratory electron transport chain(GO:0022904) |
| 0.6 | 4.5 | GO:0098704 | fructose transport(GO:0015755) fructose import(GO:0032445) carbohydrate import into cell(GO:0097319) carbohydrate import across plasma membrane(GO:0098704) fructose import across plasma membrane(GO:1990539) |
| 0.6 | 6.4 | GO:0002934 | desmosome organization(GO:0002934) |
| 0.6 | 3.2 | GO:0006436 | tryptophanyl-tRNA aminoacylation(GO:0006436) |
| 0.6 | 2.5 | GO:0042271 | susceptibility to natural killer cell mediated cytotoxicity(GO:0042271) |
| 0.6 | 7.4 | GO:0035372 | protein localization to microtubule(GO:0035372) |
| 0.6 | 13.5 | GO:0032201 | telomere maintenance via semi-conservative replication(GO:0032201) |
| 0.6 | 8.4 | GO:0019852 | L-ascorbic acid metabolic process(GO:0019852) |
| 0.6 | 4.2 | GO:0061101 | neuroendocrine cell differentiation(GO:0061101) |
| 0.6 | 8.9 | GO:0044342 | type B pancreatic cell proliferation(GO:0044342) |
| 0.6 | 7.7 | GO:0060670 | branching involved in labyrinthine layer morphogenesis(GO:0060670) |
| 0.6 | 10.5 | GO:0060261 | positive regulation of transcription initiation from RNA polymerase II promoter(GO:0060261) |
| 0.6 | 7.5 | GO:0051292 | nuclear pore complex assembly(GO:0051292) |
| 0.6 | 3.5 | GO:0006789 | bilirubin conjugation(GO:0006789) |
| 0.6 | 10.8 | GO:0010971 | positive regulation of G2/M transition of mitotic cell cycle(GO:0010971) |
| 0.6 | 2.3 | GO:2000618 | regulation of histone H4-K16 acetylation(GO:2000618) |
| 0.6 | 4.5 | GO:0090043 | regulation of tubulin deacetylation(GO:0090043) |
| 0.6 | 6.7 | GO:0006108 | malate metabolic process(GO:0006108) |
| 0.6 | 1.7 | GO:0097498 | endothelial tube lumen extension(GO:0097498) |
| 0.6 | 4.4 | GO:0032096 | negative regulation of response to food(GO:0032096) negative regulation of appetite(GO:0032099) |
| 0.5 | 3.3 | GO:0006642 | triglyceride mobilization(GO:0006642) |
| 0.5 | 1.1 | GO:1900019 | regulation of protein kinase C activity(GO:1900019) positive regulation of protein kinase C activity(GO:1900020) |
| 0.5 | 20.7 | GO:0006414 | translational elongation(GO:0006414) |
| 0.5 | 1.6 | GO:0061536 | glycine secretion(GO:0061536) glycine secretion, neurotransmission(GO:0061537) |
| 0.5 | 8.2 | GO:0016226 | iron-sulfur cluster assembly(GO:0016226) metallo-sulfur cluster assembly(GO:0031163) |
| 0.5 | 12.8 | GO:0009235 | cobalamin metabolic process(GO:0009235) |
| 0.5 | 2.4 | GO:0090074 | negative regulation of protein homodimerization activity(GO:0090074) |
| 0.5 | 2.4 | GO:0018345 | protein palmitoylation(GO:0018345) |
| 0.5 | 5.2 | GO:0042026 | protein refolding(GO:0042026) |
| 0.5 | 3.3 | GO:0009146 | purine nucleoside triphosphate catabolic process(GO:0009146) |
| 0.5 | 4.2 | GO:0031987 | locomotion involved in locomotory behavior(GO:0031987) |
| 0.5 | 2.3 | GO:0016240 | autophagosome docking(GO:0016240) |
| 0.4 | 8.0 | GO:0002230 | positive regulation of defense response to virus by host(GO:0002230) |
| 0.4 | 5.8 | GO:2000675 | negative regulation of type B pancreatic cell apoptotic process(GO:2000675) |
| 0.4 | 11.4 | GO:0030262 | apoptotic nuclear changes(GO:0030262) |
| 0.4 | 8.3 | GO:0071526 | semaphorin-plexin signaling pathway(GO:0071526) |
| 0.4 | 4.7 | GO:0033197 | response to vitamin E(GO:0033197) |
| 0.4 | 1.3 | GO:0042421 | norepinephrine biosynthetic process(GO:0042421) |
| 0.4 | 2.2 | GO:0007097 | nuclear migration(GO:0007097) |
| 0.4 | 7.3 | GO:0006851 | mitochondrial calcium ion transport(GO:0006851) |
| 0.4 | 8.6 | GO:0033622 | integrin activation(GO:0033622) |
| 0.4 | 1.7 | GO:0010716 | negative regulation of extracellular matrix disassembly(GO:0010716) melanocyte proliferation(GO:0097325) |
| 0.4 | 3.4 | GO:0060158 | phospholipase C-activating dopamine receptor signaling pathway(GO:0060158) |
| 0.4 | 2.1 | GO:0034201 | response to oleic acid(GO:0034201) |
| 0.4 | 2.1 | GO:0072205 | metanephric collecting duct development(GO:0072205) |
| 0.4 | 9.3 | GO:0071542 | dopaminergic neuron differentiation(GO:0071542) |
| 0.4 | 1.2 | GO:0043297 | apical junction assembly(GO:0043297) |
| 0.4 | 5.7 | GO:0001765 | membrane raft assembly(GO:0001765) |
| 0.4 | 22.2 | GO:0007157 | heterophilic cell-cell adhesion via plasma membrane cell adhesion molecules(GO:0007157) |
| 0.4 | 3.5 | GO:0060340 | positive regulation of type I interferon-mediated signaling pathway(GO:0060340) |
| 0.4 | 30.7 | GO:0006635 | fatty acid beta-oxidation(GO:0006635) |
| 0.4 | 2.7 | GO:0060753 | regulation of mast cell chemotaxis(GO:0060753) |
| 0.4 | 1.5 | GO:0021623 | optic cup structural organization(GO:0003409) oculomotor nerve development(GO:0021557) oculomotor nerve morphogenesis(GO:0021622) oculomotor nerve formation(GO:0021623) |
| 0.4 | 18.8 | GO:0006891 | intra-Golgi vesicle-mediated transport(GO:0006891) |
| 0.4 | 5.7 | GO:0016024 | CDP-diacylglycerol biosynthetic process(GO:0016024) |
| 0.4 | 5.7 | GO:0034384 | high-density lipoprotein particle clearance(GO:0034384) |
| 0.4 | 6.5 | GO:0090190 | positive regulation of branching involved in ureteric bud morphogenesis(GO:0090190) |
| 0.4 | 3.8 | GO:0008635 | activation of cysteine-type endopeptidase activity involved in apoptotic process by cytochrome c(GO:0008635) |
| 0.4 | 2.3 | GO:0035507 | regulation of myosin-light-chain-phosphatase activity(GO:0035507) |
| 0.4 | 8.2 | GO:0035987 | endodermal cell differentiation(GO:0035987) |
| 0.4 | 8.4 | GO:0006903 | vesicle targeting(GO:0006903) |
| 0.4 | 5.8 | GO:0032060 | bleb assembly(GO:0032060) |
| 0.4 | 3.3 | GO:0071694 | sequestering of TGFbeta in extracellular matrix(GO:0035583) protein localization to extracellular region(GO:0071692) maintenance of protein location in extracellular region(GO:0071694) |
| 0.4 | 27.1 | GO:0033275 | muscle filament sliding(GO:0030049) actin-myosin filament sliding(GO:0033275) |
| 0.4 | 5.7 | GO:0060445 | branching involved in salivary gland morphogenesis(GO:0060445) |
| 0.4 | 1.1 | GO:0014707 | branchiomeric skeletal muscle development(GO:0014707) |
| 0.3 | 2.8 | GO:0033630 | positive regulation of cell adhesion mediated by integrin(GO:0033630) |
| 0.3 | 4.4 | GO:0001682 | tRNA 5'-leader removal(GO:0001682) |
| 0.3 | 5.8 | GO:0000154 | rRNA modification(GO:0000154) |
| 0.3 | 19.7 | GO:0070830 | bicellular tight junction assembly(GO:0070830) |
| 0.3 | 13.7 | GO:0045214 | sarcomere organization(GO:0045214) |
| 0.3 | 4.0 | GO:0071481 | cellular response to X-ray(GO:0071481) |
| 0.3 | 4.8 | GO:0042769 | DNA damage response, detection of DNA damage(GO:0042769) |
| 0.3 | 2.6 | GO:0061179 | negative regulation of insulin secretion involved in cellular response to glucose stimulus(GO:0061179) |
| 0.3 | 0.3 | GO:1990416 | cellular response to brain-derived neurotrophic factor stimulus(GO:1990416) |
| 0.3 | 5.6 | GO:1902165 | regulation of intrinsic apoptotic signaling pathway in response to DNA damage by p53 class mediator(GO:1902165) negative regulation of intrinsic apoptotic signaling pathway in response to DNA damage by p53 class mediator(GO:1902166) |
| 0.3 | 1.2 | GO:0010571 | positive regulation of nuclear cell cycle DNA replication(GO:0010571) |
| 0.3 | 3.4 | GO:0015886 | heme transport(GO:0015886) |
| 0.3 | 13.7 | GO:0018279 | protein N-linked glycosylation via asparagine(GO:0018279) |
| 0.3 | 3.6 | GO:0045579 | positive regulation of B cell differentiation(GO:0045579) |
| 0.3 | 3.3 | GO:0030150 | protein import into mitochondrial matrix(GO:0030150) |
| 0.3 | 5.1 | GO:0006487 | protein N-linked glycosylation(GO:0006487) |
| 0.3 | 1.5 | GO:1902659 | regulation of glucose mediated signaling pathway(GO:1902659) |
| 0.3 | 21.9 | GO:0019886 | antigen processing and presentation of exogenous peptide antigen via MHC class II(GO:0019886) |
| 0.3 | 80.0 | GO:0000398 | RNA splicing, via transesterification reactions with bulged adenosine as nucleophile(GO:0000377) mRNA splicing, via spliceosome(GO:0000398) |
| 0.3 | 29.7 | GO:0070268 | cornification(GO:0070268) |
| 0.3 | 13.2 | GO:0032781 | positive regulation of ATPase activity(GO:0032781) |
| 0.3 | 1.8 | GO:0038166 | angiotensin-activated signaling pathway(GO:0038166) |
| 0.3 | 1.5 | GO:0060712 | spongiotrophoblast layer development(GO:0060712) |
| 0.3 | 4.6 | GO:0006750 | glutathione biosynthetic process(GO:0006750) nonribosomal peptide biosynthetic process(GO:0019184) |
| 0.3 | 1.9 | GO:0072718 | response to cisplatin(GO:0072718) |
| 0.3 | 7.7 | GO:0043968 | histone H2A acetylation(GO:0043968) |
| 0.3 | 0.8 | GO:0042023 | regulation of DNA endoreduplication(GO:0032875) DNA endoreduplication(GO:0042023) |
| 0.3 | 47.0 | GO:0001649 | osteoblast differentiation(GO:0001649) |
| 0.3 | 1.0 | GO:0051552 | flavone metabolic process(GO:0051552) |
| 0.3 | 1.5 | GO:0002725 | negative regulation of T cell cytokine production(GO:0002725) |
| 0.3 | 5.8 | GO:0036075 | endochondral ossification(GO:0001958) replacement ossification(GO:0036075) |
| 0.2 | 0.7 | GO:0038030 | non-canonical Wnt signaling pathway via MAPK cascade(GO:0038030) non-canonical Wnt signaling pathway via JNK cascade(GO:0038031) |
| 0.2 | 0.5 | GO:2000623 | regulation of nuclear-transcribed mRNA catabolic process, nonsense-mediated decay(GO:2000622) negative regulation of nuclear-transcribed mRNA catabolic process, nonsense-mediated decay(GO:2000623) |
| 0.2 | 33.3 | GO:0006457 | protein folding(GO:0006457) |
| 0.2 | 0.7 | GO:0002322 | B cell proliferation involved in immune response(GO:0002322) |
| 0.2 | 0.7 | GO:0042414 | epinephrine metabolic process(GO:0042414) epinephrine biosynthetic process(GO:0042418) |
| 0.2 | 37.6 | GO:0008360 | regulation of cell shape(GO:0008360) |
| 0.2 | 2.3 | GO:0006610 | ribosomal protein import into nucleus(GO:0006610) |
| 0.2 | 0.7 | GO:0070831 | basement membrane assembly(GO:0070831) |
| 0.2 | 3.4 | GO:0060065 | uterus development(GO:0060065) |
| 0.2 | 0.4 | GO:0036022 | limb joint morphogenesis(GO:0036022) embryonic skeletal limb joint morphogenesis(GO:0036023) |
| 0.2 | 2.0 | GO:0010739 | positive regulation of protein kinase A signaling(GO:0010739) |
| 0.2 | 0.2 | GO:0040031 | snRNA modification(GO:0040031) |
| 0.2 | 7.4 | GO:0045727 | positive regulation of translation(GO:0045727) |
| 0.2 | 7.2 | GO:0032272 | negative regulation of protein polymerization(GO:0032272) |
| 0.2 | 1.6 | GO:0042985 | negative regulation of amyloid precursor protein biosynthetic process(GO:0042985) |
| 0.2 | 1.4 | GO:0005981 | regulation of glycogen catabolic process(GO:0005981) |
| 0.2 | 4.6 | GO:0016338 | calcium-independent cell-cell adhesion via plasma membrane cell-adhesion molecules(GO:0016338) |
| 0.2 | 3.9 | GO:0005980 | glycogen catabolic process(GO:0005980) |
| 0.2 | 5.3 | GO:0090004 | positive regulation of establishment of protein localization to plasma membrane(GO:0090004) |
| 0.2 | 2.2 | GO:0030970 | retrograde protein transport, ER to cytosol(GO:0030970) |
| 0.2 | 0.5 | GO:0015680 | intracellular copper ion transport(GO:0015680) |
| 0.2 | 0.4 | GO:0060040 | retinal bipolar neuron differentiation(GO:0060040) |
| 0.2 | 3.7 | GO:0007565 | female pregnancy(GO:0007565) |
| 0.2 | 4.7 | GO:0006270 | DNA replication initiation(GO:0006270) |
| 0.2 | 1.2 | GO:0019509 | L-methionine biosynthetic process from methylthioadenosine(GO:0019509) |
| 0.2 | 1.5 | GO:2000601 | positive regulation of Arp2/3 complex-mediated actin nucleation(GO:2000601) |
| 0.2 | 3.6 | GO:0045737 | positive regulation of cyclin-dependent protein serine/threonine kinase activity(GO:0045737) |
| 0.2 | 2.2 | GO:2000398 | regulation of T cell differentiation in thymus(GO:0033081) regulation of thymocyte aggregation(GO:2000398) |
| 0.2 | 4.8 | GO:0000188 | inactivation of MAPK activity(GO:0000188) |
| 0.1 | 6.2 | GO:0045773 | positive regulation of axon extension(GO:0045773) |
| 0.1 | 5.2 | GO:0010595 | positive regulation of endothelial cell migration(GO:0010595) |
| 0.1 | 0.4 | GO:0046900 | tetrahydrofolylpolyglutamate metabolic process(GO:0046900) |
| 0.1 | 4.7 | GO:0060338 | regulation of type I interferon-mediated signaling pathway(GO:0060338) |
| 0.1 | 1.1 | GO:0045793 | positive regulation of cell size(GO:0045793) |
| 0.1 | 0.7 | GO:1903313 | positive regulation of mRNA metabolic process(GO:1903313) |
| 0.1 | 0.4 | GO:0071787 | endoplasmic reticulum tubular network assembly(GO:0071787) |
| 0.1 | 4.0 | GO:0035722 | interleukin-12-mediated signaling pathway(GO:0035722) cellular response to interleukin-12(GO:0071349) |
| 0.1 | 3.6 | GO:0046329 | negative regulation of JNK cascade(GO:0046329) |
| 0.1 | 2.7 | GO:0046337 | phosphatidylethanolamine metabolic process(GO:0046337) |
| 0.1 | 1.5 | GO:0034605 | cellular response to heat(GO:0034605) |
| 0.1 | 5.9 | GO:0050766 | positive regulation of phagocytosis(GO:0050766) |
| 0.1 | 4.2 | GO:0006826 | iron ion transport(GO:0006826) |
| 0.1 | 0.3 | GO:0030307 | positive regulation of cell growth(GO:0030307) |
| 0.1 | 1.7 | GO:0060746 | maternal behavior(GO:0042711) parental behavior(GO:0060746) |
| 0.1 | 1.6 | GO:0070584 | mitochondrion morphogenesis(GO:0070584) |
| 0.1 | 0.7 | GO:0042407 | cristae formation(GO:0042407) |
| 0.1 | 6.5 | GO:0043488 | regulation of mRNA stability(GO:0043488) |
| 0.1 | 1.1 | GO:0018214 | peptidyl-glutamic acid carboxylation(GO:0017187) protein carboxylation(GO:0018214) |
| 0.1 | 0.6 | GO:0060965 | negative regulation of gene silencing by miRNA(GO:0060965) |
| 0.1 | 0.3 | GO:0051685 | endoplasmic reticulum localization(GO:0051643) maintenance of ER location(GO:0051685) |
| 0.1 | 4.2 | GO:0071230 | cellular response to amino acid stimulus(GO:0071230) |
| 0.1 | 3.0 | GO:0006893 | Golgi to plasma membrane transport(GO:0006893) |
| 0.1 | 0.8 | GO:0043247 | protection from non-homologous end joining at telomere(GO:0031848) telomere maintenance in response to DNA damage(GO:0043247) |
| 0.1 | 4.2 | GO:0031016 | pancreas development(GO:0031016) |
| 0.1 | 3.6 | GO:0043252 | sodium-independent organic anion transport(GO:0043252) |
| 0.1 | 1.8 | GO:0071577 | zinc II ion transmembrane transport(GO:0071577) |
| 0.1 | 4.0 | GO:0005977 | glycogen metabolic process(GO:0005977) |
| 0.1 | 1.7 | GO:2000369 | regulation of clathrin-mediated endocytosis(GO:2000369) |
| 0.1 | 7.8 | GO:0002576 | platelet degranulation(GO:0002576) |
| 0.1 | 5.7 | GO:0007229 | integrin-mediated signaling pathway(GO:0007229) |
| 0.1 | 0.6 | GO:1901798 | positive regulation of signal transduction by p53 class mediator(GO:1901798) |
| 0.1 | 1.6 | GO:0090398 | cellular senescence(GO:0090398) |
| 0.1 | 0.1 | GO:0009298 | GDP-mannose biosynthetic process(GO:0009298) |
| 0.1 | 0.4 | GO:0006366 | transcription from RNA polymerase II promoter(GO:0006366) |
| 0.1 | 1.1 | GO:0045830 | positive regulation of isotype switching(GO:0045830) |
| 0.1 | 0.9 | GO:0070886 | positive regulation of calcineurin-NFAT signaling cascade(GO:0070886) |
| 0.1 | 0.5 | GO:0044458 | motile cilium assembly(GO:0044458) |
| 0.1 | 2.1 | GO:1901224 | positive regulation of NIK/NF-kappaB signaling(GO:1901224) |
| 0.1 | 2.0 | GO:0046579 | positive regulation of Ras protein signal transduction(GO:0046579) |
| 0.1 | 0.3 | GO:0048703 | embryonic viscerocranium morphogenesis(GO:0048703) |
| 0.0 | 0.6 | GO:0006383 | transcription from RNA polymerase III promoter(GO:0006383) |
| 0.0 | 2.2 | GO:0030574 | collagen catabolic process(GO:0030574) |
| 0.0 | 0.8 | GO:0006704 | glucocorticoid biosynthetic process(GO:0006704) |
| 0.0 | 0.7 | GO:0006359 | regulation of transcription from RNA polymerase III promoter(GO:0006359) |
| 0.0 | 0.6 | GO:0015937 | coenzyme A biosynthetic process(GO:0015937) |
| 0.0 | 0.2 | GO:0007256 | activation of JNKK activity(GO:0007256) |
| 0.0 | 1.0 | GO:0032480 | negative regulation of type I interferon production(GO:0032480) |
| 0.0 | 0.5 | GO:0030206 | chondroitin sulfate biosynthetic process(GO:0030206) |
| 0.0 | 0.6 | GO:0051898 | negative regulation of protein kinase B signaling(GO:0051898) |
| 0.0 | 0.4 | GO:0006939 | smooth muscle contraction(GO:0006939) |
| 0.0 | 0.8 | GO:0016339 | calcium-dependent cell-cell adhesion via plasma membrane cell adhesion molecules(GO:0016339) |
| 0.0 | 0.1 | GO:0002019 | regulation of renal output by angiotensin(GO:0002019) negative regulation of gap junction assembly(GO:1903597) |
| 0.0 | 1.4 | GO:0006261 | DNA-dependent DNA replication(GO:0006261) |
| 0.0 | 1.5 | GO:0006584 | catecholamine metabolic process(GO:0006584) catechol-containing compound metabolic process(GO:0009712) |
| 0.0 | 1.2 | GO:0006397 | mRNA processing(GO:0006397) |
| 0.0 | 0.2 | GO:0042118 | endothelial cell activation(GO:0042118) |
| 0.0 | 0.1 | GO:0030513 | positive regulation of BMP signaling pathway(GO:0030513) |
| 0.0 | 0.2 | GO:0034599 | cellular response to oxidative stress(GO:0034599) |
| 0.0 | 0.7 | GO:0048514 | blood vessel morphogenesis(GO:0048514) |
| 0.0 | 0.3 | GO:0060397 | JAK-STAT cascade involved in growth hormone signaling pathway(GO:0060397) |
| 0.0 | 0.3 | GO:0045161 | neuronal ion channel clustering(GO:0045161) |
| 0.0 | 0.8 | GO:0042267 | natural killer cell mediated cytotoxicity(GO:0042267) |
| 0.0 | 0.2 | GO:0035641 | locomotory exploration behavior(GO:0035641) |
| 0.0 | 0.1 | GO:1902202 | regulation of hepatocyte growth factor receptor signaling pathway(GO:1902202) |
| 0.0 | 0.3 | GO:2000272 | negative regulation of receptor activity(GO:2000272) |
Gene overrepresentation in cellular_component category:
| Log-likelihood per target | Total log-likelihood | Term | Description |
|---|---|---|---|
| 13.2 | 211.6 | GO:0019774 | proteasome core complex, beta-subunit complex(GO:0019774) |
| 11.8 | 82.6 | GO:0016272 | prefoldin complex(GO:0016272) |
| 11.7 | 82.0 | GO:0098575 | lumenal side of lysosomal membrane(GO:0098575) |
| 11.4 | 34.1 | GO:0071159 | NF-kappaB complex(GO:0071159) |
| 10.8 | 32.4 | GO:0070762 | nuclear pore transmembrane ring(GO:0070762) |
| 10.0 | 40.0 | GO:0005971 | ribonucleoside-diphosphate reductase complex(GO:0005971) |
| 9.7 | 77.9 | GO:0042382 | paraspeckles(GO:0042382) |
| 9.7 | 29.1 | GO:0005588 | collagen type V trimer(GO:0005588) |
| 9.3 | 27.8 | GO:0033185 | dolichol-phosphate-mannose synthase complex(GO:0033185) |
| 8.5 | 93.5 | GO:0005750 | mitochondrial respiratory chain complex III(GO:0005750) respiratory chain complex III(GO:0045275) |
| 8.2 | 33.0 | GO:0017059 | serine C-palmitoyltransferase complex(GO:0017059) endoplasmic reticulum palmitoyltransferase complex(GO:0031211) |
| 8.1 | 32.4 | GO:0045283 | mitochondrial respiratory chain complex II, succinate dehydrogenase complex (ubiquinone)(GO:0005749) succinate dehydrogenase complex (ubiquinone)(GO:0045257) respiratory chain complex II(GO:0045273) succinate dehydrogenase complex(GO:0045281) fumarate reductase complex(GO:0045283) |
| 8.0 | 79.6 | GO:0008541 | proteasome regulatory particle, lid subcomplex(GO:0008541) |
| 7.9 | 70.7 | GO:0071541 | eukaryotic translation initiation factor 3 complex, eIF3m(GO:0071541) |
| 7.6 | 206.4 | GO:0005763 | organellar small ribosomal subunit(GO:0000314) mitochondrial small ribosomal subunit(GO:0005763) |
| 7.1 | 70.9 | GO:0000796 | condensin complex(GO:0000796) |
| 6.8 | 34.2 | GO:0097149 | centralspindlin complex(GO:0097149) |
| 6.8 | 20.4 | GO:0035370 | UBC13-UEV1A complex(GO:0035370) |
| 6.7 | 33.7 | GO:0045272 | plasma membrane respiratory chain complex I(GO:0045272) plasma membrane respiratory chain(GO:0070470) |
| 6.5 | 51.8 | GO:0071204 | histone pre-mRNA 3'end processing complex(GO:0071204) |
| 6.3 | 31.7 | GO:0045323 | interleukin-1 receptor complex(GO:0045323) |
| 6.3 | 25.2 | GO:0070985 | TFIIK complex(GO:0070985) |
| 6.2 | 112.1 | GO:0000276 | mitochondrial proton-transporting ATP synthase complex, coupling factor F(o)(GO:0000276) |
| 6.2 | 104.9 | GO:0034709 | methylosome(GO:0034709) |
| 6.1 | 36.5 | GO:0071256 | Sec61 translocon complex(GO:0005784) translocon complex(GO:0071256) |
| 6.0 | 17.9 | GO:0043224 | nuclear SCF ubiquitin ligase complex(GO:0043224) |
| 5.9 | 111.5 | GO:0005862 | muscle thin filament tropomyosin(GO:0005862) |
| 5.8 | 23.2 | GO:0002189 | ribose phosphate diphosphokinase complex(GO:0002189) |
| 5.5 | 21.9 | GO:0070288 | intracellular ferritin complex(GO:0008043) ferritin complex(GO:0070288) |
| 5.5 | 27.3 | GO:0030678 | mitochondrial ribonuclease P complex(GO:0030678) |
| 5.3 | 58.0 | GO:0031595 | nuclear proteasome complex(GO:0031595) |
| 5.2 | 78.5 | GO:0005689 | U12-type spliceosomal complex(GO:0005689) |
| 5.1 | 40.8 | GO:0005786 | signal recognition particle, endoplasmic reticulum targeting(GO:0005786) |
| 5.0 | 15.1 | GO:0032302 | MutSbeta complex(GO:0032302) |
| 5.0 | 14.9 | GO:1903349 | omegasome membrane(GO:1903349) |
| 4.8 | 100.8 | GO:0017101 | aminoacyl-tRNA synthetase multienzyme complex(GO:0017101) |
| 4.7 | 23.7 | GO:0034457 | Mpp10 complex(GO:0034457) |
| 4.7 | 14.0 | GO:0031372 | UBC13-MMS2 complex(GO:0031372) |
| 4.6 | 69.1 | GO:0008290 | F-actin capping protein complex(GO:0008290) |
| 4.6 | 193.3 | GO:0000313 | organellar ribosome(GO:0000313) mitochondrial ribosome(GO:0005761) |
| 4.5 | 58.3 | GO:0042555 | MCM complex(GO:0042555) |
| 4.4 | 13.3 | GO:0005850 | eukaryotic translation initiation factor 2 complex(GO:0005850) |
| 4.4 | 48.5 | GO:0000176 | nuclear exosome (RNase complex)(GO:0000176) |
| 4.4 | 30.7 | GO:0016589 | NURF complex(GO:0016589) |
| 4.3 | 30.0 | GO:0005854 | nascent polypeptide-associated complex(GO:0005854) |
| 3.9 | 51.3 | GO:0002199 | zona pellucida receptor complex(GO:0002199) |
| 3.9 | 35.3 | GO:0005638 | lamin filament(GO:0005638) |
| 3.9 | 231.3 | GO:0045271 | mitochondrial respiratory chain complex I(GO:0005747) NADH dehydrogenase complex(GO:0030964) respiratory chain complex I(GO:0045271) |
| 3.6 | 10.9 | GO:0034455 | t-UTP complex(GO:0034455) |
| 3.5 | 13.8 | GO:1990423 | RZZ complex(GO:1990423) |
| 3.4 | 3.4 | GO:0071203 | WASH complex(GO:0071203) |
| 3.3 | 13.4 | GO:1990730 | VCP-NSFL1C complex(GO:1990730) |
| 3.3 | 33.1 | GO:0045254 | pyruvate dehydrogenase complex(GO:0045254) |
| 3.3 | 23.1 | GO:0005956 | protein kinase CK2 complex(GO:0005956) |
| 3.3 | 13.2 | GO:0044611 | nuclear pore inner ring(GO:0044611) |
| 3.3 | 26.3 | GO:0070552 | BRISC complex(GO:0070552) |
| 3.2 | 22.6 | GO:0046581 | intercellular canaliculus(GO:0046581) |
| 3.2 | 22.2 | GO:0005787 | signal peptidase complex(GO:0005787) |
| 3.2 | 9.5 | GO:0034686 | integrin alphav-beta6 complex(GO:0034685) integrin alphav-beta8 complex(GO:0034686) |
| 3.2 | 94.9 | GO:0005680 | anaphase-promoting complex(GO:0005680) |
| 3.1 | 40.4 | GO:0033180 | proton-transporting V-type ATPase, V1 domain(GO:0033180) |
| 3.1 | 24.8 | GO:0005687 | U4 snRNP(GO:0005687) |
| 3.1 | 9.2 | GO:0005826 | actomyosin contractile ring(GO:0005826) GID complex(GO:0034657) |
| 3.0 | 15.2 | GO:0005721 | pericentric heterochromatin(GO:0005721) |
| 3.0 | 8.9 | GO:0005873 | plus-end kinesin complex(GO:0005873) |
| 3.0 | 8.9 | GO:0034676 | integrin alpha6-beta4 complex(GO:0034676) |
| 3.0 | 20.7 | GO:1990452 | Parkin-FBXW7-Cul1 ubiquitin ligase complex(GO:1990452) |
| 2.9 | 20.1 | GO:0061700 | GATOR2 complex(GO:0061700) |
| 2.8 | 45.3 | GO:0005852 | eukaryotic translation initiation factor 3 complex(GO:0005852) |
| 2.8 | 74.7 | GO:0032040 | small-subunit processome(GO:0032040) |
| 2.7 | 13.4 | GO:0002193 | MAML1-RBP-Jkappa- ICN1 complex(GO:0002193) |
| 2.7 | 13.4 | GO:0035061 | interchromatin granule(GO:0035061) |
| 2.6 | 7.9 | GO:0031262 | Ndc80 complex(GO:0031262) |
| 2.6 | 31.0 | GO:0019773 | proteasome core complex, alpha-subunit complex(GO:0019773) |
| 2.4 | 24.4 | GO:0072357 | PTW/PP1 phosphatase complex(GO:0072357) |
| 2.4 | 19.2 | GO:0005610 | laminin-5 complex(GO:0005610) |
| 2.4 | 56.9 | GO:0030137 | COPI-coated vesicle(GO:0030137) |
| 2.4 | 26.0 | GO:0098799 | outer mitochondrial membrane protein complex(GO:0098799) |
| 2.4 | 18.9 | GO:0042719 | mitochondrial intermembrane space protein transporter complex(GO:0042719) |
| 2.3 | 9.2 | GO:0071001 | U4/U6 snRNP(GO:0071001) |
| 2.3 | 6.9 | GO:0030289 | protein phosphatase 4 complex(GO:0030289) |
| 2.3 | 57.2 | GO:0005666 | DNA-directed RNA polymerase III complex(GO:0005666) |
| 2.2 | 17.9 | GO:0032133 | chromosome passenger complex(GO:0032133) |
| 2.2 | 15.4 | GO:0031465 | Cul4B-RING E3 ubiquitin ligase complex(GO:0031465) |
| 2.1 | 10.6 | GO:0000836 | Hrd1p ubiquitin ligase complex(GO:0000836) |
| 2.0 | 24.3 | GO:0008250 | oligosaccharyltransferase complex(GO:0008250) |
| 2.0 | 28.3 | GO:0005753 | mitochondrial proton-transporting ATP synthase complex(GO:0005753) |
| 2.0 | 43.7 | GO:0016281 | eukaryotic translation initiation factor 4F complex(GO:0016281) |
| 2.0 | 21.6 | GO:0005838 | proteasome regulatory particle(GO:0005838) |
| 1.9 | 19.3 | GO:0016593 | Cdc73/Paf1 complex(GO:0016593) |
| 1.9 | 11.6 | GO:0031429 | box H/ACA snoRNP complex(GO:0031429) box H/ACA RNP complex(GO:0072588) box H/ACA scaRNP complex(GO:0072589) box H/ACA telomerase RNP complex(GO:0090661) |
| 1.9 | 42.1 | GO:0031105 | septin complex(GO:0031105) |
| 1.9 | 15.3 | GO:0034719 | SMN-Sm protein complex(GO:0034719) Gemini of coiled bodies(GO:0097504) |
| 1.9 | 204.5 | GO:0015934 | large ribosomal subunit(GO:0015934) |
| 1.9 | 100.8 | GO:0005871 | kinesin complex(GO:0005871) |
| 1.8 | 34.5 | GO:0005885 | Arp2/3 protein complex(GO:0005885) |
| 1.8 | 18.1 | GO:0031616 | spindle pole centrosome(GO:0031616) |
| 1.8 | 23.5 | GO:0008385 | IkappaB kinase complex(GO:0008385) |
| 1.8 | 19.8 | GO:0097550 | transcriptional preinitiation complex(GO:0097550) |
| 1.8 | 19.7 | GO:0005751 | mitochondrial respiratory chain complex IV(GO:0005751) |
| 1.8 | 33.8 | GO:0036020 | endolysosome membrane(GO:0036020) |
| 1.7 | 77.6 | GO:0008180 | COP9 signalosome(GO:0008180) |
| 1.7 | 26.8 | GO:0000178 | exosome (RNase complex)(GO:0000178) |
| 1.7 | 51.5 | GO:0030687 | preribosome, large subunit precursor(GO:0030687) |
| 1.6 | 19.7 | GO:0005746 | mitochondrial respiratory chain(GO:0005746) |
| 1.6 | 4.8 | GO:0031415 | NatA complex(GO:0031415) |
| 1.6 | 12.8 | GO:0097208 | alveolar lamellar body(GO:0097208) |
| 1.6 | 19.2 | GO:0042405 | nuclear inclusion body(GO:0042405) |
| 1.6 | 21.8 | GO:0005662 | DNA replication factor A complex(GO:0005662) |
| 1.5 | 7.7 | GO:0019907 | cyclin-dependent protein kinase activating kinase holoenzyme complex(GO:0019907) |
| 1.5 | 20.1 | GO:0097433 | dense body(GO:0097433) |
| 1.5 | 6.2 | GO:0031510 | SUMO activating enzyme complex(GO:0031510) |
| 1.5 | 12.2 | GO:0036513 | Derlin-1 retrotranslocation complex(GO:0036513) |
| 1.5 | 4.6 | GO:0042765 | GPI-anchor transamidase complex(GO:0042765) |
| 1.5 | 6.0 | GO:0032044 | DSIF complex(GO:0032044) |
| 1.5 | 158.8 | GO:0005840 | ribosome(GO:0005840) |
| 1.5 | 11.7 | GO:0051286 | cell tip(GO:0051286) |
| 1.4 | 8.6 | GO:0044614 | nuclear pore cytoplasmic filaments(GO:0044614) |
| 1.4 | 8.5 | GO:0070381 | endosome to plasma membrane transport vesicle(GO:0070381) |
| 1.4 | 4.2 | GO:0043511 | inhibin complex(GO:0043511) inhibin A complex(GO:0043512) |
| 1.4 | 26.4 | GO:0071782 | endoplasmic reticulum tubular network(GO:0071782) |
| 1.4 | 9.7 | GO:0005851 | eukaryotic translation initiation factor 2B complex(GO:0005851) |
| 1.3 | 88.8 | GO:0033116 | endoplasmic reticulum-Golgi intermediate compartment membrane(GO:0033116) |
| 1.3 | 10.7 | GO:0042824 | MHC class I peptide loading complex(GO:0042824) |
| 1.3 | 16.6 | GO:0044613 | nuclear pore central transport channel(GO:0044613) |
| 1.3 | 30.1 | GO:0035098 | ESC/E(Z) complex(GO:0035098) |
| 1.2 | 6.2 | GO:0000777 | condensed chromosome kinetochore(GO:0000777) |
| 1.2 | 12.2 | GO:0000506 | glycosylphosphatidylinositol-N-acetylglucosaminyltransferase (GPI-GnT) complex(GO:0000506) |
| 1.2 | 67.5 | GO:0005801 | cis-Golgi network(GO:0005801) |
| 1.2 | 12.0 | GO:0090543 | Flemming body(GO:0090543) |
| 1.2 | 13.1 | GO:0035985 | senescence-associated heterochromatin focus(GO:0035985) |
| 1.2 | 33.3 | GO:0031143 | pseudopodium(GO:0031143) |
| 1.1 | 8.0 | GO:1990635 | proximal dendrite(GO:1990635) |
| 1.1 | 22.8 | GO:0005952 | cAMP-dependent protein kinase complex(GO:0005952) |
| 1.1 | 19.4 | GO:0030867 | rough endoplasmic reticulum membrane(GO:0030867) |
| 1.1 | 14.6 | GO:0005869 | dynactin complex(GO:0005869) |
| 1.1 | 3.3 | GO:0036396 | MIS complex(GO:0036396) mRNA editing complex(GO:0045293) |
| 1.1 | 7.7 | GO:0005685 | U1 snRNP(GO:0005685) |
| 1.1 | 10.9 | GO:0005853 | eukaryotic translation elongation factor 1 complex(GO:0005853) |
| 1.0 | 4.9 | GO:0071986 | Ragulator complex(GO:0071986) |
| 0.9 | 3.8 | GO:0089701 | U2AF(GO:0089701) |
| 0.9 | 4.7 | GO:0033503 | HULC complex(GO:0033503) |
| 0.9 | 5.6 | GO:0030905 | retromer, tubulation complex(GO:0030905) |
| 0.9 | 24.3 | GO:0031092 | platelet alpha granule membrane(GO:0031092) |
| 0.9 | 4.7 | GO:0031905 | early endosome lumen(GO:0031905) |
| 0.9 | 7.3 | GO:0098559 | cytoplasmic side of early endosome membrane(GO:0098559) |
| 0.9 | 78.6 | GO:0043195 | terminal bouton(GO:0043195) |
| 0.8 | 10.7 | GO:0030904 | retromer complex(GO:0030904) |
| 0.8 | 7.3 | GO:0032059 | bleb(GO:0032059) |
| 0.8 | 6.3 | GO:0072546 | ER membrane protein complex(GO:0072546) |
| 0.8 | 8.5 | GO:0019908 | nuclear cyclin-dependent protein kinase holoenzyme complex(GO:0019908) |
| 0.8 | 26.5 | GO:0000502 | proteasome complex(GO:0000502) |
| 0.8 | 18.1 | GO:0005684 | U2-type spliceosomal complex(GO:0005684) |
| 0.7 | 45.6 | GO:0035577 | azurophil granule membrane(GO:0035577) |
| 0.7 | 6.6 | GO:0061574 | ASAP complex(GO:0061574) |
| 0.7 | 10.2 | GO:0010369 | chromocenter(GO:0010369) |
| 0.7 | 32.7 | GO:0009295 | nucleoid(GO:0009295) mitochondrial nucleoid(GO:0042645) |
| 0.7 | 49.4 | GO:0005758 | mitochondrial intermembrane space(GO:0005758) |
| 0.6 | 1.9 | GO:0001740 | Barr body(GO:0001740) |
| 0.6 | 1.9 | GO:1990622 | CHOP-ATF3 complex(GO:1990622) |
| 0.6 | 2.6 | GO:0000798 | nuclear cohesin complex(GO:0000798) |
| 0.6 | 5.1 | GO:0016012 | sarcoglycan complex(GO:0016012) |
| 0.6 | 4.4 | GO:0034993 | microtubule organizing center attachment site(GO:0034992) LINC complex(GO:0034993) |
| 0.6 | 3.7 | GO:0034098 | VCP-NPL4-UFD1 AAA ATPase complex(GO:0034098) |
| 0.6 | 3.7 | GO:0000780 | condensed nuclear chromosome, centromeric region(GO:0000780) |
| 0.6 | 18.5 | GO:0030057 | desmosome(GO:0030057) |
| 0.6 | 3.1 | GO:0001739 | sex chromatin(GO:0001739) |
| 0.6 | 14.9 | GO:0005779 | integral component of peroxisomal membrane(GO:0005779) intrinsic component of peroxisomal membrane(GO:0031231) |
| 0.6 | 4.2 | GO:0005955 | calcineurin complex(GO:0005955) |
| 0.6 | 149.3 | GO:0005743 | mitochondrial inner membrane(GO:0005743) |
| 0.6 | 1.1 | GO:0001940 | male pronucleus(GO:0001940) |
| 0.6 | 7.3 | GO:0005577 | fibrinogen complex(GO:0005577) |
| 0.6 | 2.2 | GO:0030686 | 90S preribosome(GO:0030686) |
| 0.5 | 8.2 | GO:0030877 | beta-catenin destruction complex(GO:0030877) |
| 0.5 | 13.1 | GO:0042629 | mast cell granule(GO:0042629) |
| 0.5 | 7.0 | GO:0017119 | Golgi transport complex(GO:0017119) |
| 0.5 | 1.6 | GO:0032039 | integrator complex(GO:0032039) |
| 0.5 | 3.1 | GO:0070821 | tertiary granule membrane(GO:0070821) |
| 0.5 | 7.5 | GO:0033276 | transcription factor TFTC complex(GO:0033276) |
| 0.5 | 72.9 | GO:0030496 | midbody(GO:0030496) |
| 0.5 | 3.4 | GO:0070761 | pre-snoRNP complex(GO:0070761) |
| 0.5 | 1.9 | GO:0043625 | delta DNA polymerase complex(GO:0043625) |
| 0.5 | 26.9 | GO:0005637 | nuclear inner membrane(GO:0005637) |
| 0.5 | 12.0 | GO:0002080 | acrosomal membrane(GO:0002080) |
| 0.5 | 57.1 | GO:1904813 | ficolin-1-rich granule(GO:0101002) ficolin-1-rich granule lumen(GO:1904813) |
| 0.5 | 8.2 | GO:0031235 | intrinsic component of the cytoplasmic side of the plasma membrane(GO:0031235) |
| 0.5 | 5.9 | GO:0030478 | actin cap(GO:0030478) |
| 0.4 | 4.5 | GO:0097546 | ciliary base(GO:0097546) |
| 0.4 | 25.0 | GO:0005793 | endoplasmic reticulum-Golgi intermediate compartment(GO:0005793) |
| 0.4 | 2.7 | GO:0030991 | intraciliary transport particle A(GO:0030991) |
| 0.4 | 2.7 | GO:0031618 | nuclear pericentric heterochromatin(GO:0031618) |
| 0.4 | 4.4 | GO:0005655 | nucleolar ribonuclease P complex(GO:0005655) |
| 0.4 | 37.3 | GO:0035578 | azurophil granule lumen(GO:0035578) |
| 0.4 | 6.1 | GO:0032433 | filopodium tip(GO:0032433) |
| 0.4 | 9.2 | GO:0000421 | autophagosome membrane(GO:0000421) |
| 0.4 | 17.8 | GO:0043034 | costamere(GO:0043034) |
| 0.4 | 2.1 | GO:0035859 | Seh1-associated complex(GO:0035859) Iml1 complex(GO:1990130) |
| 0.4 | 4.1 | GO:0000164 | protein phosphatase type 1 complex(GO:0000164) |
| 0.4 | 8.4 | GO:0035145 | exon-exon junction complex(GO:0035145) |
| 0.4 | 39.5 | GO:0035579 | specific granule membrane(GO:0035579) |
| 0.4 | 14.5 | GO:0000307 | cyclin-dependent protein kinase holoenzyme complex(GO:0000307) |
| 0.4 | 6.6 | GO:1902562 | NuA4 histone acetyltransferase complex(GO:0035267) H4/H2A histone acetyltransferase complex(GO:0043189) H4 histone acetyltransferase complex(GO:1902562) |
| 0.4 | 1.5 | GO:0000444 | MIS12/MIND type complex(GO:0000444) |
| 0.4 | 18.0 | GO:0005778 | peroxisomal membrane(GO:0005778) microbody membrane(GO:0031903) |
| 0.4 | 6.1 | GO:0046540 | U4/U6 x U5 tri-snRNP complex(GO:0046540) |
| 0.4 | 24.1 | GO:0005777 | peroxisome(GO:0005777) microbody(GO:0042579) |
| 0.4 | 3.3 | GO:0005583 | fibrillar collagen trimer(GO:0005583) banded collagen fibril(GO:0098643) |
| 0.4 | 7.3 | GO:1904115 | axon cytoplasm(GO:1904115) |
| 0.3 | 11.3 | GO:0031258 | lamellipodium membrane(GO:0031258) |
| 0.3 | 1.6 | GO:0032021 | NELF complex(GO:0032021) |
| 0.3 | 8.1 | GO:0000159 | protein phosphatase type 2A complex(GO:0000159) |
| 0.3 | 5.9 | GO:0005665 | DNA-directed RNA polymerase II, core complex(GO:0005665) |
| 0.3 | 16.4 | GO:0030670 | phagocytic vesicle membrane(GO:0030670) |
| 0.3 | 10.5 | GO:0000118 | histone deacetylase complex(GO:0000118) |
| 0.3 | 3.7 | GO:0016461 | unconventional myosin complex(GO:0016461) |
| 0.3 | 3.3 | GO:0009925 | basal plasma membrane(GO:0009925) |
| 0.3 | 2.9 | GO:0005876 | spindle microtubule(GO:0005876) |
| 0.3 | 2.6 | GO:0035861 | site of double-strand break(GO:0035861) |
| 0.3 | 1.3 | GO:0070847 | core mediator complex(GO:0070847) |
| 0.2 | 0.5 | GO:0070939 | Dsl1p complex(GO:0070939) |
| 0.2 | 1.2 | GO:0005916 | fascia adherens(GO:0005916) |
| 0.2 | 11.2 | GO:0030669 | clathrin-coated endocytic vesicle membrane(GO:0030669) |
| 0.2 | 12.0 | GO:0001669 | acrosomal vesicle(GO:0001669) |
| 0.2 | 8.9 | GO:0015629 | actin cytoskeleton(GO:0015629) |
| 0.2 | 0.9 | GO:0005965 | protein farnesyltransferase complex(GO:0005965) |
| 0.2 | 3.2 | GO:1990124 | messenger ribonucleoprotein complex(GO:1990124) |
| 0.2 | 2.3 | GO:0097346 | INO80-type complex(GO:0097346) |
| 0.2 | 2.5 | GO:0071141 | SMAD protein complex(GO:0071141) |
| 0.2 | 3.9 | GO:0030127 | COPII vesicle coat(GO:0030127) |
| 0.2 | 4.1 | GO:0000812 | Swr1 complex(GO:0000812) |
| 0.2 | 1.6 | GO:0033256 | I-kappaB/NF-kappaB complex(GO:0033256) |
| 0.2 | 2.4 | GO:0097025 | MPP7-DLG1-LIN7 complex(GO:0097025) |
| 0.2 | 7.6 | GO:0101003 | ficolin-1-rich granule membrane(GO:0101003) |
| 0.2 | 14.0 | GO:0005913 | cell-cell adherens junction(GO:0005913) |
| 0.2 | 3.7 | GO:0005868 | cytoplasmic dynein complex(GO:0005868) |
| 0.2 | 0.7 | GO:0033553 | rDNA heterochromatin(GO:0033553) |
| 0.2 | 7.9 | GO:0005811 | lipid particle(GO:0005811) |
| 0.2 | 7.7 | GO:0005881 | cytoplasmic microtubule(GO:0005881) |
| 0.2 | 1.5 | GO:0031209 | SCAR complex(GO:0031209) |
| 0.1 | 3.3 | GO:0043205 | microfibril(GO:0001527) fibril(GO:0043205) |
| 0.1 | 24.3 | GO:0019897 | extrinsic component of plasma membrane(GO:0019897) |
| 0.1 | 2.2 | GO:0031089 | platelet dense granule lumen(GO:0031089) |
| 0.1 | 5.6 | GO:0034364 | high-density lipoprotein particle(GO:0034364) |
| 0.1 | 6.1 | GO:0031526 | brush border membrane(GO:0031526) |
| 0.1 | 1.6 | GO:0001673 | male germ cell nucleus(GO:0001673) |
| 0.1 | 1.2 | GO:0033588 | Elongator holoenzyme complex(GO:0033588) |
| 0.1 | 1.2 | GO:0030008 | TRAPP complex(GO:0030008) |
| 0.1 | 0.9 | GO:0042582 | primary lysosome(GO:0005766) azurophil granule(GO:0042582) |
| 0.1 | 3.1 | GO:0005719 | nuclear euchromatin(GO:0005719) |
| 0.1 | 1.1 | GO:0032045 | guanyl-nucleotide exchange factor complex(GO:0032045) |
| 0.1 | 3.7 | GO:0009898 | cytoplasmic side of plasma membrane(GO:0009898) |
| 0.1 | 2.4 | GO:0001533 | cornified envelope(GO:0001533) |
| 0.1 | 1.1 | GO:0005790 | smooth endoplasmic reticulum(GO:0005790) |
| 0.1 | 4.7 | GO:0030864 | cortical actin cytoskeleton(GO:0030864) |
| 0.1 | 4.6 | GO:0031463 | Cul3-RING ubiquitin ligase complex(GO:0031463) |
| 0.1 | 3.0 | GO:0031093 | platelet alpha granule lumen(GO:0031093) |
| 0.1 | 9.3 | GO:0001650 | fibrillar center(GO:0001650) |
| 0.1 | 2.6 | GO:0005791 | rough endoplasmic reticulum(GO:0005791) |
| 0.1 | 5.7 | GO:0005604 | basement membrane(GO:0005604) |
| 0.1 | 5.9 | GO:0042470 | melanosome(GO:0042470) pigment granule(GO:0048770) |
| 0.1 | 4.8 | GO:0017053 | transcriptional repressor complex(GO:0017053) |
| 0.0 | 2.2 | GO:0043679 | axon terminus(GO:0043679) |
| 0.0 | 1.2 | GO:0016327 | apicolateral plasma membrane(GO:0016327) |
| 0.0 | 1.3 | GO:0030667 | secretory granule membrane(GO:0030667) |
| 0.0 | 0.8 | GO:0000922 | spindle pole(GO:0000922) |
| 0.0 | 1.4 | GO:0043657 | host(GO:0018995) host cell(GO:0043657) |
| 0.0 | 0.1 | GO:0000788 | nuclear nucleosome(GO:0000788) |
| 0.0 | 2.0 | GO:0032580 | Golgi cisterna membrane(GO:0032580) |
| 0.0 | 0.3 | GO:0031201 | SNARE complex(GO:0031201) |
| 0.0 | 5.3 | GO:0005924 | cell-substrate adherens junction(GO:0005924) focal adhesion(GO:0005925) |
| 0.0 | 0.2 | GO:0070971 | endoplasmic reticulum exit site(GO:0070971) |
| 0.0 | 0.8 | GO:0032587 | ruffle membrane(GO:0032587) |
Gene overrepresentation in molecular_function category:
| Log-likelihood per target | Total log-likelihood | Term | Description |
|---|---|---|---|
| 16.0 | 64.0 | GO:0004826 | phenylalanine-tRNA ligase activity(GO:0004826) |
| 13.5 | 53.9 | GO:0005046 | KDEL sequence binding(GO:0005046) |
| 10.7 | 32.0 | GO:0004819 | glutamine-tRNA ligase activity(GO:0004819) |
| 10.7 | 32.0 | GO:0000033 | alpha-1,3-mannosyltransferase activity(GO:0000033) |
| 10.5 | 73.4 | GO:0050815 | phosphoserine binding(GO:0050815) |
| 10.2 | 71.4 | GO:0008121 | ubiquinol-cytochrome-c reductase activity(GO:0008121) oxidoreductase activity, acting on diphenols and related substances as donors, cytochrome as acceptor(GO:0016681) |
| 10.0 | 40.0 | GO:0061731 | ribonucleoside-diphosphate reductase activity, thioredoxin disulfide as acceptor(GO:0004748) oxidoreductase activity, acting on CH or CH2 groups, disulfide as acceptor(GO:0016728) ribonucleoside-diphosphate reductase activity(GO:0061731) |
| 9.3 | 27.8 | GO:0004582 | dolichyl-phosphate beta-D-mannosyltransferase activity(GO:0004582) |
| 8.9 | 26.7 | GO:1990404 | protein ADP-ribosylase activity(GO:1990404) |
| 8.7 | 26.0 | GO:0005047 | signal recognition particle binding(GO:0005047) |
| 8.1 | 32.4 | GO:0000104 | succinate dehydrogenase activity(GO:0000104) |
| 8.1 | 242.6 | GO:0004298 | threonine-type endopeptidase activity(GO:0004298) threonine-type peptidase activity(GO:0070003) |
| 8.1 | 32.3 | GO:0035243 | protein-arginine omega-N symmetric methyltransferase activity(GO:0035243) |
| 7.9 | 23.7 | GO:0042134 | rRNA primary transcript binding(GO:0042134) |
| 7.3 | 58.2 | GO:0070181 | small ribosomal subunit rRNA binding(GO:0070181) |
| 7.1 | 21.4 | GO:0004821 | histidine-tRNA ligase activity(GO:0004821) |
| 6.5 | 25.9 | GO:0004774 | succinate-CoA ligase activity(GO:0004774) |
| 5.9 | 17.7 | GO:0016435 | rRNA (guanine) methyltransferase activity(GO:0016435) |
| 5.8 | 34.8 | GO:0004749 | ribose phosphate diphosphokinase activity(GO:0004749) |
| 5.8 | 17.3 | GO:0045155 | electron transporter, transferring electrons from CoQH2-cytochrome c reductase complex and cytochrome c oxidase complex activity(GO:0045155) |
| 5.7 | 56.9 | GO:0019784 | NEDD8-specific protease activity(GO:0019784) |
| 5.3 | 58.0 | GO:0036402 | proteasome-activating ATPase activity(GO:0036402) |
| 5.2 | 15.7 | GO:0004719 | protein-L-isoaspartate (D-aspartate) O-methyltransferase activity(GO:0004719) |
| 5.2 | 15.6 | GO:0001069 | regulatory region RNA binding(GO:0001069) |
| 5.1 | 15.4 | GO:0010698 | acetyltransferase activator activity(GO:0010698) |
| 5.1 | 271.3 | GO:0050136 | NADH dehydrogenase (ubiquinone) activity(GO:0008137) NADH dehydrogenase (quinone) activity(GO:0050136) |
| 5.1 | 55.8 | GO:0055131 | C3HC4-type RING finger domain binding(GO:0055131) |
| 5.0 | 15.1 | GO:0000404 | heteroduplex DNA loop binding(GO:0000404) double-strand/single-strand DNA junction binding(GO:0000406) dinucleotide repeat insertion binding(GO:0032181) |
| 5.0 | 25.0 | GO:0015140 | malate transmembrane transporter activity(GO:0015140) |
| 4.8 | 14.5 | GO:0047631 | ADP-ribose diphosphatase activity(GO:0047631) |
| 4.8 | 14.3 | GO:0004853 | uroporphyrinogen decarboxylase activity(GO:0004853) |
| 4.5 | 31.7 | GO:0004704 | NF-kappaB-inducing kinase activity(GO:0004704) |
| 4.5 | 45.3 | GO:1990948 | ligase inhibitor activity(GO:0055104) ubiquitin ligase inhibitor activity(GO:1990948) |
| 4.2 | 21.1 | GO:0071074 | eukaryotic initiation factor eIF2 binding(GO:0071074) |
| 4.2 | 12.5 | GO:0003976 | UDP-N-acetylglucosamine-lysosomal-enzyme N-acetylglucosaminephosphotransferase activity(GO:0003976) |
| 4.1 | 33.1 | GO:0004738 | pyruvate dehydrogenase activity(GO:0004738) pyruvate dehydrogenase [NAD(P)+] activity(GO:0034603) pyruvate dehydrogenase (NAD+) activity(GO:0034604) |
| 4.1 | 28.5 | GO:0030621 | U4 snRNA binding(GO:0030621) |
| 3.9 | 27.3 | GO:0033592 | RNA strand annealing activity(GO:0033592) |
| 3.7 | 18.4 | GO:0043023 | ribosomal large subunit binding(GO:0043023) |
| 3.6 | 165.6 | GO:0061631 | ubiquitin conjugating enzyme activity(GO:0061631) |
| 3.6 | 17.9 | GO:0019788 | NEDD8 transferase activity(GO:0019788) |
| 3.6 | 14.3 | GO:0008184 | glycogen phosphorylase activity(GO:0008184) |
| 3.5 | 10.5 | GO:0000386 | second spliceosomal transesterification activity(GO:0000386) |
| 3.5 | 10.4 | GO:0004766 | spermidine synthase activity(GO:0004766) |
| 3.4 | 3.4 | GO:1990841 | promoter-specific chromatin binding(GO:1990841) |
| 3.4 | 33.8 | GO:0008097 | 5S rRNA binding(GO:0008097) |
| 3.3 | 13.2 | GO:0099609 | microtubule lateral binding(GO:0099609) |
| 3.3 | 88.7 | GO:0046933 | proton-transporting ATP synthase activity, rotational mechanism(GO:0046933) |
| 3.3 | 26.3 | GO:0016997 | exo-alpha-sialidase activity(GO:0004308) alpha-sialidase activity(GO:0016997) |
| 3.2 | 25.6 | GO:0008379 | thioredoxin peroxidase activity(GO:0008379) |
| 3.2 | 19.0 | GO:0004839 | ubiquitin activating enzyme activity(GO:0004839) |
| 3.0 | 62.7 | GO:0001055 | RNA polymerase II activity(GO:0001055) |
| 2.8 | 8.5 | GO:0097158 | pre-mRNA intronic pyrimidine-rich binding(GO:0097158) |
| 2.8 | 8.5 | GO:0035613 | RNA stem-loop binding(GO:0035613) |
| 2.7 | 184.0 | GO:0003743 | translation initiation factor activity(GO:0003743) |
| 2.7 | 5.3 | GO:0033130 | acetylcholine receptor binding(GO:0033130) |
| 2.6 | 60.7 | GO:0008327 | methyl-CpG binding(GO:0008327) |
| 2.6 | 7.9 | GO:0000253 | 3-keto sterol reductase activity(GO:0000253) |
| 2.6 | 15.7 | GO:0004614 | phosphoglucomutase activity(GO:0004614) |
| 2.6 | 7.8 | GO:0034038 | deoxyhypusine synthase activity(GO:0034038) |
| 2.6 | 5.2 | GO:0043532 | angiostatin binding(GO:0043532) |
| 2.6 | 18.0 | GO:0061575 | cyclin-dependent protein serine/threonine kinase activator activity(GO:0061575) |
| 2.5 | 85.4 | GO:0001671 | ATPase activator activity(GO:0001671) |
| 2.5 | 519.7 | GO:0003735 | structural constituent of ribosome(GO:0003735) |
| 2.5 | 7.4 | GO:0004609 | phosphatidylserine decarboxylase activity(GO:0004609) |
| 2.4 | 21.9 | GO:0004322 | ferroxidase activity(GO:0004322) oxidoreductase activity, oxidizing metal ions, oxygen as acceptor(GO:0016724) |
| 2.4 | 29.0 | GO:1990825 | sequence-specific mRNA binding(GO:1990825) |
| 2.4 | 16.8 | GO:0008312 | 7S RNA binding(GO:0008312) |
| 2.4 | 7.2 | GO:0032551 | pyrimidine nucleoside binding(GO:0001884) UTP binding(GO:0002134) pyrimidine ribonucleoside binding(GO:0032551) |
| 2.4 | 4.7 | GO:0004694 | eukaryotic translation initiation factor 2alpha kinase activity(GO:0004694) |
| 2.3 | 43.7 | GO:0016004 | phospholipase activator activity(GO:0016004) |
| 2.3 | 105.5 | GO:0003785 | actin monomer binding(GO:0003785) |
| 2.3 | 27.2 | GO:0032050 | clathrin heavy chain binding(GO:0032050) |
| 2.2 | 8.9 | GO:0051996 | farnesyl-diphosphate farnesyltransferase activity(GO:0004310) squalene synthase activity(GO:0051996) |
| 2.2 | 11.1 | GO:0071208 | histone pre-mRNA DCP binding(GO:0071208) |
| 2.2 | 35.4 | GO:0019843 | rRNA binding(GO:0019843) |
| 2.1 | 15.0 | GO:0016206 | catechol O-methyltransferase activity(GO:0016206) |
| 2.1 | 8.5 | GO:0004165 | dodecenoyl-CoA delta-isomerase activity(GO:0004165) |
| 2.1 | 44.4 | GO:0016881 | acid-amino acid ligase activity(GO:0016881) |
| 2.1 | 2.1 | GO:0036435 | K48-linked polyubiquitin binding(GO:0036435) |
| 2.1 | 10.5 | GO:1990460 | leptin receptor binding(GO:1990460) |
| 2.1 | 12.5 | GO:0008190 | eukaryotic initiation factor 4E binding(GO:0008190) |
| 2.1 | 8.3 | GO:0015319 | sodium:inorganic phosphate symporter activity(GO:0015319) |
| 2.0 | 6.1 | GO:0004756 | selenide, water dikinase activity(GO:0004756) phosphotransferase activity, paired acceptors(GO:0016781) |
| 2.0 | 8.1 | GO:0047057 | oxidoreductase activity, acting on the CH-OH group of donors, disulfide as acceptor(GO:0016900) vitamin-K-epoxide reductase (warfarin-sensitive) activity(GO:0047057) |
| 2.0 | 20.3 | GO:0004579 | dolichyl-diphosphooligosaccharide-protein glycotransferase activity(GO:0004579) |
| 2.0 | 12.0 | GO:0051021 | GDP-dissociation inhibitor binding(GO:0051021) Rho GDP-dissociation inhibitor binding(GO:0051022) |
| 2.0 | 9.9 | GO:0015183 | L-aspartate transmembrane transporter activity(GO:0015183) |
| 1.9 | 11.6 | GO:0034513 | box H/ACA snoRNA binding(GO:0034513) |
| 1.9 | 32.7 | GO:0019206 | nucleoside kinase activity(GO:0019206) |
| 1.9 | 9.5 | GO:1990430 | extracellular matrix protein binding(GO:1990430) |
| 1.9 | 9.4 | GO:0050145 | nucleoside phosphate kinase activity(GO:0050145) |
| 1.9 | 7.4 | GO:0043515 | kinetochore binding(GO:0043515) |
| 1.8 | 7.4 | GO:0004809 | tRNA (guanine-N2-)-methyltransferase activity(GO:0004809) |
| 1.8 | 63.4 | GO:0044183 | protein binding involved in protein folding(GO:0044183) |
| 1.7 | 19.0 | GO:0008253 | 5'-nucleotidase activity(GO:0008253) |
| 1.7 | 60.3 | GO:0015175 | neutral amino acid transmembrane transporter activity(GO:0015175) |
| 1.7 | 35.3 | GO:0070628 | proteasome binding(GO:0070628) |
| 1.7 | 8.3 | GO:0035368 | selenocysteine insertion sequence binding(GO:0035368) |
| 1.7 | 69.7 | GO:0004532 | exoribonuclease activity(GO:0004532) |
| 1.7 | 5.0 | GO:0008523 | sodium-dependent multivitamin transmembrane transporter activity(GO:0008523) |
| 1.6 | 11.3 | GO:0042978 | ornithine decarboxylase activator activity(GO:0042978) |
| 1.6 | 4.8 | GO:0019107 | glycylpeptide N-tetradecanoyltransferase activity(GO:0004379) myristoyltransferase activity(GO:0019107) |
| 1.6 | 6.3 | GO:0003985 | acetyl-CoA C-acetyltransferase activity(GO:0003985) |
| 1.6 | 4.7 | GO:0016810 | hydrolase activity, acting on carbon-nitrogen (but not peptide) bonds(GO:0016810) |
| 1.6 | 9.4 | GO:0102337 | fatty acid elongase activity(GO:0009922) 3-oxo-arachidoyl-CoA synthase activity(GO:0102336) 3-oxo-cerotoyl-CoA synthase activity(GO:0102337) 3-oxo-lignoceronyl-CoA synthase activity(GO:0102338) |
| 1.6 | 31.5 | GO:0005537 | mannose binding(GO:0005537) |
| 1.6 | 45.6 | GO:0017056 | structural constituent of nuclear pore(GO:0017056) |
| 1.6 | 21.7 | GO:0048027 | mRNA 5'-UTR binding(GO:0048027) |
| 1.5 | 4.6 | GO:0004464 | leukotriene-C4 synthase activity(GO:0004464) |
| 1.5 | 10.7 | GO:0050733 | RS domain binding(GO:0050733) |
| 1.5 | 4.6 | GO:0003923 | GPI-anchor transamidase activity(GO:0003923) |
| 1.5 | 10.5 | GO:0047134 | protein-disulfide reductase activity(GO:0047134) |
| 1.5 | 9.0 | GO:0005094 | Rho GDP-dissociation inhibitor activity(GO:0005094) |
| 1.5 | 12.0 | GO:0097506 | uracil DNA N-glycosylase activity(GO:0004844) deaminated base DNA N-glycosylase activity(GO:0097506) |
| 1.5 | 1.5 | GO:0061629 | RNA polymerase II sequence-specific DNA binding transcription factor binding(GO:0061629) |
| 1.4 | 25.8 | GO:0035615 | clathrin adaptor activity(GO:0035615) endocytic adaptor activity(GO:0098748) |
| 1.4 | 8.4 | GO:0008440 | inositol-1,4,5-trisphosphate 3-kinase activity(GO:0008440) |
| 1.4 | 11.0 | GO:0050833 | pyruvate transmembrane transporter activity(GO:0050833) |
| 1.4 | 45.1 | GO:0004198 | calcium-dependent cysteine-type endopeptidase activity(GO:0004198) |
| 1.3 | 6.7 | GO:0030060 | L-malate dehydrogenase activity(GO:0030060) |
| 1.3 | 12.0 | GO:0070883 | pre-miRNA binding(GO:0070883) |
| 1.3 | 21.3 | GO:0003857 | 3-hydroxyacyl-CoA dehydrogenase activity(GO:0003857) |
| 1.3 | 11.9 | GO:0015288 | porin activity(GO:0015288) |
| 1.3 | 34.1 | GO:0016702 | oxidoreductase activity, acting on single donors with incorporation of molecular oxygen, incorporation of two atoms of oxygen(GO:0016702) |
| 1.3 | 9.1 | GO:0000268 | peroxisome targeting sequence binding(GO:0000268) |
| 1.3 | 9.1 | GO:0048408 | epidermal growth factor binding(GO:0048408) |
| 1.3 | 3.9 | GO:0030628 | pre-mRNA 3'-splice site binding(GO:0030628) |
| 1.3 | 10.2 | GO:0015038 | glutathione disulfide oxidoreductase activity(GO:0015038) |
| 1.2 | 54.8 | GO:0003755 | peptidyl-prolyl cis-trans isomerase activity(GO:0003755) |
| 1.2 | 6.2 | GO:0044388 | small protein activating enzyme binding(GO:0044388) |
| 1.2 | 118.1 | GO:0008307 | structural constituent of muscle(GO:0008307) |
| 1.2 | 14.8 | GO:0019870 | potassium channel inhibitor activity(GO:0019870) |
| 1.2 | 16.0 | GO:0051537 | 2 iron, 2 sulfur cluster binding(GO:0051537) |
| 1.2 | 12.2 | GO:1904264 | ubiquitin protein ligase activity involved in ERAD pathway(GO:1904264) |
| 1.2 | 4.9 | GO:0036033 | mediator complex binding(GO:0036033) |
| 1.2 | 12.2 | GO:0017176 | phosphatidylinositol N-acetylglucosaminyltransferase activity(GO:0017176) |
| 1.2 | 9.7 | GO:0004865 | protein serine/threonine phosphatase inhibitor activity(GO:0004865) |
| 1.2 | 55.1 | GO:0051879 | Hsp90 protein binding(GO:0051879) |
| 1.2 | 1.2 | GO:0071253 | connexin binding(GO:0071253) |
| 1.2 | 8.2 | GO:0030911 | TPR domain binding(GO:0030911) |
| 1.2 | 45.8 | GO:0004864 | protein phosphatase inhibitor activity(GO:0004864) |
| 1.2 | 4.7 | GO:0035651 | AP-1 adaptor complex binding(GO:0035650) AP-3 adaptor complex binding(GO:0035651) |
| 1.2 | 2.3 | GO:0001540 | beta-amyloid binding(GO:0001540) |
| 1.2 | 28.8 | GO:0003746 | translation elongation factor activity(GO:0003746) |
| 1.1 | 22.8 | GO:0008603 | cAMP-dependent protein kinase inhibitor activity(GO:0004862) cAMP-dependent protein kinase regulator activity(GO:0008603) |
| 1.1 | 3.4 | GO:0033149 | FFAT motif binding(GO:0033149) |
| 1.1 | 6.7 | GO:0003945 | N-acetyllactosamine synthase activity(GO:0003945) |
| 1.1 | 6.7 | GO:0031543 | peptidyl-proline dioxygenase activity(GO:0031543) |
| 1.1 | 8.8 | GO:0016842 | amidine-lyase activity(GO:0016842) |
| 1.1 | 7.7 | GO:0035614 | snRNA stem-loop binding(GO:0035614) |
| 1.1 | 3.3 | GO:0035529 | NADH pyrophosphatase activity(GO:0035529) |
| 1.1 | 7.4 | GO:0035174 | histone serine kinase activity(GO:0035174) |
| 1.0 | 67.1 | GO:0005507 | copper ion binding(GO:0005507) |
| 1.0 | 42.6 | GO:0004364 | glutathione transferase activity(GO:0004364) |
| 1.0 | 8.0 | GO:0090599 | alpha-glucosidase activity(GO:0090599) |
| 1.0 | 2.9 | GO:0004711 | ribosomal protein S6 kinase activity(GO:0004711) |
| 1.0 | 14.6 | GO:0070717 | poly-purine tract binding(GO:0070717) |
| 1.0 | 2.9 | GO:0004817 | cysteine-tRNA ligase activity(GO:0004817) |
| 1.0 | 5.8 | GO:0010859 | calcium-dependent cysteine-type endopeptidase inhibitor activity(GO:0010859) |
| 1.0 | 2.9 | GO:0070699 | type II activin receptor binding(GO:0070699) |
| 0.9 | 3.7 | GO:0003989 | acetyl-CoA carboxylase activity(GO:0003989) |
| 0.9 | 9.3 | GO:0000774 | adenyl-nucleotide exchange factor activity(GO:0000774) |
| 0.9 | 15.7 | GO:0003680 | AT DNA binding(GO:0003680) |
| 0.9 | 13.7 | GO:0015114 | phosphate ion transmembrane transporter activity(GO:0015114) |
| 0.9 | 58.7 | GO:0019003 | GDP binding(GO:0019003) |
| 0.9 | 19.2 | GO:0044769 | ATPase activity, coupled to transmembrane movement of ions, rotational mechanism(GO:0044769) |
| 0.9 | 21.8 | GO:0008187 | poly-pyrimidine tract binding(GO:0008187) |
| 0.9 | 4.4 | GO:0051731 | polynucleotide 5'-hydroxyl-kinase activity(GO:0051731) |
| 0.8 | 29.5 | GO:0070577 | lysine-acetylated histone binding(GO:0070577) |
| 0.8 | 22.7 | GO:0015002 | cytochrome-c oxidase activity(GO:0004129) heme-copper terminal oxidase activity(GO:0015002) oxidoreductase activity, acting on a heme group of donors, oxygen as acceptor(GO:0016676) |
| 0.8 | 39.0 | GO:0005154 | epidermal growth factor receptor binding(GO:0005154) |
| 0.8 | 17.4 | GO:0008157 | protein phosphatase 1 binding(GO:0008157) |
| 0.8 | 2.5 | GO:0035500 | MH2 domain binding(GO:0035500) |
| 0.8 | 19.6 | GO:0042288 | MHC class I protein binding(GO:0042288) |
| 0.8 | 8.9 | GO:0001222 | transcription corepressor binding(GO:0001222) |
| 0.8 | 2.4 | GO:0070984 | SET domain binding(GO:0070984) |
| 0.8 | 14.4 | GO:0031994 | insulin-like growth factor I binding(GO:0031994) |
| 0.8 | 13.4 | GO:0003756 | protein disulfide isomerase activity(GO:0003756) intramolecular oxidoreductase activity, transposing S-S bonds(GO:0016864) |
| 0.8 | 9.4 | GO:0043274 | phospholipase binding(GO:0043274) |
| 0.8 | 7.9 | GO:0015266 | protein channel activity(GO:0015266) |
| 0.8 | 10.2 | GO:0004726 | non-membrane spanning protein tyrosine phosphatase activity(GO:0004726) |
| 0.8 | 31.2 | GO:0015078 | hydrogen ion transmembrane transporter activity(GO:0015078) |
| 0.8 | 6.2 | GO:0003696 | satellite DNA binding(GO:0003696) |
| 0.8 | 4.6 | GO:0050291 | sphingosine N-acyltransferase activity(GO:0050291) |
| 0.8 | 4.5 | GO:0030548 | acetylcholine receptor regulator activity(GO:0030548) neurotransmitter receptor regulator activity(GO:0099602) |
| 0.7 | 18.0 | GO:0070064 | proline-rich region binding(GO:0070064) |
| 0.7 | 6.7 | GO:0086083 | cell adhesive protein binding involved in bundle of His cell-Purkinje myocyte communication(GO:0086083) |
| 0.7 | 32.1 | GO:0050699 | WW domain binding(GO:0050699) |
| 0.7 | 14.7 | GO:0005487 | nucleocytoplasmic transporter activity(GO:0005487) |
| 0.7 | 3.7 | GO:0097016 | L27 domain binding(GO:0097016) |
| 0.7 | 0.7 | GO:0098847 | sequence-specific single stranded DNA binding(GO:0098847) |
| 0.7 | 12.3 | GO:0008569 | ATP-dependent microtubule motor activity, minus-end-directed(GO:0008569) |
| 0.7 | 7.2 | GO:0098505 | G-rich strand telomeric DNA binding(GO:0098505) |
| 0.7 | 7.8 | GO:0016861 | intramolecular oxidoreductase activity, interconverting aldoses and ketoses(GO:0016861) |
| 0.7 | 4.2 | GO:0035402 | histone kinase activity (H3-T11 specific)(GO:0035402) |
| 0.7 | 2.1 | GO:0000150 | recombinase activity(GO:0000150) |
| 0.7 | 4.9 | GO:0001165 | RNA polymerase I upstream control element sequence-specific DNA binding(GO:0001165) |
| 0.7 | 7.6 | GO:1990247 | N6-methyladenosine-containing RNA binding(GO:1990247) |
| 0.7 | 17.0 | GO:0043022 | ribosome binding(GO:0043022) |
| 0.7 | 6.1 | GO:0060002 | plus-end directed microfilament motor activity(GO:0060002) |
| 0.7 | 7.2 | GO:0001075 | transcription factor activity, RNA polymerase II core promoter sequence-specific binding involved in preinitiation complex assembly(GO:0001075) |
| 0.7 | 10.5 | GO:0004526 | ribonuclease P activity(GO:0004526) |
| 0.7 | 3.3 | GO:0050436 | microfibril binding(GO:0050436) |
| 0.6 | 6.5 | GO:0046966 | thyroid hormone receptor binding(GO:0046966) |
| 0.6 | 4.5 | GO:0005353 | fructose transmembrane transporter activity(GO:0005353) |
| 0.6 | 9.7 | GO:0042809 | vitamin D receptor binding(GO:0042809) |
| 0.6 | 3.2 | GO:0004830 | tryptophan-tRNA ligase activity(GO:0004830) |
| 0.6 | 20.7 | GO:0051059 | NF-kappaB binding(GO:0051059) |
| 0.6 | 2.4 | GO:0008432 | JUN kinase binding(GO:0008432) |
| 0.6 | 10.8 | GO:0070016 | armadillo repeat domain binding(GO:0070016) |
| 0.6 | 2.4 | GO:0055077 | gap junction hemi-channel activity(GO:0055077) |
| 0.6 | 12.3 | GO:0050811 | GABA receptor binding(GO:0050811) |
| 0.6 | 4.1 | GO:0034236 | protein kinase A catalytic subunit binding(GO:0034236) |
| 0.6 | 5.8 | GO:0034485 | phosphatidylinositol-3,4,5-trisphosphate 5-phosphatase activity(GO:0034485) |
| 0.6 | 2.3 | GO:0008479 | queuine tRNA-ribosyltransferase activity(GO:0008479) |
| 0.6 | 16.7 | GO:0016765 | transferase activity, transferring alkyl or aryl (other than methyl) groups(GO:0016765) |
| 0.6 | 3.4 | GO:0031826 | type 2A serotonin receptor binding(GO:0031826) |
| 0.5 | 51.1 | GO:0000980 | RNA polymerase II distal enhancer sequence-specific DNA binding(GO:0000980) |
| 0.5 | 22.9 | GO:0008094 | DNA-dependent ATPase activity(GO:0008094) |
| 0.5 | 12.5 | GO:0017025 | TBP-class protein binding(GO:0017025) |
| 0.5 | 4.2 | GO:0098599 | palmitoyl-(protein) hydrolase activity(GO:0008474) palmitoyl hydrolase activity(GO:0098599) |
| 0.5 | 3.5 | GO:0016423 | tRNA (guanine) methyltransferase activity(GO:0016423) |
| 0.5 | 27.2 | GO:0016836 | hydro-lyase activity(GO:0016836) |
| 0.5 | 17.1 | GO:0019956 | chemokine binding(GO:0019956) |
| 0.5 | 12.2 | GO:0000993 | RNA polymerase II core binding(GO:0000993) |
| 0.5 | 4.8 | GO:0004861 | cyclin-dependent protein serine/threonine kinase inhibitor activity(GO:0004861) |
| 0.5 | 1.9 | GO:0005412 | glucose:sodium symporter activity(GO:0005412) |
| 0.5 | 5.3 | GO:0097027 | ubiquitin-protein transferase activator activity(GO:0097027) |
| 0.5 | 5.2 | GO:0004887 | thyroid hormone receptor activity(GO:0004887) |
| 0.5 | 5.1 | GO:0016290 | palmitoyl-CoA hydrolase activity(GO:0016290) |
| 0.5 | 6.5 | GO:0005132 | type I interferon receptor binding(GO:0005132) |
| 0.5 | 4.2 | GO:0030346 | protein phosphatase 2B binding(GO:0030346) |
| 0.5 | 11.3 | GO:0042605 | peptide antigen binding(GO:0042605) |
| 0.4 | 4.5 | GO:0051434 | BH3 domain binding(GO:0051434) |
| 0.4 | 6.2 | GO:0030618 | transforming growth factor beta receptor, pathway-specific cytoplasmic mediator activity(GO:0030618) |
| 0.4 | 18.8 | GO:0042169 | SH2 domain binding(GO:0042169) |
| 0.4 | 6.9 | GO:0008408 | 3'-5' exonuclease activity(GO:0008408) |
| 0.4 | 3.4 | GO:0030274 | LIM domain binding(GO:0030274) |
| 0.4 | 3.3 | GO:0031369 | translation initiation factor binding(GO:0031369) |
| 0.4 | 2.9 | GO:0035198 | miRNA binding(GO:0035198) |
| 0.4 | 14.3 | GO:0005080 | protein kinase C binding(GO:0005080) |
| 0.4 | 10.1 | GO:0008191 | metalloendopeptidase inhibitor activity(GO:0008191) |
| 0.4 | 12.0 | GO:0051018 | protein kinase A binding(GO:0051018) |
| 0.4 | 3.6 | GO:0019869 | chloride channel inhibitor activity(GO:0019869) |
| 0.4 | 22.3 | GO:0003678 | DNA helicase activity(GO:0003678) |
| 0.4 | 13.4 | GO:0008536 | Ran GTPase binding(GO:0008536) |
| 0.4 | 23.2 | GO:0017048 | Rho GTPase binding(GO:0017048) |
| 0.4 | 10.8 | GO:0070063 | RNA polymerase binding(GO:0070063) |
| 0.4 | 8.1 | GO:0001158 | enhancer sequence-specific DNA binding(GO:0001158) |
| 0.4 | 2.6 | GO:0017077 | oxidative phosphorylation uncoupler activity(GO:0017077) |
| 0.4 | 4.4 | GO:0035251 | UDP-glucosyltransferase activity(GO:0035251) |
| 0.4 | 2.1 | GO:0005499 | vitamin D binding(GO:0005499) |
| 0.3 | 3.4 | GO:0015232 | heme transporter activity(GO:0015232) |
| 0.3 | 4.7 | GO:0017017 | MAP kinase tyrosine/serine/threonine phosphatase activity(GO:0017017) |
| 0.3 | 2.3 | GO:0016421 | CoA carboxylase activity(GO:0016421) |
| 0.3 | 1.6 | GO:0048156 | tau protein binding(GO:0048156) |
| 0.3 | 13.5 | GO:0005547 | phosphatidylinositol-3,4,5-trisphosphate binding(GO:0005547) |
| 0.3 | 3.1 | GO:0002161 | aminoacyl-tRNA editing activity(GO:0002161) |
| 0.3 | 1.5 | GO:0003831 | beta-N-acetylglucosaminylglycopeptide beta-1,4-galactosyltransferase activity(GO:0003831) |
| 0.3 | 2.1 | GO:0047760 | butyrate-CoA ligase activity(GO:0047760) |
| 0.3 | 4.2 | GO:0031957 | very long-chain fatty acid-CoA ligase activity(GO:0031957) |
| 0.3 | 12.8 | GO:0016763 | transferase activity, transferring pentosyl groups(GO:0016763) |
| 0.3 | 5.6 | GO:0050321 | tau-protein kinase activity(GO:0050321) |
| 0.3 | 0.9 | GO:0003705 | transcription factor activity, RNA polymerase II distal enhancer sequence-specific binding(GO:0003705) |
| 0.3 | 11.4 | GO:0042974 | retinoic acid receptor binding(GO:0042974) |
| 0.3 | 1.2 | GO:0033743 | peptide-methionine (R)-S-oxide reductase activity(GO:0033743) |
| 0.3 | 3.2 | GO:0044213 | intronic transcription regulatory region sequence-specific DNA binding(GO:0001161) intronic transcription regulatory region DNA binding(GO:0044213) |
| 0.3 | 2.4 | GO:0019707 | protein-cysteine S-palmitoyltransferase activity(GO:0019706) protein-cysteine S-acyltransferase activity(GO:0019707) |
| 0.3 | 1.3 | GO:0017018 | myosin phosphatase activity(GO:0017018) |
| 0.3 | 8.7 | GO:0003727 | single-stranded RNA binding(GO:0003727) |
| 0.3 | 17.0 | GO:0051087 | chaperone binding(GO:0051087) |
| 0.3 | 41.2 | GO:0003729 | mRNA binding(GO:0003729) poly(A) RNA binding(GO:0044822) |
| 0.3 | 1.8 | GO:0008454 | alpha-1,3-mannosylglycoprotein 4-beta-N-acetylglucosaminyltransferase activity(GO:0008454) |
| 0.3 | 3.6 | GO:0004550 | nucleoside diphosphate kinase activity(GO:0004550) |
| 0.3 | 0.8 | GO:0003845 | 11-beta-hydroxysteroid dehydrogenase [NAD(P)] activity(GO:0003845) |
| 0.3 | 11.9 | GO:0035255 | ionotropic glutamate receptor binding(GO:0035255) |
| 0.2 | 6.2 | GO:0031434 | mitogen-activated protein kinase kinase binding(GO:0031434) |
| 0.2 | 11.8 | GO:0042826 | histone deacetylase binding(GO:0042826) |
| 0.2 | 77.7 | GO:0005525 | GTP binding(GO:0005525) |
| 0.2 | 0.5 | GO:0030158 | protein xylosyltransferase activity(GO:0030158) |
| 0.2 | 4.7 | GO:0090484 | drug transporter activity(GO:0090484) |
| 0.2 | 0.7 | GO:0004603 | phenylethanolamine N-methyltransferase activity(GO:0004603) |
| 0.2 | 39.3 | GO:0008201 | heparin binding(GO:0008201) |
| 0.2 | 0.7 | GO:0033823 | procollagen-lysine 5-dioxygenase activity(GO:0008475) procollagen glucosyltransferase activity(GO:0033823) procollagen galactosyltransferase activity(GO:0050211) |
| 0.2 | 22.3 | GO:0005201 | extracellular matrix structural constituent(GO:0005201) |
| 0.2 | 13.8 | GO:0009055 | electron carrier activity(GO:0009055) |
| 0.2 | 2.4 | GO:0005381 | iron ion transmembrane transporter activity(GO:0005381) |
| 0.2 | 2.8 | GO:0036002 | pre-mRNA binding(GO:0036002) |
| 0.2 | 2.0 | GO:0004709 | MAP kinase kinase kinase activity(GO:0004709) |
| 0.2 | 4.3 | GO:0003841 | 1-acylglycerol-3-phosphate O-acyltransferase activity(GO:0003841) |
| 0.2 | 22.6 | GO:0005178 | integrin binding(GO:0005178) |
| 0.2 | 0.8 | GO:0070137 | ubiquitin-like protein-specific endopeptidase activity(GO:0070137) SUMO-specific endopeptidase activity(GO:0070139) |
| 0.2 | 12.9 | GO:0003697 | single-stranded DNA binding(GO:0003697) |
| 0.2 | 12.6 | GO:0008235 | metalloexopeptidase activity(GO:0008235) |
| 0.2 | 0.9 | GO:0030348 | syntaxin-3 binding(GO:0030348) |
| 0.2 | 4.6 | GO:0031593 | polyubiquitin binding(GO:0031593) |
| 0.2 | 73.8 | GO:0003779 | actin binding(GO:0003779) |
| 0.2 | 2.2 | GO:0030280 | structural constituent of epidermis(GO:0030280) |
| 0.2 | 10.4 | GO:0030165 | PDZ domain binding(GO:0030165) |
| 0.2 | 3.0 | GO:0070840 | dynein complex binding(GO:0070840) |
| 0.2 | 1.4 | GO:0004305 | ethanolamine kinase activity(GO:0004305) |
| 0.1 | 3.3 | GO:0004407 | histone deacetylase activity(GO:0004407) |
| 0.1 | 0.1 | GO:0033549 | MAP kinase phosphatase activity(GO:0033549) |
| 0.1 | 2.2 | GO:0019894 | kinesin binding(GO:0019894) |
| 0.1 | 12.9 | GO:0004222 | metalloendopeptidase activity(GO:0004222) |
| 0.1 | 0.9 | GO:0098821 | BMP receptor activity(GO:0098821) |
| 0.1 | 32.5 | GO:0044389 | ubiquitin-like protein ligase binding(GO:0044389) |
| 0.1 | 3.5 | GO:0001972 | retinoic acid binding(GO:0001972) |
| 0.1 | 0.2 | GO:0051998 | carboxyl-O-methyltransferase activity(GO:0010340) protein carboxyl O-methyltransferase activity(GO:0051998) |
| 0.1 | 0.8 | GO:0004529 | exodeoxyribonuclease activity(GO:0004529) exodeoxyribonuclease activity, producing 5'-phosphomonoesters(GO:0016895) 5'-3' exodeoxyribonuclease activity(GO:0035312) |
| 0.1 | 2.1 | GO:0015248 | sterol transporter activity(GO:0015248) |
| 0.1 | 0.6 | GO:1990254 | keratin filament binding(GO:1990254) |
| 0.1 | 0.9 | GO:0005095 | GTPase inhibitor activity(GO:0005095) |
| 0.1 | 1.8 | GO:0005385 | zinc ion transmembrane transporter activity(GO:0005385) |
| 0.1 | 1.6 | GO:0010857 | calcium-dependent protein serine/threonine kinase activity(GO:0009931) calcium-dependent protein kinase activity(GO:0010857) |
| 0.1 | 4.8 | GO:0019888 | protein phosphatase regulator activity(GO:0019888) |
| 0.1 | 1.1 | GO:0005112 | Notch binding(GO:0005112) |
| 0.1 | 1.2 | GO:0019900 | kinase binding(GO:0019900) |
| 0.1 | 0.2 | GO:0005113 | patched binding(GO:0005113) |
| 0.1 | 0.4 | GO:0017070 | U6 snRNA binding(GO:0017070) |
| 0.1 | 1.9 | GO:0031624 | ubiquitin conjugating enzyme binding(GO:0031624) |
| 0.1 | 5.0 | GO:0005496 | steroid binding(GO:0005496) |
| 0.1 | 0.3 | GO:0034481 | chondroitin sulfotransferase activity(GO:0034481) |
| 0.1 | 0.6 | GO:0008093 | cytoskeletal adaptor activity(GO:0008093) |
| 0.1 | 13.4 | GO:0003714 | transcription corepressor activity(GO:0003714) |
| 0.1 | 1.1 | GO:0030374 | ligand-dependent nuclear receptor transcription coactivator activity(GO:0030374) |
| 0.0 | 5.3 | GO:0005179 | hormone activity(GO:0005179) |
| 0.0 | 1.8 | GO:0030971 | receptor tyrosine kinase binding(GO:0030971) |
| 0.0 | 1.9 | GO:0016209 | antioxidant activity(GO:0016209) |
| 0.0 | 5.1 | GO:0004857 | enzyme inhibitor activity(GO:0004857) |
| 0.0 | 0.2 | GO:0004594 | pantothenate kinase activity(GO:0004594) |
| 0.0 | 0.3 | GO:0034062 | DNA-directed RNA polymerase activity(GO:0003899) RNA polymerase activity(GO:0034062) |
| 0.0 | 0.2 | GO:0001595 | angiotensin receptor activity(GO:0001595) angiotensin type II receptor activity(GO:0004945) |
| 0.0 | 0.7 | GO:0000049 | tRNA binding(GO:0000049) |
| 0.0 | 0.1 | GO:0039706 | co-receptor binding(GO:0039706) |
| 0.0 | 0.7 | GO:0008375 | acetylglucosaminyltransferase activity(GO:0008375) |
| 0.0 | 0.1 | GO:0070410 | co-SMAD binding(GO:0070410) |
Gene overrepresentation in C2:CP category:
| Log-likelihood per target | Total log-likelihood | Term | Description |
|---|---|---|---|
| 3.1 | 81.1 | PID ARF 3PATHWAY | Arf1 pathway |
| 3.0 | 211.2 | PID IGF1 PATHWAY | IGF1 pathway |
| 2.6 | 158.7 | PID AURORA B PATHWAY | Aurora B signaling |
| 2.6 | 146.1 | SIG REGULATION OF THE ACTIN CYTOSKELETON BY RHO GTPASES | Genes related to regulation of the actin cytoskeleton |
| 2.0 | 82.5 | PID NFKAPPAB CANONICAL PATHWAY | Canonical NF-kappaB pathway |
| 1.8 | 30.7 | PID CIRCADIAN PATHWAY | Circadian rhythm pathway |
| 1.8 | 25.2 | SA G2 AND M PHASES | Cdc25 activates the cdc2/cyclin B complex to induce the G2/M transition. |
| 1.7 | 48.4 | PID BETA CATENIN DEG PATHWAY | Degradation of beta catenin |
| 1.6 | 55.3 | PID IL1 PATHWAY | IL1-mediated signaling events |
| 1.4 | 43.2 | PID WNT NONCANONICAL PATHWAY | Noncanonical Wnt signaling pathway |
| 1.4 | 44.1 | PID IL3 PATHWAY | IL3-mediated signaling events |
| 1.4 | 6.8 | PID A6B1 A6B4 INTEGRIN PATHWAY | a6b1 and a6b4 Integrin signaling |
| 1.3 | 65.1 | PID PLK1 PATHWAY | PLK1 signaling events |
| 1.2 | 28.1 | PID INTEGRIN4 PATHWAY | Alpha6 beta4 integrin-ligand interactions |
| 1.2 | 9.4 | SA REG CASCADE OF CYCLIN EXPR | Expression of cyclins regulates progression through the cell cycle by activating cyclin-dependent kinases. |
| 1.1 | 44.8 | PID NCADHERIN PATHWAY | N-cadherin signaling events |
| 1.1 | 23.1 | PID NFKAPPAB ATYPICAL PATHWAY | Atypical NF-kappaB pathway |
| 1.0 | 15.4 | PID EPHA2 FWD PATHWAY | EPHA2 forward signaling |
| 0.9 | 21.6 | PID PDGFRB PATHWAY | PDGFR-beta signaling pathway |
| 0.8 | 18.4 | PID IL2 PI3K PATHWAY | IL2 signaling events mediated by PI3K |
| 0.8 | 20.5 | PID NECTIN PATHWAY | Nectin adhesion pathway |
| 0.8 | 6.4 | PID FAK PATHWAY | Signaling events mediated by focal adhesion kinase |
| 0.8 | 78.1 | PID CMYB PATHWAY | C-MYB transcription factor network |
| 0.7 | 32.4 | NABA COLLAGENS | Genes encoding collagen proteins |
| 0.7 | 78.0 | PID E2F PATHWAY | E2F transcription factor network |
| 0.7 | 7.5 | PID MAPK TRK PATHWAY | Trk receptor signaling mediated by the MAPK pathway |
| 0.6 | 6.4 | PID ATM PATHWAY | ATM pathway |
| 0.6 | 74.4 | PID MYC ACTIV PATHWAY | Validated targets of C-MYC transcriptional activation |
| 0.6 | 13.7 | PID BARD1 PATHWAY | BARD1 signaling events |
| 0.6 | 12.0 | PID SYNDECAN 1 PATHWAY | Syndecan-1-mediated signaling events |
| 0.5 | 19.6 | PID ATR PATHWAY | ATR signaling pathway |
| 0.5 | 12.0 | PID HIF2PATHWAY | HIF-2-alpha transcription factor network |
| 0.5 | 20.7 | PID INTEGRIN A4B1 PATHWAY | Alpha4 beta1 integrin signaling events |
| 0.5 | 19.8 | PID HES HEY PATHWAY | Notch-mediated HES/HEY network |
| 0.5 | 15.0 | PID INSULIN PATHWAY | Insulin Pathway |
| 0.5 | 15.1 | PID ECADHERIN STABILIZATION PATHWAY | Stabilization and expansion of the E-cadherin adherens junction |
| 0.4 | 26.0 | PID CDC42 PATHWAY | CDC42 signaling events |
| 0.4 | 6.2 | PID ALK2 PATHWAY | ALK2 signaling events |
| 0.4 | 10.3 | PID FOXO PATHWAY | FoxO family signaling |
| 0.3 | 12.7 | PID IL8 CXCR2 PATHWAY | IL8- and CXCR2-mediated signaling events |
| 0.3 | 15.0 | PID RB 1PATHWAY | Regulation of retinoblastoma protein |
| 0.3 | 16.5 | PID NFAT 3PATHWAY | Role of Calcineurin-dependent NFAT signaling in lymphocytes |
| 0.3 | 11.2 | PID HIF1 TFPATHWAY | HIF-1-alpha transcription factor network |
| 0.3 | 15.8 | PID PTP1B PATHWAY | Signaling events mediated by PTP1B |
| 0.3 | 2.9 | PID HDAC CLASSIII PATHWAY | Signaling events mediated by HDAC Class III |
| 0.3 | 4.1 | PID FAS PATHWAY | FAS (CD95) signaling pathway |
| 0.3 | 10.2 | PID TRAIL PATHWAY | TRAIL signaling pathway |
| 0.3 | 5.7 | PID NETRIN PATHWAY | Netrin-mediated signaling events |
| 0.3 | 5.9 | PID HIF1A PATHWAY | Hypoxic and oxygen homeostasis regulation of HIF-1-alpha |
| 0.3 | 2.6 | PID TCR CALCIUM PATHWAY | Calcium signaling in the CD4+ TCR pathway |
| 0.2 | 4.0 | ST GA13 PATHWAY | G alpha 13 Pathway |
| 0.2 | 4.5 | ST PHOSPHOINOSITIDE 3 KINASE PATHWAY | PI3K Pathway |
| 0.2 | 5.5 | PID HNF3A PATHWAY | FOXA1 transcription factor network |
| 0.2 | 5.2 | PID THROMBIN PAR1 PATHWAY | PAR1-mediated thrombin signaling events |
| 0.2 | 6.6 | PID INTEGRIN3 PATHWAY | Beta3 integrin cell surface interactions |
| 0.2 | 13.7 | PID MYC REPRESS PATHWAY | Validated targets of C-MYC transcriptional repression |
| 0.2 | 2.5 | PID P38 MK2 PATHWAY | p38 signaling mediated by MAPKAP kinases |
| 0.2 | 4.9 | PID REG GR PATHWAY | Glucocorticoid receptor regulatory network |
| 0.2 | 11.9 | PID ERA GENOMIC PATHWAY | Validated nuclear estrogen receptor alpha network |
| 0.1 | 0.7 | PID MYC PATHWAY | C-MYC pathway |
| 0.1 | 1.9 | PID ALK1 PATHWAY | ALK1 signaling events |
| 0.1 | 7.4 | PID TRKR PATHWAY | Neurotrophic factor-mediated Trk receptor signaling |
| 0.1 | 2.5 | SIG INSULIN RECEPTOR PATHWAY IN CARDIAC MYOCYTES | Genes related to the insulin receptor pathway |
| 0.1 | 2.0 | PID P38 MKK3 6PATHWAY | p38 MAPK signaling pathway |
| 0.1 | 6.5 | ST T CELL SIGNAL TRANSDUCTION | T Cell Signal Transduction |
| 0.1 | 2.4 | PID NFAT TFPATHWAY | Calcineurin-regulated NFAT-dependent transcription in lymphocytes |
| 0.1 | 27.0 | NABA ECM REGULATORS | Genes encoding enzymes and their regulators involved in the remodeling of the extracellular matrix |
| 0.1 | 1.5 | PID RAC1 PATHWAY | RAC1 signaling pathway |
| 0.1 | 4.2 | PID HDAC CLASSI PATHWAY | Signaling events mediated by HDAC Class I |
| 0.1 | 0.7 | PID FOXM1 PATHWAY | FOXM1 transcription factor network |
| 0.1 | 1.8 | PID P75 NTR PATHWAY | p75(NTR)-mediated signaling |
| 0.0 | 1.4 | ST FAS SIGNALING PATHWAY | Fas Signaling Pathway |
| 0.0 | 0.7 | ST WNT BETA CATENIN PATHWAY | Wnt/beta-catenin Pathway |
| 0.0 | 1.4 | PID CASPASE PATHWAY | Caspase cascade in apoptosis |
| 0.0 | 0.4 | PID ERBB1 INTERNALIZATION PATHWAY | Internalization of ErbB1 |
| 0.0 | 0.4 | PID BMP PATHWAY | BMP receptor signaling |
Gene overrepresentation in C2:CP:REACTOME category:
| Log-likelihood per target | Total log-likelihood | Term | Description |
|---|---|---|---|
| 6.5 | 65.2 | REACTOME COPI MEDIATED TRANSPORT | Genes involved in COPI Mediated Transport |
| 6.0 | 12.0 | REACTOME NEP NS2 INTERACTS WITH THE CELLULAR EXPORT MACHINERY | Genes involved in NEP/NS2 Interacts with the Cellular Export Machinery |
| 5.5 | 406.5 | REACTOME CDK MEDIATED PHOSPHORYLATION AND REMOVAL OF CDC6 | Genes involved in CDK-mediated phosphorylation and removal of Cdc6 |
| 5.3 | 123.0 | REACTOME FORMATION OF ATP BY CHEMIOSMOTIC COUPLING | Genes involved in Formation of ATP by chemiosmotic coupling |
| 5.2 | 186.0 | REACTOME CYTOSOLIC TRNA AMINOACYLATION | Genes involved in Cytosolic tRNA aminoacylation |
| 4.9 | 415.1 | REACTOME RESPIRATORY ELECTRON TRANSPORT | Genes involved in Respiratory electron transport |
| 4.1 | 37.2 | REACTOME ACTIVATION OF THE MRNA UPON BINDING OF THE CAP BINDING COMPLEX AND EIFS AND SUBSEQUENT BINDING TO 43S | Genes involved in Activation of the mRNA upon binding of the cap-binding complex and eIFs, and subsequent binding to 43S |
| 3.9 | 153.8 | REACTOME PREFOLDIN MEDIATED TRANSFER OF SUBSTRATE TO CCT TRIC | Genes involved in Prefoldin mediated transfer of substrate to CCT/TriC |
| 3.9 | 85.4 | REACTOME AUTODEGRADATION OF CDH1 BY CDH1 APC C | Genes involved in Autodegradation of Cdh1 by Cdh1:APC/C |
| 3.7 | 29.8 | REACTOME RAF MAP KINASE CASCADE | Genes involved in RAF/MAP kinase cascade |
| 3.7 | 33.5 | REACTOME MRNA DECAY BY 3 TO 5 EXORIBONUCLEASE | Genes involved in mRNA Decay by 3' to 5' Exoribonuclease |
| 3.6 | 57.7 | REACTOME UNWINDING OF DNA | Genes involved in Unwinding of DNA |
| 3.6 | 270.9 | REACTOME FORMATION OF THE TERNARY COMPLEX AND SUBSEQUENTLY THE 43S COMPLEX | Genes involved in Formation of the ternary complex, and subsequently, the 43S complex |
| 3.3 | 29.5 | REACTOME DEPOSITION OF NEW CENPA CONTAINING NUCLEOSOMES AT THE CENTROMERE | Genes involved in Deposition of New CENPA-containing Nucleosomes at the Centromere |
| 3.2 | 38.3 | REACTOME P75NTR RECRUITS SIGNALLING COMPLEXES | Genes involved in p75NTR recruits signalling complexes |
| 3.1 | 12.4 | REACTOME TRANSPORT OF RIBONUCLEOPROTEINS INTO THE HOST NUCLEUS | Genes involved in Transport of Ribonucleoproteins into the Host Nucleus |
| 2.7 | 159.4 | REACTOME MRNA SPLICING MINOR PATHWAY | Genes involved in mRNA Splicing - Minor Pathway |
| 2.7 | 58.9 | REACTOME DESTABILIZATION OF MRNA BY AUF1 HNRNP D0 | Genes involved in Destabilization of mRNA by AUF1 (hnRNP D0) |
| 2.6 | 38.6 | REACTOME CITRIC ACID CYCLE TCA CYCLE | Genes involved in Citric acid cycle (TCA cycle) |
| 2.6 | 54.1 | REACTOME N GLYCAN TRIMMING IN THE ER AND CALNEXIN CALRETICULIN CYCLE | Genes involved in N-glycan trimming in the ER and Calnexin/Calreticulin cycle |
| 2.6 | 35.8 | REACTOME VITAMIN B5 PANTOTHENATE METABOLISM | Genes involved in Vitamin B5 (pantothenate) metabolism |
| 2.5 | 30.2 | REACTOME REMOVAL OF THE FLAP INTERMEDIATE FROM THE C STRAND | Genes involved in Removal of the Flap Intermediate from the C-strand |
| 2.3 | 74.6 | REACTOME OXYGEN DEPENDENT PROLINE HYDROXYLATION OF HYPOXIA INDUCIBLE FACTOR ALPHA | Genes involved in Oxygen-dependent Proline Hydroxylation of Hypoxia-inducible Factor Alpha |
| 2.3 | 367.7 | REACTOME TRANSLATION | Genes involved in Translation |
| 2.2 | 113.1 | REACTOME SIGNALING BY ROBO RECEPTOR | Genes involved in Signaling by Robo receptor |
| 2.1 | 113.1 | REACTOME METABOLISM OF NON CODING RNA | Genes involved in Metabolism of non-coding RNA |
| 2.1 | 59.7 | REACTOME SIGNALING BY HIPPO | Genes involved in Signaling by Hippo |
| 2.0 | 8.1 | REACTOME GRB2 SOS PROVIDES LINKAGE TO MAPK SIGNALING FOR INTERGRINS | Genes involved in GRB2:SOS provides linkage to MAPK signaling for Intergrins |
| 2.0 | 125.9 | REACTOME SMOOTH MUSCLE CONTRACTION | Genes involved in Smooth Muscle Contraction |
| 2.0 | 48.9 | REACTOME ADVANCED GLYCOSYLATION ENDPRODUCT RECEPTOR SIGNALING | Genes involved in Advanced glycosylation endproduct receptor signaling |
| 1.9 | 33.1 | REACTOME REGULATION OF PYRUVATE DEHYDROGENASE PDH COMPLEX | Genes involved in Regulation of pyruvate dehydrogenase (PDH) complex |
| 1.9 | 80.0 | REACTOME BASIGIN INTERACTIONS | Genes involved in Basigin interactions |
| 1.9 | 3.8 | REACTOME SCF BETA TRCP MEDIATED DEGRADATION OF EMI1 | Genes involved in SCF-beta-TrCP mediated degradation of Emi1 |
| 1.8 | 32.4 | REACTOME GAP JUNCTION DEGRADATION | Genes involved in Gap junction degradation |
| 1.8 | 45.0 | REACTOME METABOLISM OF POLYAMINES | Genes involved in Metabolism of polyamines |
| 1.8 | 45.8 | REACTOME KINESINS | Genes involved in Kinesins |
| 1.8 | 59.6 | REACTOME SYNTHESIS AND INTERCONVERSION OF NUCLEOTIDE DI AND TRIPHOSPHATES | Genes involved in Synthesis and interconversion of nucleotide di- and triphosphates |
| 1.7 | 36.6 | REACTOME GLYCOGEN BREAKDOWN GLYCOGENOLYSIS | Genes involved in Glycogen breakdown (glycogenolysis) |
| 1.7 | 32.8 | REACTOME PECAM1 INTERACTIONS | Genes involved in PECAM1 interactions |
| 1.7 | 34.2 | REACTOME P130CAS LINKAGE TO MAPK SIGNALING FOR INTEGRINS | Genes involved in p130Cas linkage to MAPK signaling for integrins |
| 1.7 | 11.6 | REACTOME INHIBITION OF THE PROTEOLYTIC ACTIVITY OF APC C REQUIRED FOR THE ONSET OF ANAPHASE BY MITOTIC SPINDLE CHECKPOINT COMPONENTS | Genes involved in Inhibition of the proteolytic activity of APC/C required for the onset of anaphase by mitotic spindle checkpoint components |
| 1.6 | 13.1 | REACTOME APOBEC3G MEDIATED RESISTANCE TO HIV1 INFECTION | Genes involved in APOBEC3G mediated resistance to HIV-1 infection |
| 1.6 | 24.1 | REACTOME GAMMA CARBOXYLATION TRANSPORT AND AMINO TERMINAL CLEAVAGE OF PROTEINS | Genes involved in Gamma-carboxylation, transport, and amino-terminal cleavage of proteins |
| 1.5 | 43.3 | REACTOME SIGNALING BY NODAL | Genes involved in Signaling by NODAL |
| 1.5 | 17.7 | REACTOME NOTCH HLH TRANSCRIPTION PATHWAY | Genes involved in Notch-HLH transcription pathway |
| 1.4 | 26.1 | REACTOME MRNA CAPPING | Genes involved in mRNA Capping |
| 1.4 | 11.3 | REACTOME REGULATION OF ORNITHINE DECARBOXYLASE ODC | Genes involved in Regulation of ornithine decarboxylase (ODC) |
| 1.3 | 38.4 | REACTOME INSULIN RECEPTOR RECYCLING | Genes involved in Insulin receptor recycling |
| 1.3 | 32.7 | REACTOME PURINE SALVAGE | Genes involved in Purine salvage |
| 1.3 | 22.2 | REACTOME PURINE RIBONUCLEOSIDE MONOPHOSPHATE BIOSYNTHESIS | Genes involved in Purine ribonucleoside monophosphate biosynthesis |
| 1.3 | 13.9 | REACTOME INFLUENZA LIFE CYCLE | Genes involved in Influenza Life Cycle |
| 1.3 | 15.1 | REACTOME CTNNB1 PHOSPHORYLATION CASCADE | Genes involved in Beta-catenin phosphorylation cascade |
| 1.2 | 20.7 | REACTOME SCFSKP2 MEDIATED DEGRADATION OF P27 P21 | Genes involved in SCF(Skp2)-mediated degradation of p27/p21 |
| 1.1 | 13.2 | REACTOME RETROGRADE NEUROTROPHIN SIGNALLING | Genes involved in Retrograde neurotrophin signalling |
| 1.1 | 9.7 | REACTOME APC C CDH1 MEDIATED DEGRADATION OF CDC20 AND OTHER APC C CDH1 TARGETED PROTEINS IN LATE MITOSIS EARLY G1 | Genes involved in APC/C:Cdh1 mediated degradation of Cdc20 and other APC/C:Cdh1 targeted proteins in late mitosis/early G1 |
| 1.1 | 57.3 | REACTOME MITOCHONDRIAL PROTEIN IMPORT | Genes involved in Mitochondrial Protein Import |
| 1.1 | 12.7 | REACTOME ERKS ARE INACTIVATED | Genes involved in ERKs are inactivated |
| 1.0 | 21.9 | REACTOME IRON UPTAKE AND TRANSPORT | Genes involved in Iron uptake and transport |
| 0.9 | 24.1 | REACTOME BIOSYNTHESIS OF THE N GLYCAN PRECURSOR DOLICHOL LIPID LINKED OLIGOSACCHARIDE LLO AND TRANSFER TO A NASCENT PROTEIN | Genes involved in Biosynthesis of the N-glycan precursor (dolichol lipid-linked oligosaccharide, LLO) and transfer to a nascent protein |
| 0.9 | 8.8 | REACTOME APOPTOTIC CLEAVAGE OF CELL ADHESION PROTEINS | Genes involved in Apoptotic cleavage of cell adhesion proteins |
| 0.8 | 19.8 | REACTOME RNA POL II TRANSCRIPTION PRE INITIATION AND PROMOTER OPENING | Genes involved in RNA Polymerase II Transcription Pre-Initiation And Promoter Opening |
| 0.8 | 12.9 | REACTOME G0 AND EARLY G1 | Genes involved in G0 and Early G1 |
| 0.8 | 34.5 | REACTOME ANTIVIRAL MECHANISM BY IFN STIMULATED GENES | Genes involved in Antiviral mechanism by IFN-stimulated genes |
| 0.8 | 4.7 | REACTOME MEMBRANE BINDING AND TARGETTING OF GAG PROTEINS | Genes involved in Membrane binding and targetting of GAG proteins |
| 0.8 | 38.4 | REACTOME ASPARAGINE N LINKED GLYCOSYLATION | Genes involved in Asparagine N-linked glycosylation |
| 0.8 | 70.3 | REACTOME MHC CLASS II ANTIGEN PRESENTATION | Genes involved in MHC class II antigen presentation |
| 0.8 | 26.3 | REACTOME SIGNAL TRANSDUCTION BY L1 | Genes involved in Signal transduction by L1 |
| 0.7 | 13.5 | REACTOME MITOCHONDRIAL FATTY ACID BETA OXIDATION | Genes involved in Mitochondrial Fatty Acid Beta-Oxidation |
| 0.7 | 74.4 | REACTOME PROCESSING OF CAPPED INTRON CONTAINING PRE MRNA | Genes involved in Processing of Capped Intron-Containing Pre-mRNA |
| 0.7 | 16.8 | REACTOME NEPHRIN INTERACTIONS | Genes involved in Nephrin interactions |
| 0.7 | 6.4 | REACTOME RECYCLING PATHWAY OF L1 | Genes involved in Recycling pathway of L1 |
| 0.7 | 14.9 | REACTOME CELL EXTRACELLULAR MATRIX INTERACTIONS | Genes involved in Cell-extracellular matrix interactions |
| 0.6 | 12.7 | REACTOME ASSOCIATION OF TRIC CCT WITH TARGET PROTEINS DURING BIOSYNTHESIS | Genes involved in Association of TriC/CCT with target proteins during biosynthesis |
| 0.6 | 5.1 | REACTOME PRE NOTCH TRANSCRIPTION AND TRANSLATION | Genes involved in Pre-NOTCH Transcription and Translation |
| 0.6 | 37.1 | REACTOME APOPTOTIC CLEAVAGE OF CELLULAR PROTEINS | Genes involved in Apoptotic cleavage of cellular proteins |
| 0.6 | 15.4 | REACTOME HORMONE SENSITIVE LIPASE HSL MEDIATED TRIACYLGLYCEROL HYDROLYSIS | Genes involved in Hormone-sensitive lipase (HSL)-mediated triacylglycerol hydrolysis |
| 0.6 | 14.5 | REACTOME PKA MEDIATED PHOSPHORYLATION OF CREB | Genes involved in PKA-mediated phosphorylation of CREB |
| 0.5 | 1.6 | REACTOME NFKB IS ACTIVATED AND SIGNALS SURVIVAL | Genes involved in NF-kB is activated and signals survival |
| 0.5 | 12.8 | REACTOME METABOLISM OF PORPHYRINS | Genes involved in Metabolism of porphyrins |
| 0.5 | 26.4 | REACTOME NRAGE SIGNALS DEATH THROUGH JNK | Genes involved in NRAGE signals death through JNK |
| 0.5 | 33.1 | REACTOME COLLAGEN FORMATION | Genes involved in Collagen formation |
| 0.5 | 24.6 | REACTOME GLUCONEOGENESIS | Genes involved in Gluconeogenesis |
| 0.5 | 10.0 | REACTOME DOWNREGULATION OF SMAD2 3 SMAD4 TRANSCRIPTIONAL ACTIVITY | Genes involved in Downregulation of SMAD2/3:SMAD4 transcriptional activity |
| 0.5 | 15.3 | REACTOME CHOLESTEROL BIOSYNTHESIS | Genes involved in Cholesterol biosynthesis |
| 0.5 | 13.2 | REACTOME FATTY ACYL COA BIOSYNTHESIS | Genes involved in Fatty Acyl-CoA Biosynthesis |
| 0.5 | 3.3 | REACTOME SYNTHESIS OF BILE ACIDS AND BILE SALTS VIA 7ALPHA HYDROXYCHOLESTEROL | Genes involved in Synthesis of bile acids and bile salts via 7alpha-hydroxycholesterol |
| 0.5 | 3.2 | REACTOME RNA POL I PROMOTER OPENING | Genes involved in RNA Polymerase I Promoter Opening |
| 0.5 | 16.2 | REACTOME P75 NTR RECEPTOR MEDIATED SIGNALLING | Genes involved in p75 NTR receptor-mediated signalling |
| 0.4 | 11.6 | REACTOME EXTENSION OF TELOMERES | Genes involved in Extension of Telomeres |
| 0.4 | 6.1 | REACTOME GLYCOPROTEIN HORMONES | Genes involved in Glycoprotein hormones |
| 0.4 | 14.3 | REACTOME PEROXISOMAL LIPID METABOLISM | Genes involved in Peroxisomal lipid metabolism |
| 0.4 | 2.9 | REACTOME MTORC1 MEDIATED SIGNALLING | Genes involved in mTORC1-mediated signalling |
| 0.4 | 2.6 | REACTOME RESPIRATORY ELECTRON TRANSPORT ATP SYNTHESIS BY CHEMIOSMOTIC COUPLING AND HEAT PRODUCTION BY UNCOUPLING PROTEINS | Genes involved in Respiratory electron transport, ATP synthesis by chemiosmotic coupling, and heat production by uncoupling proteins. |
| 0.4 | 11.3 | REACTOME HOST INTERACTIONS OF HIV FACTORS | Genes involved in Host Interactions of HIV factors |
| 0.3 | 7.8 | REACTOME PTM GAMMA CARBOXYLATION HYPUSINE FORMATION AND ARYLSULFATASE ACTIVATION | Genes involved in PTM: gamma carboxylation, hypusine formation and arylsulfatase activation |
| 0.3 | 7.6 | REACTOME P38MAPK EVENTS | Genes involved in p38MAPK events |
| 0.3 | 6.2 | REACTOME SIGNALING BY BMP | Genes involved in Signaling by BMP |
| 0.3 | 44.5 | REACTOME ANTIGEN PROCESSING UBIQUITINATION PROTEASOME DEGRADATION | Genes involved in Antigen processing: Ubiquitination & Proteasome degradation |
| 0.3 | 7.9 | REACTOME SIGNALING BY FGFR1 FUSION MUTANTS | Genes involved in Signaling by FGFR1 fusion mutants |
| 0.3 | 3.5 | REACTOME APOPTOSIS INDUCED DNA FRAGMENTATION | Genes involved in Apoptosis induced DNA fragmentation |
| 0.3 | 6.5 | REACTOME REGULATION OF IFNA SIGNALING | Genes involved in Regulation of IFNA signaling |
| 0.3 | 10.8 | REACTOME ACTIVATION OF CHAPERONE GENES BY XBP1S | Genes involved in Activation of Chaperone Genes by XBP1(S) |
| 0.3 | 5.7 | REACTOME TRIGLYCERIDE BIOSYNTHESIS | Genes involved in Triglyceride Biosynthesis |
| 0.3 | 6.7 | REACTOME SULFUR AMINO ACID METABOLISM | Genes involved in Sulfur amino acid metabolism |
| 0.2 | 19.5 | REACTOME CELL JUNCTION ORGANIZATION | Genes involved in Cell junction organization |
| 0.2 | 3.6 | REACTOME SEMA3A PAK DEPENDENT AXON REPULSION | Genes involved in Sema3A PAK dependent Axon repulsion |
| 0.2 | 8.7 | REACTOME DEGRADATION OF THE EXTRACELLULAR MATRIX | Genes involved in Degradation of the extracellular matrix |
| 0.2 | 4.3 | REACTOME NEGATIVE REGULATORS OF RIG I MDA5 SIGNALING | Genes involved in Negative regulators of RIG-I/MDA5 signaling |
| 0.2 | 4.2 | REACTOME HOMOLOGOUS RECOMBINATION REPAIR OF REPLICATION INDEPENDENT DOUBLE STRAND BREAKS | Genes involved in Homologous recombination repair of replication-independent double-strand breaks |
| 0.2 | 22.4 | REACTOME PHASE II CONJUGATION | Genes involved in Phase II conjugation |
| 0.2 | 2.9 | REACTOME TIE2 SIGNALING | Genes involved in Tie2 Signaling |
| 0.2 | 6.2 | REACTOME PYRIMIDINE METABOLISM | Genes involved in Pyrimidine metabolism |
| 0.2 | 3.9 | REACTOME IL RECEPTOR SHC SIGNALING | Genes involved in Interleukin receptor SHC signaling |
| 0.1 | 3.1 | REACTOME REGULATION OF INSULIN LIKE GROWTH FACTOR IGF ACTIVITY BY INSULIN LIKE GROWTH FACTOR BINDING PROTEINS IGFBPS | Genes involved in Regulation of Insulin-like Growth Factor (IGF) Activity by Insulin-like Growth Factor Binding Proteins (IGFBPs) |
| 0.1 | 2.4 | REACTOME ACTIVATED NOTCH1 TRANSMITS SIGNAL TO THE NUCLEUS | Genes involved in Activated NOTCH1 Transmits Signal to the Nucleus |
| 0.1 | 3.4 | REACTOME ADP SIGNALLING THROUGH P2RY1 | Genes involved in ADP signalling through P2Y purinoceptor 1 |
| 0.1 | 2.2 | REACTOME ABCA TRANSPORTERS IN LIPID HOMEOSTASIS | Genes involved in ABCA transporters in lipid homeostasis |
| 0.1 | 3.6 | REACTOME REGULATION OF GENE EXPRESSION IN BETA CELLS | Genes involved in Regulation of gene expression in beta cells |
| 0.1 | 1.2 | REACTOME PROTEIN FOLDING | Genes involved in Protein folding |
| 0.1 | 1.8 | REACTOME ZINC TRANSPORTERS | Genes involved in Zinc transporters |
| 0.1 | 3.0 | REACTOME NETRIN1 SIGNALING | Genes involved in Netrin-1 signaling |
| 0.1 | 1.4 | REACTOME SYNTHESIS OF PE | Genes involved in Synthesis of PE |
| 0.1 | 1.6 | REACTOME NA CL DEPENDENT NEUROTRANSMITTER TRANSPORTERS | Genes involved in Na+/Cl- dependent neurotransmitter transporters |
| 0.1 | 2.2 | REACTOME GLYCOSPHINGOLIPID METABOLISM | Genes involved in Glycosphingolipid metabolism |
| 0.1 | 2.0 | REACTOME POST TRANSLATIONAL MODIFICATION SYNTHESIS OF GPI ANCHORED PROTEINS | Genes involved in Post-translational modification: synthesis of GPI-anchored proteins |
| 0.1 | 2.5 | REACTOME GOLGI ASSOCIATED VESICLE BIOGENESIS | Genes involved in Golgi Associated Vesicle Biogenesis |
| 0.0 | 1.1 | REACTOME INFLAMMASOMES | Genes involved in Inflammasomes |
| 0.0 | 1.4 | REACTOME G1 PHASE | Genes involved in G1 Phase |
| 0.0 | 0.6 | REACTOME SIGNAL REGULATORY PROTEIN SIRP FAMILY INTERACTIONS | Genes involved in Signal regulatory protein (SIRP) family interactions |
| 0.0 | 0.7 | REACTOME AMINE DERIVED HORMONES | Genes involved in Amine-derived hormones |
| 0.0 | 0.3 | REACTOME PROLACTIN RECEPTOR SIGNALING | Genes involved in Prolactin receptor signaling |
| 0.0 | 0.8 | REACTOME STEROID HORMONES | Genes involved in Steroid hormones |