|
chrX_+_138060
|
4.086
|
NM_018390
|
PLCXD1
|
phosphatidylinositol-specific phospholipase C, X domain containing 1
|
|
chrY_+_138060
|
4.086
|
NM_018390
|
PLCXD1
|
phosphatidylinositol-specific phospholipase C, X domain containing 1
|
|
chr19_-_45888259
|
3.099
|
NM_004756
|
NUMBL
|
numb homolog (Drosophila)-like
|
|
chr9_-_131845277
|
2.477
|
NM_015033
|
FNBP1
|
formin binding protein 1
|
|
chr9_-_131845077
|
2.338
|
|
FNBP1
|
formin binding protein 1
|
|
chr6_-_29703725
|
2.058
|
|
GABBR1
|
gamma-aminobutyric acid (GABA) B receptor, 1
|
|
chr6_-_90178375
|
2.032
|
|
RRAGD
|
Ras-related GTP binding D
|
|
chr7_-_158073121
|
1.937
|
NM_002847
NM_130842
NM_130843
|
PTPRN2
|
protein tyrosine phosphatase, receptor type, N polypeptide 2
|
|
chr14_-_88953059
|
1.904
|
NM_005197
|
FOXN3
|
forkhead box N3
|
|
chr14_-_94855848
|
1.861
|
NM_024734
|
CLMN
|
calmin (calponin-like, transmembrane)
|
|
chr6_+_37245860
|
1.797
|
NM_002648
|
PIM1
|
pim-1 oncogene
|
|
chr6_-_90178544
|
1.666
|
|
RRAGD
|
Ras-related GTP binding D
|
|
chr3_-_12983959
|
1.639
|
NM_014869
|
IQSEC1
|
IQ motif and Sec7 domain 1
|
|
chr10_+_76256305
|
1.582
|
NM_012330
|
MYST4
|
MYST histone acetyltransferase (monocytic leukemia) 4
|
|
chr2_-_61551403
|
1.531
|
|
USP34
|
ubiquitin specific peptidase 34
|
|
chr3_-_130323033
|
1.524
|
|
RAB43
|
RAB43, member RAS oncogene family
|
|
chr16_-_11588525
|
1.522
|
|
LITAF
|
lipopolysaccharide-induced TNF factor
|
|
chr16_-_51138306
|
1.519
|
NM_001080430
|
TOX3
|
TOX high mobility group box family member 3
|
|
chr16_-_11588257
|
1.514
|
NM_001136472
NM_001136473
|
LITAF
|
lipopolysaccharide-induced TNF factor
|
|
chr9_-_91302707
|
1.506
|
|
SEMA4D
|
sema domain, immunoglobulin domain (Ig), transmembrane domain (TM) and short cytoplasmic domain, (semaphorin) 4D
|
|
chr17_-_76622967
|
1.473
|
|
FLJ90757
|
hypothetical LOC440465
|
|
chr2_-_98713862
|
1.472
|
|
MGAT4A
|
mannosyl (alpha-1,3-)-glycoprotein beta-1,4-N-acetylglucosaminyltransferase, isozyme A
|
|
chr1_+_26895108
|
1.462
|
NM_006015
NM_139135
|
ARID1A
|
AT rich interactive domain 1A (SWI-like)
|
|
chr19_-_2653662
|
1.456
|
|
GNG7
|
guanine nucleotide binding protein (G protein), gamma 7
|
|
chr18_+_54489798
|
1.411
|
|
MALT1
|
mucosa associated lymphoid tissue lymphoma translocation gene 1
|
|
chr4_+_154606900
|
1.335
|
NM_001131007
NM_015196
|
KIAA0922
|
KIAA0922
|
|
chr18_+_54489763
|
1.324
|
|
MALT1
|
mucosa associated lymphoid tissue lymphoma translocation gene 1
|
|
chr17_-_39556535
|
1.319
|
NM_001015053
NM_005474
|
HDAC5
|
histone deacetylase 5
|
|
chr2_-_60634271
|
1.311
|
|
BCL11A
|
B-cell CLL/lymphoma 11A (zinc finger protein)
|
|
chr1_-_32574185
|
1.293
|
NM_023009
|
MARCKSL1
|
MARCKS-like 1
|
|
chr9_-_36391149
|
1.290
|
NM_194330
|
RNF38
|
ring finger protein 38
|
|
chr18_-_50004458
|
1.278
|
|
MBD2
|
methyl-CpG binding domain protein 2
|
|
chr3_+_123036719
|
1.270
|
NM_018456
|
EAF2
|
ELL associated factor 2
|
|
chr17_-_39556483
|
1.263
|
|
HDAC5
|
histone deacetylase 5
|
|
chr6_-_16869579
|
1.259
|
NM_000332
NM_001128164
|
ATXN1
|
ataxin 1
|
|
chr2_-_60633908
|
1.251
|
NM_018014
NM_022893
NM_138559
|
BCL11A
|
B-cell CLL/lymphoma 11A (zinc finger protein)
|
|
chr1_+_60053050
|
1.249
|
NM_015888
|
HOOK1
|
hook homolog 1 (Drosophila)
|
|
chr5_-_175896829
|
1.243
|
NM_014901
|
RNF44
|
ring finger protein 44
|
|
chr19_-_1966628
|
1.236
|
NM_017797
|
BTBD2
|
BTB (POZ) domain containing 2
|
|
chr7_-_51351952
|
1.231
|
NM_015198
|
COBL
|
cordon-bleu homolog (mouse)
|
|
chr18_+_54489597
|
1.227
|
NM_006785
NM_173844
|
MALT1
|
mucosa associated lymphoid tissue lymphoma translocation gene 1
|
|
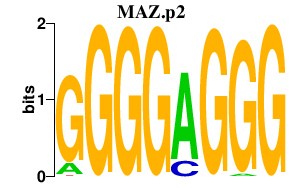
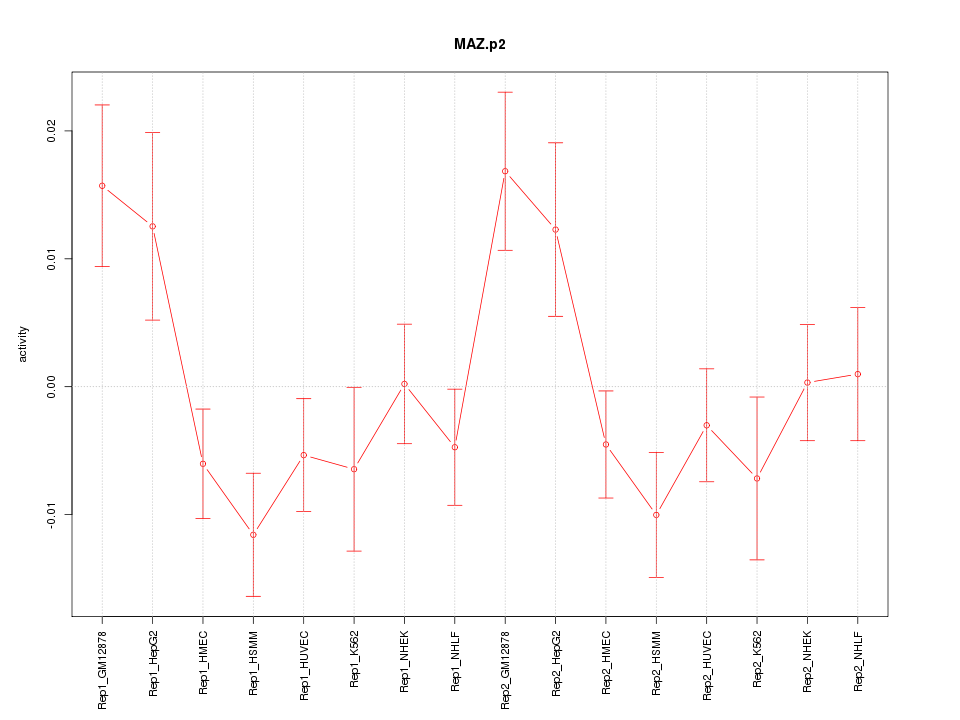
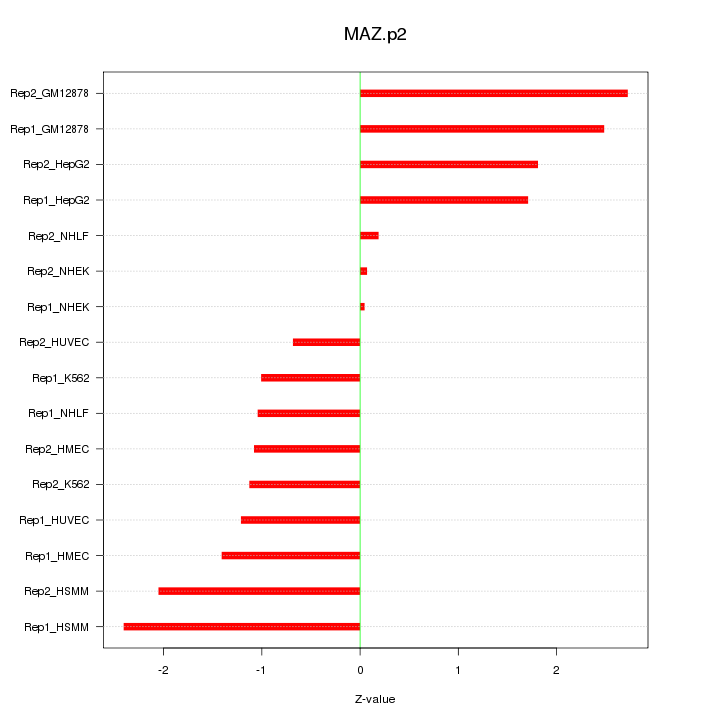
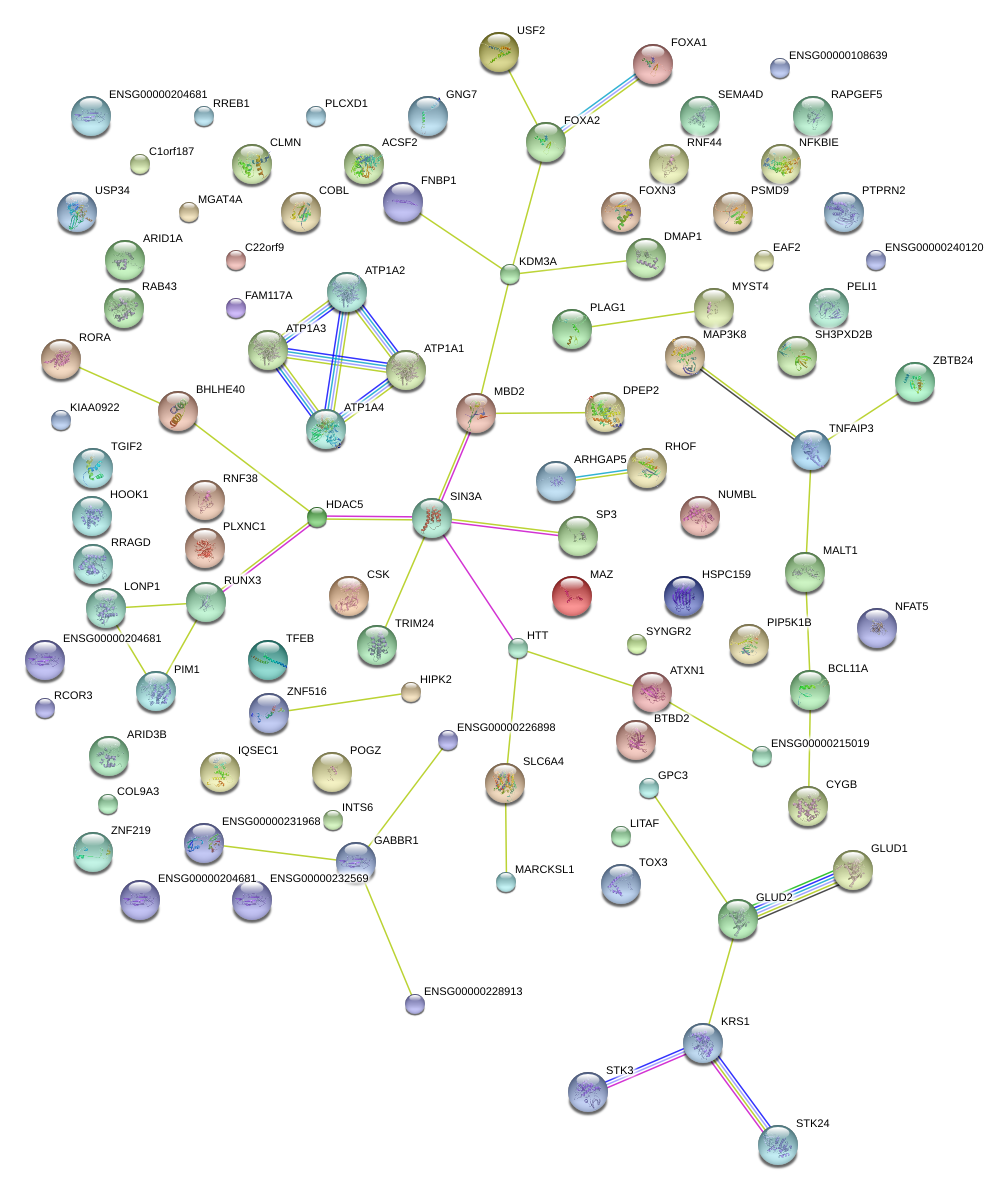
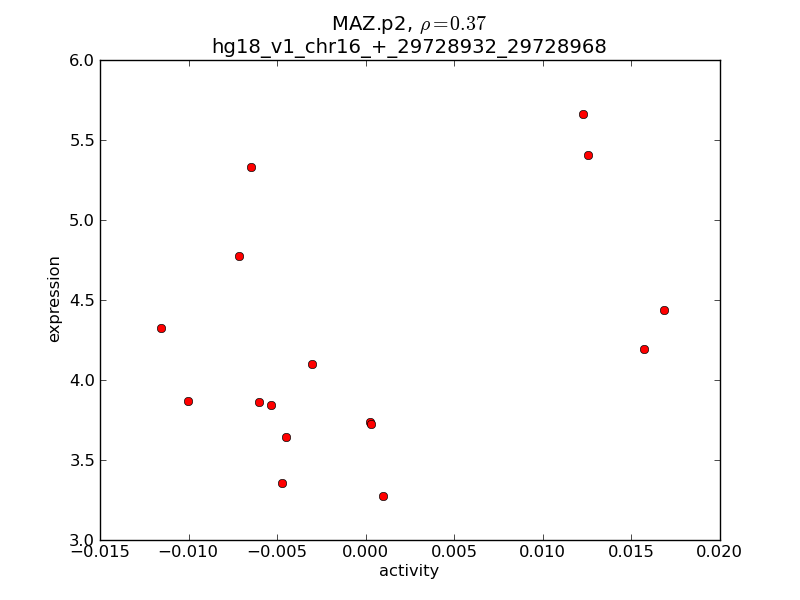
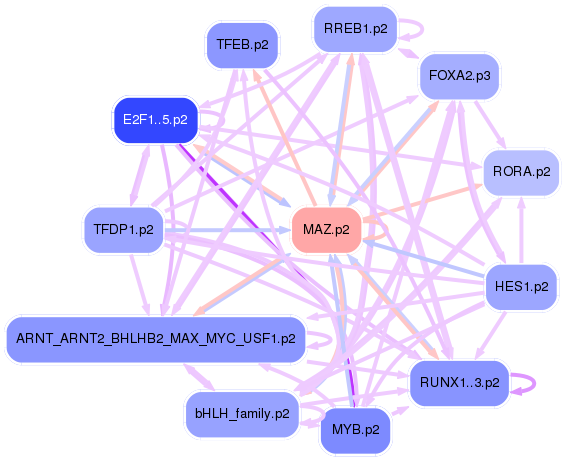
chr16_+_29724926
|
1.219
|
|
MAZ
|
MYC-associated zinc finger protein (purine-binding transcription factor)
|
|
chr6_-_41810712
|
1.205
|
NM_007162
|
TFEB
|
transcription factor EB
|
|
chr1_-_149698516
|
1.184
|
NM_001194937
NM_001194938
NM_015100
NM_145796
|
POGZ
|
pogo transposable element with ZNF domain
|
|
chr17_+_45858517
|
1.178
|
NM_025149
|
ACSF2
|
acyl-CoA synthetase family member 2
|
|
chr4_+_3046034
|
1.177
|
NM_002111
|
HTT
|
huntingtin
|
|
chr18_+_54489658
|
1.176
|
|
MALT1
|
mucosa associated lymphoid tissue lymphoma translocation gene 1
|
|
chr2_-_174537021
|
1.170
|
NM_001017371
|
SP3
|
Sp3 transcription factor
|
|
chr9_+_70509925
|
1.167
|
NM_003558
|
PIP5K1B
|
phosphatidylinositol-4-phosphate 5-kinase, type I, beta
|
|
chr17_+_73676219
|
1.165
|
NM_004710
|
SYNGR2
|
synaptogyrin 2
|
|
chr6_-_90178630
|
1.164
|
|
RRAGD
|
Ras-related GTP binding D
|
|
chr13_-_50925134
|
1.150
|
|
INTS6
|
integrator complex subunit 6
|
|
chr7_-_22363036
|
1.141
|
NM_012294
|
RAPGEF5
|
Rap guanine nucleotide exchange factor (GEF) 5
|
|
chr2_+_64534774
|
1.141
|
NM_014181
|
HSPC159
|
galectin-related protein
|
|
chr2_-_174537354
|
1.129
|
|
SP3
|
Sp3 transcription factor
|
|
chr15_+_72620570
|
1.127
|
NM_006465
|
ARID3B
|
AT rich interactive domain 3B (BRIGHT-like)
|
|
chr16_+_68157611
|
1.125
|
|
NFAT5
|
nuclear factor of activated T-cells 5, tonicity-responsive
|
|
chr20_-_22512893
|
1.122
|
|
FOXA2
|
forkhead box A2
|
|
chr22_-_44015248
|
1.121
|
NM_001009880
|
KIAA0930
|
KIAA0930
|
|
chr20_+_60918836
|
1.107
|
NM_001853
|
COL9A3
|
collagen, type IX, alpha 3
|
|
chr6_+_138230045
|
1.101
|
NM_006290
|
TNFAIP3
|
tumor necrosis factor, alpha-induced protein 3
|
|
chr9_-_36390817
|
1.098
|
NM_194328
NM_194332
|
RNF38
|
ring finger protein 38
|
|
chr6_-_109911125
|
1.082
|
NM_001164313
NM_014797
|
ZBTB24
|
zinc finger and BTB domain containing 24
|
|
chr19_-_2653738
|
1.080
|
NM_052847
|
GNG7
|
guanine nucleotide binding protein (G protein), gamma 7
|
|
chr15_+_72861767
|
1.080
|
|
CSK
|
c-src tyrosine kinase
|
|
chr20_+_34635362
|
1.079
|
NM_021809
|
TGIF2
|
TGFB-induced factor homeobox 2
|
|
chr7_-_139123906
|
1.073
|
NM_001113239
NM_022740
|
HIPK2
|
homeodomain interacting protein kinase 2
|
|
chr1_-_25128951
|
1.072
|
|
RUNX3
|
runt-related transcription factor 3
|
|
chr2_-_61551350
|
1.061
|
NM_014709
|
USP34
|
ubiquitin specific peptidase 34
|
|
chr1_+_209499478
|
1.060
|
|
RCOR3
|
REST corepressor 3
|
|
chr2_-_64224948
|
1.054
|
NM_020651
|
PELI1
|
pellino homolog 1 (Drosophila)
|
|
chr5_-_171814026
|
1.041
|
NM_001017995
|
SH3PXD2B
|
SH3 and PX domains 2B
|
|
chr17_+_45858606
|
1.035
|
|
ACSF2
|
acyl-CoA synthetase family member 2
|
|
chr2_+_64535114
|
1.033
|
|
HSPC159
|
galectin-related protein
|
|
chr8_-_99906944
|
1.025
|
NM_006281
|
STK3
|
serine/threonine kinase 3
|
|
chr14_+_31616196
|
1.025
|
NM_001030055
NM_001173
|
ARHGAP5
|
Rho GTPase activating protein 5
|
|
chr7_+_137795719
|
1.022
|
|
TRIM24
|
tripartite motif containing 24
|
|
chr12_+_93066370
|
1.016
|
NM_005761
|
PLXNC1
|
plexin C1
|
|
chr22_-_44015424
|
1.013
|
|
KIAA0930
|
KIAA0930
|
|
chr17_-_45196516
|
1.011
|
NM_030802
|
FAM117A
|
family with sequence similarity 117, member A
|
|
chr16_+_68157370
|
0.988
|
|
NFAT5
|
nuclear factor of activated T-cells 5, tonicity-responsive
|
|
chr6_-_90178685
|
0.983
|
NM_021244
|
RRAGD
|
Ras-related GTP binding D
|
|
chr14_-_37134191
|
0.980
|
NM_004496
|
FOXA1
|
forkhead box A1
|
|
chr1_+_116717552
|
0.973
|
|
ATP1A1
|
ATPase, Na+/K+ transporting, alpha 1 polypeptide
|
|
chr6_-_44341222
|
0.972
|
|
NFKBIE
|
nuclear factor of kappa light polypeptide gene enhancer in B-cells inhibitor, epsilon
|
|
chr17_-_45196465
|
0.966
|
|
FAM117A
|
family with sequence similarity 117, member A
|
|
chr10_-_88844666
|
0.966
|
NM_005271
|
GLUD1
|
glutamate dehydrogenase 1
|
|
chr16_+_29725311
|
0.962
|
NM_001042539
NM_002383
|
MAZ
|
MYC-associated zinc finger protein (purine-binding transcription factor)
|
|
chrX_-_132947290
|
0.960
|
NM_001164617
NM_001164618
NM_001164619
NM_004484
|
GPC3
|
glypican 3
|
|
chr2_+_86521939
|
0.958
|
|
KDM3A
|
lysine (K)-specific demethylase 3A
|
|
chr2_+_86521781
|
0.944
|
NM_018433
|
KDM3A
|
lysine (K)-specific demethylase 3A
|
|
chr12_-_120715937
|
0.936
|
NM_019034
|
RHOF
|
ras homolog gene family, member F (in filopodia)
|
|
chr19_+_40451842
|
0.932
|
|
USF2
|
upstream transcription factor 2, c-fos interacting
|
|
chr10_-_88844470
|
0.930
|
|
GLUD1
|
glutamate dehydrogenase 1
|
|
chr8_-_57286412
|
0.929
|
NM_001114634
NM_001114635
NM_002655
|
PLAG1
|
pleiomorphic adenoma gene 1
|
|
chr6_+_7052985
|
0.923
|
NM_001003698
NM_001003699
NM_001003700
|
RREB1
|
ras responsive element binding protein 1
|
|
chr14_-_20636337
|
0.916
|
|
ZNF219
|
zinc finger protein 219
|
|
chr15_-_58671929
|
0.913
|
NM_134262
|
RORA
|
RAR-related orphan receptor A
|
|
chr1_+_11674365
|
0.904
|
NM_198545
|
C1orf187
|
chromosome 1 open reading frame 187
|
|
chr19_+_40451807
|
0.901
|
|
USF2
|
upstream transcription factor 2, c-fos interacting
|
|
chr2_+_86521999
|
0.895
|
NM_001146688
|
KDM3A
|
lysine (K)-specific demethylase 3A
|
|
chr17_-_72045218
|
0.894
|
NM_134268
|
CYGB
|
cytoglobin
|
|
chr15_-_73530829
|
0.894
|
NM_015477
|
SIN3A
|
SIN3 homolog A, transcription regulator (yeast)
|
|
chr10_-_88844575
|
0.893
|
|
GLUD1
|
glutamate dehydrogenase 1
|
|
chr18_-_72336133
|
0.889
|
NM_014643
|
ZNF516
|
zinc finger protein 516
|
|
chr3_+_4996096
|
0.888
|
NM_003670
|
BHLHE40
|
basic helix-loop-helix family, member e40
|
|
chr16_+_87741416
|
0.885
|
|
|
|
|
chr19_-_60557875
|
0.884
|
NM_144613
|
COX6B2
|
cytochrome c oxidase subunit VIb polypeptide 2 (testis)
|
|
chr1_+_116718011
|
0.867
|
NM_001160233
|
ATP1A1
|
ATPase, Na+/K+ transporting, alpha 1 polypeptide
|
|
chr15_-_59308708
|
0.867
|
|
RORA
|
RAR-related orphan receptor A
|
|
chr1_-_149698272
|
0.852
|
|
POGZ
|
pogo transposable element with ZNF domain
|
|
chr2_+_54536780
|
0.848
|
NM_003128
|
SPTBN1
|
spectrin, beta, non-erythrocytic 1
|
|
chr14_+_105024576
|
0.841
|
|
CRIP1
|
cysteine-rich protein 1 (intestinal)
|
|
chr9_+_136358145
|
0.841
|
|
RXRA
|
retinoid X receptor, alpha
|
|
chr15_+_78232160
|
0.838
|
|
FAH
|
fumarylacetoacetate hydrolase (fumarylacetoacetase)
|
|
chr19_+_8180179
|
0.835
|
NM_024552
|
LASS4
|
LAG1 homolog, ceramide synthase 4
|
|
chr3_+_180853473
|
0.830
|
NM_003940
|
USP13
|
ubiquitin specific peptidase 13 (isopeptidase T-3)
|
|
chr7_+_21434097
|
0.830
|
NM_003112
|
SP4
|
Sp4 transcription factor
|
|
chr20_+_56900116
|
0.826
|
NM_001077488
|
GNAS
|
GNAS complex locus
|
|
chr12_+_52132353
|
0.817
|
|
PCBP2
|
poly(rC) binding protein 2
|
|
chr19_-_1993022
|
0.817
|
|
MKNK2
|
MAP kinase interacting serine/threonine kinase 2
|
|
chr6_+_37895570
|
0.816
|
|
ZFAND3
|
zinc finger, AN1-type domain 3
|
|
chr16_+_19087035
|
0.816
|
NM_016524
|
SYT17
|
synaptotagmin XVII
|
|
chr9_-_20612476
|
0.807
|
NM_004529
|
MLLT3
|
myeloid/lymphoid or mixed-lineage leukemia (trithorax homolog, Drosophila); translocated to, 3
|
|
chrX_-_70248022
|
0.807
|
NM_000206
|
IL2RG
|
interleukin 2 receptor, gamma
|
|
chr15_+_88345612
|
0.802
|
NM_198526
|
ZNF710
|
zinc finger protein 710
|
|
chr1_+_199259664
|
0.798
|
|
|
|
|
chr17_-_44794325
|
0.798
|
NM_001145365
NM_014897
|
ZNF652
|
zinc finger protein 652
|
|
chr1_+_945331
|
0.797
|
NM_198576
|
AGRN
|
agrin
|
|
chr20_-_62181588
|
0.793
|
NM_001039467
|
RGS19
|
regulator of G-protein signaling 19
|
|
chr20_-_10602429
|
0.791
|
NM_000214
|
JAG1
|
jagged 1
|
|
chr8_-_28299850
|
0.790
|
NM_018660
|
ZNF395
|
zinc finger protein 395
|
|
chr1_-_23367871
|
0.788
|
|
LUZP1
|
leucine zipper protein 1
|
|
chr14_+_105024301
|
0.785
|
NM_001311
|
CRIP1
|
cysteine-rich protein 1 (intestinal)
|
|
chr17_+_50697355
|
0.775
|
|
HLF
|
hepatic leukemia factor
|
|
chr20_+_35407872
|
0.773
|
NM_198291
|
SRC
|
v-src sarcoma (Schmidt-Ruppin A-2) viral oncogene homolog (avian)
|
|
chr12_+_732349
|
0.772
|
NM_001184985
NM_014823
NM_018979
NM_213655
|
WNK1
|
WNK lysine deficient protein kinase 1
|
|
chr18_+_27332024
|
0.771
|
NM_001943
|
DSG2
|
desmoglein 2
|
|
chr19_-_44034797
|
0.770
|
NM_001005335
|
HNRNPL
|
heterogeneous nuclear ribonucleoprotein L
|
|
chr1_+_181871830
|
0.770
|
NM_015149
|
RGL1
|
ral guanine nucleotide dissociation stimulator-like 1
|
|
chr19_+_40451720
|
0.769
|
NM_003367
NM_207291
|
USF2
|
upstream transcription factor 2, c-fos interacting
|
|
chr1_+_209499316
|
0.767
|
NM_001136223
NM_001136224
NM_001136225
|
RCOR3
|
REST corepressor 3
|
|
chr8_+_26427378
|
0.765
|
NM_001197293
|
DPYSL2
|
dihydropyrimidinase-like 2
|
|
chr1_+_1971762
|
0.762
|
NM_002744
|
PRKCZ
|
protein kinase C, zeta
|
|
chr21_+_42946719
|
0.761
|
NM_001001567
NM_001001568
NM_001001569
NM_001001570
NM_001001571
NM_001001572
NM_001001573
NM_001001574
NM_001001575
NM_001001576
NM_001001577
NM_001001578
NM_001001579
NM_001001580
NM_001001581
NM_001001582
NM_001001583
NM_001001584
NM_001001585
NM_002606
|
PDE9A
|
phosphodiesterase 9A
|
|
chr6_-_44341296
|
0.754
|
NM_004556
|
NFKBIE
|
nuclear factor of kappa light polypeptide gene enhancer in B-cells inhibitor, epsilon
|
|
chr1_-_25129354
|
0.752
|
NM_004350
|
RUNX3
|
runt-related transcription factor 3
|
|
chr20_-_32877029
|
0.746
|
NM_014071
|
NCOA6
|
nuclear receptor coactivator 6
|
|
chr14_-_37133927
|
0.745
|
|
FOXA1
|
forkhead box A1
|
|
chr1_+_243065215
|
0.743
|
NM_198076
|
FAM36A
|
family with sequence similarity 36, member A
|
|
chr14_+_101297887
|
0.740
|
NM_001161725
NM_001161726
|
PPP2R5C
|
protein phosphatase 2, regulatory subunit B', gamma
|
|
chr2_-_98714020
|
0.737
|
NM_012214
|
MGAT4A
|
mannosyl (alpha-1,3-)-glycoprotein beta-1,4-N-acetylglucosaminyltransferase, isozyme A
|
|
chr20_-_61039672
|
0.735
|
|
DIDO1
|
death inducer-obliterator 1
|
|
chr17_+_5126275
|
0.735
|
NM_001083585
NM_004703
|
RABEP1
|
rabaptin, RAB GTPase binding effector protein 1
|
|
chr1_-_199259447
|
0.734
|
NM_017596
|
KIF21B
|
kinesin family member 21B
|
|
chr6_+_15353681
|
0.731
|
|
JARID2
|
jumonji, AT rich interactive domain 2
|
|
chr2_+_64605049
|
0.727
|
|
AFTPH
|
aftiphilin
|
|
chr8_-_23233426
|
0.723
|
|
LOXL2
|
lysyl oxidase-like 2
|
|
chrX_+_9392980
|
0.722
|
NM_005647
|
TBL1X
|
transducin (beta)-like 1X-linked
|
|
chr1_+_945472
|
0.721
|
|
AGRN
|
agrin
|
|
chr7_-_86942910
|
0.719
|
NM_000443
NM_018849
NM_018850
|
ABCB4
|
ATP-binding cassette, sub-family B (MDR/TAP), member 4
|
|
chr12_-_61614930
|
0.713
|
NM_020700
|
PPM1H
|
protein phosphatase, Mg2+/Mn2+ dependent, 1H
|
|
chr18_+_58341637
|
0.713
|
NM_017742
|
ZCCHC2
|
zinc finger, CCHC domain containing 2
|
|
chr17_-_50854054
|
0.711
|
NM_012329
|
MMD
|
monocyte to macrophage differentiation-associated
|
|
chr16_+_29725597
|
0.710
|
|
|
|
|
chr1_+_87153025
|
0.710
|
|
HS2ST1
|
heparan sulfate 2-O-sulfotransferase 1
|
|
chr16_+_84202515
|
0.699
|
NM_001134473
|
KIAA0182
|
KIAA0182
|
|
chr20_+_60130866
|
0.688
|
NM_144703
|
LSM14B
|
LSM14B, SCD6 homolog B (S. cerevisiae)
|
|
chr3_-_172660545
|
0.688
|
NM_001161560
NM_001161561
NM_001161562
NM_001161563
NM_001161564
NM_001161565
NM_001161566
NM_015028
|
TNIK
|
TRAF2 and NCK interacting kinase
|
|
chr20_+_336717
|
0.686
|
|
RBCK1
|
RanBP-type and C3HC4-type zinc finger containing 1
|
|
chr2_+_65069081
|
0.685
|
NM_001193493
|
SLC1A4
|
solute carrier family 1 (glutamate/neutral amino acid transporter), member 4
|
|
chr1_+_226420051
|
0.684
|
NM_001010867
|
C1orf69
|
chromosome 1 open reading frame 69
|
|
chr10_-_88844591
|
0.684
|
|
GLUD1
|
glutamate dehydrogenase 1
|
|
chr17_-_34157962
|
0.683
|
NM_007144
|
PCGF2
|
polycomb group ring finger 2
|
|
chr4_-_105635499
|
0.683
|
|
CXXC4
|
CXXC finger protein 4
|
|
chr16_-_342399
|
0.681
|
NM_003502
NM_181050
|
AXIN1
|
axin 1
|
|
chr14_+_59785739
|
0.680
|
|
PPM1A
|
protein phosphatase, Mg2+/Mn2+ dependent, 1A
|
|
chr18_+_9126742
|
0.679
|
NM_001083625
NM_015208
|
ANKRD12
|
ankyrin repeat domain 12
|
|
chr20_+_56899904
|
0.677
|
|
GNAS
|
GNAS complex locus
|
|
chr7_-_102044419
|
0.676
|
NM_001079877
NM_006989
|
RASA4
|
RAS p21 protein activator 4
|
|
chr20_+_336941
|
0.675
|
|
RBCK1
|
RanBP-type and C3HC4-type zinc finger containing 1
|
|
chr1_+_149851138
|
0.672
|
NM_030918
|
SNX27
|
sorting nexin family member 27
|
|
chr15_+_78232184
|
0.670
|
|
FAH
|
fumarylacetoacetate hydrolase (fumarylacetoacetase)
|
|
chrX_+_152565849
|
0.668
|
|
DUSP9
|
dual specificity phosphatase 9
|
|
chr3_+_4996141
|
0.668
|
|
BHLHE40
|
basic helix-loop-helix family, member e40
|
|
chr10_+_45189617
|
0.668
|
NM_000698
|
ALOX5
|
arachidonate 5-lipoxygenase
|
|
chr1_-_154290112
|
0.664
|
NM_020131
|
UBQLN4
|
ubiquilin 4
|
|
chr15_+_78232194
|
0.659
|
|
FAH
|
fumarylacetoacetate hydrolase (fumarylacetoacetase)
|
|
chr6_-_41148061
|
0.658
|
NM_145063
|
C6orf130
|
chromosome 6 open reading frame 130
|
|
chr16_+_2528022
|
0.656
|
|
PDPK1
|
3-phosphoinositide dependent protein kinase-1
|
|
chr2_-_171725150
|
0.654
|
|
TLK1
|
tousled-like kinase 1
|
|
chr1_-_233879617
|
0.653
|
NM_001098722
|
GNG4
|
guanine nucleotide binding protein (G protein), gamma 4
|
|
chr4_+_38341982
|
0.653
|
NM_016531
|
KLF3
|
Kruppel-like factor 3 (basic)
|
|
chr14_-_99140195
|
0.653
|
NM_001144995
|
CCDC85C
|
coiled-coil domain containing 85C
|
|
chr6_-_34772495
|
0.653
|
|
C6orf106
|
chromosome 6 open reading frame 106
|
|
chr11_-_46099531
|
0.650
|
NM_001101802
NM_016621
|
PHF21A
|
PHD finger protein 21A
|
|
chr4_+_57469122
|
0.643
|
|
REST
|
RE1-silencing transcription factor
|
|
chr2_+_62786290
|
0.642
|
NM_001142616
NM_015252
|
EHBP1
|
EH domain binding protein 1
|
|
chr20_-_61039710
|
0.641
|
NM_022105
NM_033081
NM_080797
|
DIDO1
|
death inducer-obliterator 1
|
|
chr2_-_27288518
|
0.641
|
NM_021095
|
SLC5A6
|
solute carrier family 5 (sodium-dependent vitamin transporter), member 6
|