|
chr6_+_37245860
|
4.730
|
NM_002648
|
PIM1
|
pim-1 oncogene
|
|
chrX_+_138060
|
4.324
|
NM_018390
|
PLCXD1
|
phosphatidylinositol-specific phospholipase C, X domain containing 1
|
|
chrY_+_138060
|
4.324
|
NM_018390
|
PLCXD1
|
phosphatidylinositol-specific phospholipase C, X domain containing 1
|
|
chr7_-_158073121
|
2.644
|
NM_002847
NM_130842
NM_130843
|
PTPRN2
|
protein tyrosine phosphatase, receptor type, N polypeptide 2
|
|
chr19_-_18578631
|
2.537
|
NM_004750
|
CRLF1
|
cytokine receptor-like factor 1
|
|
chr19_-_18578577
|
2.518
|
|
CRLF1
|
cytokine receptor-like factor 1
|
|
chr11_-_116213511
|
2.395
|
NM_000039
|
APOA1
|
apolipoprotein A-I
|
|
chr2_+_47449951
|
2.374
|
|
EPCAM
|
epithelial cell adhesion molecule
|
|
chr20_-_3102169
|
2.343
|
|
ProSAPiP1
|
ProSAPiP1 protein
|
|
chr19_-_45888259
|
2.330
|
NM_004756
|
NUMBL
|
numb homolog (Drosophila)-like
|
|
chr7_-_103417198
|
2.244
|
NM_005045
NM_173054
|
RELN
|
reelin
|
|
chr19_+_54708312
|
2.158
|
|
FCGRT
|
Fc fragment of IgG, receptor, transporter, alpha
|
|
chr20_-_23566325
|
2.086
|
NM_000099
|
CST3
|
cystatin C
|
|
chr16_-_51138306
|
2.032
|
NM_001080430
|
TOX3
|
TOX high mobility group box family member 3
|
|
chr19_+_54708389
|
2.007
|
|
FCGRT
|
Fc fragment of IgG, receptor, transporter, alpha
|
|
chr14_-_37134191
|
1.975
|
NM_004496
|
FOXA1
|
forkhead box A1
|
|
chr1_-_233879617
|
1.965
|
NM_001098722
|
GNG4
|
guanine nucleotide binding protein (G protein), gamma 4
|
|
chr2_+_47449790
|
1.929
|
NM_002354
|
EPCAM
|
epithelial cell adhesion molecule
|
|
chr16_+_68157611
|
1.911
|
|
NFAT5
|
nuclear factor of activated T-cells 5, tonicity-responsive
|
|
chr11_+_46359781
|
1.891
|
NM_002391
|
MDK
|
midkine (neurite growth-promoting factor 2)
|
|
chr11_-_86343859
|
1.860
|
NM_012193
|
FZD4
|
frizzled homolog 4 (Drosophila)
|
|
chr12_-_61614930
|
1.841
|
NM_020700
|
PPM1H
|
protein phosphatase, Mg2+/Mn2+ dependent, 1H
|
|
chr1_-_32574185
|
1.819
|
NM_023009
|
MARCKSL1
|
MARCKS-like 1
|
|
chr19_+_54708247
|
1.816
|
NM_004107
|
FCGRT
|
Fc fragment of IgG, receptor, transporter, alpha
|
|
chr10_-_95350949
|
1.807
|
NM_006744
|
RBP4
|
retinol binding protein 4, plasma
|
|
chr1_+_153366559
|
1.777
|
|
EFNA1
|
ephrin-A1
|
|
chr4_+_1764802
|
1.747
|
NM_000142
NM_001163213
NM_022965
|
FGFR3
|
fibroblast growth factor receptor 3
|
|
chr12_-_61615124
|
1.744
|
|
PPM1H
|
protein phosphatase, Mg2+/Mn2+ dependent, 1H
|
|
chrX_+_9392980
|
1.707
|
NM_005647
|
TBL1X
|
transducin (beta)-like 1X-linked
|
|
chr17_-_78199384
|
1.697
|
NM_019613
|
WDR45L
|
WDR45-like
|
|
chr11_+_46358909
|
1.678
|
NM_001012334
|
MDK
|
midkine (neurite growth-promoting factor 2)
|
|
chr16_-_29817841
|
1.664
|
NM_001114099
NM_001114100
NM_012410
NM_201575
|
SEZ6L2
|
seizure related 6 homolog (mouse)-like 2
|
|
chr5_+_176446425
|
1.657
|
NM_002011
NM_213647
|
FGFR4
|
fibroblast growth factor receptor 4
|
|
chr11_+_46359855
|
1.627
|
|
MDK
|
midkine (neurite growth-promoting factor 2)
|
|
chr12_+_100615530
|
1.626
|
NM_020244
|
CHPT1
|
choline phosphotransferase 1
|
|
chr10_+_114699953
|
1.626
|
NM_001146274
NM_001146283
NM_001146284
NM_001146285
NM_001146286
NM_001198525
NM_001198526
NM_001198527
NM_001198528
NM_001198529
NM_001198530
NM_001198531
NM_030756
|
TCF7L2
|
transcription factor 7-like 2 (T-cell specific, HMG-box)
|
|
chr19_+_50144267
|
1.622
|
|
APOC2
|
apolipoprotein C-II
|
|
chr20_+_30813851
|
1.561
|
NM_006892
NM_175848
NM_175849
|
DNMT3B
|
DNA (cytosine-5-)-methyltransferase 3 beta
|
|
chr16_+_84202515
|
1.554
|
NM_001134473
|
KIAA0182
|
KIAA0182
|
|
chr11_+_46359836
|
1.547
|
|
MDK
|
midkine (neurite growth-promoting factor 2)
|
|
chr10_+_111975618
|
1.533
|
NM_005962
|
MXI1
|
MAX interactor 1
|
|
chr17_+_50697355
|
1.529
|
|
HLF
|
hepatic leukemia factor
|
|
chr1_-_11637325
|
1.525
|
NM_012168
|
FBXO2
|
F-box protein 2
|
|
chr19_+_50041424
|
1.521
|
|
PVRL2
|
poliovirus receptor-related 2 (herpesvirus entry mediator B)
|
|
chr19_+_447453
|
1.514
|
NM_130760
NM_130762
|
MADCAM1
|
mucosal vascular addressin cell adhesion molecule 1
|
|
chr3_+_50279993
|
1.510
|
NM_001005914
NM_004636
|
SEMA3B
|
sema domain, immunoglobulin domain (Ig), short basic domain, secreted, (semaphorin) 3B
|
|
chr18_-_24011349
|
1.509
|
NM_001792
|
CDH2
|
cadherin 2, type 1, N-cadherin (neuronal)
|
|
chr7_+_73506172
|
1.507
|
|
GTF2IRD1
|
GTF2I repeat domain containing 1
|
|
chr12_+_2938703
|
1.500
|
NM_003213
NM_201441
NM_201443
|
TEAD4
|
TEA domain family member 4
|
|
chr5_-_172689111
|
1.499
|
NM_003714
|
STC2
|
stanniocalcin 2
|
|
chr12_-_123914375
|
1.498
|
NM_001082959
NM_005505
|
SCARB1
|
scavenger receptor class B, member 1
|
|
chr1_-_11637058
|
1.486
|
|
FBXO2
|
F-box protein 2
|
|
chr8_+_1699276
|
1.483
|
NM_018941
|
CLN8
|
ceroid-lipofuscinosis, neuronal 8 (epilepsy, progressive with mental retardation)
|
|
chr20_+_48240772
|
1.483
|
NM_005194
|
CEBPB
|
CCAAT/enhancer binding protein (C/EBP), beta
|
|
chr1_-_11636983
|
1.481
|
|
FBXO2
|
F-box protein 2
|
|
chr1_-_21868380
|
1.454
|
NM_001145657
NM_002885
|
RAP1GAP
|
RAP1 GTPase activating protein
|
|
chr19_+_54708302
|
1.449
|
|
FCGRT
|
Fc fragment of IgG, receptor, transporter, alpha
|
|
chr6_-_4080700
|
1.446
|
NM_001166010
NM_006117
NM_206836
|
PECI
|
peroxisomal D3,D2-enoyl-CoA isomerase
|
|
chr10_+_29006425
|
1.435
|
NM_012342
|
BAMBI
|
BMP and activin membrane-bound inhibitor homolog (Xenopus laevis)
|
|
chr21_-_43369492
|
1.421
|
NM_001178008
NM_001178009
|
CBS
|
cystathionine-beta-synthase
|
|
chr16_-_88295595
|
1.416
|
NM_152339
|
SPATA2L
|
spermatogenesis associated 2-like
|
|
chr3_-_12983959
|
1.400
|
NM_014869
|
IQSEC1
|
IQ motif and Sec7 domain 1
|
|
chr14_+_20608179
|
1.380
|
NM_018071
|
ARHGEF40
|
Rho guanine nucleotide exchange factor (GEF) 40
|
|
chr16_+_2527990
|
1.378
|
|
PDPK1
|
3-phosphoinositide dependent protein kinase-1
|
|
chr22_+_20101661
|
1.369
|
NM_015094
|
HIC2
|
hypermethylated in cancer 2
|
|
chr12_+_54760211
|
1.368
|
|
ERBB3
|
v-erb-b2 erythroblastic leukemia viral oncogene homolog 3 (avian)
|
|
chr4_-_1156458
|
1.363
|
|
SPON2
|
spondin 2, extracellular matrix protein
|
|
chr19_+_54707739
|
1.339
|
|
FCGRT
|
Fc fragment of IgG, receptor, transporter, alpha
|
|
chr15_-_43267441
|
1.331
|
|
SHF
|
Src homology 2 domain containing F
|
|
chr4_-_1156378
|
1.328
|
|
SPON2
|
spondin 2, extracellular matrix protein
|
|
chr7_+_73506333
|
1.324
|
NM_005685
|
GTF2IRD1
|
GTF2I repeat domain containing 1
|
|
chr4_-_1156362
|
1.323
|
|
SPON2
|
spondin 2, extracellular matrix protein
|
|
chr2_-_174537354
|
1.319
|
|
SP3
|
Sp3 transcription factor
|
|
chr11_+_46359878
|
1.314
|
NM_001012333
|
MDK
|
midkine (neurite growth-promoting factor 2)
|
|
chr4_-_1156533
|
1.312
|
NM_012445
|
SPON2
|
spondin 2, extracellular matrix protein
|
|
chr17_-_76622967
|
1.311
|
|
FLJ90757
|
hypothetical LOC440465
|
|
chr6_+_7486836
|
1.306
|
|
DSP
|
desmoplakin
|
|
chr19_+_40223249
|
1.297
|
NM_002151
NM_182983
|
HPN
|
hepsin
|
|
chr9_+_137511448
|
1.297
|
NM_014811
|
KIAA0649
|
KIAA0649
|
|
chr20_+_30814048
|
1.295
|
|
DNMT3B
|
DNA (cytosine-5-)-methyltransferase 3 beta
|
|
chr11_-_114880275
|
1.292
|
NM_001098517
NM_014333
|
CADM1
|
cell adhesion molecule 1
|
|
chr17_-_39556535
|
1.287
|
NM_001015053
NM_005474
|
HDAC5
|
histone deacetylase 5
|
|
chr11_+_46359821
|
1.279
|
|
MDK
|
midkine (neurite growth-promoting factor 2)
|
|
chr17_-_44794325
|
1.268
|
NM_001145365
NM_014897
|
ZNF652
|
zinc finger protein 652
|
|
chr19_-_18578467
|
1.264
|
|
CRLF1
|
cytokine receptor-like factor 1
|
|
chr20_+_33667160
|
1.263
|
NM_003116
|
SPAG4
|
sperm associated antigen 4
|
|
chr20_-_22512893
|
1.260
|
|
FOXA2
|
forkhead box A2
|
|
chr17_-_39556483
|
1.254
|
|
HDAC5
|
histone deacetylase 5
|
|
chr6_+_7486862
|
1.245
|
NM_001008844
NM_004415
|
DSP
|
desmoplakin
|
|
chr7_+_137795719
|
1.230
|
|
TRIM24
|
tripartite motif containing 24
|
|
chr15_+_72620570
|
1.206
|
NM_006465
|
ARID3B
|
AT rich interactive domain 3B (BRIGHT-like)
|
|
chr2_-_11402150
|
1.205
|
NM_004850
|
ROCK2
|
Rho-associated, coiled-coil containing protein kinase 2
|
|
chr17_-_62671767
|
1.193
|
NM_014877
|
HELZ
|
helicase with zinc finger
|
|
chr17_+_77529070
|
1.190
|
|
ASPSCR1
|
alveolar soft part sarcoma chromosome region, candidate 1
|
|
chr7_+_94123612
|
1.177
|
NM_001172437
NM_001172438
|
PEG10
|
paternally expressed 10
|
|
chr7_+_94123672
|
1.173
|
|
PEG10
|
paternally expressed 10
|
|
chr7_+_94123556
|
1.173
|
NM_001040152
NM_001184961
NM_001184962
NM_015068
|
PEG10
|
paternally expressed 10
|
|
chrX_-_20194831
|
1.172
|
|
RPS6KA3
|
ribosomal protein S6 kinase, 90kDa, polypeptide 3
|
|
chr10_+_102719239
|
1.170
|
|
SEMA4G
|
sema domain, immunoglobulin domain (Ig), transmembrane domain (TM) and short cytoplasmic domain, (semaphorin) 4G
|
|
chrX_+_46822751
|
1.170
|
|
RGN
|
regucalcin (senescence marker protein-30)
|
|
chr6_+_7052985
|
1.169
|
NM_001003698
NM_001003699
NM_001003700
|
RREB1
|
ras responsive element binding protein 1
|
|
chr2_-_27288518
|
1.169
|
NM_021095
|
SLC5A6
|
solute carrier family 5 (sodium-dependent vitamin transporter), member 6
|
|
chr4_-_1156959
|
1.165
|
NM_001128325
|
SPON2
|
spondin 2, extracellular matrix protein
|
|
chr19_+_40224457
|
1.162
|
|
HPN
|
hepsin
|
|
chr1_+_6767968
|
1.156
|
NM_001195563
NM_015215
|
CAMTA1
|
calmodulin binding transcription activator 1
|
|
chr17_-_62671738
|
1.155
|
|
HELZ
|
helicase with zinc finger
|
|
chr17_-_38978253
|
1.152
|
|
ETV4
|
ets variant 4
|
|
chrX_+_46822833
|
1.151
|
|
RGN
|
regucalcin (senescence marker protein-30)
|
|
chr12_-_123914299
|
1.148
|
|
SCARB1
|
scavenger receptor class B, member 1
|
|
chr16_+_2528022
|
1.148
|
|
PDPK1
|
3-phosphoinositide dependent protein kinase-1
|
|
chr2_-_61551403
|
1.146
|
|
USP34
|
ubiquitin specific peptidase 34
|
|
chr9_-_98368913
|
1.138
|
NM_001077181
|
CDC14B
|
CDC14 cell division cycle 14 homolog B (S. cerevisiae)
|
|
chr7_-_100077072
|
1.135
|
NM_003227
|
TFR2
|
transferrin receptor 2
|
|
chr19_-_18409788
|
1.133
|
NM_001170939
|
ISYNA1
|
inositol-3-phosphate synthase 1
|
|
chr20_+_34143983
|
1.131
|
|
EPB41L1
|
erythrocyte membrane protein band 4.1-like 1
|
|
chr17_+_77528699
|
1.128
|
NM_024083
|
ASPSCR1
|
alveolar soft part sarcoma chromosome region, candidate 1
|
|
chrX_-_131451675
|
1.124
|
NM_001170704
|
MBNL3
|
muscleblind-like 3 (Drosophila)
|
|
chr16_+_68157370
|
1.124
|
|
NFAT5
|
nuclear factor of activated T-cells 5, tonicity-responsive
|
|
chr17_-_34157962
|
1.124
|
NM_007144
|
PCGF2
|
polycomb group ring finger 2
|
|
chrX_-_20194629
|
1.120
|
NM_004586
|
RPS6KA3
|
ribosomal protein S6 kinase, 90kDa, polypeptide 3
|
|
chr17_+_77528782
|
1.119
|
|
ASPSCR1
|
alveolar soft part sarcoma chromosome region, candidate 1
|
|
chr6_+_7052798
|
1.109
|
NM_001168344
|
RREB1
|
ras responsive element binding protein 1
|
|
chr6_+_43089908
|
1.104
|
|
KLHDC3
|
kelch domain containing 3
|
|
chrX_+_152643516
|
1.103
|
NM_000033
|
ABCD1
|
ATP-binding cassette, sub-family D (ALD), member 1
|
|
chr15_+_78232184
|
1.100
|
|
FAH
|
fumarylacetoacetate hydrolase (fumarylacetoacetase)
|
|
chr2_-_39517934
|
1.099
|
|
MAP4K3
|
mitogen-activated protein kinase kinase kinase kinase 3
|
|
chr16_+_1979959
|
1.097
|
NM_004209
|
SYNGR3
|
synaptogyrin 3
|
|
chr6_+_43151922
|
1.089
|
NM_002821
NM_152880
NM_152881
NM_152882
|
PTK7
|
PTK7 protein tyrosine kinase 7
|
|
chr21_-_43368963
|
1.080
|
NM_000071
|
CBS
|
cystathionine-beta-synthase
|
|
chr2_+_10101081
|
1.071
|
NM_003597
NM_001177716
|
KLF11
|
Kruppel-like factor 11
|
|
chr2_+_27163114
|
1.065
|
NM_000221
NM_006488
|
KHK
|
ketohexokinase (fructokinase)
|
|
chr19_-_9790682
|
1.064
|
NM_017703
|
FBXL12
|
F-box and leucine-rich repeat protein 12
|
|
chr11_-_2116048
|
1.056
|
|
IGF2
|
insulin-like growth factor 2 (somatomedin A)
|
|
chr15_+_78232194
|
1.051
|
|
FAH
|
fumarylacetoacetate hydrolase (fumarylacetoacetase)
|
|
chr2_-_200030944
|
1.050
|
NM_001172509
|
SATB2
|
SATB homeobox 2
|
|
chr19_+_61344501
|
1.050
|
|
ZNF444
|
zinc finger protein 444
|
|
chr20_-_17610704
|
1.046
|
|
RRBP1
|
ribosome binding protein 1 homolog 180kDa (dog)
|
|
chr17_+_63252704
|
1.045
|
|
BPTF
|
bromodomain PHD finger transcription factor
|
|
chr19_+_54707637
|
1.032
|
|
FCGRT
|
Fc fragment of IgG, receptor, transporter, alpha
|
|
chr13_+_97593469
|
1.015
|
|
FARP1
|
FERM, RhoGEF (ARHGEF) and pleckstrin domain protein 1 (chondrocyte-derived)
|
|
chr20_+_48240705
|
0.993
|
|
CEBPB
|
CCAAT/enhancer binding protein (C/EBP), beta
|
|
chr7_-_51351952
|
0.991
|
NM_015198
|
COBL
|
cordon-bleu homolog (mouse)
|
|
chr13_+_97593711
|
0.989
|
|
FARP1
|
FERM, RhoGEF (ARHGEF) and pleckstrin domain protein 1 (chondrocyte-derived)
|
|
chr19_+_61344341
|
0.988
|
NM_018337
|
ZNF444
|
zinc finger protein 444
|
|
chr17_-_73636362
|
0.976
|
|
TMC6
|
transmembrane channel-like 6
|
|
chr1_-_21850874
|
0.974
|
NM_001145658
|
RAP1GAP
|
RAP1 GTPase activating protein
|
|
chr15_+_78232160
|
0.971
|
|
FAH
|
fumarylacetoacetate hydrolase (fumarylacetoacetase)
|
|
chr4_+_6322506
|
0.965
|
|
WFS1
|
Wolfram syndrome 1 (wolframin)
|
|
chr9_+_70509925
|
0.959
|
NM_003558
|
PIP5K1B
|
phosphatidylinositol-4-phosphate 5-kinase, type I, beta
|
|
chr1_+_39229474
|
0.957
|
NM_001136275
NM_024595
|
AKIRIN1
|
akirin 1
|
|
chr2_-_174537021
|
0.956
|
NM_001017371
|
SP3
|
Sp3 transcription factor
|
|
chr6_+_43089963
|
0.946
|
|
KLHDC3
|
kelch domain containing 3
|
|
chr20_+_35407872
|
0.945
|
NM_198291
|
SRC
|
v-src sarcoma (Schmidt-Ruppin A-2) viral oncogene homolog (avian)
|
|
chr1_-_23683308
|
0.944
|
NM_001143778
NM_017707
|
ASAP3
|
ArfGAP with SH3 domain, ankyrin repeat and PH domain 3
|
|
chr10_+_29006530
|
0.942
|
|
BAMBI
|
BMP and activin membrane-bound inhibitor homolog (Xenopus laevis)
|
|
chr19_+_40224480
|
0.937
|
|
HPN
|
hepsin
|
|
chr12_-_123914219
|
0.934
|
|
SCARB1
|
scavenger receptor class B, member 1
|
|
chr6_+_7486891
|
0.934
|
|
DSP
|
desmoplakin
|
|
chr12_-_45052286
|
0.934
|
|
SLC38A2
|
solute carrier family 38, member 2
|
|
chr16_+_2528001
|
0.932
|
|
PDPK1
|
3-phosphoinositide dependent protein kinase-1
|
|
chr4_+_38341982
|
0.931
|
NM_016531
|
KLF3
|
Kruppel-like factor 3 (basic)
|
|
chr17_-_7095982
|
0.930
|
NM_015343
|
CTDNEP1
|
CTD nuclear envelope phosphatase 1
|
|
chr18_-_24010944
|
0.929
|
|
CDH2
|
cadherin 2, type 1, N-cadherin (neuronal)
|
|
chr6_+_43089970
|
0.926
|
|
KLHDC3
|
kelch domain containing 3
|
|
chr20_+_254205
|
0.924
|
NM_006943
|
SOX12
|
SRY (sex determining region Y)-box 12
|
|
chr6_+_43089950
|
0.924
|
|
KLHDC3
|
kelch domain containing 3
|
|
chr2_+_109729176
|
0.920
|
NM_023016
|
ANKRD57
|
ankyrin repeat domain 57
|
|
chr17_-_73636386
|
0.919
|
NM_001127198
|
TMC6
|
transmembrane channel-like 6
|
|
chr17_-_38978772
|
0.918
|
NM_001986
|
ETV4
|
ets variant 4
|
|
chr19_-_52426055
|
0.918
|
NM_014417
|
BBC3
|
BCL2 binding component 3
|
|
chr6_+_43089964
|
0.908
|
|
KLHDC3
|
kelch domain containing 3
|
|
chr2_+_159021712
|
0.908
|
NM_001005476
NM_003628
|
PKP4
|
plakophilin 4
|
|
chr2_-_218551786
|
0.907
|
|
TNS1
|
tensin 1
|
|
chr14_-_37133927
|
0.907
|
|
FOXA1
|
forkhead box A1
|
|
chr19_+_659766
|
0.906
|
NM_001040134
NM_002579
|
PALM
|
paralemmin
|
|
chr10_-_28861465
|
0.903
|
|
LOC220906
|
hypothetical LOC220906
|
|
chrX_-_128485134
|
0.901
|
NM_003069
NM_139035
|
SMARCA1
|
SWI/SNF related, matrix associated, actin dependent regulator of chromatin, subfamily a, member 1
|
|
chr6_+_43089953
|
0.901
|
NM_057161
|
KLHDC3
|
kelch domain containing 3
|
|
chr16_-_8870343
|
0.901
|
NM_014316
|
CARHSP1
|
calcium regulated heat stable protein 1, 24kDa
|
|
chr19_+_50041232
|
0.898
|
NM_001042724
NM_002856
|
PVRL2
|
poliovirus receptor-related 2 (herpesvirus entry mediator B)
|
|
chr2_+_8739563
|
0.892
|
NM_002166
|
ID2
|
inhibitor of DNA binding 2, dominant negative helix-loop-helix protein
|
|
chr11_-_74914514
|
0.891
|
|
GDPD5
|
glycerophosphodiester phosphodiesterase domain containing 5
|
|
chr1_-_35795592
|
0.882
|
NM_024874
|
KIAA0319L
|
KIAA0319-like
|
|
chr6_-_2190654
|
0.881
|
NM_001500
|
GMDS
|
GDP-mannose 4,6-dehydratase
|
|
chr18_+_11971421
|
0.881
|
|
IMPA2
|
inositol(myo)-1(or 4)-monophosphatase 2
|
|
chr11_-_66482366
|
0.880
|
NM_000920
NM_001040716
|
PC
|
pyruvate carboxylase
|
|
chr1_+_153366928
|
0.877
|
NM_004428
NM_182685
|
EFNA1
|
ephrin-A1
|
|
chr22_-_17545872
|
0.876
|
|
SLC25A1
|
solute carrier family 25 (mitochondrial carrier; citrate transporter), member 1
|
|
chr11_+_116205830
|
0.874
|
NM_000040
|
APOC3
|
apolipoprotein C-III
|
|
chr7_+_93976927
|
0.874
|
NM_022900
|
CASD1
|
CAS1 domain containing 1
|
|
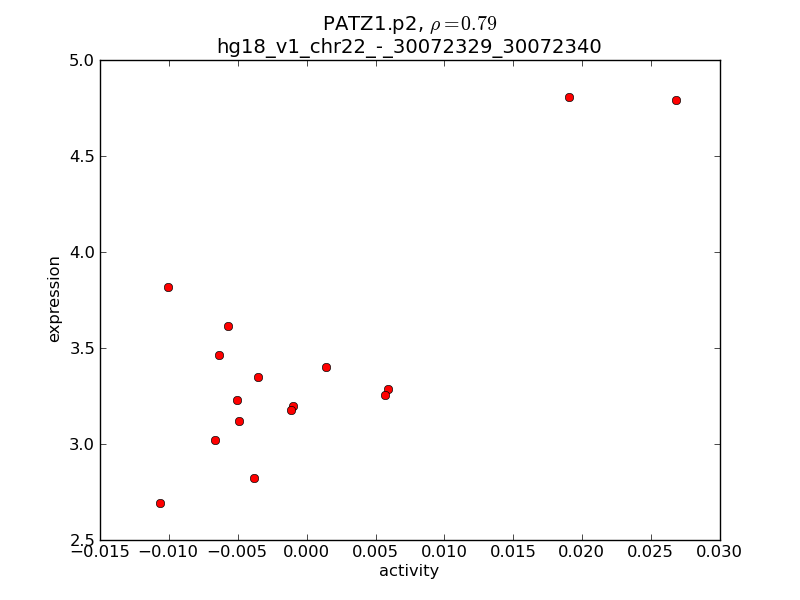
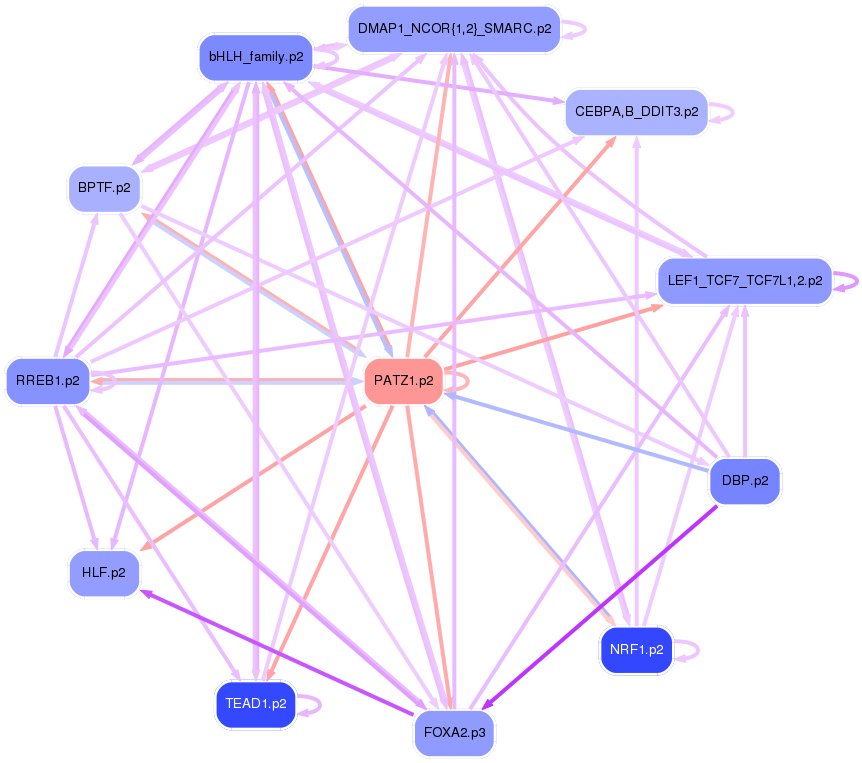
chr22_-_30072329
|
0.873
|
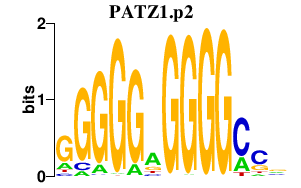
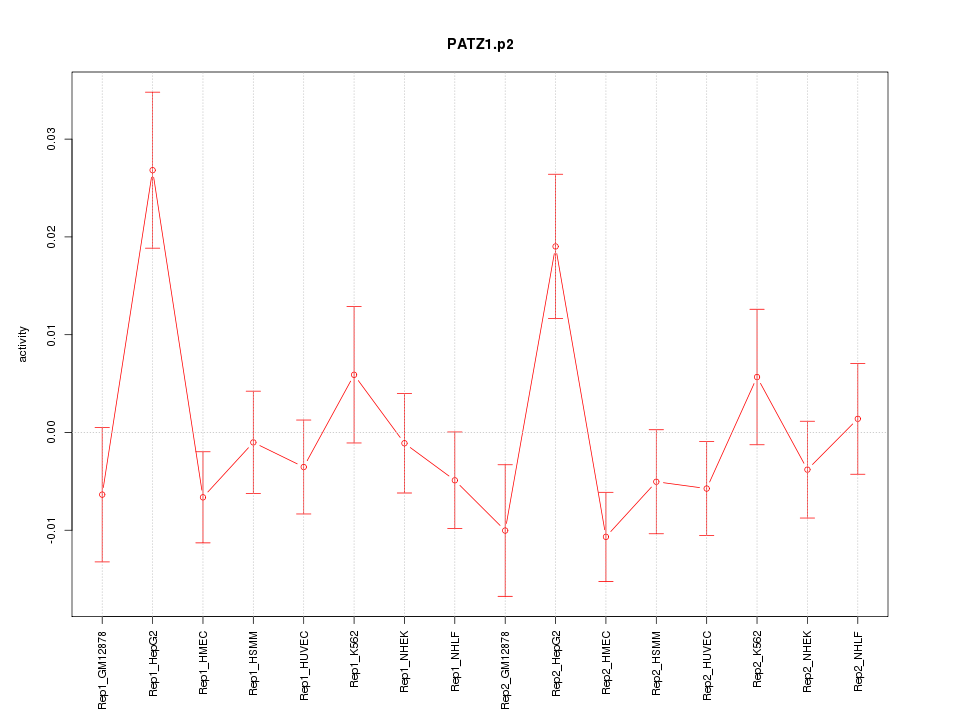
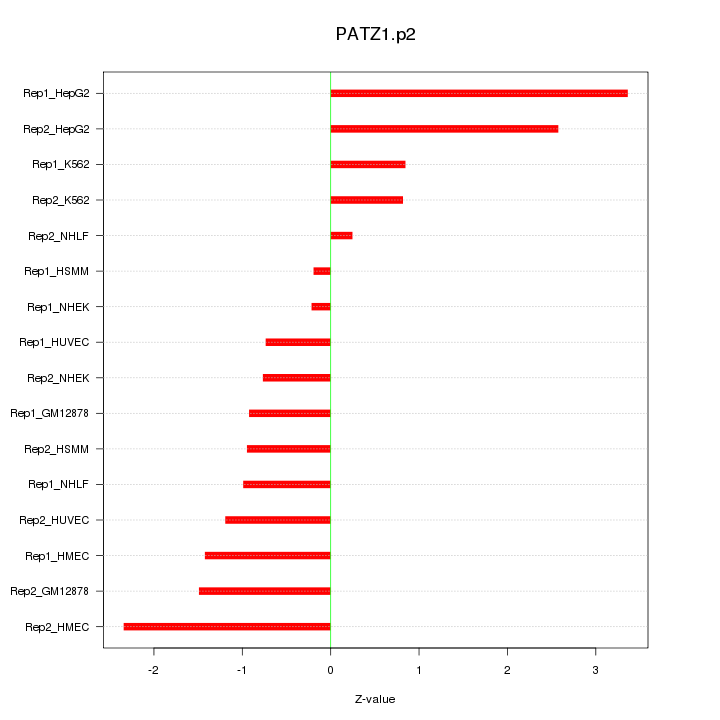
|
PATZ1
|
POZ (BTB) and AT hook containing zinc finger 1
|
|
chr15_+_78232232
|
0.871
|
|
FAH
|
fumarylacetoacetate hydrolase (fumarylacetoacetase)
|
|
chr1_+_243200275
|
0.861
|
|
EFCAB2
|
EF-hand calcium binding domain 2
|
|
chr6_+_43089947
|
0.861
|
|
KLHDC3
|
kelch domain containing 3
|
|
chr17_-_53420473
|
0.857
|
|
VEZF1
|
vascular endothelial zinc finger 1
|
|
chr2_+_233927880
|
0.854
|
NM_152879
|
DGKD
|
diacylglycerol kinase, delta 130kDa
|
|
chrX_+_46822688
|
0.853
|
NM_004683
NM_152869
|
RGN
|
regucalcin (senescence marker protein-30)
|
|
chr3_-_187025501
|
0.849
|
NM_001007225
NM_006548
|
IGF2BP2
|
insulin-like growth factor 2 mRNA binding protein 2
|
|
chr3_+_173240983
|
0.849
|
NM_001135095
|
FNDC3B
|
fibronectin type III domain containing 3B
|
|
chr16_-_88613287
|
0.849
|
NM_001042610
|
DBNDD1
|
dysbindin (dystrobrevin binding protein 1) domain containing 1
|