|
chr7_-_27186400
|
5.347
|
NM_153715
|
HOXA10
|
homeobox A10
|
|
chr3_-_150533948
|
5.058
|
NM_001184723
NM_138786
|
TM4SF18
|
transmembrane 4 L six family member 18
|
|
chr12_-_6103945
|
3.123
|
NM_000552
|
VWF
|
von Willebrand factor
|
|
chr10_+_70517823
|
3.011
|
NM_002727
|
SRGN
|
serglycin
|
|
chr10_+_70517863
|
3.002
|
|
SRGN
|
serglycin
|
|
chr1_-_171441234
|
2.891
|
|
TNFSF4
|
tumor necrosis factor (ligand) superfamily, member 4
|
|
chr4_+_86918882
|
2.840
|
|
ARHGAP24
|
Rho GTPase activating protein 24
|
|
chrX_+_86659370
|
2.818
|
NM_019117
NM_057162
|
KLHL4
|
kelch-like 4 (Drosophila)
|
|
chr4_-_101658094
|
2.696
|
NM_001159694
NM_016242
|
EMCN
|
endomucin
|
|
chr1_+_66570363
|
2.622
|
NM_001037339
|
PDE4B
|
phosphodiesterase 4B, cAMP-specific
|
|
chr7_+_102340579
|
2.484
|
NM_001031692
NM_005824
|
LRRC17
|
leucine rich repeat containing 17
|
|
chr2_-_188021117
|
2.481
|
NM_005795
|
CALCRL
|
calcitonin receptor-like
|
|
chrX_+_15428820
|
2.419
|
NM_203281
|
BMX
|
BMX non-receptor tyrosine kinase
|
|
chr1_-_32574185
|
2.399
|
NM_023009
|
MARCKSL1
|
MARCKS-like 1
|
|
chr6_+_153060722
|
2.397
|
NM_025107
|
MYCT1
|
myc target 1
|
|
chr9_+_18464138
|
2.385
|
|
ADAMTSL1
|
ADAMTS-like 1
|
|
chr10_-_32707549
|
2.384
|
|
EPC1
|
enhancer of polycomb homolog 1 (Drosophila)
|
|
chr1_-_197173159
|
2.370
|
|
LOC100131234
|
familial acute myelogenous leukemia related factor
|
|
chr5_+_15553736
|
2.308
|
|
FBXL7
|
F-box and leucine-rich repeat protein 7
|
|
chr17_-_59817456
|
2.291
|
|
PECAM1
|
platelet/endothelial cell adhesion molecule
|
|
chr9_+_18464090
|
2.253
|
NM_001040272
NM_052866
|
ADAMTSL1
|
ADAMTS-like 1
|
|
chr13_-_98428244
|
2.216
|
NM_001130048
NM_001130050
|
DOCK9
|
dedicator of cytokinesis 9
|
|
chr17_-_59817575
|
2.207
|
|
PECAM1
|
platelet/endothelial cell adhesion molecule
|
|
chr7_+_27190688
|
2.194
|
|
|
|
|
chr2_-_110665188
|
2.173
|
NM_033514
|
LIMS3-LOC440895
LIMS3
|
LIMS3-LOC440895 read-through
LIM and senescent cell antigen-like domains 3
|
|
chr5_-_111119846
|
2.143
|
NM_001142483
|
C5orf13
|
chromosome 5 open reading frame 13
|
|
chr17_-_59817654
|
2.136
|
|
PECAM1
|
platelet/endothelial cell adhesion molecule
|
|
chr17_-_59817722
|
2.130
|
NM_000442
|
PECAM1
|
platelet/endothelial cell adhesion molecule
|
|
chr6_+_130381408
|
2.084
|
NM_001007102
NM_032438
|
L3MBTL3
|
l(3)mbt-like 3 (Drosophila)
|
|
chr7_-_27190882
|
2.074
|
|
HOXA11
|
homeobox A11
|
|
chr5_+_15553288
|
2.021
|
NM_012304
|
FBXL7
|
F-box and leucine-rich repeat protein 7
|
|
chr3_+_148593911
|
2.017
|
|
|
|
|
chr5_+_15553539
|
2.006
|
|
FBXL7
|
F-box and leucine-rich repeat protein 7
|
|
chr2_+_108637916
|
1.981
|
|
LIMS1
LIMS3
|
LIM and senescent cell antigen-like domains 1
LIM and senescent cell antigen-like domains 3
|
|
chr2_+_110013297
|
1.968
|
NM_033514
|
LIMS3-LOC440895
LIMS3
|
LIMS3-LOC440895 read-through
LIM and senescent cell antigen-like domains 3
|
|
chr8_-_6407882
|
1.942
|
NM_001118887
NM_001118888
NM_001147
|
ANGPT2
|
angiopoietin 2
|
|
chr21_-_38792173
|
1.935
|
NM_001136155
NM_182918
|
ERG
|
v-ets erythroblastosis virus E26 oncogene homolog (avian)
|
|
chr2_-_198248828
|
1.934
|
NM_144629
|
RFTN2
|
raftlin family member 2
|
|
chr2_+_108637698
|
1.904
|
NM_001193485
|
LIMS1
|
LIM and senescent cell antigen-like domains 1
|
|
chr17_-_18890963
|
1.888
|
NM_006613
|
GRAP
|
GRB2-related adaptor protein
|
|
chr6_+_12398514
|
1.871
|
NM_001168319
NM_001955
|
EDN1
|
endothelin 1
|
|
chr7_-_11838260
|
1.855
|
NM_015204
|
THSD7A
|
thrombospondin, type I, domain containing 7A
|
|
chr17_-_59818033
|
1.833
|
|
PECAM1
|
platelet/endothelial cell adhesion molecule
|
|
chr15_-_80125403
|
1.814
|
NM_032246
|
MEX3B
|
mex-3 homolog B (C. elegans)
|
|
chr15_-_80125514
|
1.789
|
|
MEX3B
|
mex-3 homolog B (C. elegans)
|
|
chr1_+_242281199
|
1.765
|
|
ZNF238
|
zinc finger protein 238
|
|
chr14_+_76298693
|
1.735
|
|
VASH1
|
vasohibin 1
|
|
chr5_-_100266769
|
1.720
|
NM_175052
NM_005668
|
ST8SIA4
|
ST8 alpha-N-acetyl-neuraminide alpha-2,8-sialyltransferase 4
|
|
chr2_-_56266408
|
1.693
|
|
LOC100129434
|
hypothetical LOC100129434
|
|
chr9_+_115303527
|
1.677
|
NM_130795
|
RGS3
|
regulator of G-protein signaling 3
|
|
chr13_-_98757634
|
1.615
|
NM_004951
|
GPR183
|
G protein-coupled receptor 183
|
|
chr12_-_68369322
|
1.601
|
NM_152439
|
BEST3
|
bestrophin 3
|
|
chr1_+_22107137
|
1.589
|
|
RPL21
|
ribosomal protein L21
|
|
chr9_+_89302574
|
1.581
|
NM_004938
|
DAPK1
|
death-associated protein kinase 1
|
|
chr7_-_27171673
|
1.576
|
NM_152739
|
HOXA9
|
homeobox A9
|
|
chr6_-_56824371
|
1.566
|
|
DST
|
dystonin
|
|
chr3_+_174598937
|
1.558
|
NM_014932
|
NLGN1
|
neuroligin 1
|
|
chr13_+_110653407
|
1.558
|
|
ARHGEF7
|
Rho guanine nucleotide exchange factor (GEF) 7
|
|
chr11_+_113436438
|
1.520
|
NM_001018011
|
ZBTB16
|
zinc finger and BTB domain containing 16
|
|
chr11_+_5667494
|
1.509
|
NM_006074
|
TRIM22
|
tripartite motif containing 22
|
|
chr1_-_47468029
|
1.506
|
NM_003189
|
TAL1
|
T-cell acute lymphocytic leukemia 1
|
|
chr2_-_37752272
|
1.505
|
|
CDC42EP3
|
CDC42 effector protein (Rho GTPase binding) 3
|
|
chr9_-_72673753
|
1.504
|
NM_001007470
NM_020952
NM_024971
NM_206944
NM_206945
NM_206946
NM_206947
NM_206948
|
TRPM3
|
transient receptor potential cation channel, subfamily M, member 3
|
|
chr13_-_32658215
|
1.496
|
NM_178007
|
STARD13
|
StAR-related lipid transfer (START) domain containing 13
|
|
chr1_+_242283129
|
1.492
|
NM_006352
|
ZNF238
|
zinc finger protein 238
|
|
chr9_+_27099138
|
1.490
|
NM_000459
|
TEK
|
TEK tyrosine kinase, endothelial
|
|
chr6_-_139654807
|
1.480
|
NM_153235
|
TXLNB
|
taxilin beta
|
|
chr18_+_13601664
|
1.474
|
NM_001003674
NM_001003675
|
C18orf1
|
chromosome 18 open reading frame 1
|
|
chr5_+_15553768
|
1.445
|
|
FBXL7
|
F-box and leucine-rich repeat protein 7
|
|
chr7_-_27180398
|
1.444
|
NM_018951
|
HOXA10
|
homeobox A10
|
|
chr15_+_37330176
|
1.419
|
NM_207445
|
C15orf54
|
chromosome 15 open reading frame 54
|
|
chr9_+_126460511
|
1.414
|
|
|
|
|
chr15_-_68781662
|
1.377
|
NM_001008224
|
UACA
|
uveal autoantigen with coiled-coil domains and ankyrin repeats
|
|
chr9_+_89302239
|
1.376
|
|
DAPK1
|
death-associated protein kinase 1
|
|
chr8_-_108579270
|
1.367
|
NM_001146
|
ANGPT1
|
angiopoietin 1
|
|
chr16_+_64958086
|
1.322
|
|
CDH5
|
cadherin 5, type 2 (vascular endothelium)
|
|
chr16_+_64958060
|
1.303
|
|
CDH5
|
cadherin 5, type 2 (vascular endothelium)
|
|
chr18_-_21186107
|
1.302
|
NM_015461
|
ZNF521
|
zinc finger protein 521
|
|
chr16_+_64958025
|
1.297
|
NM_001795
|
CDH5
|
cadherin 5, type 2 (vascular endothelium)
|
|
chr3_-_115826481
|
1.291
|
NM_001164346
|
ZBTB20
|
zinc finger and BTB domain containing 20
|
|
chr3_+_25444753
|
1.282
|
NM_016152
|
RARB
|
retinoic acid receptor, beta
|
|
chr3_+_25444837
|
1.281
|
NM_000965
|
RARB
|
retinoic acid receptor, beta
|
|
chr17_-_44006808
|
1.265
|
NM_002146
|
HOXB3
|
homeobox B3
|
|
chr6_+_21774624
|
1.255
|
|
FLJ22536
|
hypothetical locus LOC401237
|
|
chrX_-_33139349
|
1.240
|
NM_004006
|
DMD
|
dystrophin
|
|
chr9_-_116190038
|
1.239
|
|
AKNA
|
AT-hook transcription factor
|
|
chr3_-_11660395
|
1.224
|
NM_001128219
|
VGLL4
|
vestigial like 4 (Drosophila)
|
|
chr14_-_90953883
|
1.221
|
NM_001080414
|
CCDC88C
|
coiled-coil domain containing 88C
|
|
chr15_+_64781723
|
1.218
|
NM_005585
|
SMAD6
|
SMAD family member 6
|
|
chr15_+_21361546
|
1.216
|
NM_005664
|
MKRN3
|
makorin ring finger protein 3
|
|
chr1_-_85816520
|
1.213
|
NM_001134445
|
DDAH1
|
dimethylarginine dimethylaminohydrolase 1
|
|
chr17_-_30783631
|
1.209
|
NM_018042
|
SLFN12
|
schlafen family member 12
|
|
chr13_-_22905822
|
1.208
|
NM_014363
|
SACS
|
spastic ataxia of Charlevoix-Saguenay (sacsin)
|
|
chr3_-_115825742
|
1.205
|
NM_001164347
|
ZBTB20
|
zinc finger and BTB domain containing 20
|
|
chr17_+_18971506
|
1.202
|
NM_001129778
|
GRAPL
|
GRB2-related adaptor protein-like
|
|
chr1_-_95165089
|
1.193
|
NM_001839
|
CNN3
|
calponin 3, acidic
|
|
chr5_+_95093267
|
1.192
|
|
|
|
|
chrX_+_28515479
|
1.168
|
NM_014271
|
IL1RAPL1
|
interleukin 1 receptor accessory protein-like 1
|
|
chr1_-_85703198
|
1.168
|
|
DDAH1
|
dimethylarginine dimethylaminohydrolase 1
|
|
chr2_-_128138435
|
1.162
|
NM_017980
|
LIMS2
|
LIM and senescent cell antigen-like domains 2
|
|
chr15_-_80123935
|
1.156
|
|
MEX3B
|
mex-3 homolog B (C. elegans)
|
|
chrX_+_84385693
|
1.148
|
|
ZNF711
|
zinc finger protein 711
|
|
chrX_+_12904207
|
1.137
|
|
TMSB4X
TMSL3
|
thymosin beta 4, X-linked
thymosin-like 3
|
|
chr4_-_138673078
|
1.128
|
NM_019035
|
PCDH18
|
protocadherin 18
|
|
chr7_+_134114912
|
1.126
|
|
CALD1
|
caldesmon 1
|
|
chr7_+_93388951
|
1.123
|
NM_004126
|
GNG11
|
guanine nucleotide binding protein (G protein), gamma 11
|
|
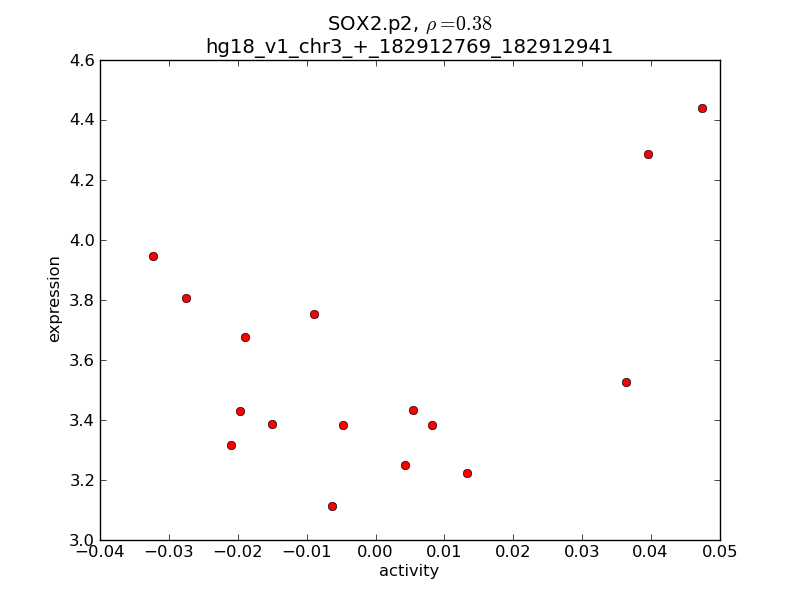
chr3_+_182900081
|
1.116
|
|
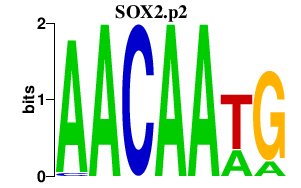
SOX2OT
|
SOX2 overlapping transcript (non-protein coding)
|
|
chr4_+_86918870
|
1.115
|
NM_001042669
|
ARHGAP24
|
Rho GTPase activating protein 24
|
|
chr5_-_88155360
|
1.110
|
NM_001193348
NM_001193349
|
MEF2C
|
myocyte enhancer factor 2C
|
|
chr12_-_16650687
|
1.100
|
|
LMO3
|
LIM domain only 3 (rhombotin-like 2)
|
|
chr1_+_84540921
|
1.090
|
NM_001134664
|
SAMD13
|
sterile alpha motif domain containing 13
|
|
chr1_+_43539239
|
1.088
|
NM_005424
|
TIE1
|
tyrosine kinase with immunoglobulin-like and EGF-like domains 1
|
|
chr6_+_44295219
|
1.081
|
NM_001078174
NM_004955
|
SLC29A1
|
solute carrier family 29 (nucleoside transporters), member 1
|
|
chr5_-_83715947
|
1.080
|
|
EDIL3
|
EGF-like repeats and discoidin I-like domains 3
|
|
chr6_-_56824672
|
1.078
|
|
DST
|
dystonin
|
|
chr2_+_198377561
|
1.077
|
NM_006226
|
PLCL1
|
phospholipase C-like 1
|
|
chr13_-_73606362
|
1.077
|
|
KLF12
|
Kruppel-like factor 12
|
|
chr6_+_116939500
|
1.067
|
NM_153711
|
FAM26E
|
family with sequence similarity 26, member E
|
|
chr12_-_16650697
|
1.064
|
NM_018640
|
LMO3
|
LIM domain only 3 (rhombotin-like 2)
|
|
chr3_-_192531018
|
1.061
|
NM_198152
|
UTS2D
|
urotensin 2 domain containing
|
|
chr10_+_104525877
|
1.052
|
NM_017787
|
C10orf26
|
chromosome 10 open reading frame 26
|
|
chr7_+_134114957
|
1.049
|
|
CALD1
|
caldesmon 1
|
|
chr1_+_242281175
|
1.033
|
NM_205768
|
ZNF238
|
zinc finger protein 238
|
|
chr11_+_128068982
|
1.031
|
NM_002017
|
FLI1
|
Friend leukemia virus integration 1
|
|
chr13_-_32678142
|
1.030
|
NM_052851
|
STARD13
|
StAR-related lipid transfer (START) domain containing 13
|
|
chr12_-_101115677
|
1.029
|
NM_002674
|
PMCH
|
pro-melanin-concentrating hormone
|
|
chr9_+_4480193
|
1.017
|
NM_004170
|
SLC1A1
|
solute carrier family 1 (neuronal/epithelial high affinity glutamate transporter, system Xag), member 1
|
|
chr5_-_39460687
|
1.014
|
|
DAB2
|
disabled homolog 2, mitogen-responsive phosphoprotein (Drosophila)
|
|
chr17_-_1195096
|
1.012
|
|
PAFAH1B1
|
platelet-activating factor acetylhydrolase 1b, regulatory subunit 1 (45kDa)
|
|
chr11_+_128069165
|
1.012
|
|
FLI1
|
Friend leukemia virus integration 1
|
|
chr3_-_116272911
|
0.999
|
NM_001164343
|
ZBTB20
|
zinc finger and BTB domain containing 20
|
|
chr10_-_88707299
|
0.995
|
NM_024756
|
MMRN2
|
multimerin 2
|
|
chr11_+_128069183
|
0.993
|
|
FLI1
|
Friend leukemia virus integration 1
|
|
chr11_+_128069203
|
0.992
|
|
FLI1
|
Friend leukemia virus integration 1
|
|
chr11_+_111313227
|
0.992
|
|
DIXDC1
|
DIX domain containing 1
|
|
chrX_+_10084984
|
0.990
|
NM_001830
|
CLCN4
|
chloride channel 4
|
|
chr1_+_66570683
|
0.987
|
|
PDE4B
|
phosphodiesterase 4B, cAMP-specific
|
|
chr18_-_24011349
|
0.974
|
NM_001792
|
CDH2
|
cadherin 2, type 1, N-cadherin (neuronal)
|
|
chr11_+_128069340
|
0.969
|
|
FLI1
|
Friend leukemia virus integration 1
|
|
chr4_-_139382672
|
0.968
|
NM_014331
|
SLC7A11
|
solute carrier family 7, (cationic amino acid transporter, y+ system) member 11
|
|
chr1_-_26105954
|
0.958
|
NM_203399
|
STMN1
|
stathmin 1
|
|
chr5_+_88220846
|
0.957
|
|
|
|
|
chrX_+_100692071
|
0.956
|
NM_016608
|
ARMCX1
|
armadillo repeat containing, X-linked 1
|
|
chr5_+_95092384
|
0.947
|
NM_014899
|
RHOBTB3
|
Rho-related BTB domain containing 3
|
|
chr9_+_112470871
|
0.947
|
NM_001166280
NM_001166281
NM_005592
|
MUSK
|
muscle, skeletal, receptor tyrosine kinase
|
|
chr11_+_111313067
|
0.944
|
NM_001037954
|
DIXDC1
|
DIX domain containing 1
|
|
chr15_-_93671314
|
0.940
|
|
LOC400456
|
hypothetical LOC400456
|
|
chr5_-_71838875
|
0.938
|
NM_152625
|
ZNF366
|
zinc finger protein 366
|
|
chr8_-_60194099
|
0.936
|
NM_014729
|
TOX
|
thymocyte selection-associated high mobility group box
|
|
chr3_-_143230124
|
0.924
|
NM_001178141
NM_001178142
NM_006286
|
TFDP2
|
transcription factor Dp-2 (E2F dimerization partner 2)
|
|
chr7_+_106292975
|
0.919
|
|
PIK3CG
|
phosphoinositide-3-kinase, catalytic, gamma polypeptide
|
|
chr4_-_54119159
|
0.916
|
NM_032622
|
LNX1
|
ligand of numb-protein X 1
|
|
chr14_+_76297885
|
0.912
|
NM_014909
|
VASH1
|
vasohibin 1
|
|
chr1_-_95165037
|
0.911
|
|
CNN3
|
calponin 3, acidic
|
|
chr3_-_58538530
|
0.909
|
NM_001076778
NM_007177
|
FAM107A
|
family with sequence similarity 107, member A
|
|
chr8_+_40130143
|
0.907
|
NM_020130
|
C8orf4
|
chromosome 8 open reading frame 4
|
|
chr1_-_79244948
|
0.904
|
NM_022159
|
ELTD1
|
EGF, latrophilin and seven transmembrane domain containing 1
|
|
chrX_+_12903145
|
0.900
|
NM_021109
NM_183049
|
TMSB4X
TMSL3
|
thymosin beta 4, X-linked
thymosin-like 3
|
|
chr4_-_54119102
|
0.896
|
|
LNX1
|
ligand of numb-protein X 1
|
|
chr11_-_85108030
|
0.892
|
NM_001162952
NM_206930
|
SYTL2
|
synaptotagmin-like 2
|
|
chr7_-_130891861
|
0.890
|
NM_001018111
NM_005397
|
PODXL
|
podocalyxin-like
|
|
chr8_-_124622434
|
0.887
|
NM_058229
|
FBXO32
|
F-box protein 32
|
|
chr3_-_58538110
|
0.884
|
|
FAM107A
|
family with sequence similarity 107, member A
|
|
chr8_-_93184629
|
0.883
|
NM_001198633
NM_175634
|
RUNX1T1
|
runt-related transcription factor 1; translocated to, 1 (cyclin D-related)
|
|
chr12_+_47498778
|
0.883
|
NM_000725
|
CACNB3
|
calcium channel, voltage-dependent, beta 3 subunit
|
|
chr8_-_93144039
|
0.882
|
|
|
|
|
chr4_+_91035025
|
0.863
|
NM_007351
|
MMRN1
|
multimerin 1
|
|
chr7_+_22733290
|
0.861
|
NM_000600
|
IL6
|
interleukin 6 (interferon, beta 2)
|
|
chr4_-_54119123
|
0.860
|
|
LNX1
|
ligand of numb-protein X 1
|
|
chr7_+_106292932
|
0.859
|
|
PIK3CG
|
phosphoinositide-3-kinase, catalytic, gamma polypeptide
|
|
chr10_+_11087345
|
0.855
|
|
CELF2
|
CUGBP, Elav-like family member 2
|
|
chr12_-_47869067
|
0.846
|
NM_006009
|
TUBA1A
|
tubulin, alpha 1a
|
|
chr11_-_6633427
|
0.846
|
NM_003737
|
DCHS1
|
dachsous 1 (Drosophila)
|
|
chr12_-_10142779
|
0.845
|
NM_016511
|
CLEC1A
|
C-type lectin domain family 1, member A
|
|
chr10_+_80672842
|
0.844
|
|
ZMIZ1
|
zinc finger, MIZ-type containing 1
|
|
chr12_-_47869134
|
0.842
|
|
TUBA1A
|
tubulin, alpha 1a
|
|
chr19_-_53941835
|
0.837
|
NM_182575
|
IZUMO1
|
izumo sperm-egg fusion 1
|
|
chr5_-_83716346
|
0.834
|
NM_005711
|
EDIL3
|
EGF-like repeats and discoidin I-like domains 3
|
|
chr1_+_61642287
|
0.832
|
|
NFIA
|
nuclear factor I/A
|
|
chr5_-_111120929
|
0.832
|
NM_001142482
NM_001142481
|
C5orf13
|
chromosome 5 open reading frame 13
|
|
chr15_-_76890626
|
0.826
|
NM_014272
|
ADAMTS7
|
ADAM metallopeptidase with thrombospondin type 1 motif, 7
|
|
chr3_+_44601457
|
0.823
|
NM_173658
|
ZNF660
|
zinc finger protein 660
|
|
chr13_-_37341859
|
0.823
|
NM_001135955
NM_001135956
NM_001135957
NM_001135958
NM_003306
NM_016179
|
TRPC4
|
transient receptor potential cation channel, subfamily C, member 4
|
|
chr7_+_22733626
|
0.822
|
|
IL6
|
interleukin 6 (interferon, beta 2)
|
|
chr2_-_192419896
|
0.815
|
|
SDPR
|
serum deprivation response
|
|
chr14_+_85066207
|
0.813
|
NM_013231
|
FLRT2
|
fibronectin leucine rich transmembrane protein 2
|
|
chr14_+_62740878
|
0.812
|
NM_020663
|
RHOJ
|
ras homolog gene family, member J
|
|
chr1_+_211190631
|
0.806
|
|
VASH2
|
vasohibin 2
|
|
chr12_-_69289889
|
0.804
|
NM_002837
|
PTPRB
|
protein tyrosine phosphatase, receptor type, B
|
|
chr10_+_11087259
|
0.798
|
NM_001025077
|
CELF2
|
CUGBP, Elav-like family member 2
|
|
chrX_+_80344253
|
0.787
|
|
SH3BGRL
|
SH3 domain binding glutamic acid-rich protein like
|
|
chr5_-_111120817
|
0.786
|
NM_004772
|
C5orf13
|
chromosome 5 open reading frame 13
|
|
chr6_+_121798443
|
0.783
|
NM_000165
|
GJA1
|
gap junction protein, alpha 1, 43kDa
|
|
chr1_+_211190476
|
0.777
|
NM_001136474
NM_001136475
NM_024749
|
VASH2
|
vasohibin 2
|
|
chr8_+_67201684
|
0.775
|
NM_033058
NM_184085
NM_184086
NM_184087
|
TRIM55
|
tripartite motif containing 55
|
|
chr10_+_11087280
|
0.771
|
|
CELF2
|
CUGBP, Elav-like family member 2
|
|
chr10_+_22765996
|
0.770
|
|
LOC100289455
|
hypothetical LOC100289455
|
|
chr22_-_20419975
|
0.768
|
NM_013313
|
YPEL1
|
yippee-like 1 (Drosophila)
|
|
chr13_-_73605914
|
0.758
|
NM_007249
|
KLF12
|
Kruppel-like factor 12
|
|
chr10_-_92671005
|
0.758
|
NM_014391
|
ANKRD1
|
ankyrin repeat domain 1 (cardiac muscle)
|