|
chr19_-_48815572
|
4.206
|
|
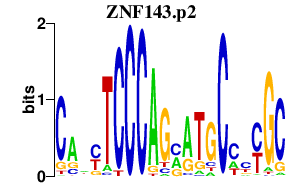
ZNF428
|
zinc finger protein 428
|
|
chr8_+_145705253
|
4.125
|
NM_138431
|
MFSD3
|
major facilitator superfamily domain containing 3
|
|
chr20_+_55399847
|
3.300
|
NM_017495
NM_183425
|
RBM38
|
RNA binding motif protein 38
|
|
chr20_-_62058162
|
2.779
|
NM_017859
|
UCKL1
|
uridine-cytidine kinase 1-like 1
|
|
chr16_+_2742320
|
2.674
|
NM_016333
|
SRRM2
|
serine/arginine repetitive matrix 2
|
|
chr1_+_44978145
|
2.603
|
|
KIF2C
|
kinesin family member 2C
|
|
chr1_+_44978120
|
2.549
|
|
KIF2C
|
kinesin family member 2C
|
|
chr16_-_30841938
|
2.435
|
|
NCRNA00095
|
non-protein coding RNA 95
|
|
chr19_+_10261646
|
2.389
|
NM_003259
|
ICAM5
|
intercellular adhesion molecule 5, telencephalin
|
|
chr4_-_1692776
|
2.309
|
NM_001127266
NM_138385
|
TMEM129
|
transmembrane protein 129
|
|
chr22_+_18447732
|
2.278
|
NM_001190326
NM_022720
|
DGCR8
|
DiGeorge syndrome critical region gene 8
|
|
chr6_+_43705254
|
2.256
|
NM_001003690
|
MAD2L1BP
|
MAD2L1 binding protein
|
|
chr16_-_30010705
|
2.244
|
NM_004608
|
TBX6
|
T-box 6
|
|
chr1_+_44978053
|
2.150
|
NM_006845
|
KIF2C
|
kinesin family member 2C
|
|
chr16_-_69030421
|
2.147
|
NM_006927
|
ST3GAL2
|
ST3 beta-galactoside alpha-2,3-sialyltransferase 2
|
|
chr15_+_38240501
|
2.048
|
NM_001211
|
BUB1B
|
budding uninhibited by benzimidazoles 1 homolog beta (yeast)
|
|
chr4_+_1693031
|
2.041
|
NM_006342
|
TACC3
|
transforming, acidic coiled-coil containing protein 3
|
|
chr17_+_73721924
|
2.029
|
|
BIRC5
|
baculoviral IAP repeat containing 5
|
|
chr3_+_32123004
|
1.978
|
NM_015141
|
GPD1L
|
glycerol-3-phosphate dehydrogenase 1-like
|
|
chr19_-_47438548
|
1.975
|
|
GSK3A
|
glycogen synthase kinase 3 alpha
|
|
chr15_+_38240555
|
1.913
|
|
BUB1B
|
budding uninhibited by benzimidazoles 1 homolog beta (yeast)
|
|
chr7_-_150385867
|
1.911
|
|
CDK5
|
cyclin-dependent kinase 5
|
|
chr19_-_47438583
|
1.900
|
|
GSK3A
|
glycogen synthase kinase 3 alpha
|
|
chr7_-_150385912
|
1.890
|
NM_001164410
NM_004935
|
CDK5
|
cyclin-dependent kinase 5
|
|
chr1_+_45738442
|
1.890
|
NM_015506
|
MMACHC
|
methylmalonic aciduria (cobalamin deficiency) cblC type, with homocystinuria
|
|
chr12_+_52181643
|
1.858
|
NM_134324
|
TARBP2
|
TAR (HIV-1) RNA binding protein 2
|
|
chr6_-_27548438
|
1.852
|
NM_007149
|
ZNF184
|
zinc finger protein 184
|
|
chr17_+_73721871
|
1.788
|
NM_001012270
NM_001012271
NM_001168
|
BIRC5
|
baculoviral IAP repeat containing 5
|
|
chrX_+_70232362
|
1.778
|
NM_001170931
NM_005938
|
FOXO4
|
forkhead box O4
|
|
chr6_-_43704742
|
1.760
|
|
GTPBP2
|
GTP binding protein 2
|
|
chr19_-_47438518
|
1.751
|
|
GSK3A
|
glycogen synthase kinase 3 alpha
|
|
chr2_-_74610323
|
1.727
|
|
AUP1
|
ancient ubiquitous protein 1
|
|
chr4_-_1692574
|
1.724
|
|
TMEM129
|
transmembrane protein 129
|
|
chr11_-_64334593
|
1.719
|
NM_130800
NM_130801
|
MEN1
|
multiple endocrine neoplasia I
|
|
chr17_-_44847215
|
1.696
|
NM_002634
|
PHB
|
prohibitin
|
|
chr11_+_64565118
|
1.683
|
|
SAC3D1
|
SAC3 domain containing 1
|
|
chr17_+_71292535
|
1.678
|
|
|
|
|
chr2_-_74610331
|
1.668
|
|
AUP1
|
ancient ubiquitous protein 1
|
|
chr8_-_145881968
|
1.636
|
|
ARHGAP39
|
Rho GTPase activating protein 39
|
|
chr17_+_38531134
|
1.629
|
|
NBR2
|
neighbor of BRCA1 gene 2 (non-protein coding)
|
|
chr2_+_74610395
|
1.619
|
|
HTRA2
|
HtrA serine peptidase 2
|
|
chr19_-_48815853
|
1.609
|
NM_182498
|
ZNF428
|
zinc finger protein 428
|
|
chr11_-_64334752
|
1.605
|
NM_000244
NM_130799
NM_130802
|
MEN1
|
multiple endocrine neoplasia I
|
|
chr17_+_71292437
|
1.600
|
|
UNK
|
unkempt homolog (Drosophila)
|
|
chr3_+_32123140
|
1.596
|
|
GPD1L
|
glycerol-3-phosphate dehydrogenase 1-like
|
|
chr17_-_44847214
|
1.594
|
|
PHB
|
prohibitin
|
|
chr20_+_41576459
|
1.589
|
NM_015478
|
L3MBTL1
|
l(3)mbt-like 1 (Drosophila)
|
|
chr20_-_47238310
|
1.587
|
NM_001037328
NM_004602
NM_017452
NM_017453
NM_017454
|
STAU1
|
staufen, RNA binding protein, homolog 1 (Drosophila)
|
|
chr19_+_61344501
|
1.580
|
|
ZNF444
|
zinc finger protein 444
|
|
chr17_+_71292275
|
1.566
|
NM_001080419
|
UNK
|
unkempt homolog (Drosophila)
|
|
chr1_-_26197121
|
1.562
|
NM_000437
|
PAFAH2
|
platelet-activating factor acetylhydrolase 2, 40kDa
|
|
chr5_+_85949511
|
1.540
|
|
COX7C
|
cytochrome c oxidase subunit VIIc
|
|
chr2_-_74610332
|
1.530
|
|
AUP1
|
ancient ubiquitous protein 1
|
|
chr8_-_145521324
|
1.529
|
|
DGAT1
|
diacylglycerol O-acyltransferase 1
|
|
chr6_-_43704955
|
1.516
|
|
GTPBP2
|
GTP binding protein 2
|
|
chr22_+_19666616
|
1.503
|
|
LZTR1
|
leucine-zipper-like transcription regulator 1
|
|
chr8_-_145521108
|
1.502
|
|
DGAT1
|
diacylglycerol O-acyltransferase 1
|
|
chr1_-_21982256
|
1.491
|
NM_001032730
NM_032236
|
USP48
|
ubiquitin specific peptidase 48
|
|
chr19_+_3136965
|
1.484
|
|
NCLN
|
nicalin
|
|
chr6_-_43704897
|
1.484
|
NM_019096
|
GTPBP2
|
GTP binding protein 2
|
|
chr22_+_19666575
|
1.482
|
|
LZTR1
|
leucine-zipper-like transcription regulator 1
|
|
chr8_-_145521344
|
1.479
|
NM_012079
|
DGAT1
|
diacylglycerol O-acyltransferase 1
|
|
chr7_-_98901699
|
1.479
|
NM_001198879
NM_001190353
NM_001190354
NM_001003713
NM_001003714
NM_001039178
NM_004889
|
ATP5J2-PTCD1
ATP5J2
|
ATP5J2-PTCD1 readthrough
ATP synthase, H+ transporting, mitochondrial Fo complex, subunit F2
|
|
chr8_-_145521297
|
1.457
|
|
DGAT1
|
diacylglycerol O-acyltransferase 1
|
|
chr22_+_19666508
|
1.450
|
NM_006767
|
LZTR1
|
leucine-zipper-like transcription regulator 1
|
|
chr2_-_74610346
|
1.448
|
|
AUP1
|
ancient ubiquitous protein 1
|
|
chr5_-_134397740
|
1.440
|
NM_002653
|
PITX1
|
paired-like homeodomain 1
|
|
chr19_-_47438563
|
1.433
|
NM_019884
|
GSK3A
|
glycogen synthase kinase 3 alpha
|
|
chr17_+_77574476
|
1.430
|
NM_144999
|
LRRC45
|
leucine rich repeat containing 45
|
|
chr16_+_2742606
|
1.423
|
|
SRRM2
|
serine/arginine repetitive matrix 2
|
|
chr2_+_74610494
|
1.414
|
|
HTRA2
|
HtrA serine peptidase 2
|
|
chr2_-_74610325
|
1.388
|
|
AUP1
|
ancient ubiquitous protein 1
|
|
chr2_+_38746742
|
1.371
|
|
GALM
|
galactose mutarotase (aldose 1-epimerase)
|
|
chr22_+_24468168
|
1.346
|
|
MYO18B
|
myosin XVIIIB
|
|
chr19_+_61344341
|
1.326
|
NM_018337
|
ZNF444
|
zinc finger protein 444
|
|
chr1_-_218168404
|
1.326
|
|
|
|
|
chr14_+_106009489
|
1.314
|
|
NCRNA00221
|
non-protein coding RNA 221
|
|
chr17_-_38204254
|
1.310
|
|
CCDC56
|
coiled-coil domain containing 56
|
|
chr7_+_149696901
|
1.309
|
|
REPIN1
|
replication initiator 1
|
|
chr2_-_74610481
|
1.308
|
NM_181575
|
AUP1
|
ancient ubiquitous protein 1
|
|
chr17_-_38204208
|
1.307
|
NM_001040431
|
CCDC56
|
coiled-coil domain containing 56
|
|
chr2_-_86186441
|
1.304
|
|
POLR1A
|
polymerase (RNA) I polypeptide A, 194kDa
|
|
chr11_+_64564948
|
1.303
|
NM_013299
|
SAC3D1
|
SAC3 domain containing 1
|
|
chr6_-_4949237
|
1.298
|
NM_006638
|
RPP40
|
ribonuclease P/MRP 40kDa subunit
|
|
chr20_-_62081752
|
1.298
|
|
SAMD10
|
sterile alpha motif domain containing 10
|
|
chr2_+_74610333
|
1.293
|
|
HTRA2
|
HtrA serine peptidase 2
|
|
chr6_+_4948995
|
1.292
|
|
LOC285778
|
hypothetical protein LOC285778
|
|
chr11_+_64564971
|
1.291
|
|
SAC3D1
|
SAC3 domain containing 1
|
|
chr1_-_218168137
|
1.289
|
|
SLC30A10
|
solute carrier family 30, member 10
|
|
chr1_-_1840564
|
1.276
|
NM_178545
|
TMEM52
|
transmembrane protein 52
|
|
chr17_-_35337288
|
1.273
|
NM_139280
|
ORMDL3
|
ORM1-like 3 (S. cerevisiae)
|
|
chr2_-_74610263
|
1.264
|
|
AUP1
|
ancient ubiquitous protein 1
|
|
chr20_-_61809753
|
1.248
|
NM_001134758
NM_003224
|
ARFRP1
|
ADP-ribosylation factor related protein 1
|
|
chr22_+_19078397
|
1.237
|
NM_003426
|
ZNF74
|
zinc finger protein 74
|
|
chr2_+_38746555
|
1.231
|
NM_138801
|
GALM
|
galactose mutarotase (aldose 1-epimerase)
|
|
chr20_-_61809648
|
1.228
|
|
ARFRP1
|
ADP-ribosylation factor related protein 1
|
|
chr20_-_48165886
|
1.218
|
NM_022442
NM_021988
NM_199144
|
UBE2V1
|
ubiquitin-conjugating enzyme E2 variant 1
|
|
chr9_-_116305273
|
1.210
|
NM_001083885
|
DFNB31
|
deafness, autosomal recessive 31
|
|
chr14_-_22468393
|
1.205
|
|
PRMT5
|
protein arginine methyltransferase 5
|
|
chr16_+_2742635
|
1.191
|
|
SRRM2
|
serine/arginine repetitive matrix 2
|
|
chr1_-_10455100
|
1.189
|
|
DFFA
|
DNA fragmentation factor, 45kDa, alpha polypeptide
|
|
chr20_-_47238082
|
1.178
|
|
STAU1
|
staufen, RNA binding protein, homolog 1 (Drosophila)
|
|
chr19_+_59310601
|
1.168
|
NM_015629
|
PRPF31
|
PRP31 pre-mRNA processing factor 31 homolog (S. cerevisiae)
|
|
chr19_+_12778391
|
1.159
|
|
RNASEH2A
|
ribonuclease H2, subunit A
|
|
chr1_-_10455190
|
1.156
|
NM_004401
NM_213566
|
DFFA
|
DNA fragmentation factor, 45kDa, alpha polypeptide
|
|
chr16_+_2742641
|
1.155
|
|
SRRM2
|
serine/arginine repetitive matrix 2
|
|
chr16_+_2742653
|
1.155
|
|
SRRM2
|
serine/arginine repetitive matrix 2
|
|
chr10_+_74540215
|
1.145
|
NM_015901
|
NUDT13
|
nudix (nucleoside diphosphate linked moiety X)-type motif 13
|
|
chrX_+_37429927
|
1.138
|
NM_021083
|
XK
|
X-linked Kx blood group (McLeod syndrome)
|
|
chr14_-_23095240
|
1.131
|
|
|
|
|
chr19_-_47438384
|
1.127
|
|
GSK3A
|
glycogen synthase kinase 3 alpha
|
|
chr20_+_61760084
|
1.126
|
NM_016434
NM_032957
|
RTEL1
|
regulator of telomere elongation helicase 1
|
|
chr19_+_4742756
|
1.125
|
|
FEM1A
|
fem-1 homolog a (C. elegans)
|
|
chr11_-_65070625
|
1.117
|
|
LTBP3
|
latent transforming growth factor beta binding protein 3
|
|
chr14_-_22468445
|
1.116
|
NM_001039619
NM_006109
|
PRMT5
|
protein arginine methyltransferase 5
|
|
chr12_+_54784632
|
1.113
|
|
PA2G4
|
proliferation-associated 2G4, 38kDa
|
|
chr16_+_2742657
|
1.113
|
|
SRRM2
|
serine/arginine repetitive matrix 2
|
|
chr2_+_74610635
|
1.109
|
|
HTRA2
|
HtrA serine peptidase 2
|
|
chr8_-_144770764
|
1.108
|
|
TSTA3
|
tissue specific transplantation antigen P35B
|
|
chr8_-_41774296
|
1.107
|
NM_000037
NM_020475
NM_020476
NM_020477
|
ANK1
|
ankyrin 1, erythrocytic
|
|
chr15_-_62173041
|
1.106
|
NM_001014812
NM_032231
|
FAM96A
|
family with sequence similarity 96, member A
|
|
chr19_-_4131778
|
1.104
|
|
SIRT6
|
sirtuin 6
|
|
chr10_-_69267774
|
1.104
|
NM_021800
NM_201262
|
DNAJC12
|
DnaJ (Hsp40) homolog, subfamily C, member 12
|
|
chr17_-_71352182
|
1.101
|
NM_199242
|
UNC13D
|
unc-13 homolog D (C. elegans)
|
|
chr19_+_54160468
|
1.100
|
|
FTL
|
ferritin, light polypeptide
|
|
chr16_+_2742674
|
1.099
|
|
SRRM2
|
serine/arginine repetitive matrix 2
|
|
chr12_+_54784614
|
1.098
|
|
PA2G4
|
proliferation-associated 2G4, 38kDa
|
|
chr5_+_85949518
|
1.097
|
NM_001867
|
COX7C
|
cytochrome c oxidase subunit VIIc
|
|
chr16_+_2742684
|
1.087
|
|
SRRM2
|
serine/arginine repetitive matrix 2
|
|
chr20_+_61809765
|
1.087
|
NM_001195653
NM_001195654
NM_032527
NM_181485
|
ZGPAT
|
zinc finger, CCCH-type with G patch domain
|
|
chr6_-_107542328
|
1.085
|
NM_001080450
|
BEND3
|
BEN domain containing 3
|
|
chr16_+_23597692
|
1.085
|
NM_005030
|
PLK1
|
polo-like kinase 1
|
|
chr16_-_1933190
|
1.082
|
|
SEPX1
|
selenoprotein X, 1
|
|
chr11_-_63690069
|
1.079
|
NM_014067
|
MACROD1
|
MACRO domain containing 1
|
|
chr12_+_54784681
|
1.077
|
|
PA2G4
|
proliferation-associated 2G4, 38kDa
|
|
chr8_-_144770859
|
1.073
|
NM_003313
|
TSTA3
|
tissue specific transplantation antigen P35B
|
|
chr8_-_144770838
|
1.064
|
|
TSTA3
|
tissue specific transplantation antigen P35B
|
|
chr16_+_23597691
|
1.063
|
|
PLK1
|
polo-like kinase 1
|
|
chr8_+_30721208
|
1.062
|
NM_005671
|
UBXN8
|
UBX domain protein 8
|
|
chr16_+_23597735
|
1.060
|
|
PLK1
|
polo-like kinase 1
|
|
chr16_+_2742704
|
1.054
|
|
SRRM2
|
serine/arginine repetitive matrix 2
|
|
chr19_+_3136927
|
1.053
|
|
NCLN
|
nicalin
|
|
chr16_+_2742709
|
1.046
|
|
SRRM2
|
serine/arginine repetitive matrix 2
|
|
chr16_-_1933209
|
1.045
|
|
SEPX1
|
selenoprotein X, 1
|
|
chr12_+_38306238
|
1.042
|
NM_001031748
|
C12orf40
|
chromosome 12 open reading frame 40
|
|
chr19_+_3136860
|
1.037
|
NM_020170
|
NCLN
|
nicalin
|
|
chr13_-_40666392
|
1.036
|
|
KBTBD7
|
kelch repeat and BTB (POZ) domain containing 7
|
|
chr14_+_23095028
|
1.035
|
NM_001126339
NM_024328
|
THTPA
|
thiamine triphosphatase
|
|
chr16_+_23597713
|
1.032
|
|
PLK1
|
polo-like kinase 1
|
|
chr12_-_47532171
|
1.031
|
NM_004818
|
DDX23
|
DEAD (Asp-Glu-Ala-Asp) box polypeptide 23
|
|
chr16_+_2807228
|
1.029
|
|
PRSS21
|
protease, serine, 21 (testisin)
|
|
chr20_+_30259360
|
1.029
|
|
POFUT1
|
protein O-fucosyltransferase 1
|
|
chr19_+_55045754
|
1.027
|
|
PTOV1
|
prostate tumor overexpressed 1
|
|
chr8_+_144870482
|
1.021
|
NM_139021
|
MAPK15
|
mitogen-activated protein kinase 15
|
|
chr7_+_73709943
|
1.021
|
NM_001163636
NM_001518
NM_032999
NM_033000
NM_033001
|
GTF2I
|
general transcription factor IIi
|
|
chr16_-_1933268
|
1.019
|
NM_016332
|
SEPX1
|
selenoprotein X, 1
|
|
chr12_+_54784591
|
1.014
|
|
PA2G4
|
proliferation-associated 2G4, 38kDa
|
|
chr7_+_73709974
|
1.012
|
|
GTF2I
|
general transcription factor IIi
|
|
chr22_+_24468110
|
1.010
|
NM_032608
|
MYO18B
|
myosin XVIIIB
|
|
chr2_+_130703384
|
1.010
|
|
|
|
|
chr16_+_23597661
|
1.009
|
|
PLK1
|
polo-like kinase 1
|
|
chr9_-_139068269
|
1.003
|
NM_001246
NM_203468
|
ENTPD2
|
ectonucleoside triphosphate diphosphohydrolase 2
|
|
chr16_+_66433882
|
0.998
|
|
THAP11
|
THAP domain containing 11
|
|
chr12_+_54784625
|
0.994
|
|
PA2G4
|
proliferation-associated 2G4, 38kDa
|
|
chr16_+_2742677
|
0.985
|
|
SRRM2
|
serine/arginine repetitive matrix 2
|
|
chr5_-_134397470
|
0.980
|
|
PITX1
|
paired-like homeodomain 1
|
|
chr17_+_38204335
|
0.978
|
NM_173478
|
CNTD1
|
cyclin N-terminal domain containing 1
|
|
chr20_+_30259359
|
0.977
|
|
POFUT1
|
protein O-fucosyltransferase 1
|
|
chr17_+_69939806
|
0.969
|
|
GPRC5C
|
G protein-coupled receptor, family C, group 5, member C
|
|
chr7_+_73709991
|
0.967
|
|
GTF2I
|
general transcription factor IIi
|
|
chr6_+_53037754
|
0.964
|
NM_033481
|
FBXO9
|
F-box protein 9
|
|
chr2_+_218896102
|
0.958
|
NM_022572
|
PNKD
|
paroxysmal nonkinesigenic dyskinesia
|
|
chr17_-_36938111
|
0.958
|
NM_002276
|
KRT19
|
keratin 19
|
|
chr13_-_40666533
|
0.957
|
NM_032138
|
KBTBD7
|
kelch repeat and BTB (POZ) domain containing 7
|
|
chr22_+_21852699
|
0.956
|
|
BCR
|
breakpoint cluster region
|
|
chr20_+_30259235
|
0.952
|
NM_015352
NM_172236
|
POFUT1
|
protein O-fucosyltransferase 1
|
|
chr15_+_38843535
|
0.946
|
NM_005258
|
GCHFR
|
GTP cyclohydrolase I feedback regulator
|
|
chr17_-_36938025
|
0.942
|
|
KRT19
|
keratin 19
|
|
chr1_+_246087230
|
0.939
|
|
TRIM58
|
tripartite motif containing 58
|
|
chr10_-_13430195
|
0.935
|
NM_001195602
NM_001195604
NM_012247
|
SEPHS1
|
selenophosphate synthetase 1
|
|
chr3_-_15081705
|
0.934
|
|
MRPS25
|
mitochondrial ribosomal protein S25
|
|
chr1_-_54076521
|
0.929
|
|
TMEM48
|
transmembrane protein 48
|
|
chr2_+_74610624
|
0.928
|
|
HTRA2
|
HtrA serine peptidase 2
|
|
chr14_-_23090606
|
0.927
|
NM_033400
|
ZFHX2
|
zinc finger homeobox 2
|
|
chr2_+_74610039
|
0.920
|
NM_013247
NM_145074
|
HTRA2
|
HtrA serine peptidase 2
|
|
chr16_-_4605003
|
0.917
|
|
FAM100A
|
family with sequence similarity 100, member A
|
|
chr3_+_140148765
|
0.910
|
NM_001040061
|
C3orf72
|
chromosome 3 open reading frame 72
|
|
chr17_-_3814334
|
0.908
|
NM_005173
NM_174953
NM_174954
NM_174955
NM_174956
NM_174957
NM_174958
|
ATP2A3
|
ATPase, Ca++ transporting, ubiquitous
|
|
chr8_-_145612636
|
0.905
|
NM_017767
|
SLC39A4
|
solute carrier family 39 (zinc transporter), member 4
|
|
chr19_-_1441403
|
0.905
|
NM_017573
|
PCSK4
|
proprotein convertase subtilisin/kexin type 4
|
|
chr20_+_337346
|
0.904
|
|
RBCK1
|
RanBP-type and C3HC4-type zinc finger containing 1
|
|
chr2_+_218896219
|
0.904
|
|
PNKD
|
paroxysmal nonkinesigenic dyskinesia
|
|
chr12_+_54784600
|
0.899
|
|
PA2G4
|
proliferation-associated 2G4, 38kDa
|
|
chr17_+_37694007
|
0.895
|
|
STAT5A
|
signal transducer and activator of transcription 5A
|
|
chr19_-_41955493
|
0.892
|
NM_001193552
|
ZNF850
|
zinc finger protein 850
|
|
chr19_+_55627971
|
0.885
|
NM_004533
|
MYBPC2
|
myosin binding protein C, fast type
|
|
chr12_+_56168120
|
0.885
|
|
MARS
|
methionyl-tRNA synthetase
|
|
chr19_+_4742727
|
0.884
|
NM_018708
|
FEM1A
|
fem-1 homolog a (C. elegans)
|
|
chr8_+_67742348
|
0.882
|
|
C8orf44
|
chromosome 8 open reading frame 44
|
|
chr9_-_125732005
|
0.880
|
NM_020946
NM_024820
|
DENND1A
|
DENN/MADD domain containing 1A
|