Motif page
For each motif we provide a separate page with extensive information:
activity profile and Z-values across conditions, list of regulator
targets, first level regulatory network with other regulators,
activity-expression correlation of a motif, gene category enrichment
with regulator targets, etc.
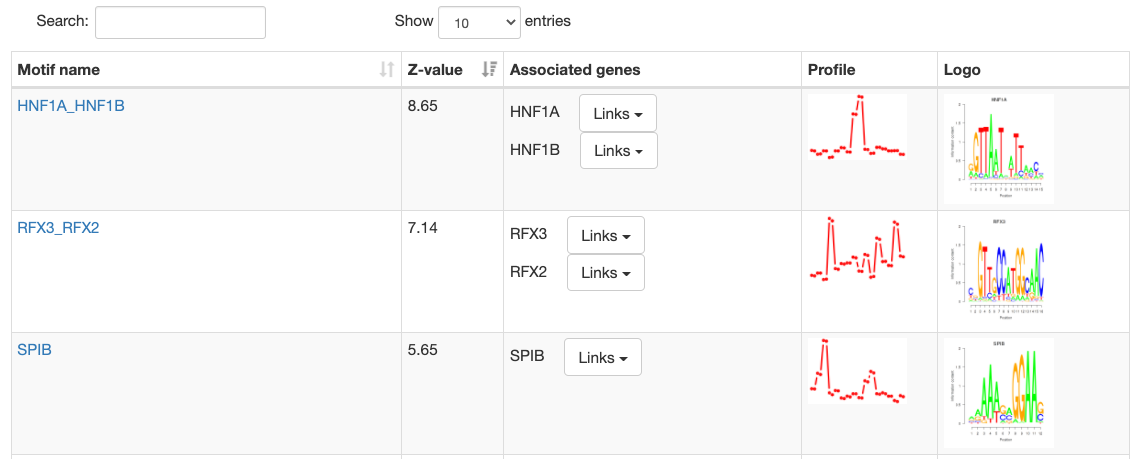
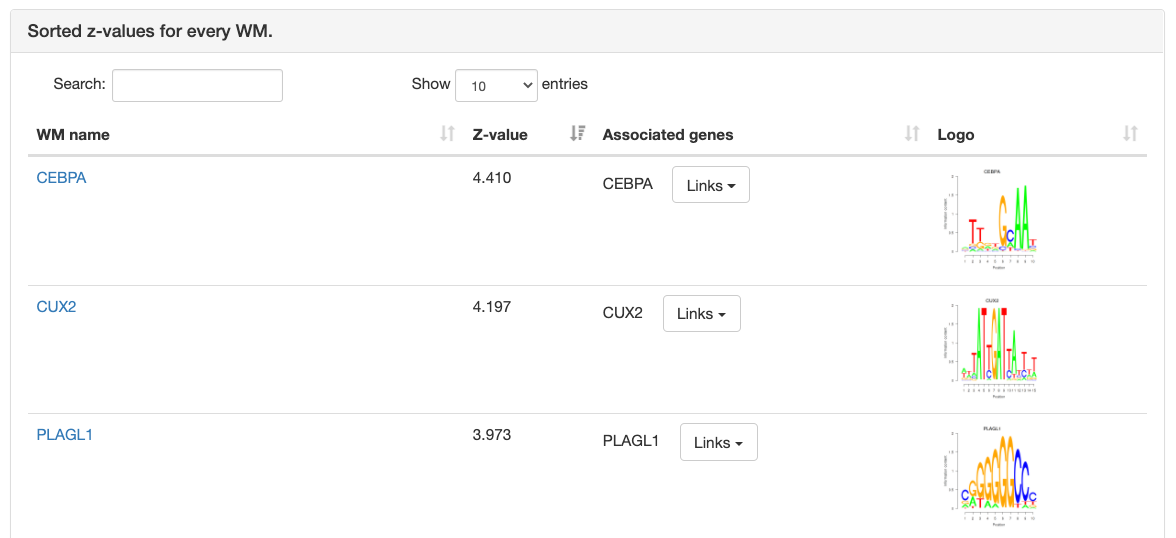
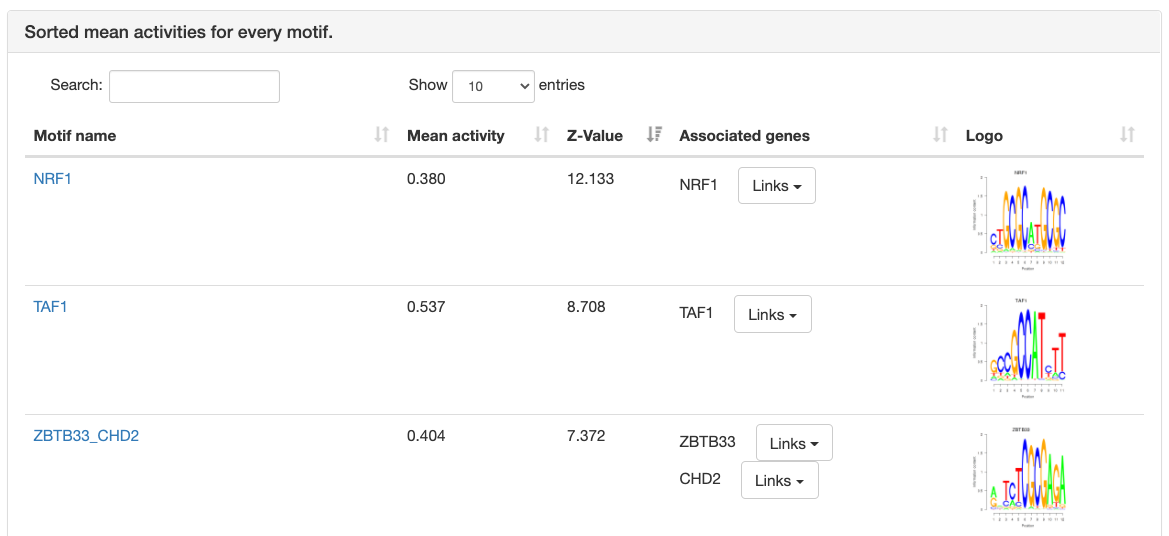
Motif information
At the top of the page, the motif's name, Z-value, and its sequence
logo are shown. For grouped motifs all logos in a group are shown.
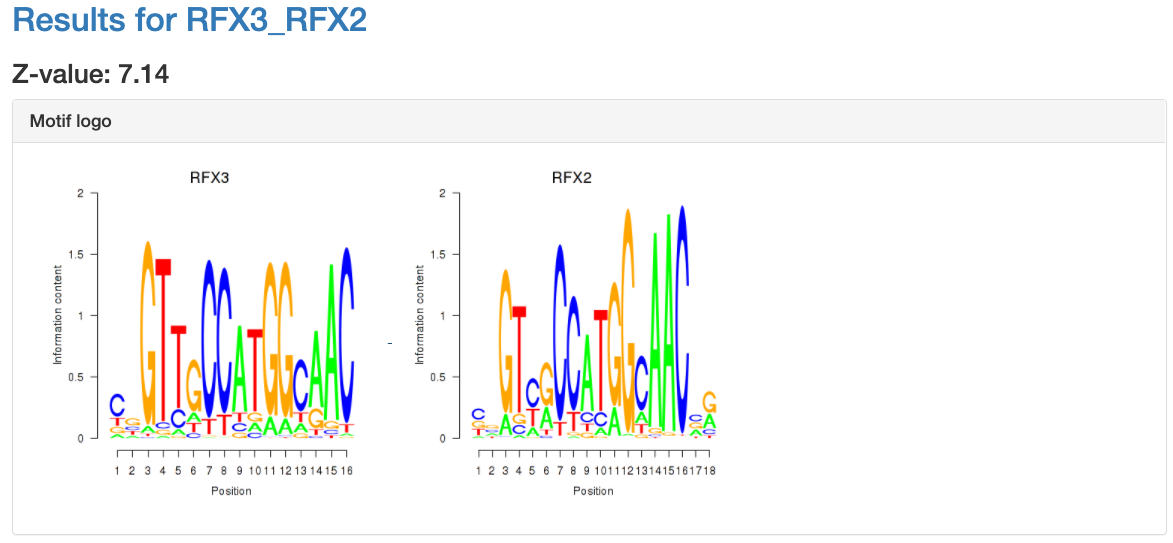
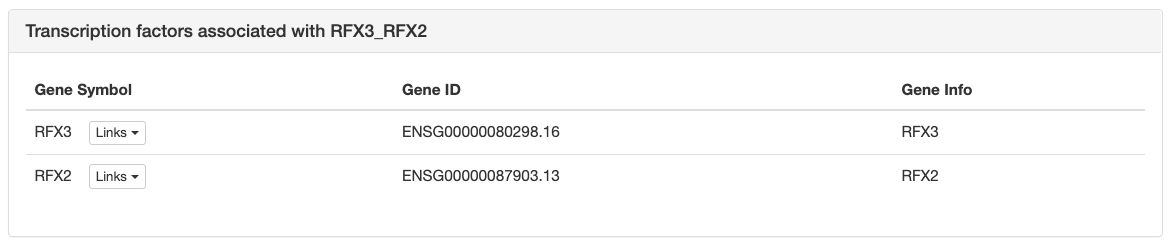
Next is a list with all transcription factor
genes thought to bind to the sites of the motif, each with links to
corresponding pages in multiple databses like NCBI, ENsembl, etc.
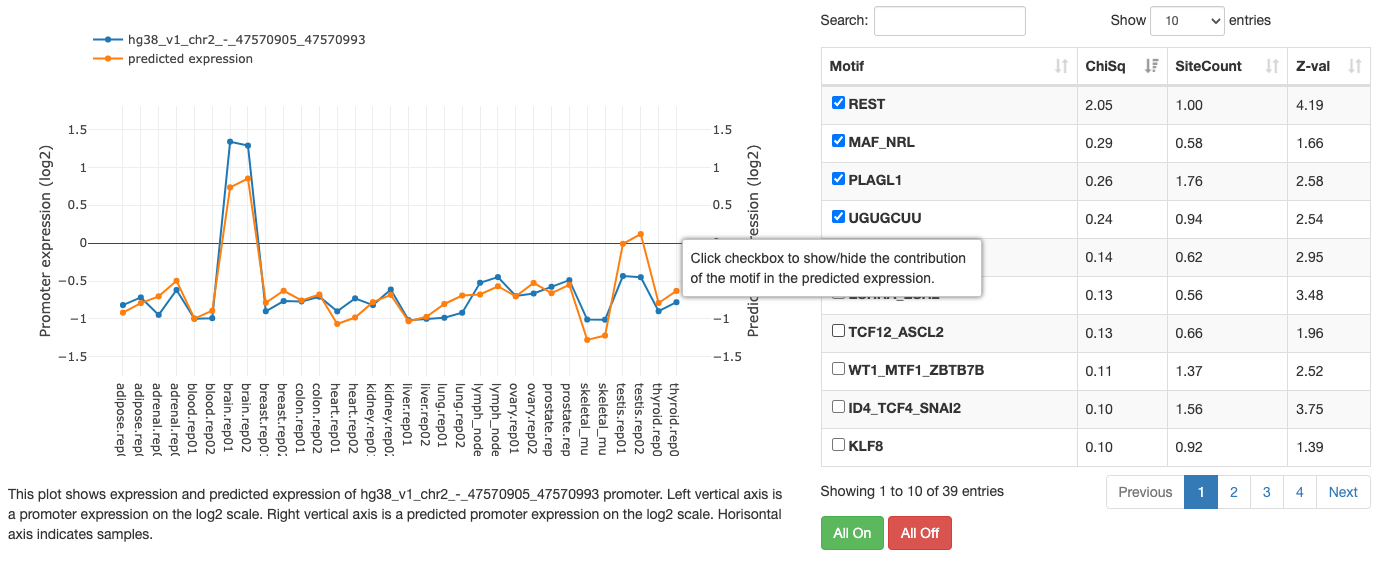
Activity-expression correlation
For many regulatory motifs incorporated into the ISMARA analysis there is more
than one TF that can potentially bind to sites for the motif. To help
determine which TFs are most likely involved in the activity of a
given motif in the dataset in question, ISMARA provides simple
correlation analysis between TF gene expression and activity of
associated motif.
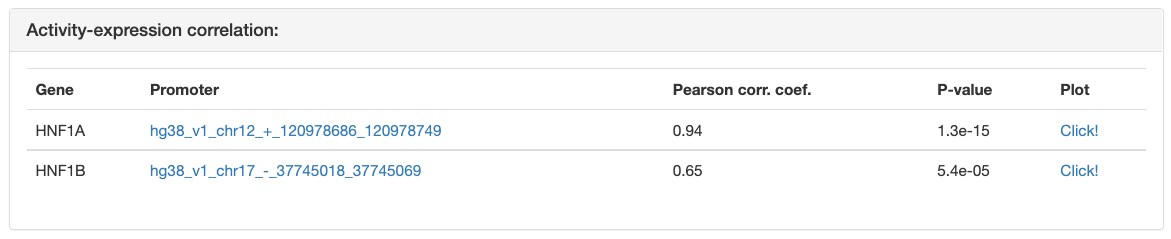
The "Activity-expression correlation" table shows the Pearson correlation
between the motif’s activity profile and the mRNA expression profiles of each
of the TFs that can bind to the sites of the motif. The TFs in the list are
sorted by the p-value of the correlation. For each of the correlations a link
is also provided to a simple scatter plot showing the mRNA expression levels
and motif activities across the samples. You can preview the plot by
mouseover of the "Click!" link or see a high resolution image by clicking the
link. Transcription factor could have multiple promoters. In the table
only one propmoter with best correlation cefficient is shown.
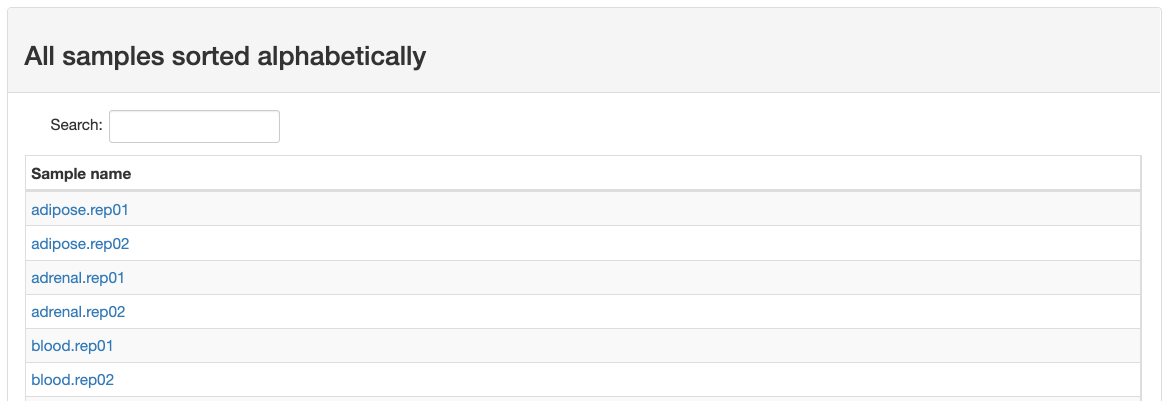
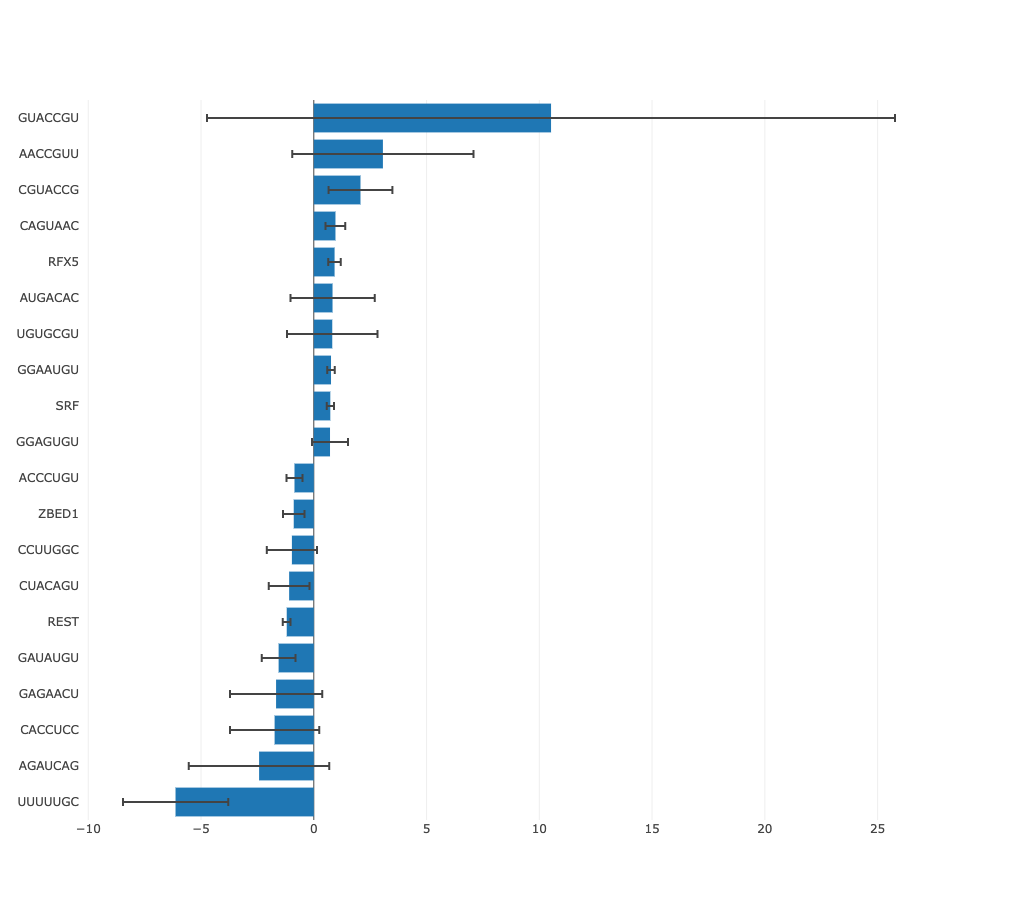
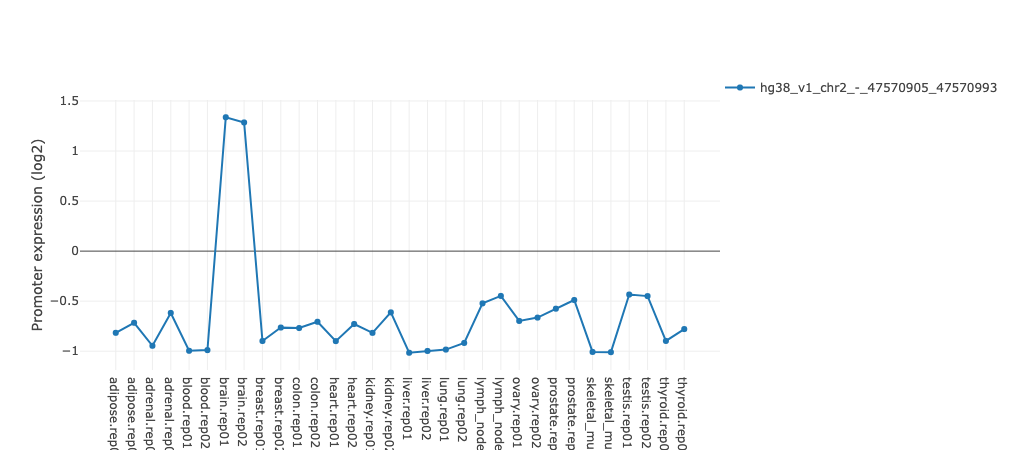
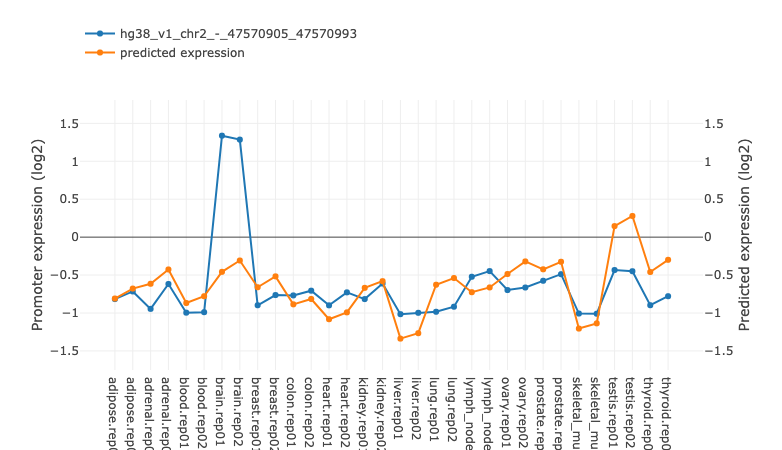
Regulatory motif activity profile
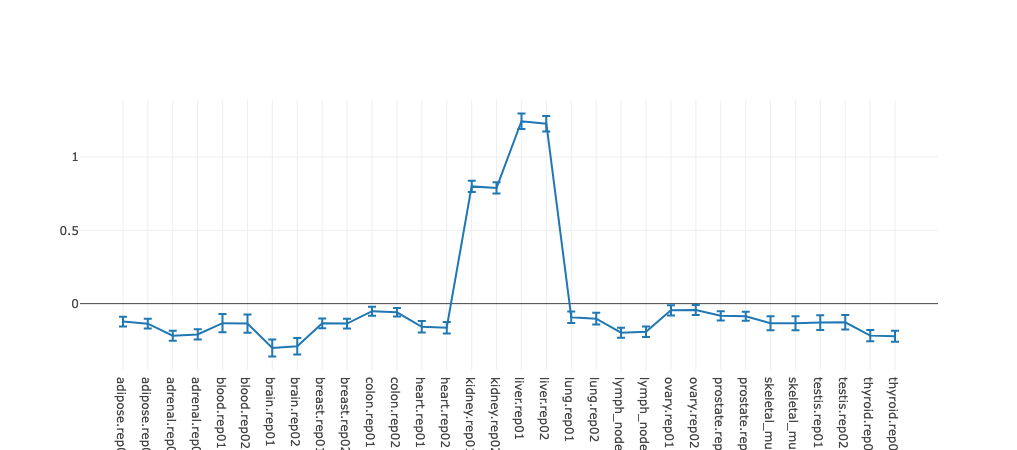
This figure shows the inferred activities of the regulatory motif (including
error bars) across all samples, where the samples are ordered alphanumerically. The
order of the samples in this graph is thus determined by the naming of the
files provided by the user and this can be used to ensure the samples are
ordered in an appropriate way (e.g. if samples come from a time course,
numbering the samples by time will result in the graph showing motif activity
across time).
The activity profile illustrates how expression of the regulatory
motif targets is changing on average across conditions. For example in the
plot underneath targets of
HNF1A
and
HNF1B
transcription factors you can see that on average target expression of these regulators
is increased in kidney and liver in comparison with other tissues.
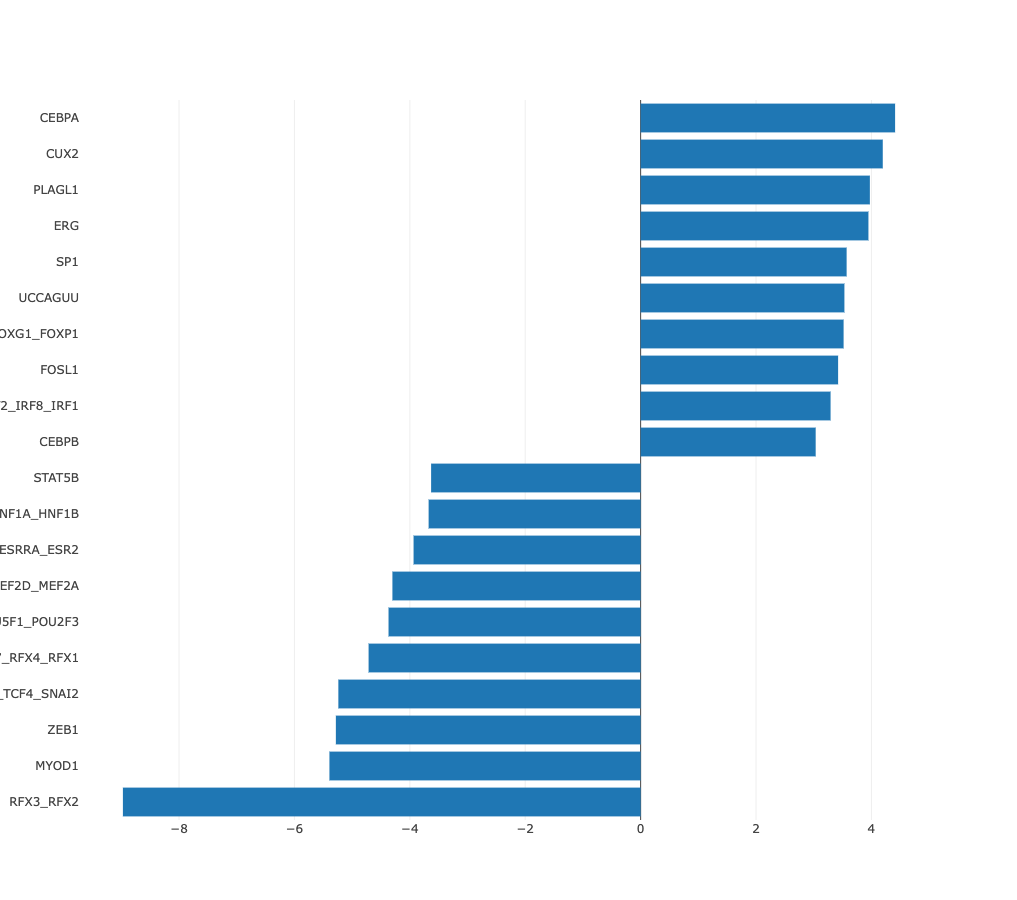
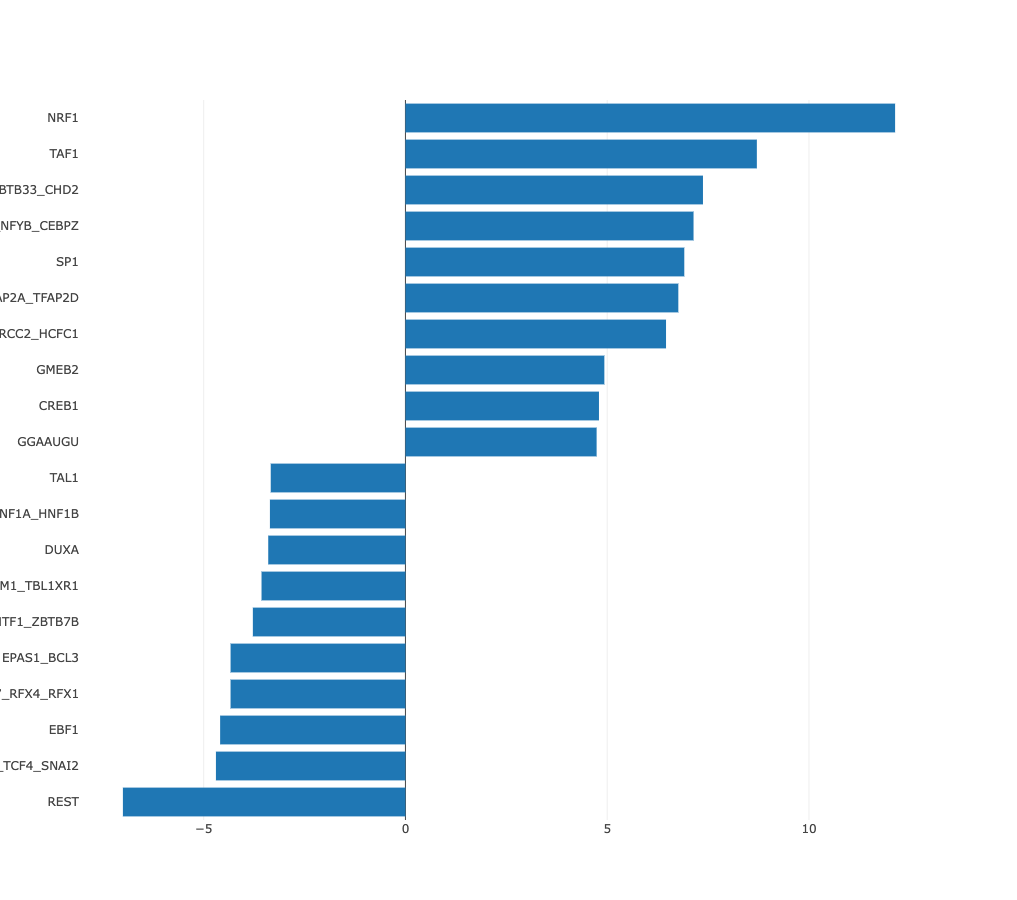
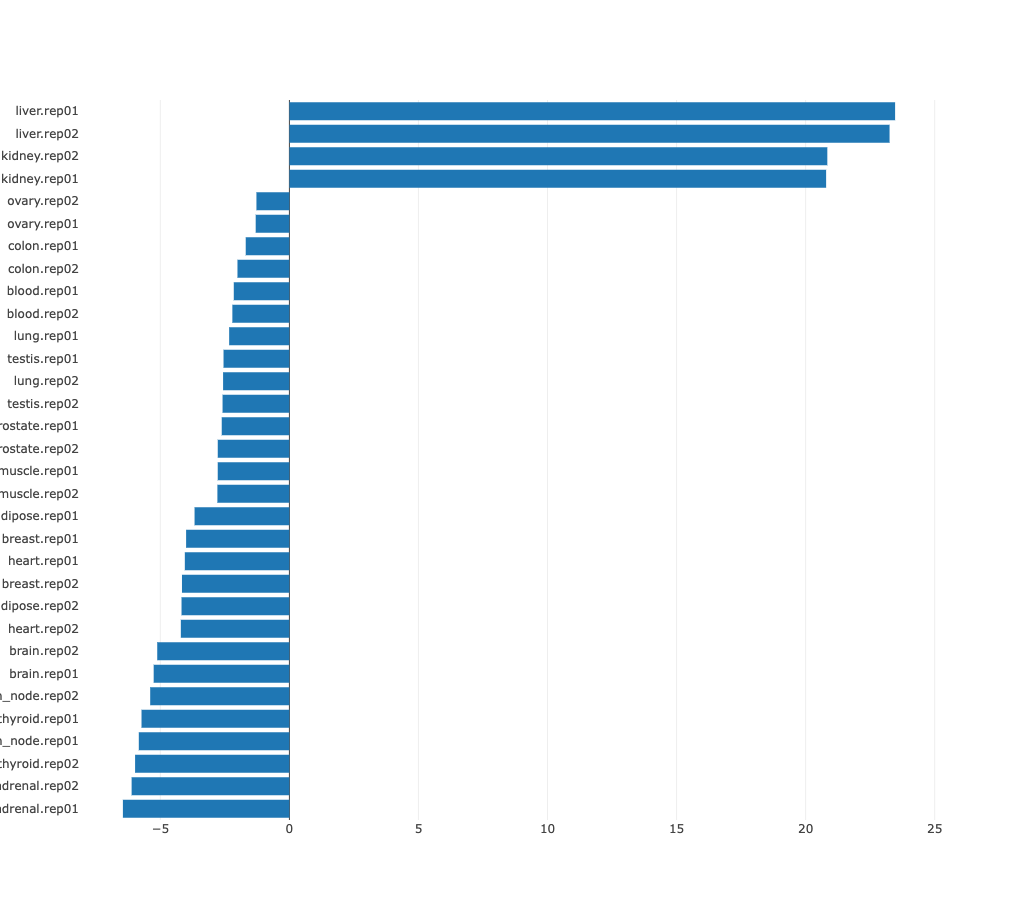
Z-values bar chart
In many cases there may be no preferred natural ordering of the
samples. In those cases it is more natural to present the regulatory motif
activities with samples sorted from those in which the motif is most
significantly upregulated, to those where it is most significantly
downregulated. ISMARA provides such a list of motif z-values, with
samples sorted from largest to smallest z-value. For example, from the
bar chart of sorted HNF1A_HNF1B activities, the cell types in which HNF1A_HNF1B
activity is highly upregulated or highly downregulated can be seen at
a glance.
Protein-protein interaction network of a regulatory motif
targets according to the STRING database
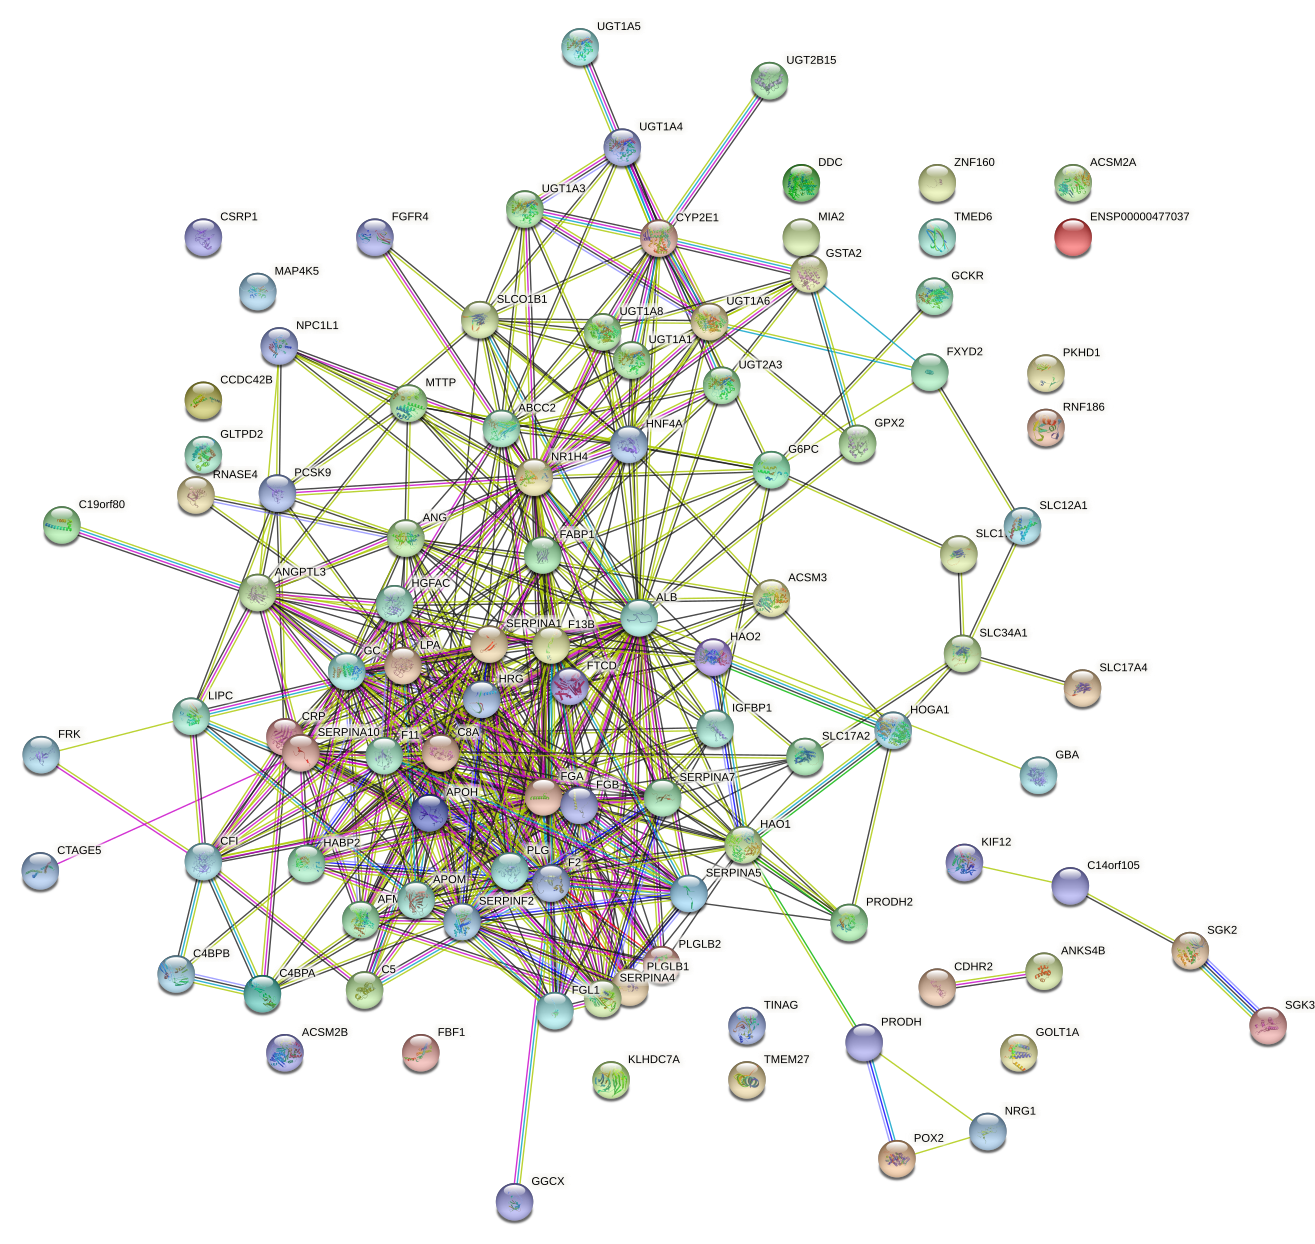
It is always desirable to gain some intuition of the pathways and
particular biological processes that are targeted by a particular regulatory motif. One
way of visualizing the functional structure of the predicted targets of a
motif, is to represent these as a network, with links between pairs of genes
that are known to be functionally related. The STRING database maintains a curated
collection of functional links between proteins, where "functional link" can
range from direct physical interaction, to over-representation of the protein
pair within abstracts of scientific articles. ISMARA provides, for each
motif, a STRING network picture of the set of predicted targets of the motif
(for visibility at most the top 100 targets are shown). The network picture is linked to the STRING interactive page for this particular network with
more information and functions. For the example of the targets of the HNF1A_HNF1B
motif shown here, we see a highly connected cluster of genes that are
belong to various metabolic processes, transport and stress response.
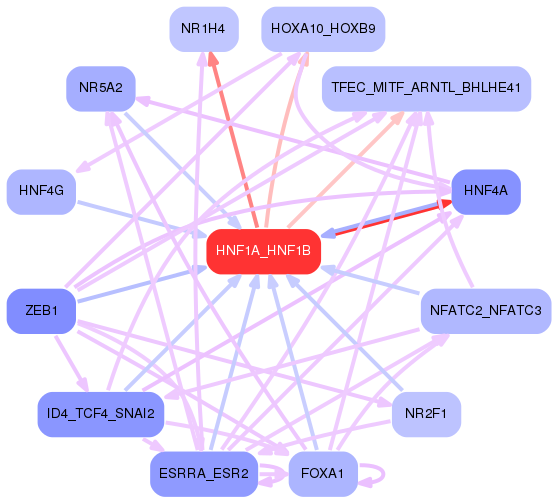
First level regulatory network
One of our aims is to understand the causal structure of the transcription
regulatory network, and a first step in that direction is the prediction of
direct regulatory interactions between the regulatory motifs. For each motif, we check
its list of predicted targets for promoters of transcription factors that are associated with
other regulatory motifs. Using this we build a regulatory network where nodes correspond
to motifs and a directed edge from motif m to motif m′ occurs whenever a
promoter of at least one of the transcription factor associated with motif m′ is a predicted
target of motif m. On the results page for a given motif, we show only part
of the interaction network centered around the motif. This network picture
provides some level of interactivity. The user can hide/show edges using the
+/- buttons or by moving slider at the left of the picture. Placing the mouse
cursor over a motif node displays its corresponding Z-value. Placing the
mouse cursor over an edge displays a the names of the target genes involved
in the edge, as well as the associated target scores. The latter are
log-likelihood ratios of the model including and excluding the particular
target edge. The edge color indicates the type of the edge: red for edges
from the central motif to another motif, blue for a motif regulating
the central motif, and violet for interactions between the other motifs. The
edge color intensity is proportional to the target score, i.e. more intense
means higher score.
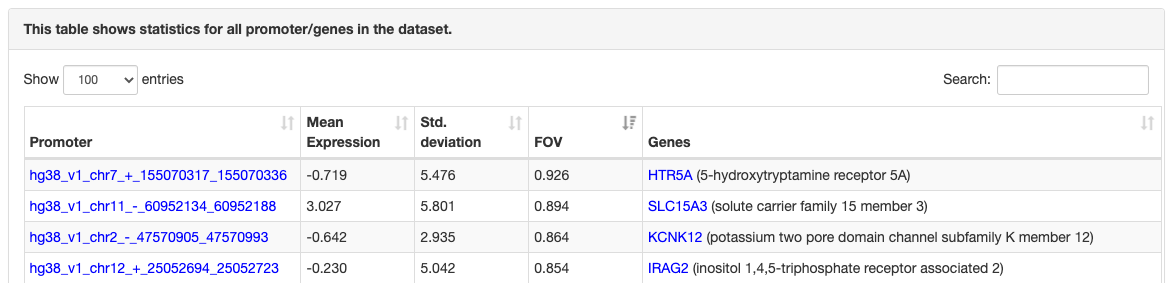
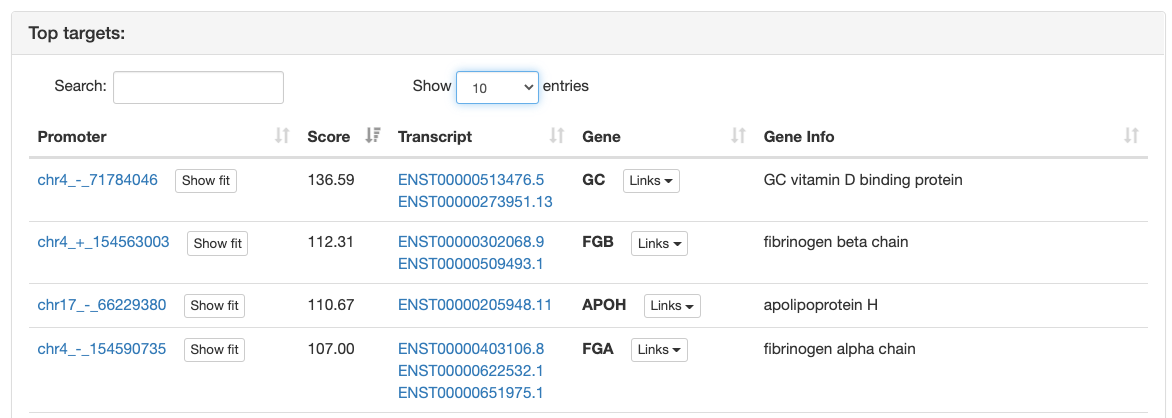
Regulatory motif top targets
ISMARA provides a list of the top 200 target promoters for the motif sorted by
their
target score.
In addition, every promoter is annotated with information
about transcripts and genes which are associated with the promoter. Like the
motif list on the main page this table is interactive allowing quick search
through the table and sorting by any column. By default the table shows only
the top 10 targets but the user can interactively change the number of
targets shown. The promoters are linked to
SwissRegulon database
.
In this database
the user is provided with a graphical representation of a one kilobase region
around the corresponding promoter, displaying TF binding sites, transcripts,
and other genomic features.
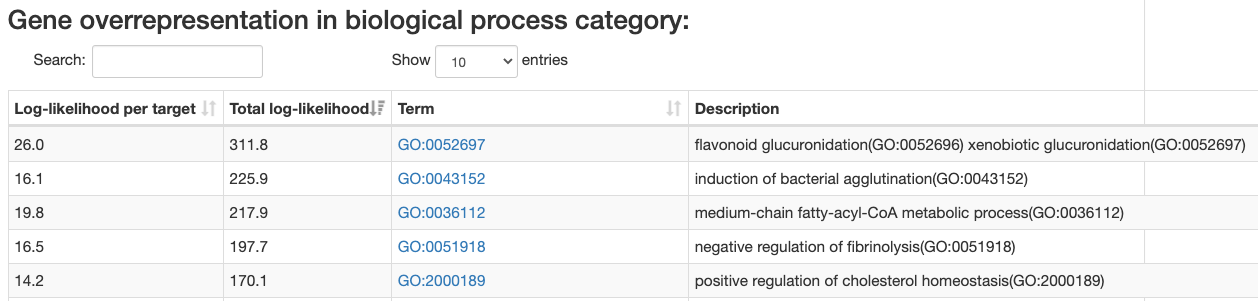
Gene category enrichment analysis
ISMARA also provides a list of
Gene Ontology categories
and two sets of categories from
MSIG database
that are
enriched among the predicted targets of a regulatory motif. Lists are provided
for the "biological process", "cellular component", and "molecular
function", "canonical pathways" and "reactome pathways" category sets.
Enrichment calculated as:
-
Total log-likelihood - sum of log-likelihood scores of all
regulatory motif targets in the given category.
-
Log-likelihood per target - total log-likelihood devided by a number
of genes in the category.
By defaul categories are sorted by the total log-likelihood. This type
of sorting usually bring to the top general categories. You can also sort
the table by log-likelihood per target, which brings up more specific gene categories.
Like the motif index table the GOA table also provides quick search through the table.