Project
GSE58827: Dynamics of the Mouse Liver
Navigation
Downloads
Sample name: Day_60_rep3
Sorted Z-values for Day_60_rep3
| WM name | Z-value | Associated genes | Logo |
|---|---|---|---|
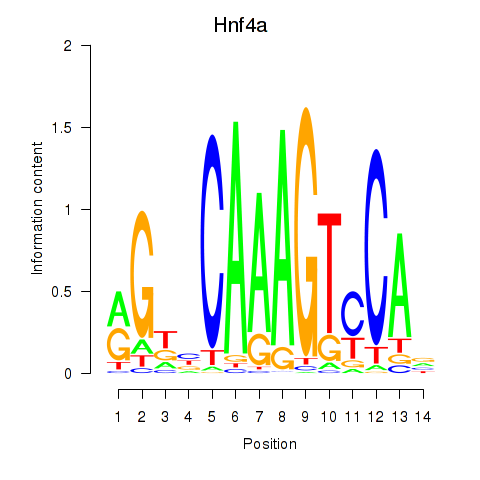
| Hnf4a | 7.310 |
|
|
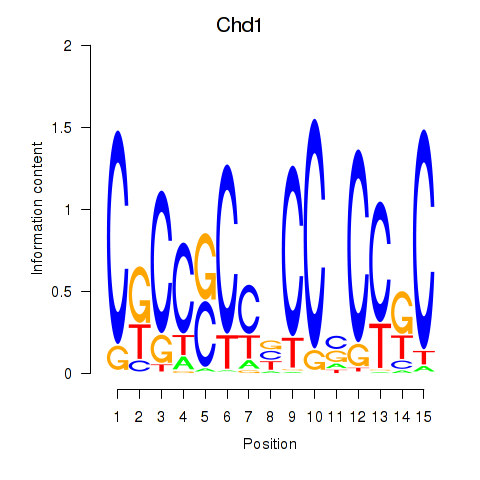
| Chd1_Pml | 6.063 |
|
|
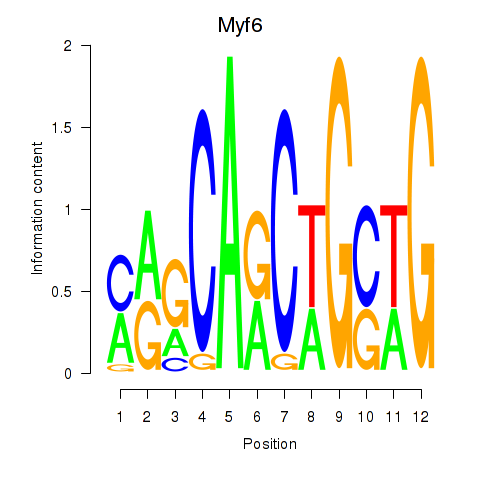
| Myf6 | 5.982 |
|
|
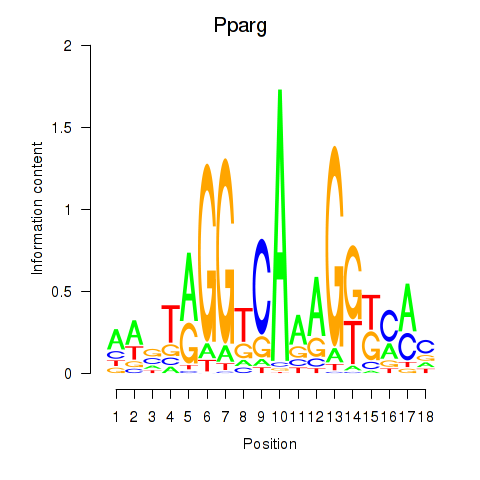
| Pparg_Rxrg | 5.665 |
|
|
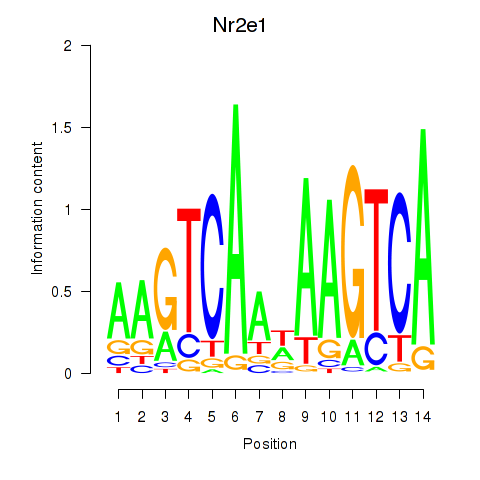
| Nr2e1 | 5.608 |
|
|
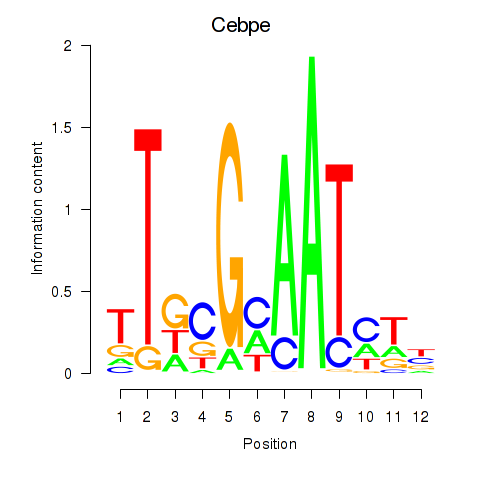
| Cebpe | 4.644 |
|
|
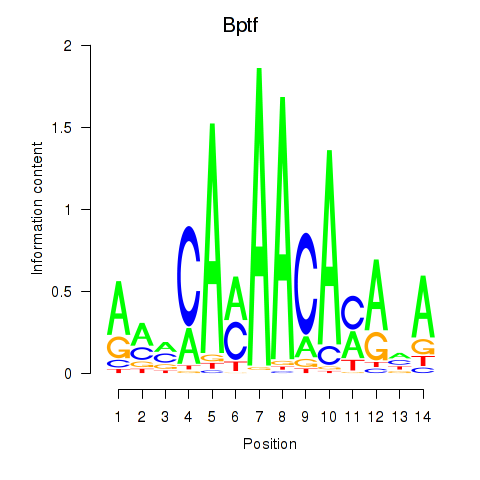
| Bptf | 4.211 |
|
|
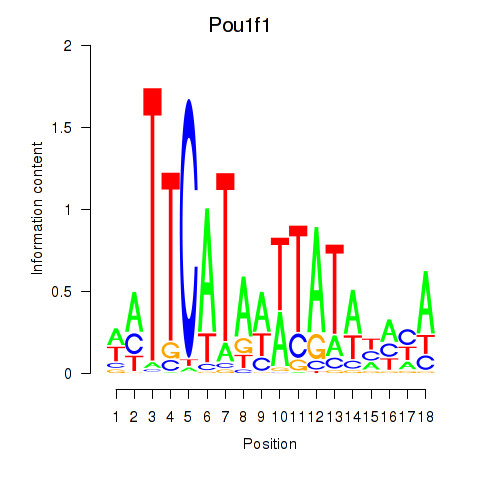
| Pou1f1 | 3.968 |
|
|
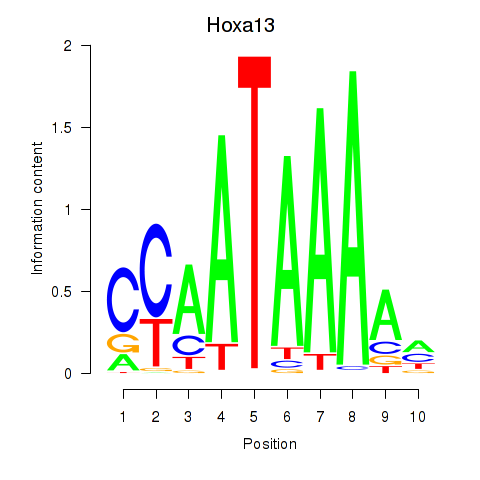
| Hoxa13 | 3.843 |
|
|
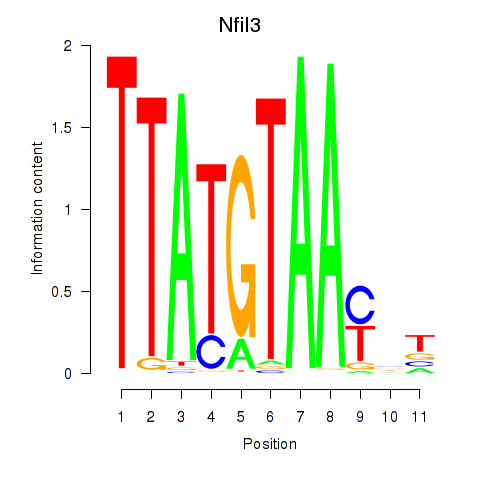
| Nfil3_Tef | 3.747 |
|
|
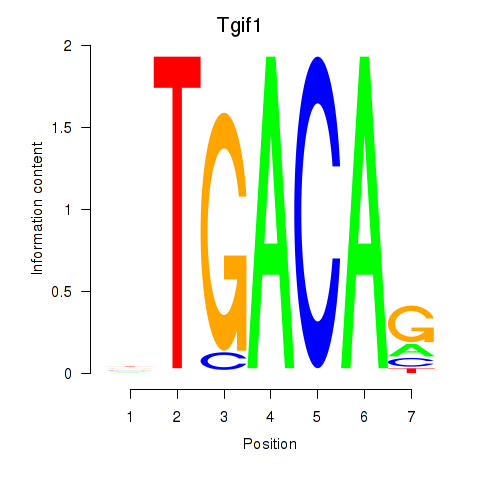
| Tgif1_Meis3 | 3.732 |
|
|
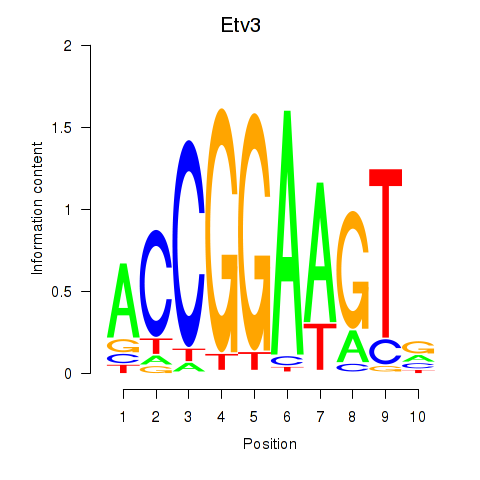
| Etv3_Erf_Fev_Elk4_Elk1_Elk3 | 3.510 |
|
|
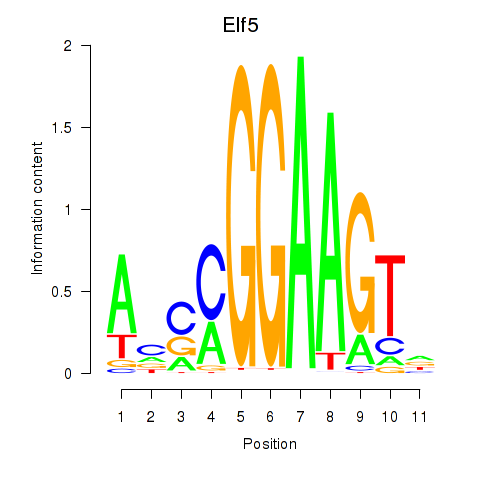
| Elf5 | 3.191 |
|
|
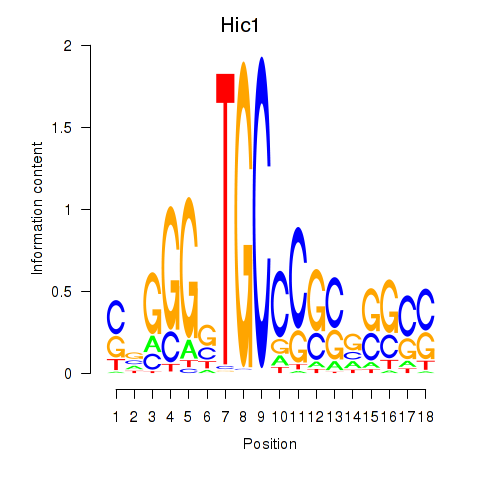
| Hic1 | 2.907 |
|
|
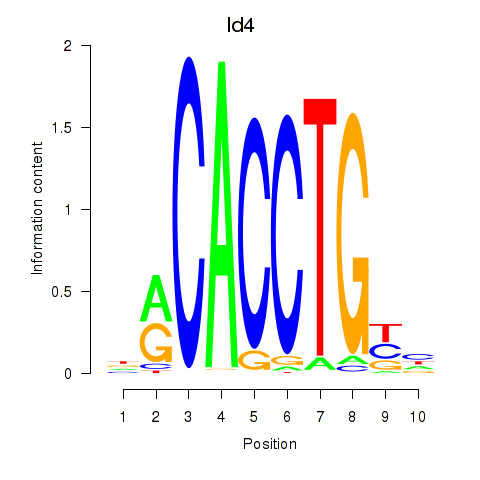
| Id4 | 2.842 |
|
|
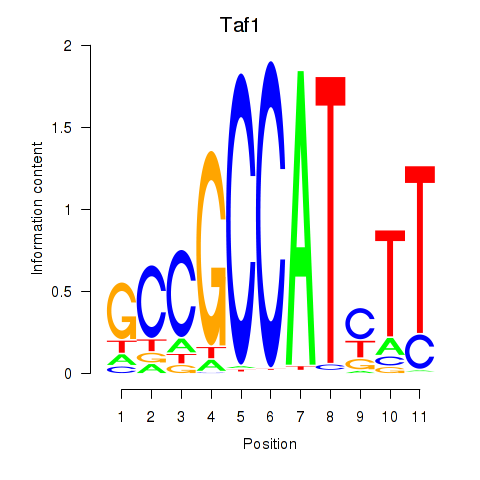
| Taf1 | 2.769 |
|
|
| Hoxb7 | 2.731 |
|

|
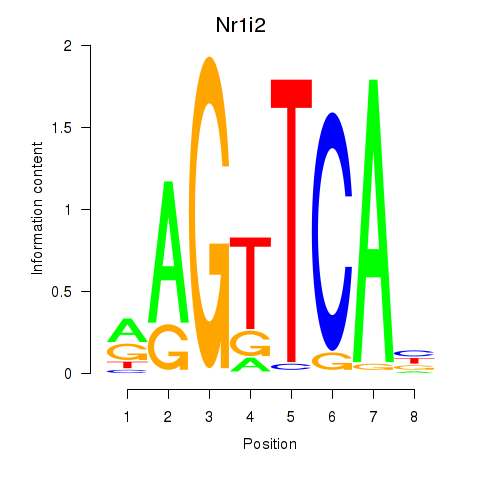
| Nr1i2 | 2.422 |
|
|
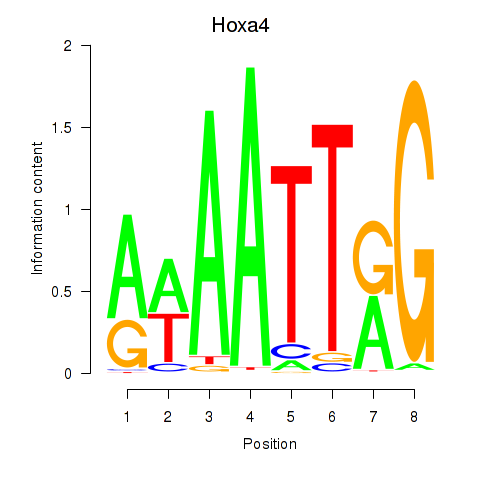
| Hoxa4 | 2.391 |
|
|
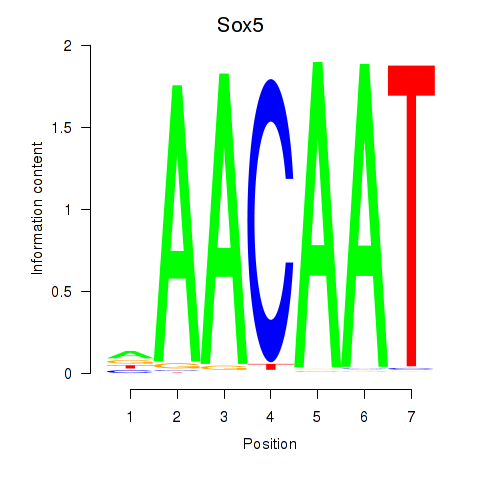
| Sox5_Sry | 2.373 |
|
|
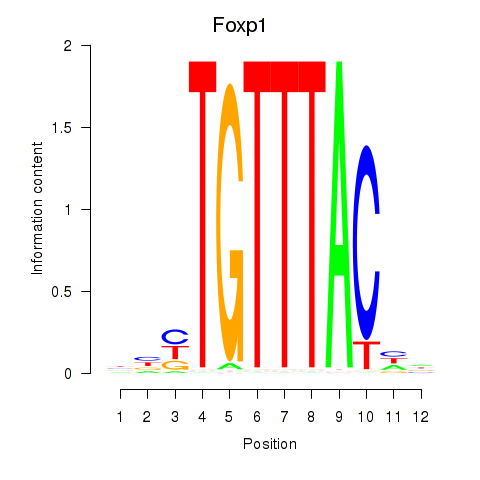
| Foxp1_Foxj2 | 2.357 |
|
|
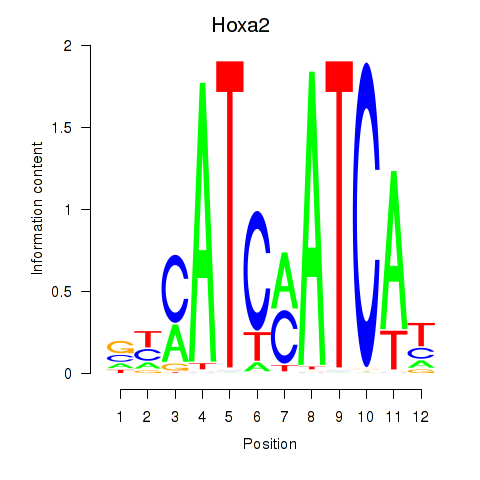
| Hoxa2 | 2.335 |
|
|
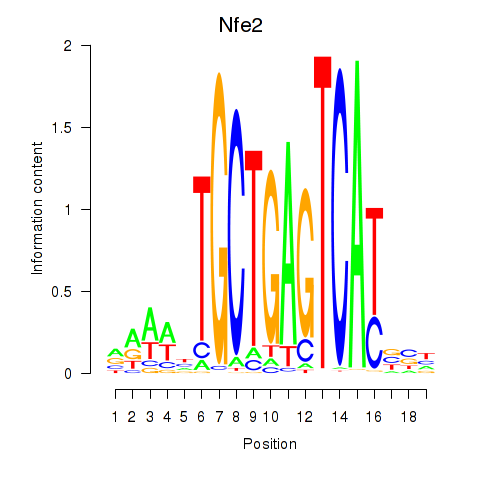
| Nfe2_Bach1_Mafk | 2.314 |
|
|
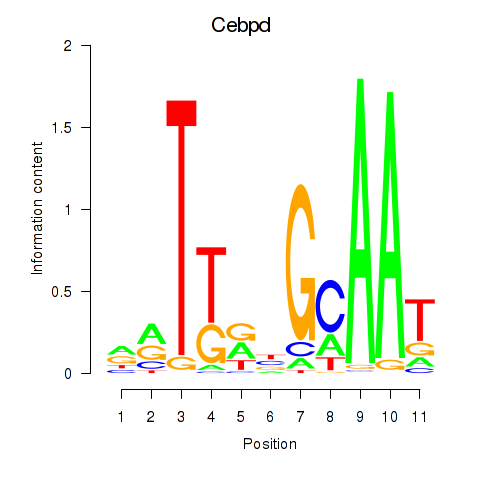
| Cebpd | 2.304 |
|
|
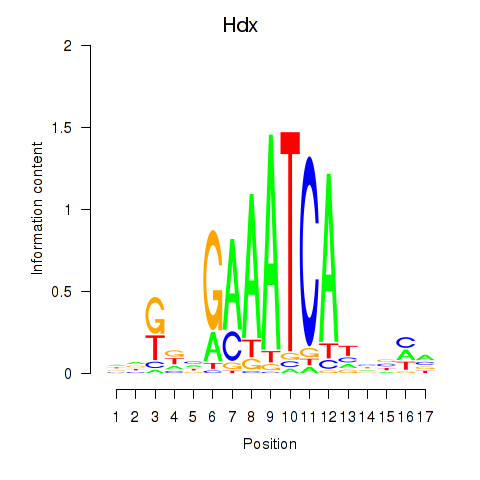
| Hdx | 2.248 |
|
|
| Grhl1 | 2.231 |
|
|
| Pax2 | 2.213 |
|
|
| Sp1 | 1.965 |
|
|
| Nr2f2 | 1.909 |
|
|
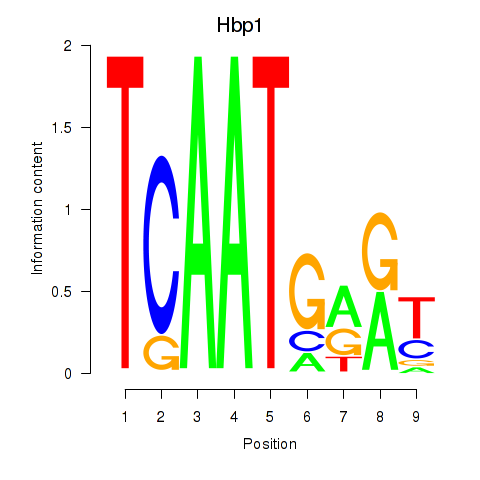
| Hbp1 | 1.894 |
|
|
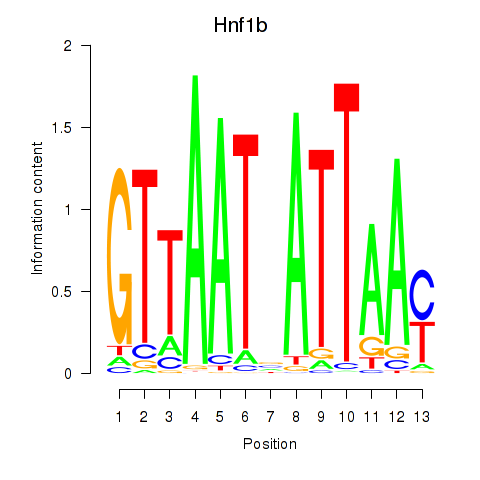
| Hnf1b | 1.824 |
|
|
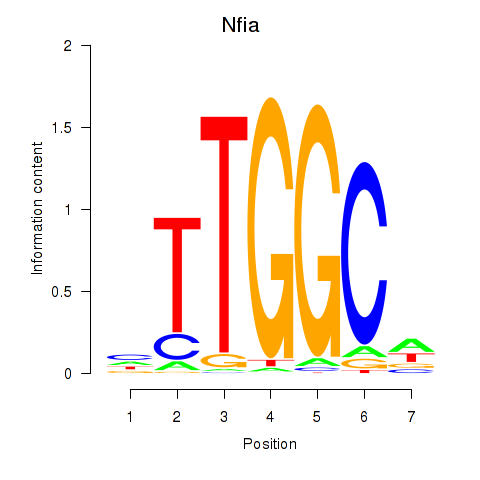
| Nfia | 1.814 |
|
|
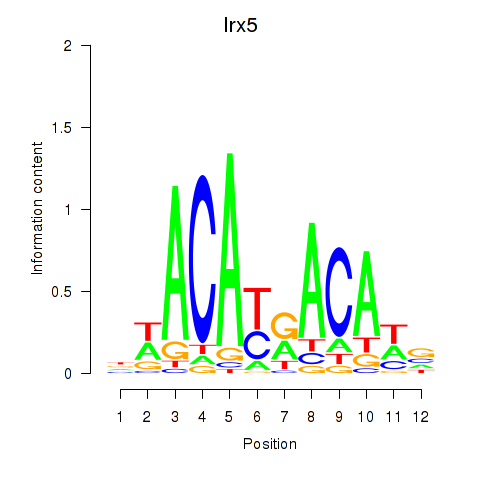
| Irx5 | 1.798 |
|
|
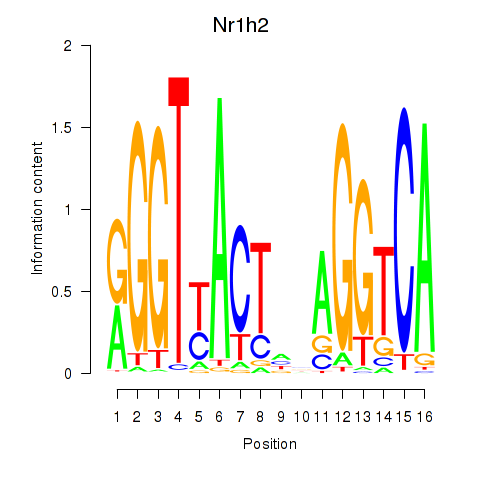
| Nr1h2 | 1.792 |
|
|
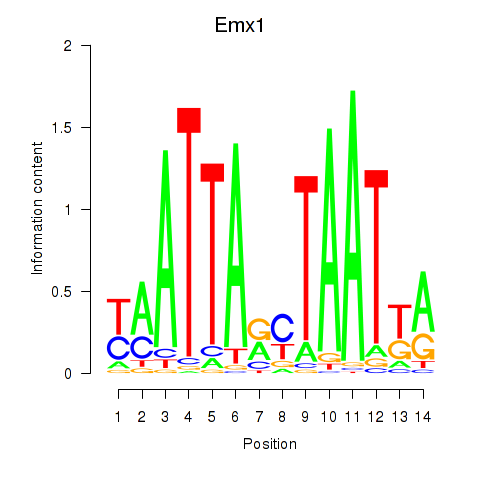
| Emx1_Emx2 | 1.783 |
|
|
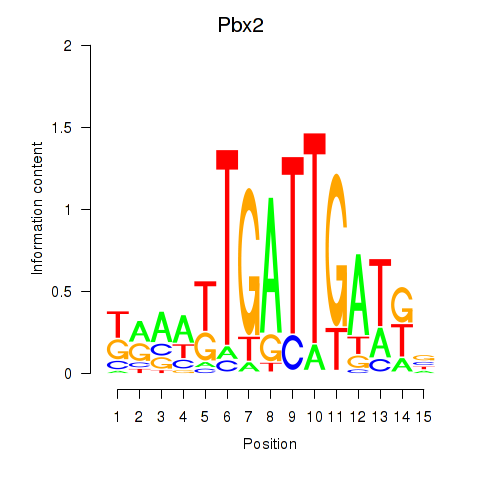
| Pbx2 | 1.726 |
|
|
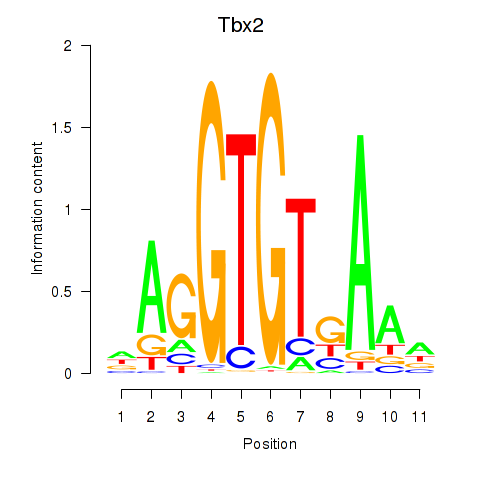
| Tbx2 | 1.691 |
|
|
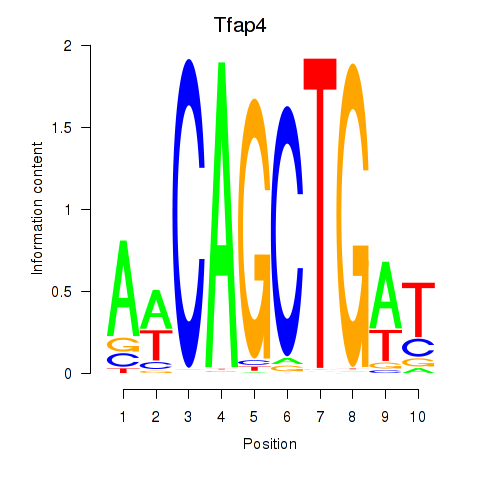
| Tfap4 | 1.648 |
|
|
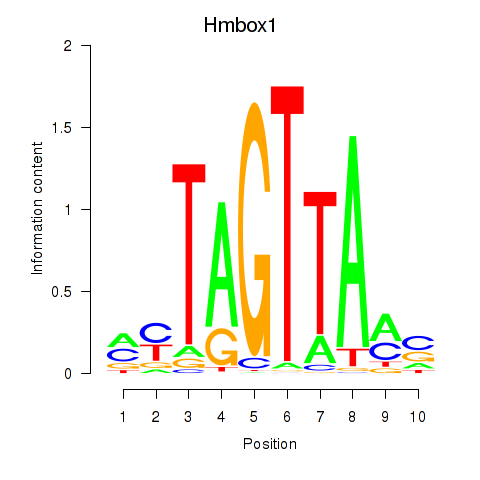
| Hmbox1 | 1.640 |
|
|
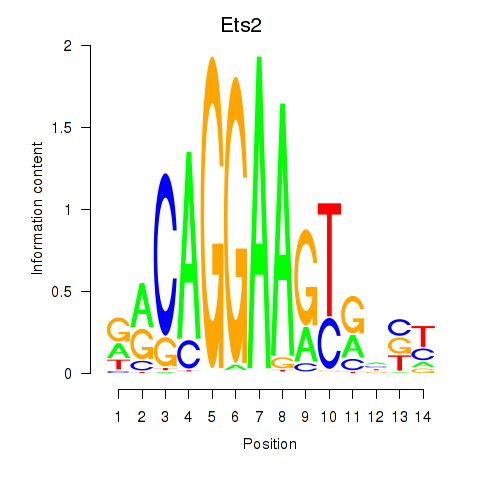
| Ets2 | 1.629 |
|
|
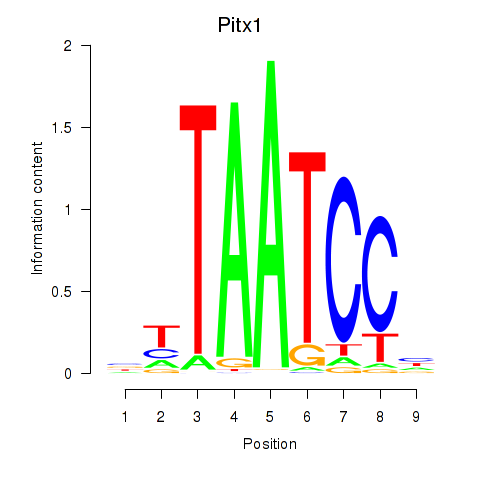
| Pitx1 | 1.618 |
|
|
| Nkx2-3 | 1.602 |
|
|
| Hoxb13 | 1.561 |
|
|
| Zfp263 | 1.539 |
|
|
| Nr2f1_Nr4a1 | 1.525 |
|
|
| Hsf4 | 1.507 |
|
|
| Jun | 1.473 |
|
|
| Tbx15 | 1.459 |
|
|
| Tfap2d | 1.429 |
|
|
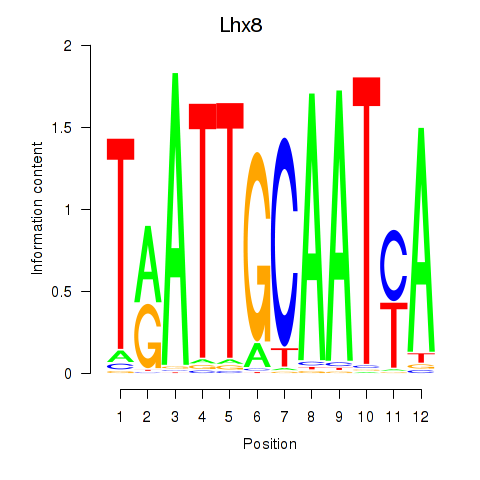
| Lhx8 | 1.427 |
|
|
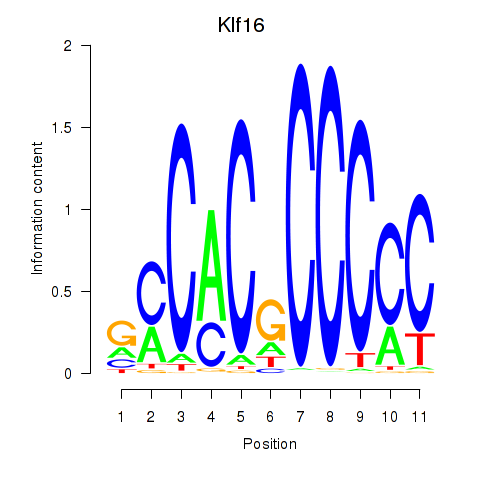
| Klf16_Sp8 | 1.421 |
|
|
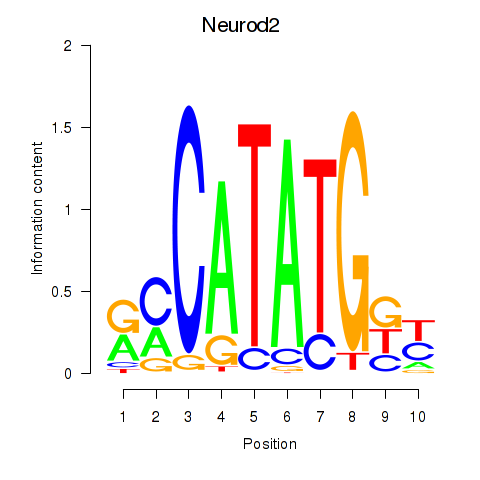
| Neurod2_Bhlha15_Bhlhe22_Olig1 | 1.387 |
|
|
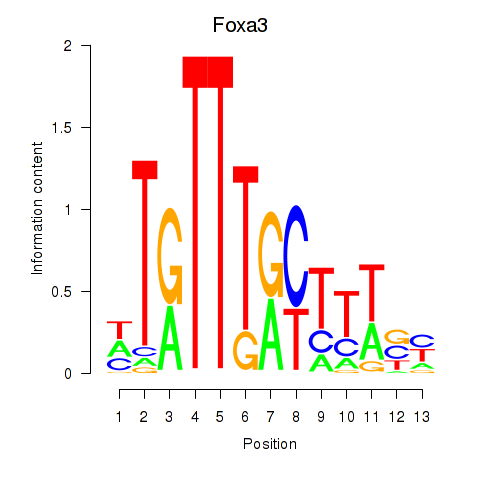
| Foxa3 | 1.332 |
|
|
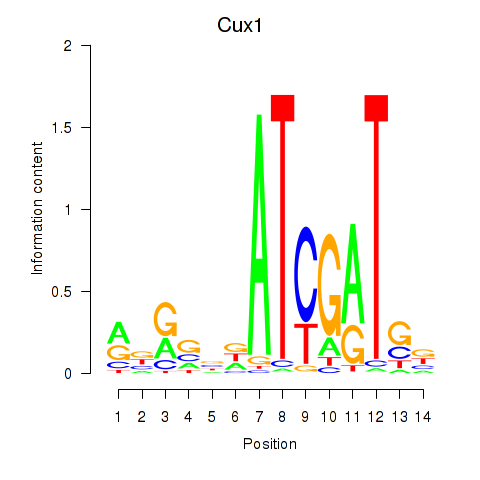
| Cux1 | 1.306 |
|
|
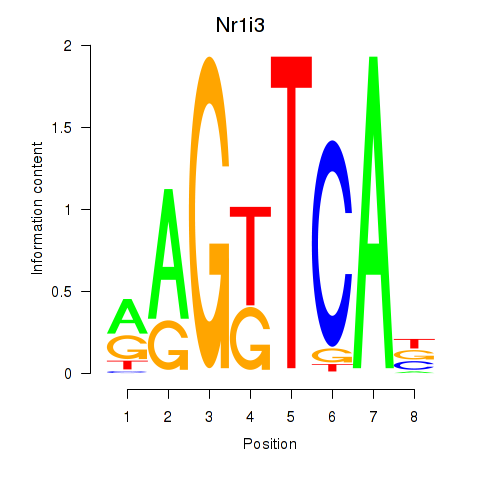
| Nr1i3 | 1.292 |
|
|
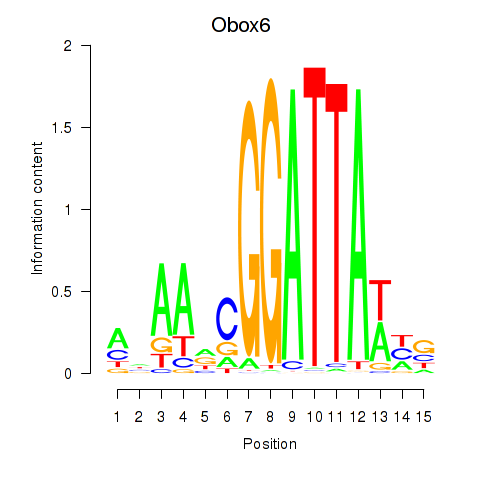
| Obox6_Obox5 | 1.242 |
|
|
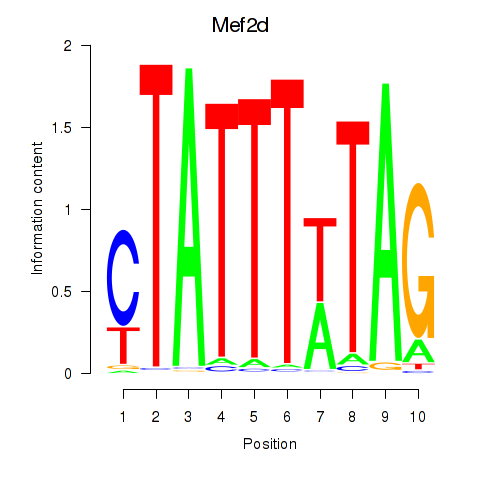
| Mef2d_Mef2a | 1.231 |
|
|
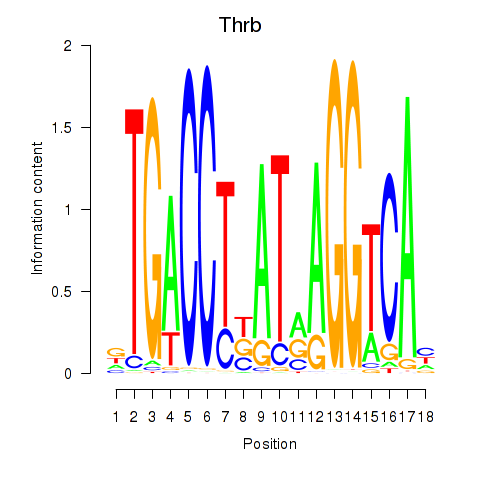
| Thrb | 1.215 |
|
|
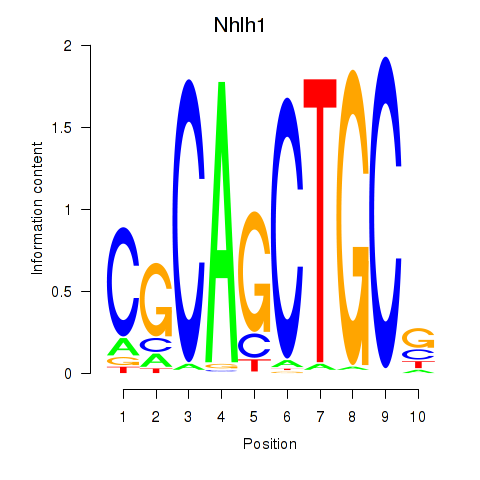
| Nhlh1 | 1.197 |
|
|
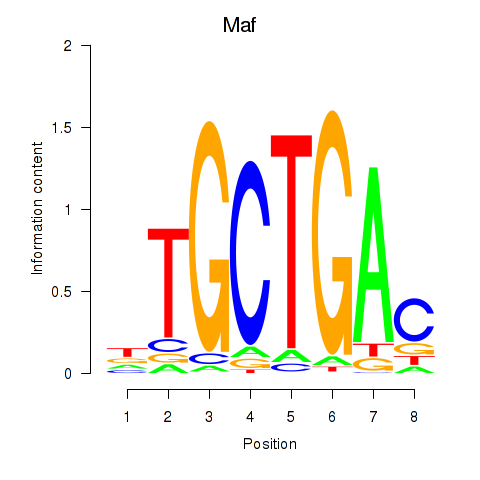
| Maf_Nrl | 1.178 |
|
|
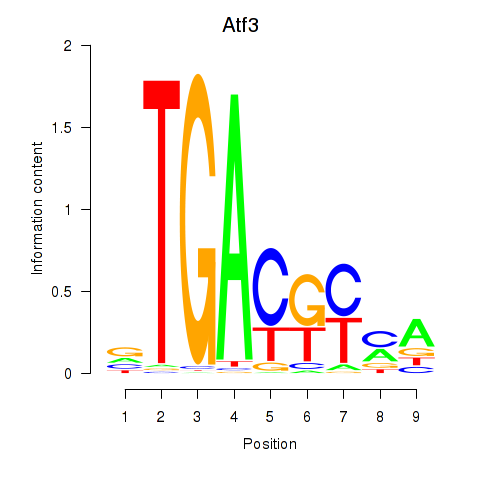
| Atf3 | 1.178 |
|
|
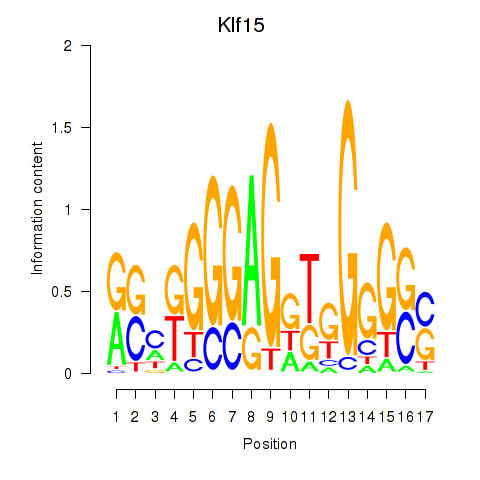
| Klf15 | 1.168 |
|
|
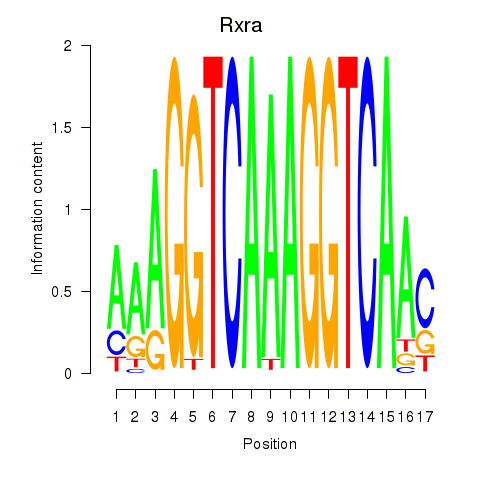
| Rxra | 1.148 |
|
|
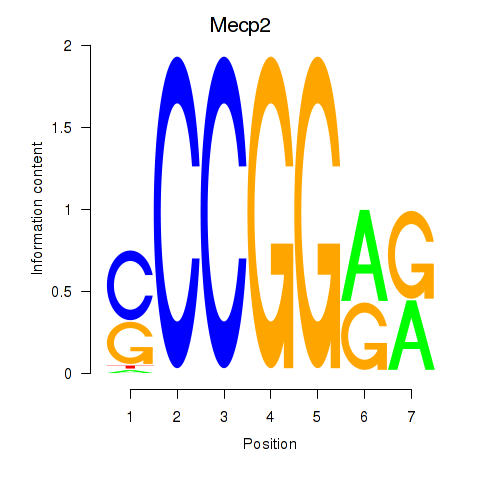
| Mecp2 | 1.144 |
|
|
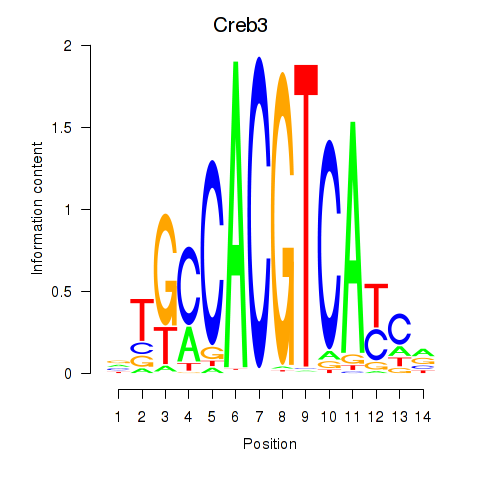
| Creb3 | 1.143 |
|
|
| Arntl_Tfe3_Mlx_Mitf_Mlxipl_Tfec | 1.117 |
|
|
| Zfx_Zfp711 | 1.110 |
|
|
| Prop1 | 1.097 |
|
|
| Zbtb49 | 1.085 |
|
|
| Foxo3 | 1.081 |
|
|
| Zbtb14 | 1.028 |
|
|
| Arnt | 1.009 |
|
|
| Tbx4 | 0.993 |
|
|
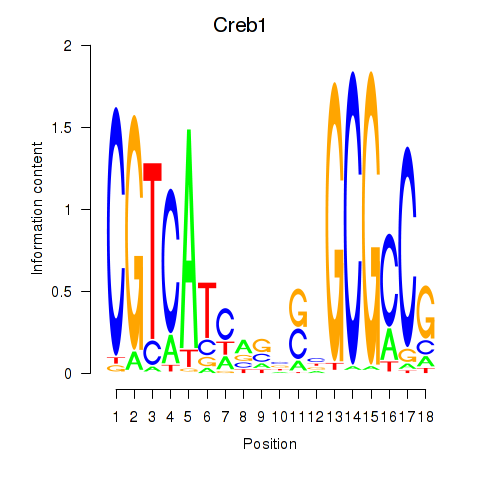
| Creb1 | 0.992 |
|
|
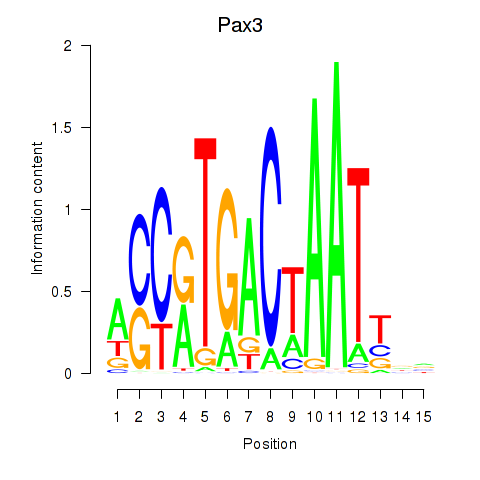
| Pax3 | 0.970 |
|
|
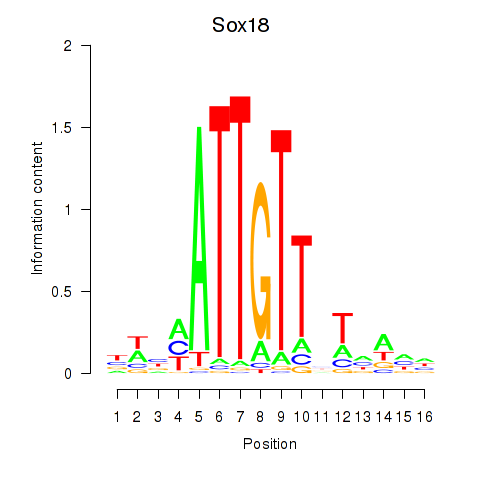
| Sox18_Sox12 | 0.941 |
|
|
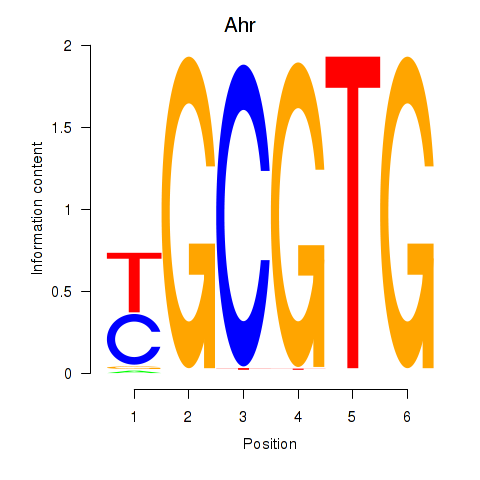
| Ahr | 0.934 |
|
|
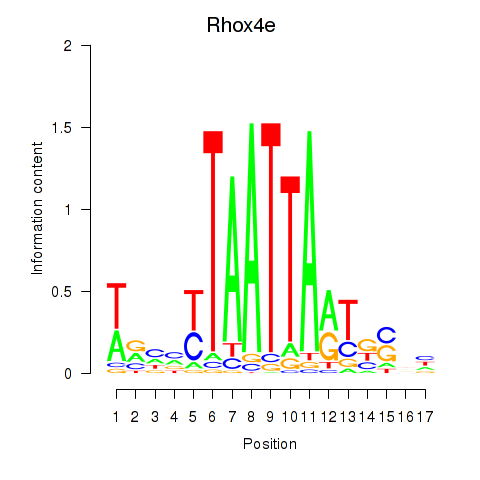
| Rhox4e_Rhox6_Vax2 | 0.921 |
|
|
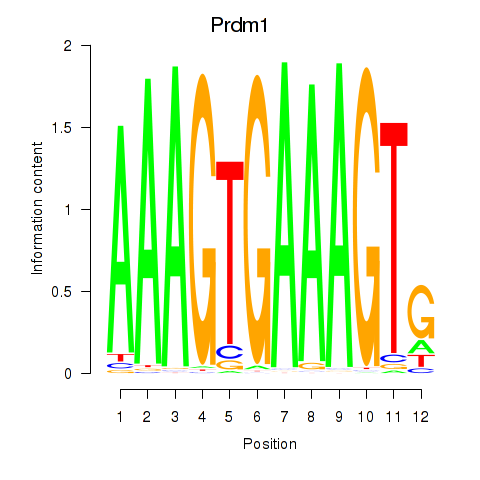
| Prdm1 | 0.918 |
|
|
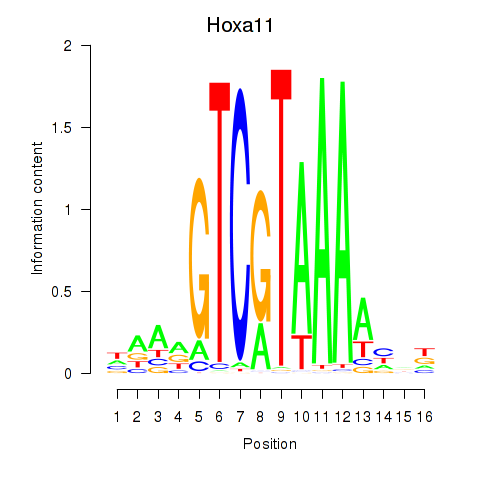
| Hoxa11_Hoxc12 | 0.861 |
|
|
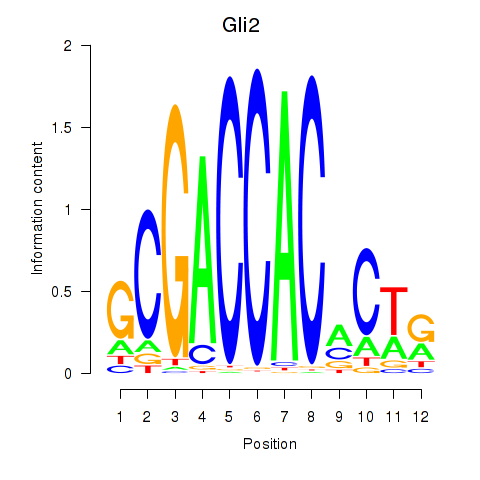
| Gli2 | 0.840 |
|
|
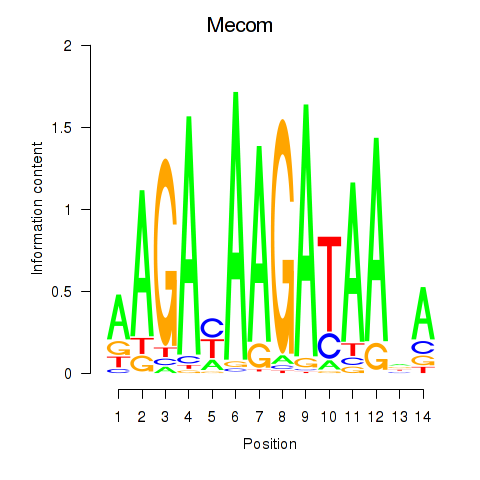
| Mecom | 0.836 |
|
|
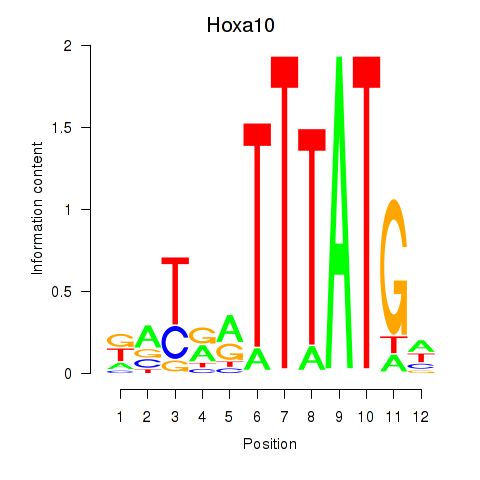
| Hoxa10 | 0.828 |
|
|
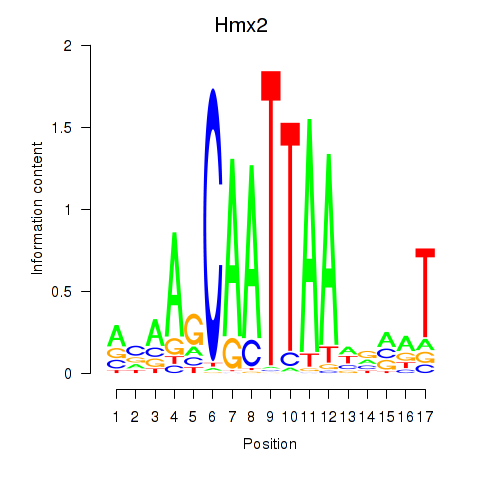
| Hmx2 | 0.815 |
|
|
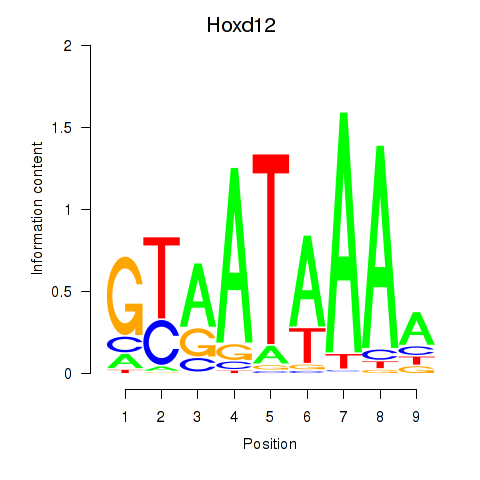
| Hoxd12 | 0.785 |
|
|
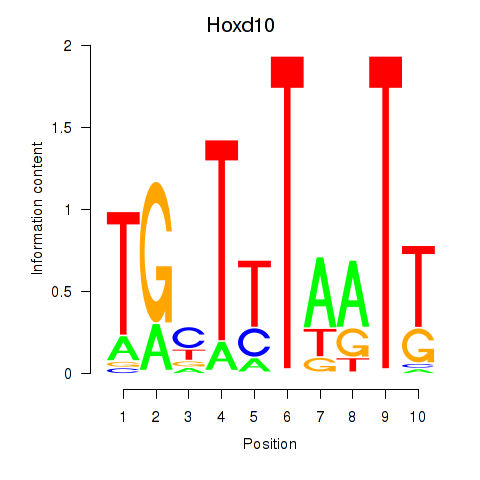
| Hoxd10 | 0.771 |
|
|
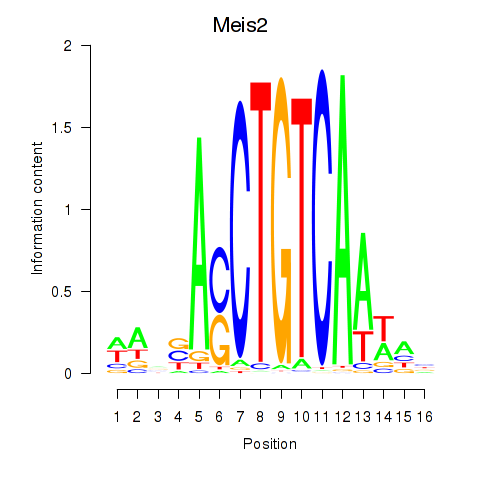
| Meis2 | 0.766 |
|
|
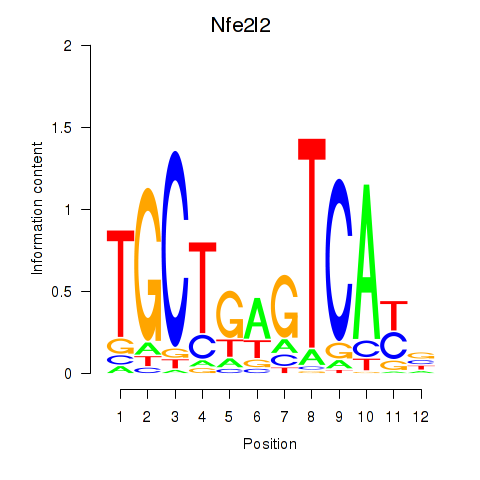
| Nfe2l2 | 0.763 |
|
|
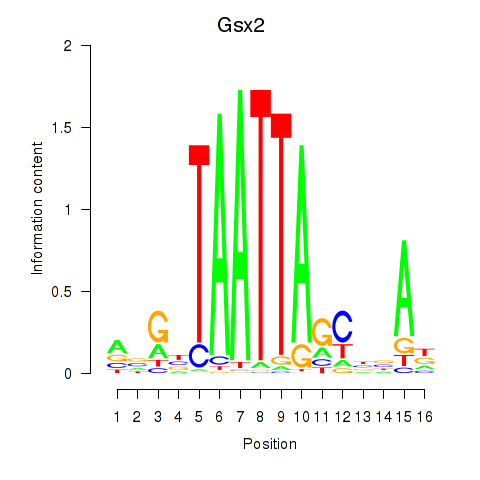
| Gsx2_Hoxd3_Vax1 | 0.744 |
|
|
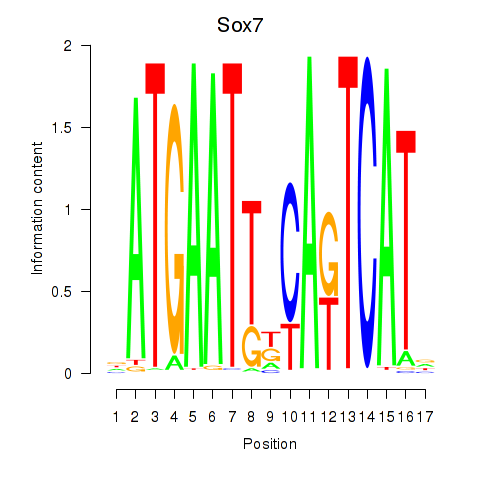
| Sox7 | 0.739 |
|
|
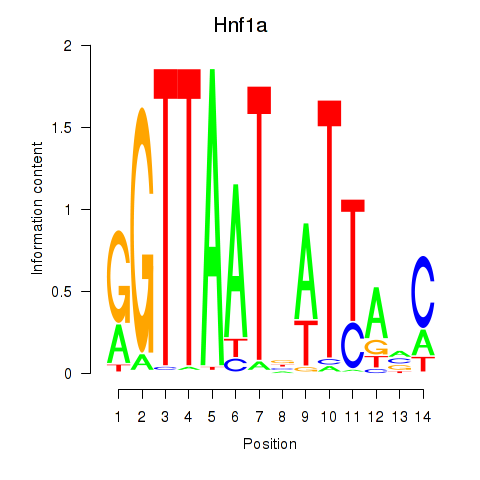
| Hnf1a | 0.737 |
|
|
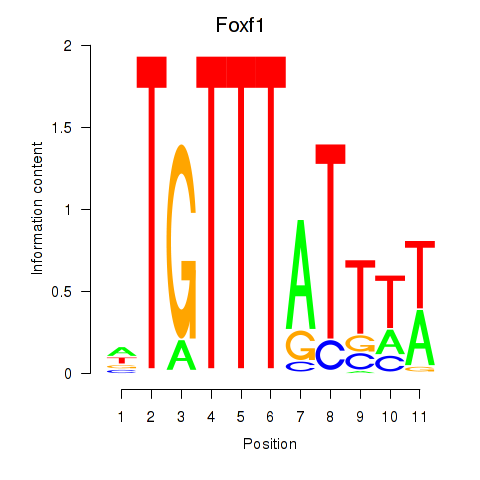
| Foxf1 | 0.732 |
|
|
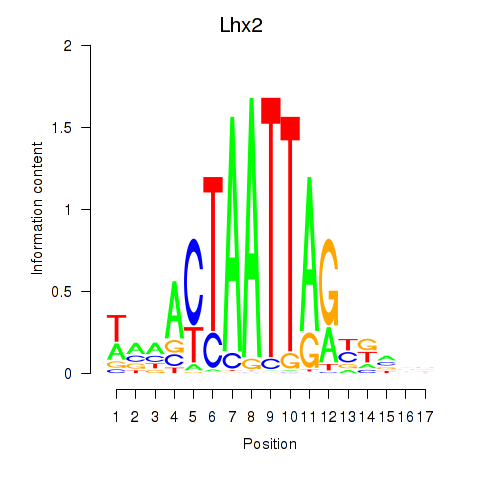
| Lhx2_Hoxc5 | 0.723 |
|
|
| Sox6_Sox9 | 0.719 |
|
|
| Zic3 | 0.718 |
|
|
| Hey1_Myc_Mxi1 | 0.714 |
|
|
| Hcfc1_Six5_Smarcc2_Zfp143 | 0.685 |
|
|
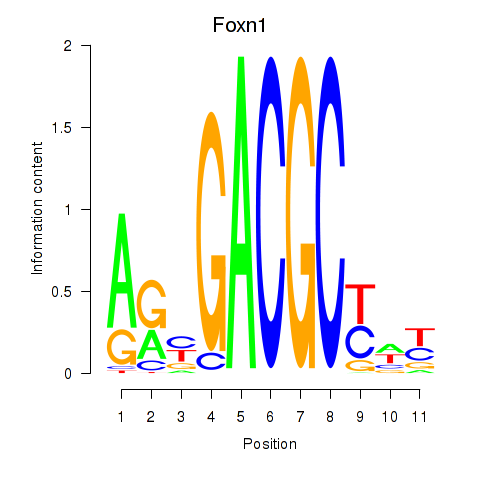
| Foxn1 | 0.681 |
|
|
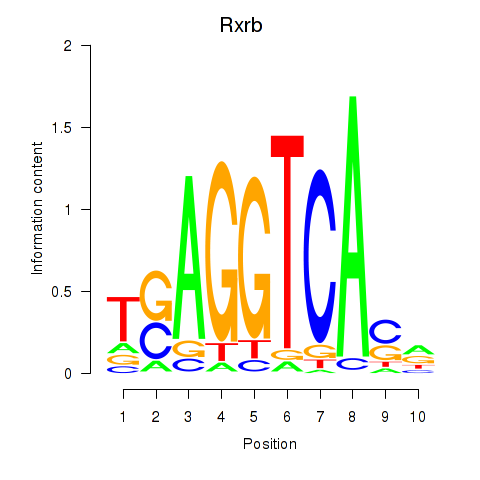
| Rxrb | 0.677 |
|
|
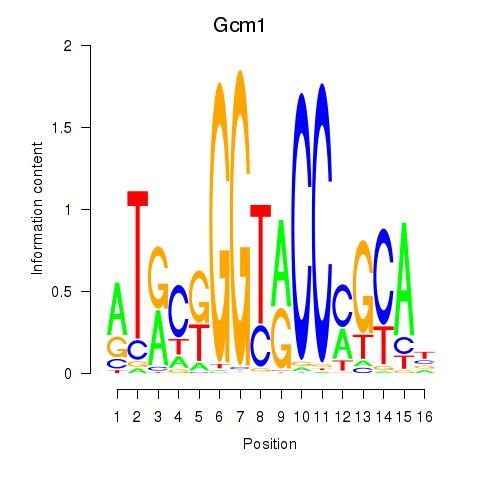
| Gcm1 | 0.663 |
|
|
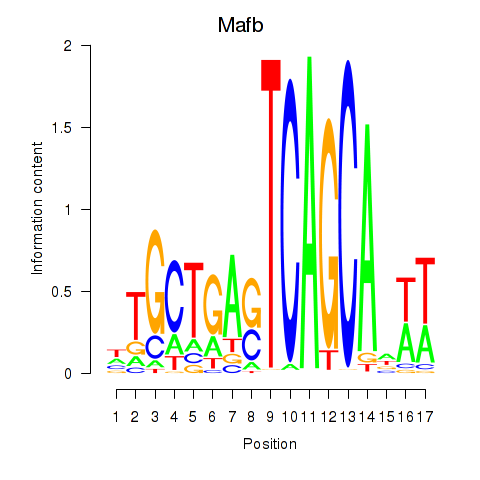
| Mafb | 0.662 |
|
|
| Klf12_Klf14_Sp4 | 0.635 |
|
|
| Lhx3 | 0.607 |
|
|
| Rarb | 0.606 |
|
|
| Irf2_Irf1_Irf8_Irf9_Irf7 | 0.605 |
|
|
| Tlx1 | 0.602 |
|
|
| Tbx19 | 0.600 |
|
|
| Gsx1_Alx1_Mixl1_Lbx2 | 0.584 |
|
|
| Tbr1 | 0.583 |
|
|
| Nkx2-2 | 0.582 |
|
|
| Nr1h4 | 0.581 |
|
|
| Hsf1 | 0.576 |
|
|
| Zbtb3 | 0.570 |
|
|
| Glis3 | 0.561 |
|
|
| Irf5_Irf6 | 0.560 |
|
|
| Pou6f2_Pou4f2 | 0.560 |
|
|
| Nr4a2 | 0.558 |
|
|
| Pgr_Nr3c1 | 0.555 |
|
|
| Foxb1 | 0.551 |
|
|
| Spdef | 0.548 |
|
|
| Sox17 | 0.548 |
|
|
| Arid5a | 0.548 |
|
|
| Nr0b1 | 0.543 |
|
|
| Nfatc4 | 0.539 |
|
|
| Fubp1 | 0.520 |
|
|
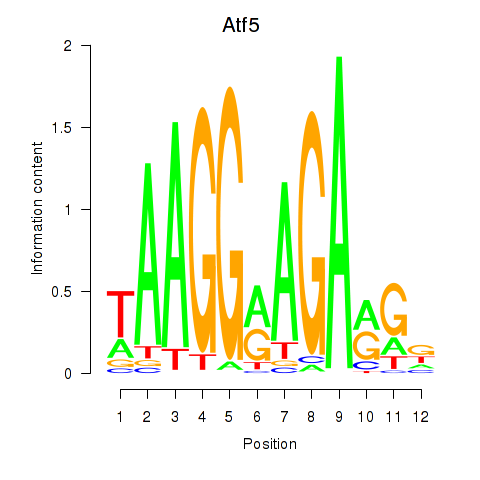
| Atf5 | 0.514 |
|
|
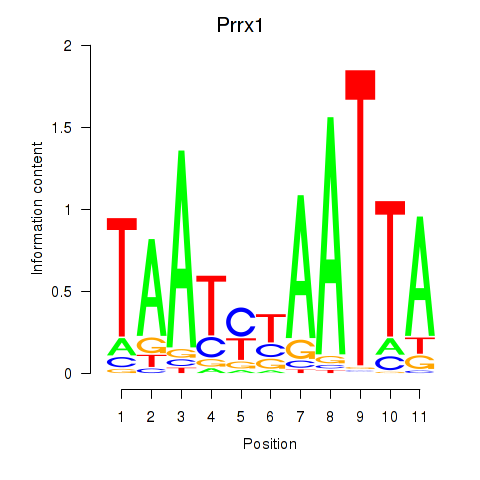
| Prrx1_Isx_Prrxl1 | 0.508 |
|
|
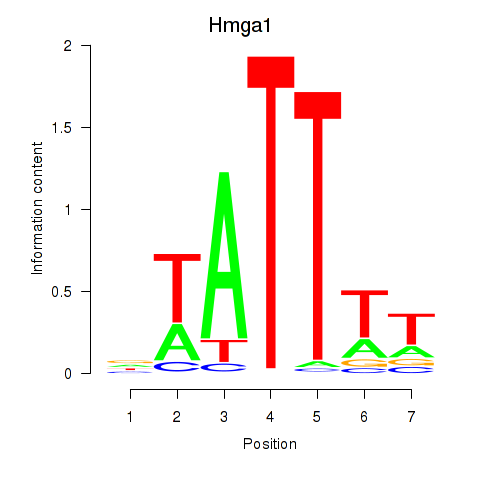
| Hmga1 | 0.508 |
|
|
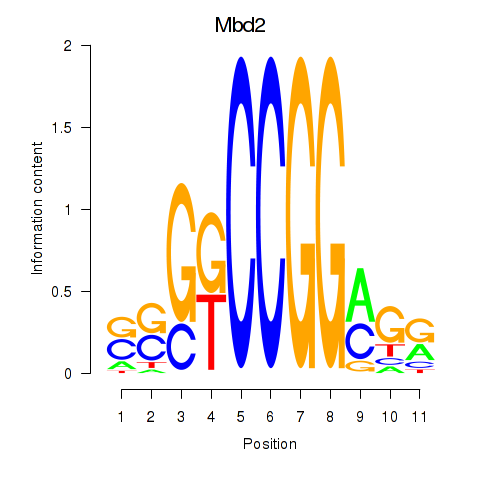
| Mbd2 | 0.502 |
|
|
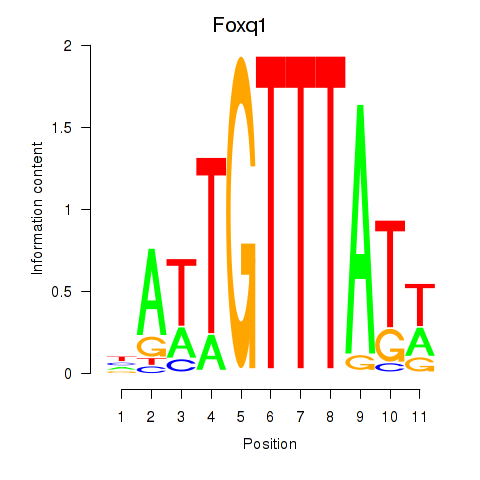
| Foxq1 | 0.499 |
|
|
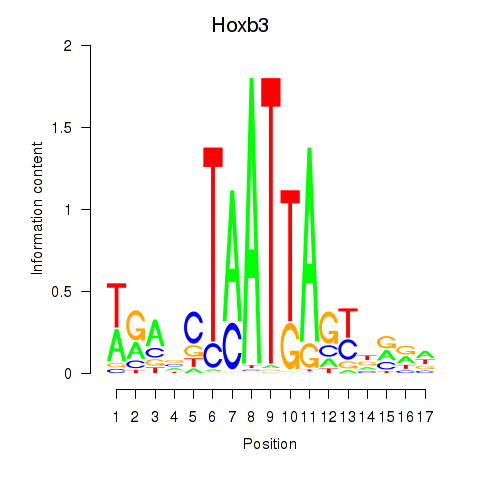
| Hoxb3 | 0.498 |
|
|
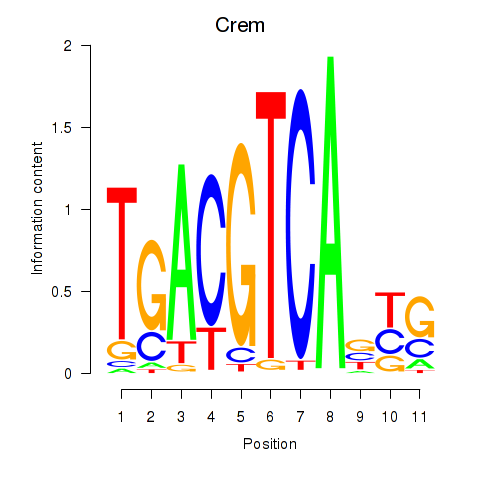
| Crem_Jdp2 | 0.490 |
|
|
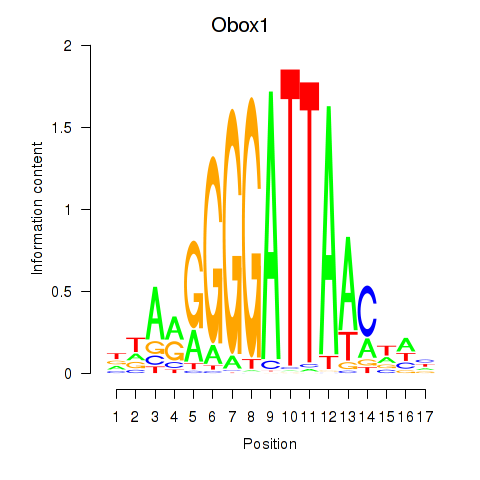
| Obox1 | 0.487 |
|
|
| Nrf1 | 0.478 |
|
|
| Isl1 | 0.474 |
|
|
| Tfap2e | 0.473 |
|
|
| Pknox2_Pknox1 | 0.470 |
|
|
| Nkx2-9 | 0.459 |
|
|
| Smad3 | 0.455 |
|
|
| T | 0.443 |
|
|
| Scrt2 | 0.443 |
|
|
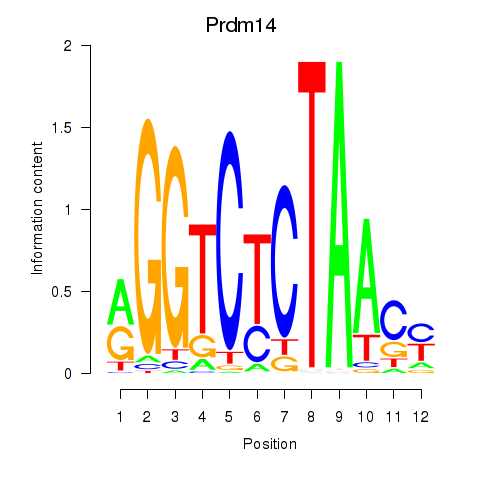
| Prdm14 | 0.442 |
|
|
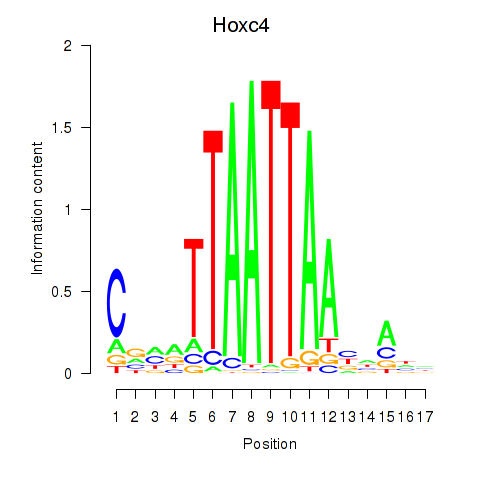
| Hoxc4_Arx_Otp_Esx1_Phox2b | 0.439 |
|
|
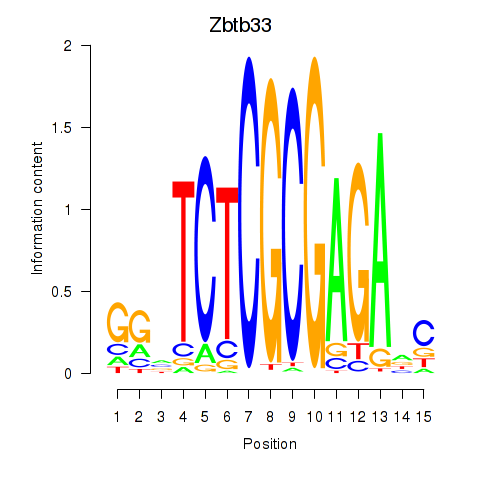
| Zbtb33_Chd2 | 0.417 |
|
|
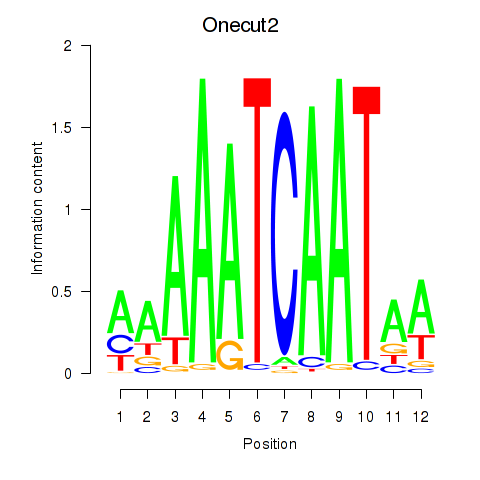
| Onecut2_Onecut3 | 0.417 |
|
|
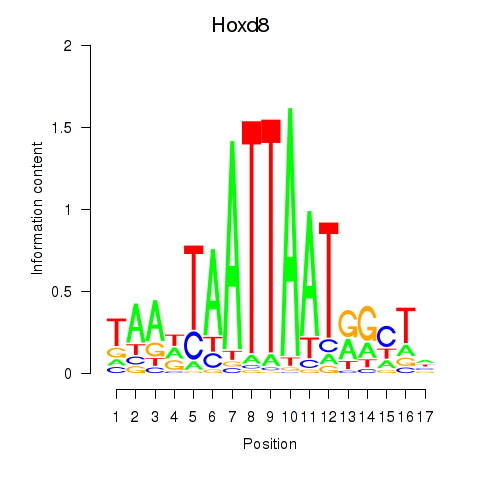
| Hoxd8 | 0.414 |
|
|
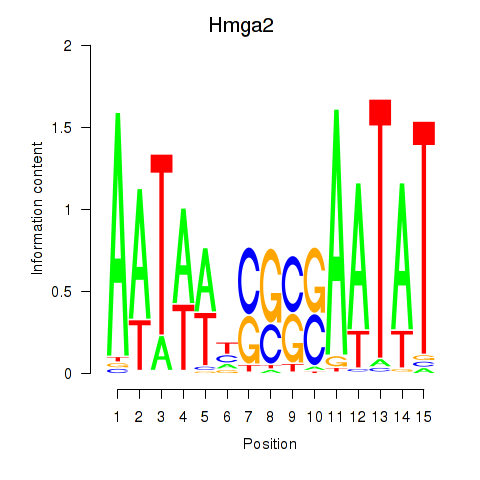
| Hmga2 | 0.411 |
|
|
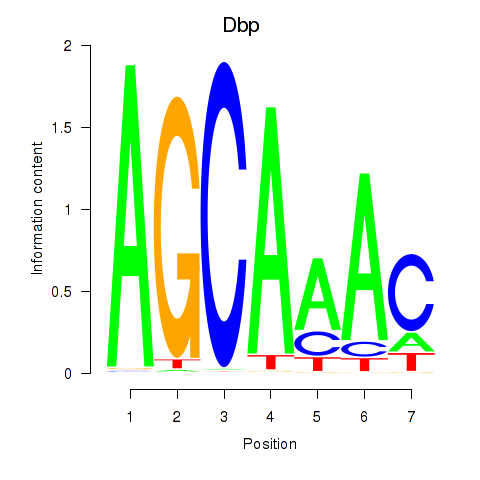
| Dbp | 0.408 |
|
|
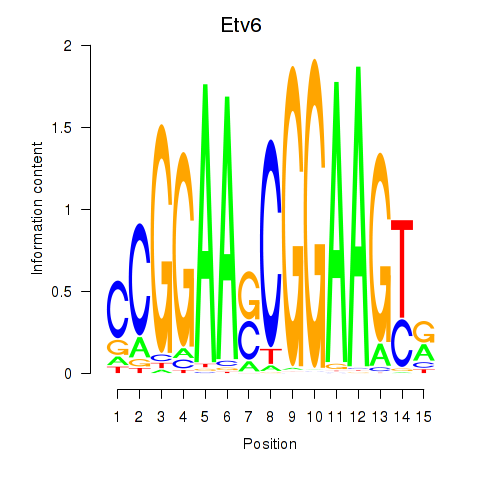
| Etv6 | 0.408 |
|
|
| Scrt1 | 0.405 |
|
|
| Zfp219_Zfp740 | 0.392 |
|
|
| Nfatc3 | 0.386 |
|
|
| Junb_Jund | 0.385 |
|

|
| Smarcc1_Fosl1 | 0.381 |
|
|
| Cbfb | 0.381 |
|
|
| Bcl6b | 0.369 |
|
|
| Gmeb2 | 0.368 |
|
|
| Osr2_Osr1 | 0.364 |
|
|
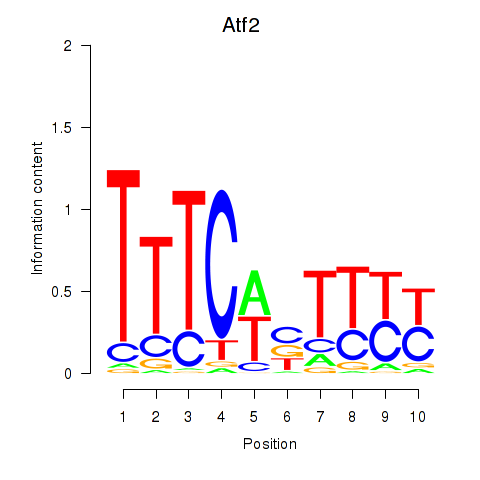
| Atf2_Ikzf1 | 0.363 |
|
|
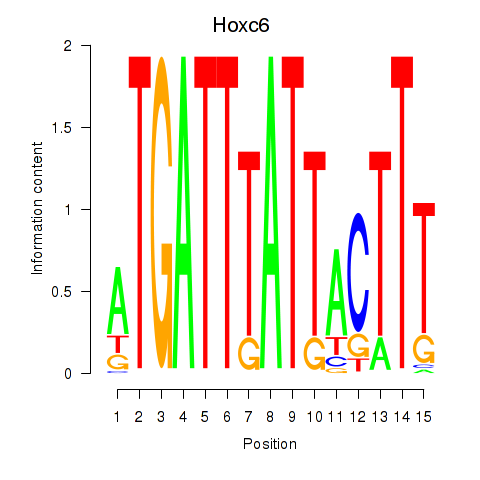
| Hoxc6 | 0.363 |
|
|
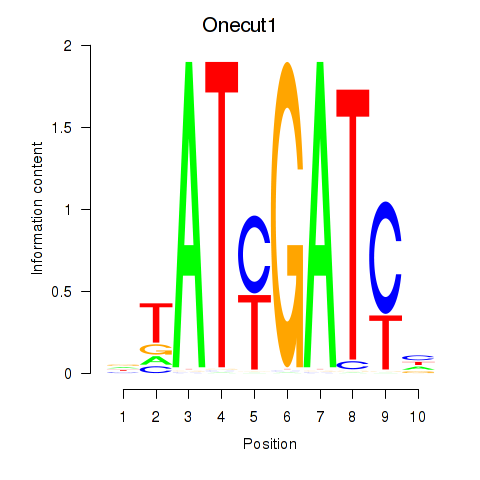
| Onecut1_Cux2 | 0.360 |
|
|
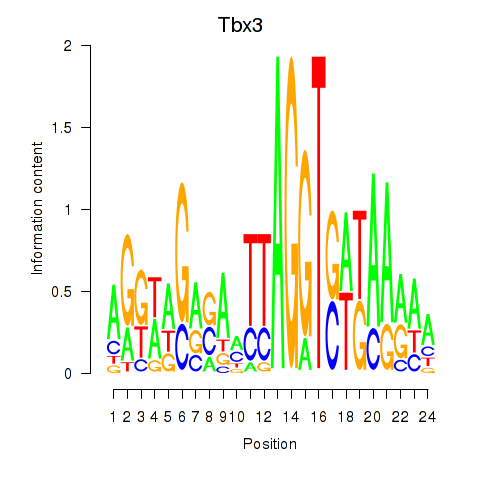
| Tbx3 | 0.355 |
|
|
| Six4 | 0.352 |
|
|
| Mef2c | 0.343 |
|
|
| Zscan4c | 0.338 |
|
|
| Foxi1_Foxo1 | 0.324 |
|
|
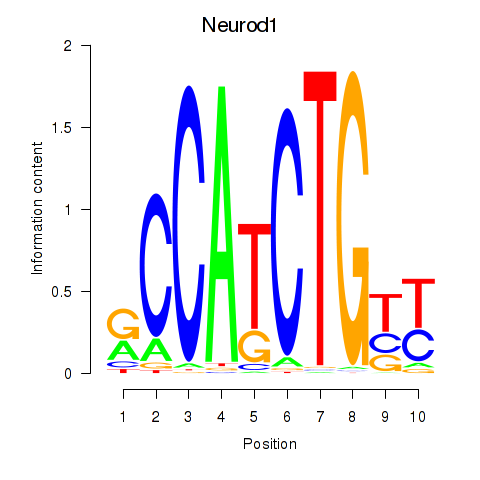
| Neurod1 | 0.324 |
|
|
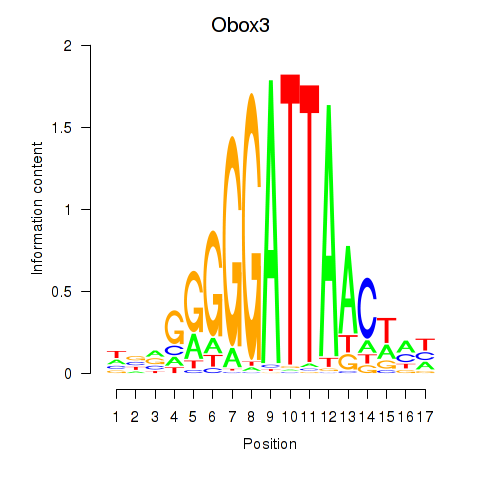
| Obox3 | 0.299 |
|
|
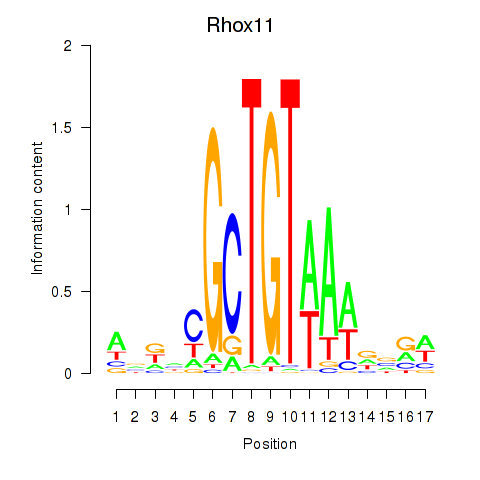
| Rhox11 | 0.290 |
|
|
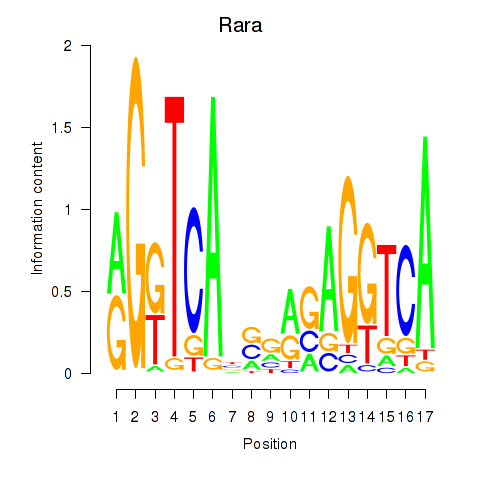
| Rara | 0.290 |
|
|
| Rora | 0.280 |
|
|
| Cdc5l | 0.274 |
|
|
| Esrrb_Esrra | 0.269 |
|
|
| Isl2 | 0.264 |
|
|
| En2 | 0.256 |
|
|
| Pax8 | 0.253 |
|
|
| En1 | 0.245 |
|
|
| Vsx1_Uncx_Prrx2_Shox2_Noto | 0.235 |
|
|
| Egr3 | 0.231 |
|
|
| Gtf2i_Gtf2f1 | 0.230 |
|
|
| Tfap2a | 0.225 |
|

|
| Meox1 | 0.219 |
|
|
| Rad21_Smc3 | 0.218 |
|
|
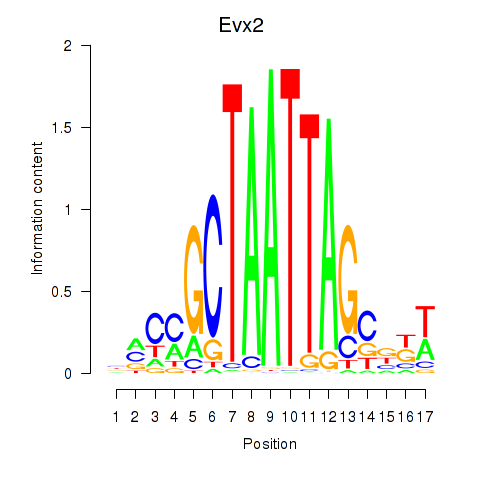
| Evx2 | 0.217 |
|
|
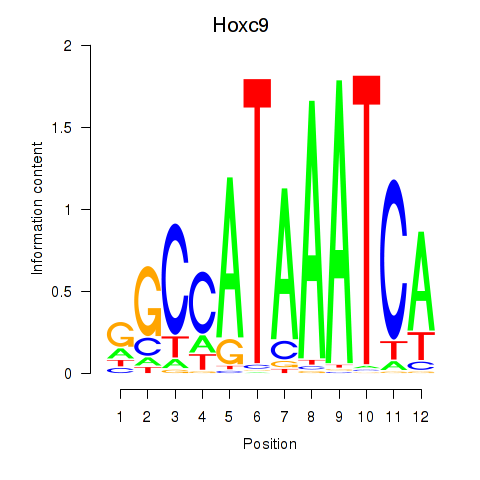
| Hoxc9 | 0.199 |
|
|
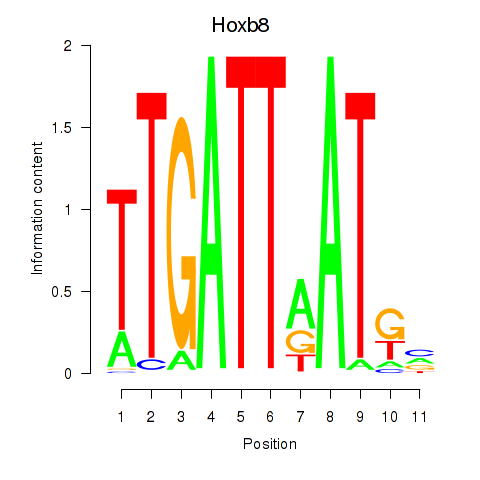
| Hoxb8_Pdx1 | 0.198 |
|
|
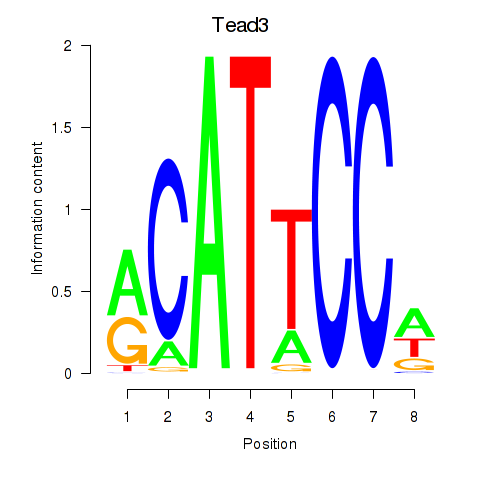
| Tead3_Tead4 | 0.193 |
|
|
| Thra | 0.193 |
|
|
| Relb | 0.190 |
|
|
| Hnf4g | 0.187 |
|
|
| Hoxa1 | 0.182 |
|
|
| Gfi1_Gfi1b | 0.181 |
|
|
| Bhlhe40 | 0.173 |
|
|
| Irx6_Irx2_Irx3 | 0.172 |
|
|
| Rest | 0.169 |
|
|
| Nkx2-4 | 0.166 |
|
|
| Hoxa5 | 0.157 |
|
|
| Foxo4 | 0.156 |
|
|
| Tcf7_Tcf7l2 | 0.152 |
|
|
| Pax5 | 0.150 |
|
|
| Cxxc1 | 0.142 |
|
|
| Zbtb16 | 0.140 |
|
|
| Nfat5 | 0.131 |
|
|
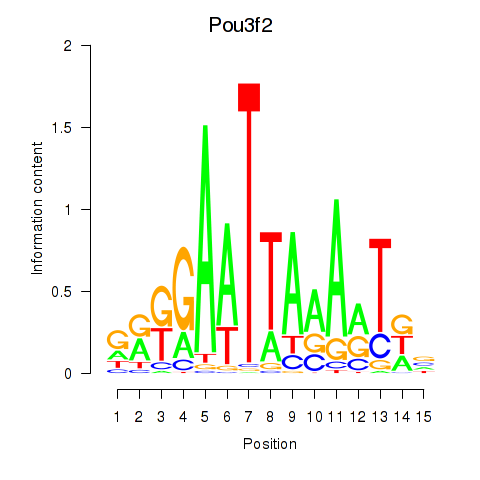
| Pou3f2 | 0.127 |
|
|
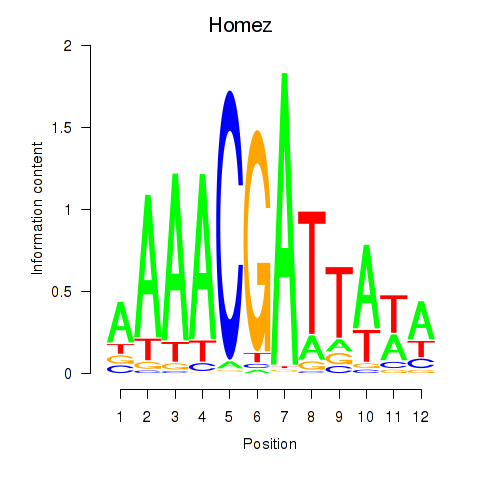
| Homez | 0.125 |
|
|
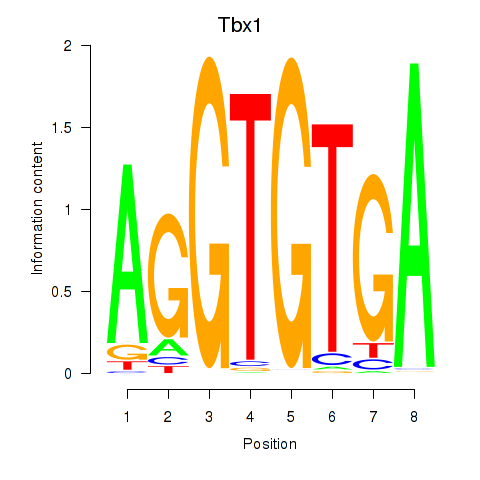
| Tbx1_Eomes | 0.113 |
|
|
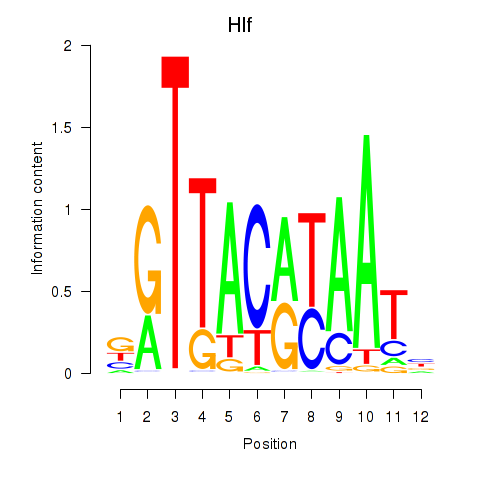
| Hlf | 0.111 |
|
|
| Pou4f3 | 0.110 |
|
|
| Gata3 | 0.110 |
|
|
| Sin3a | 0.108 |
|
|
| Fli1 | 0.101 |
|
|
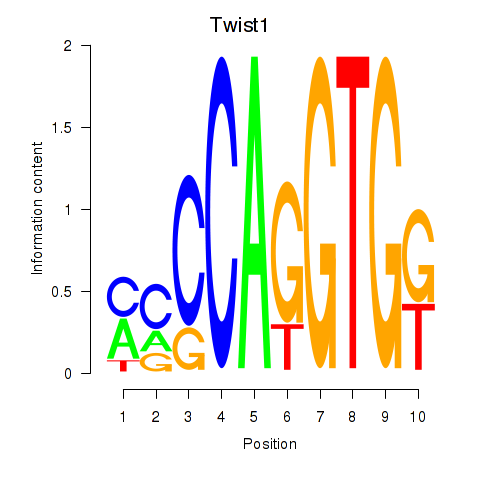
| Twist1 | 0.094 |
|
|
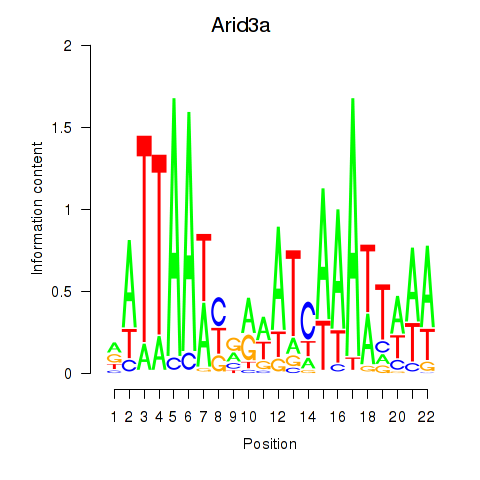
| Arid3a | 0.094 |
|
|
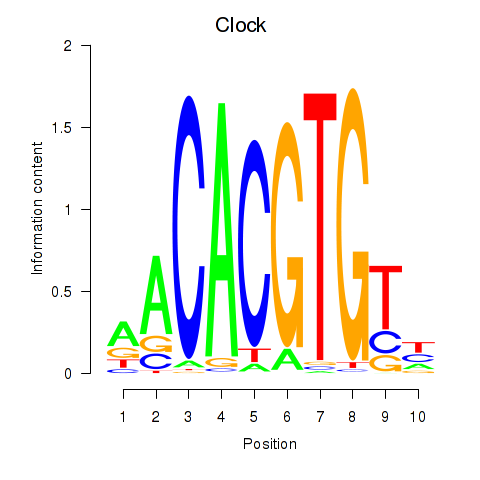
| Clock | 0.091 |
|
|
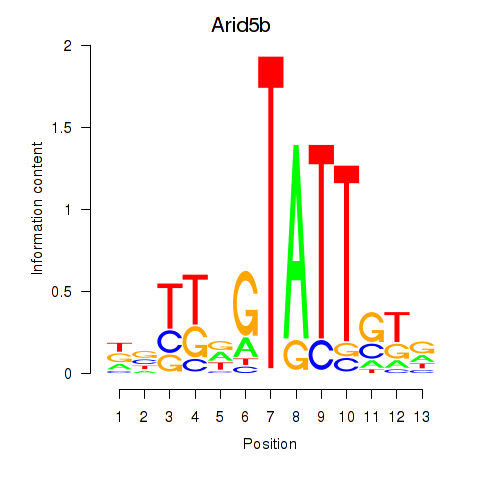
| Arid5b | 0.089 |
|
|
| Atf7_E4f1 | 0.086 |
|
|
| Foxm1 | 0.082 |
|
|
| Zfp384 | 0.082 |
|
|
| Foxg1 | 0.082 |
|
|
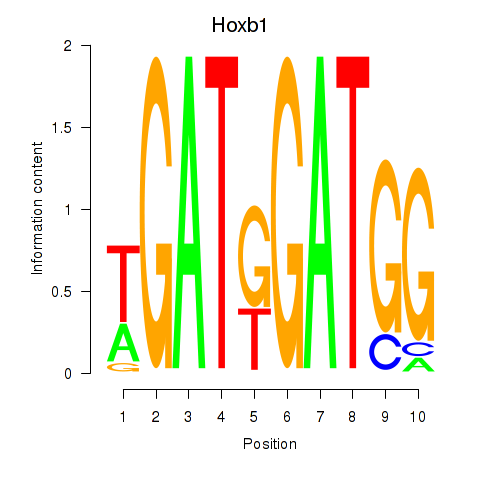
| Hoxb1 | 0.076 |
|
|
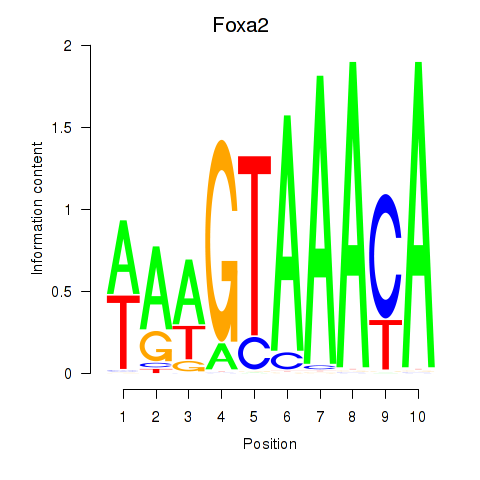
| Foxa2_Foxa1 | 0.076 |
|
|
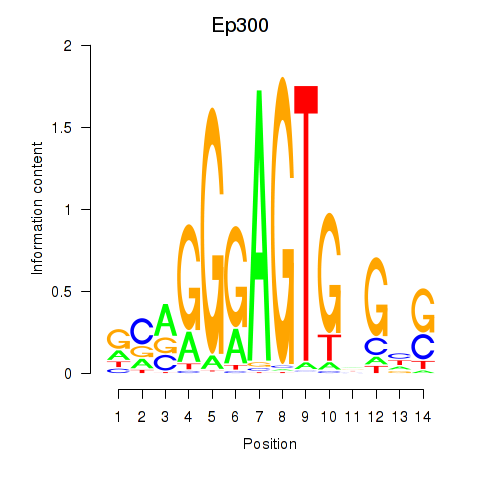
| Ep300 | 0.068 |
|
|
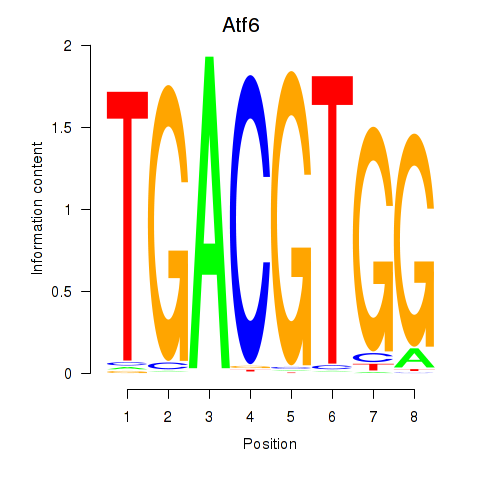
| Atf6 | 0.064 |
|
|
| Lhx5_Lmx1b_Lhx1 | 0.060 |
|
|
| Gbx1_Nobox_Alx3 | 0.058 |
|
|
| Pitx3 | 0.050 |
|
|
| Arnt2 | 0.042 |
|
|
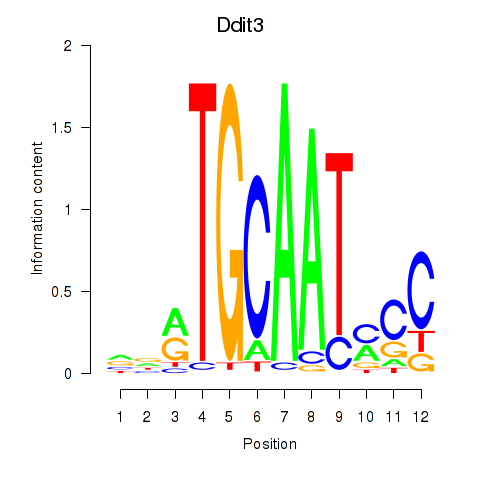
| Ddit3 | 0.039 |
|
|
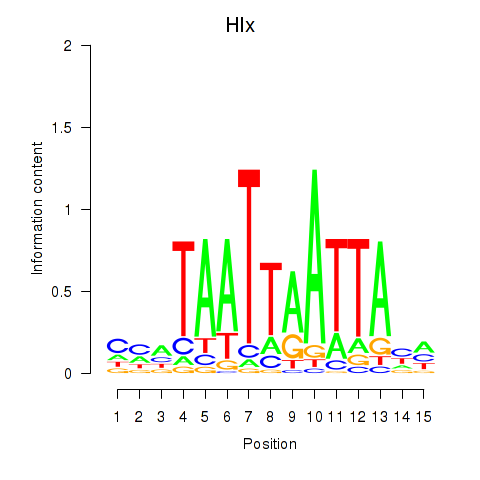
| Hlx | 0.038 |
|
|
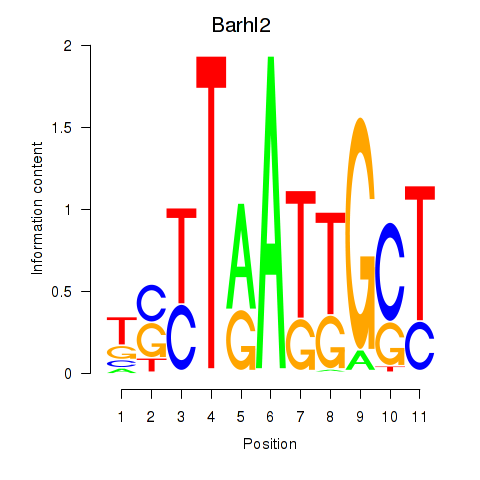
| Barhl2 | 0.037 |
|
|
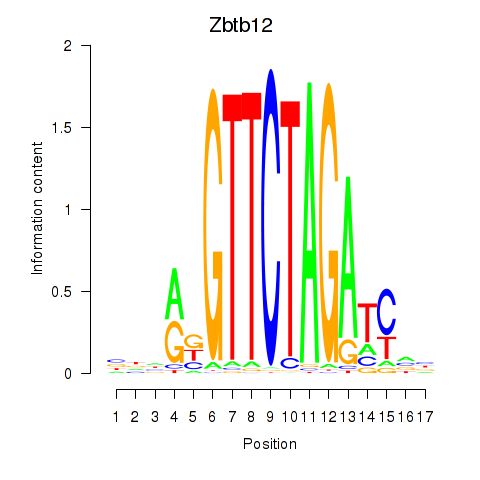
| Zbtb12 | 0.036 |
|
|
| Glis1 | 0.029 |
|
|
| Nr6a1 | 0.029 |
|
|
| Gsc2_Dmbx1 | 0.026 |
|
|
| Dmc1 | 0.024 |
|
|
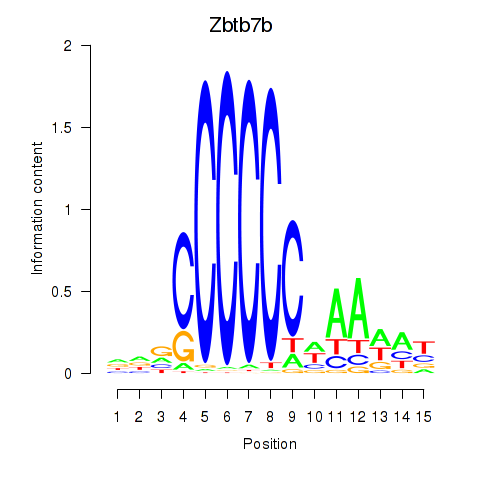
| Zbtb7b | 0.014 |
|
|
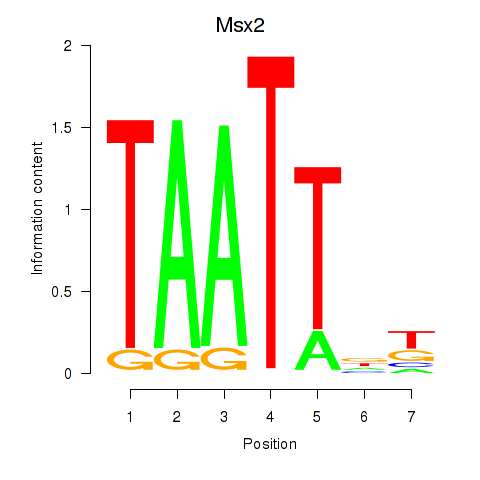
| Msx2_Hoxd4 | 0.013 |
|
|
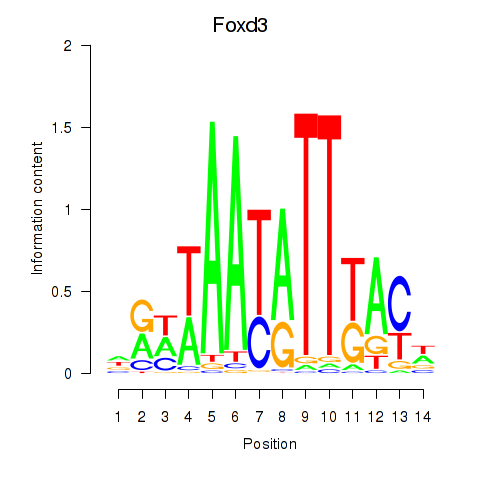
| Foxd3 | 0.011 |
|
|
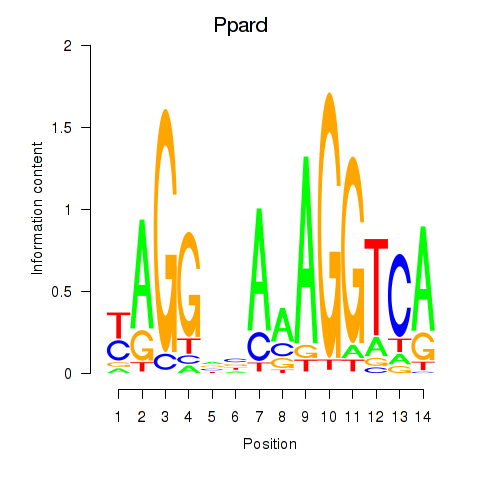
| Ppard | 0.005 |
|
|
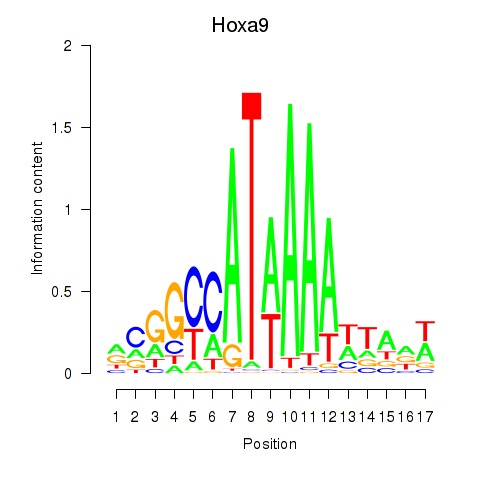
| Hoxa9_Hoxb9 | -0.011 |
|
|
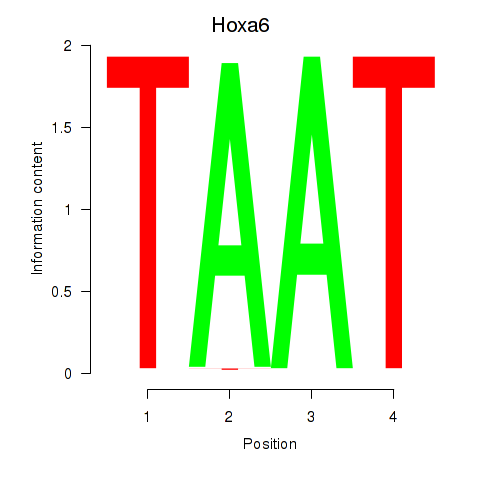
| Hoxa6 | -0.014 |
|
|
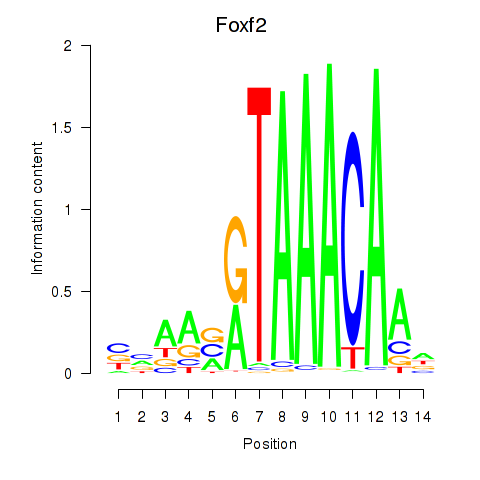
| Foxf2 | -0.014 |
|
|
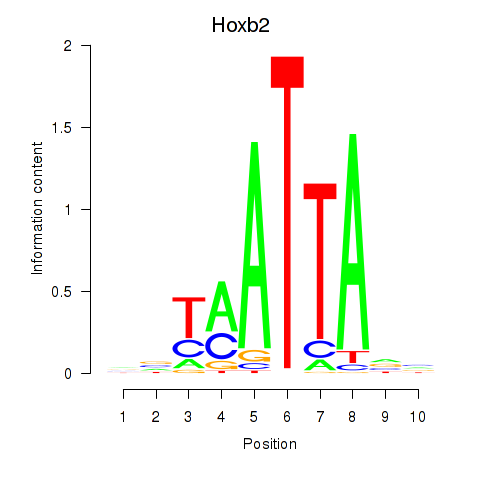
| Hoxb2_Dlx2 | -0.014 |
|
|
| Klf6_Patz1 | -0.017 |
|
|
| Bbx | -0.035 |
|
|
| Ehf | -0.041 |
|
|
| Hoxa3 | -0.048 |
|
|
| Lef1 | -0.049 |
|
|
| Meis1 | -0.049 |
|
|
| Mef2b | -0.075 |
|
|
| Prdm4 | -0.080 |
|
|
| Stat5a | -0.090 |
|
|
| Nr2c2 | -0.095 |
|
|
| Ovol1 | -0.102 |
|
|
| Batf3 | -0.105 |
|
|
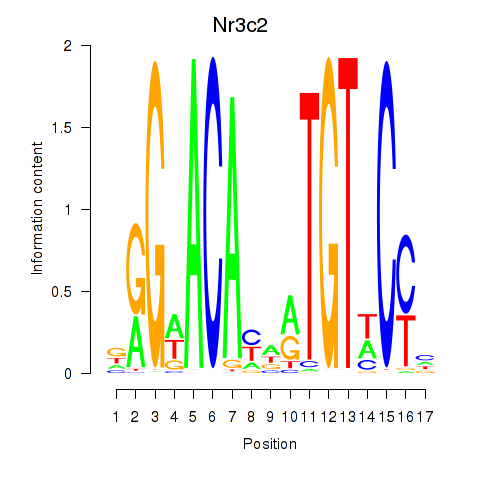
| Nr3c2 | -0.108 |
|
|
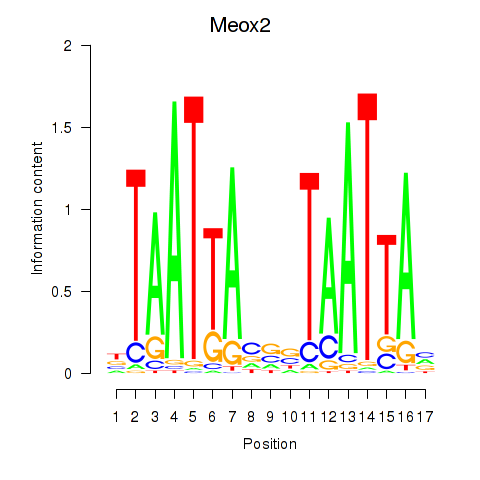
| Meox2 | -0.111 |
|
|
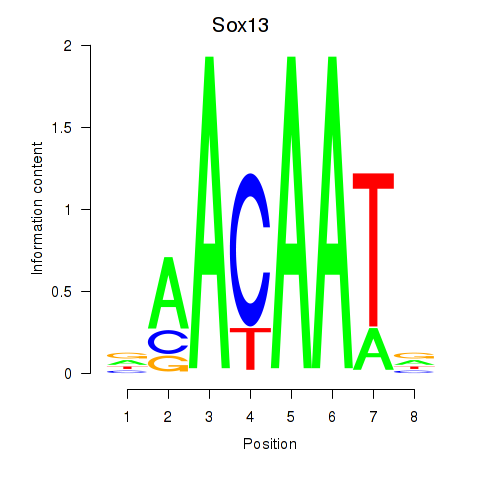
| Sox13 | -0.122 |
|
|
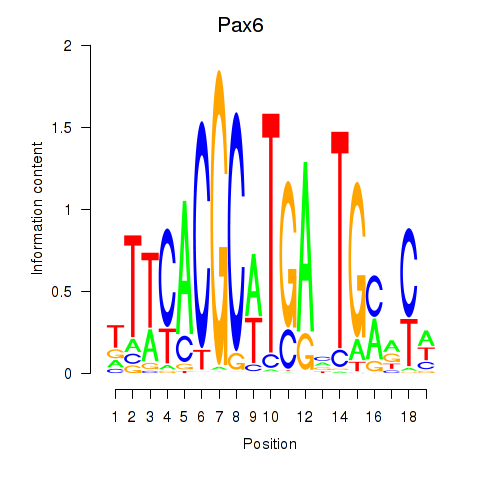
| Pax6 | -0.122 |
|
|
| Nfatc1 | -0.129 |
|
|
| Klf3 | -0.137 |
|
|
| Mafa | -0.137 |
|
|
| Klf13 | -0.139 |
|
|
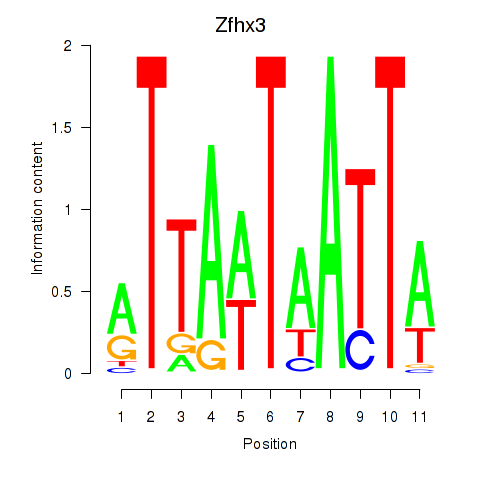
| Zfhx3 | -0.140 |
|
|
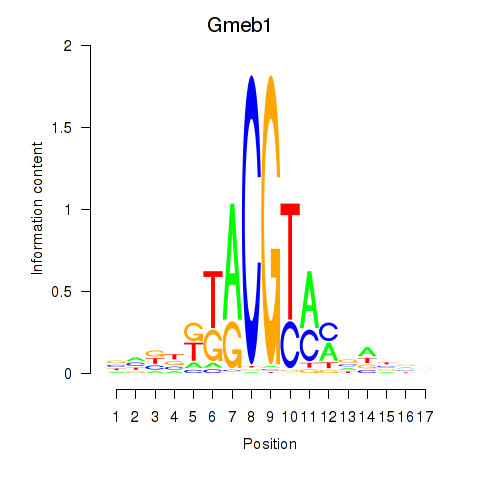
| Gmeb1 | -0.149 |
|
|
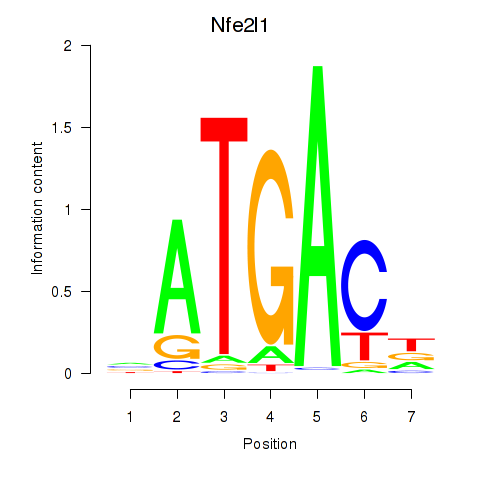
| Nfe2l1_Mafg | -0.153 |
|
|
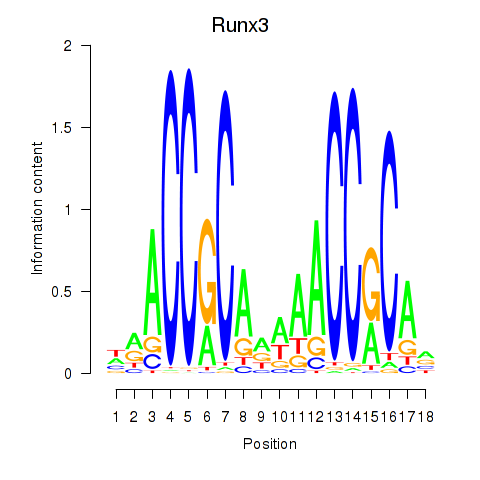
| Runx3 | -0.155 |
|
|
| Trp63 | -0.158 |
|
|
| Batf | -0.160 |
|
|
| Zfp410 | -0.165 |
|
|
| Sp2 | -0.169 |
|
|
| Hoxc13_Hoxd13 | -0.173 |
|
|
| Zfp652 | -0.173 |
|
|
| Pax1_Pax9 | -0.181 |
|
|
| Sox11 | -0.196 |
|
|
| Zbtb6 | -0.200 |
|
|
| Foxp2_Foxp3 | -0.200 |
|
|
| Sox1 | -0.200 |
|
|
| Smad2 | -0.204 |
|
|
| Vsx2_Dlx3 | -0.205 |
|
|
| Hes1 | -0.212 |
|
|
| Plag1 | -0.214 |
|
|
| Irf4 | -0.226 |
|
|
| Nfatc2 | -0.226 |
|
|
| Phox2a | -0.231 |
|
|
| Zfp110 | -0.232 |
|
|
| Sox3_Sox10 | -0.238 |
|
|
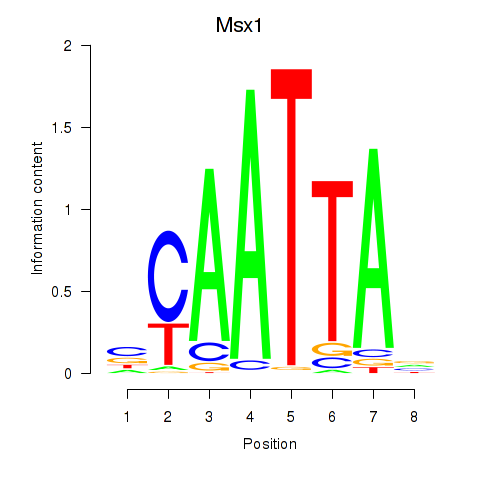
| Msx1_Lhx9_Barx1_Rax_Dlx6 | -0.242 |
|
|
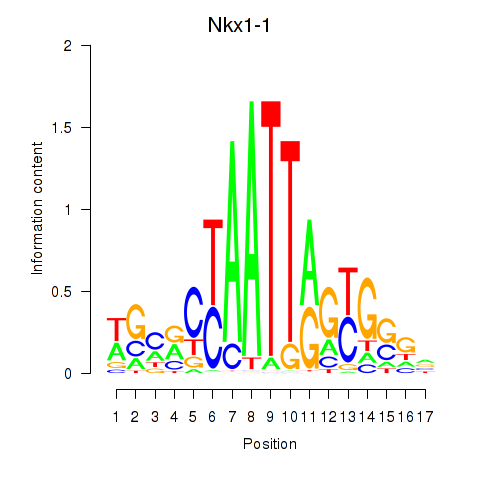
| Nkx1-1_Nkx1-2 | -0.251 |
|
|
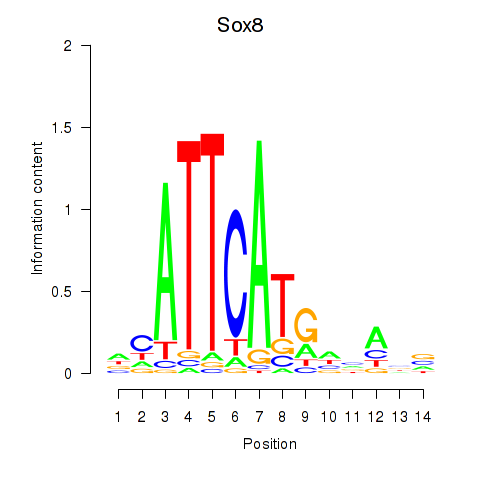
| Sox8 | -0.258 |
|
|
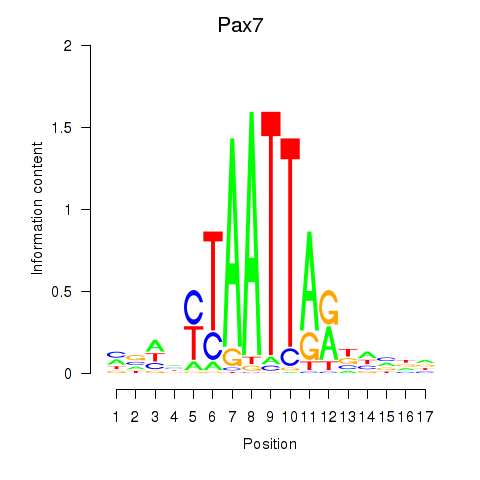
| Pax7 | -0.258 |
|
|
| Zic4 | -0.258 |
|
|
| Hoxb4 | -0.259 |
|
|
| Zkscan1 | -0.259 |
|
|
| Atf1_Creb5 | -0.263 |
|
|
| Crx_Gsc | -0.265 |
|
|
| Gbx2 | -0.274 |
|
|
| Foxl1 | -0.288 |
|
|
| Rorc_Nr1d1 | -0.295 |
|
|
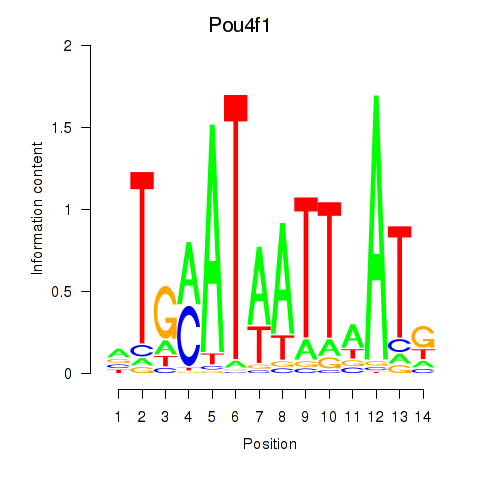
| Pou4f1_Pou6f1 | -0.300 |
|
|
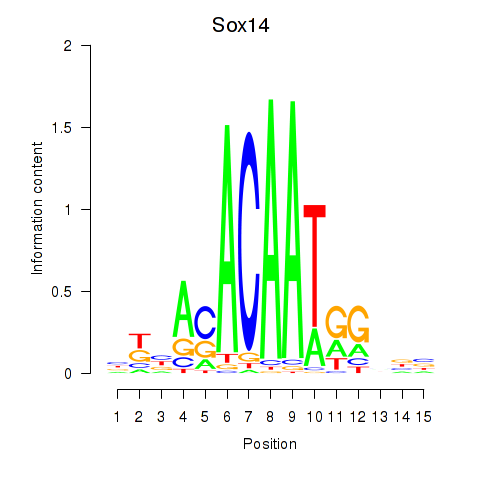
| Sox14 | -0.308 |
|
|
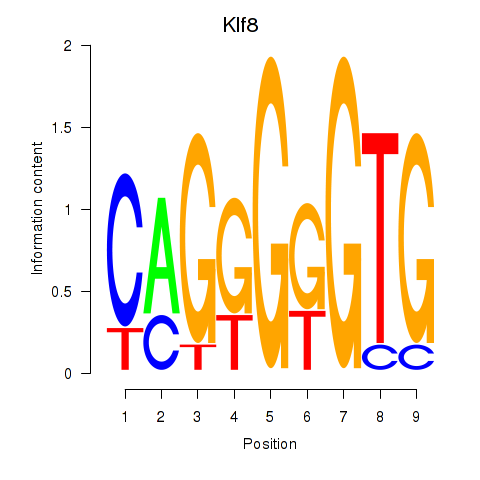
| Klf8 | -0.309 |
|
|
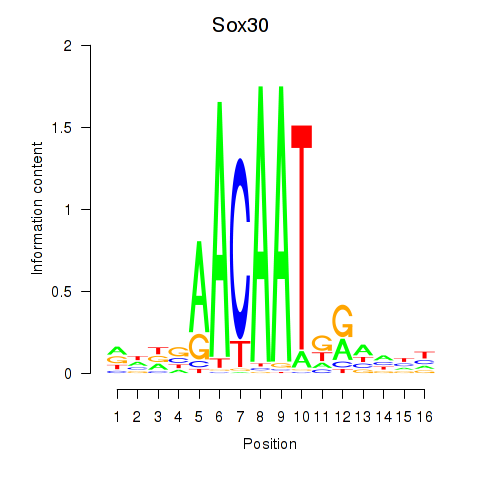
| Sox30 | -0.309 |
|
|
| Nfix | -0.311 |
|
|
| Pou2f1 | -0.317 |
|
|
| Rreb1 | -0.318 |
|
|
| Sox15 | -0.319 |
|
|
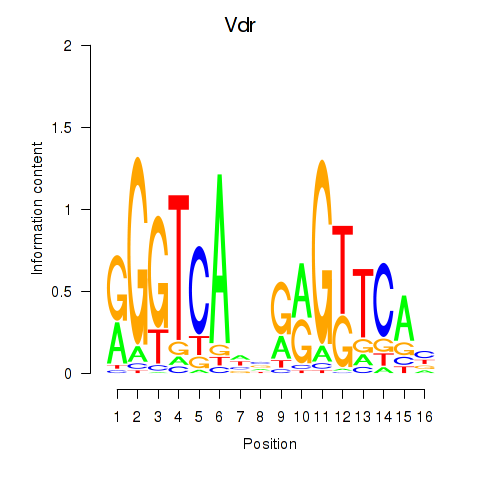
| Vdr | -0.322 |
|
|
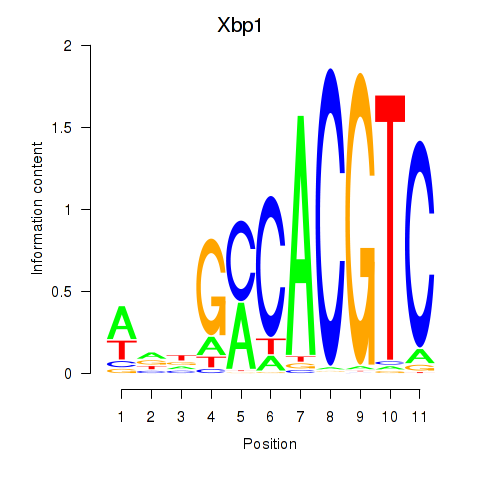
| Xbp1_Creb3l1 | -0.331 |
|
|
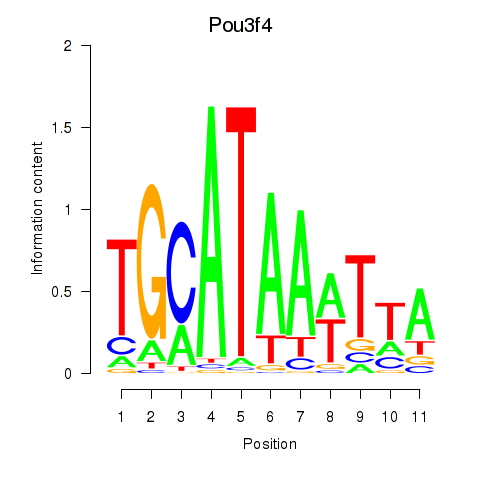
| Pou3f4 | -0.335 |
|
|
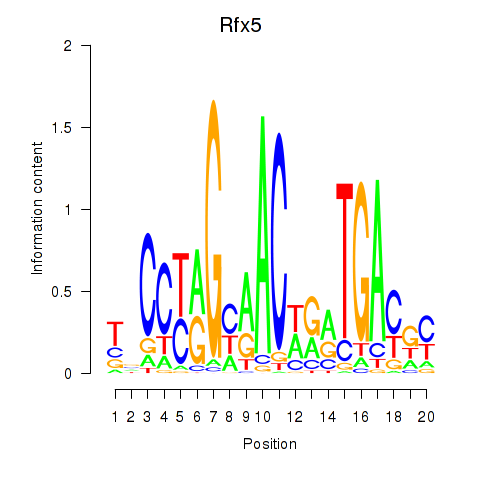
| Rfx5 | -0.337 |
|
|
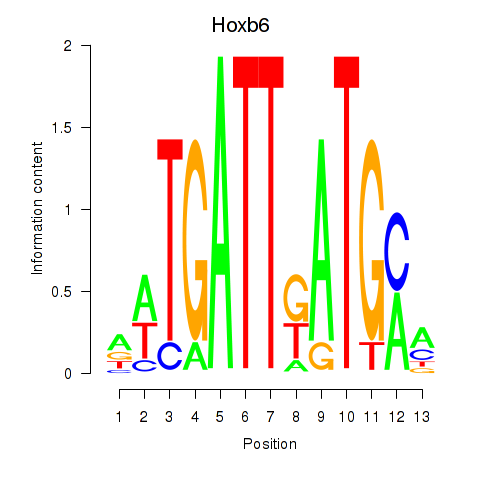
| Hoxb6 | -0.346 |
|
|
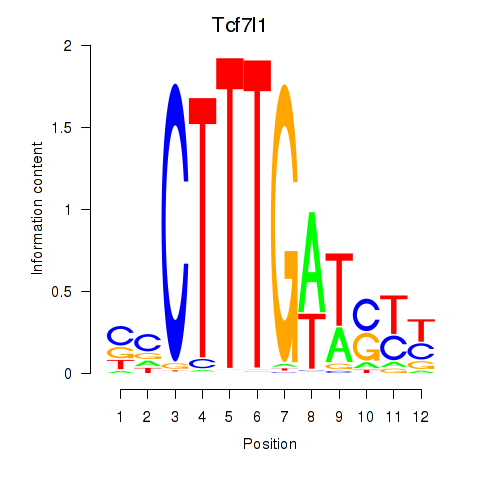
| Tcf7l1 | -0.349 |
|
|
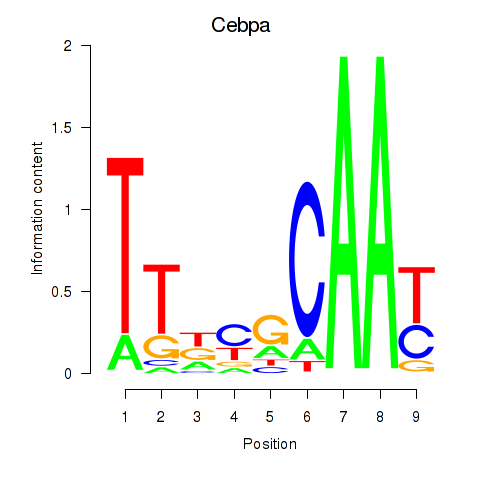
| Cebpa_Cebpg | -0.361 |
|
|
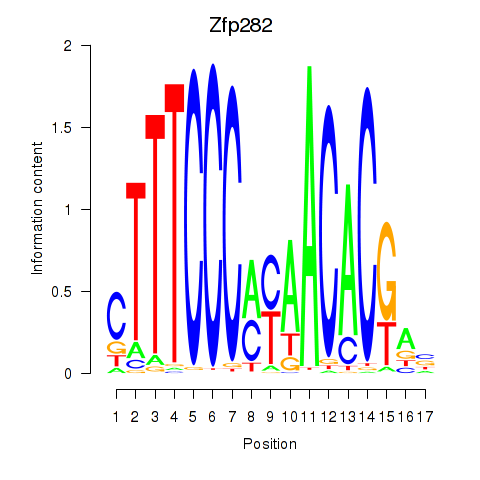
| Zfp282 | -0.361 |
|
|
| Hand1 | -0.383 |
|
|
| Rbpj | -0.387 |
|
|
| Foxc1 | -0.392 |
|
|
| Tfcp2l1 | -0.401 |
|
|
| Nkx2-5 | -0.402 |
|
|
| Atoh1_Bhlhe23 | -0.402 |
|
|
| Nanog | -0.404 |
|
|
| Rfx3_Rfx1_Rfx4 | -0.407 |
|
|
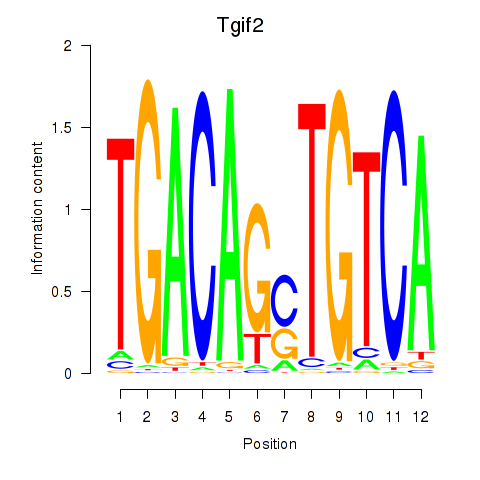
| Tgif2_Tgif2lx1_Tgif2lx2 | -0.410 |
|
|
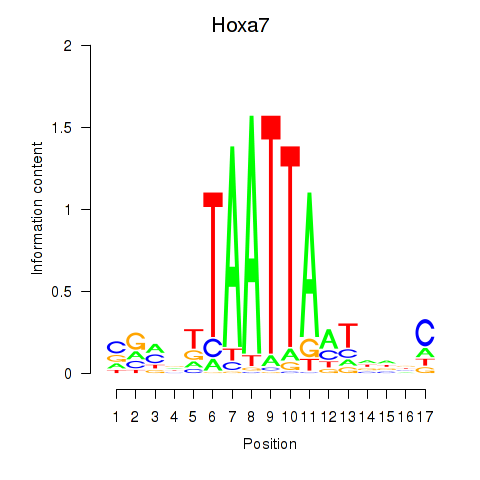
| Hoxa7_Hoxc8 | -0.424 |
|
|
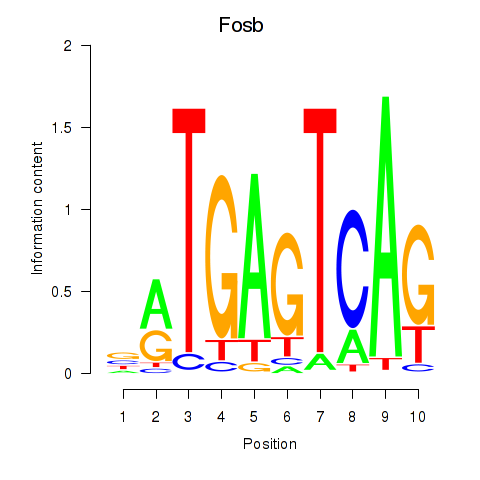
| Fosb | -0.428 |
|
|
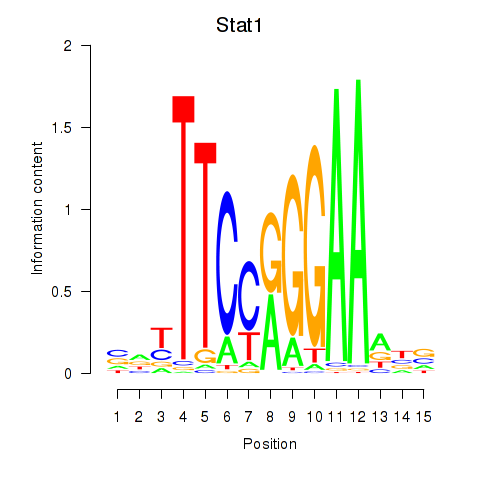
| Stat1 | -0.437 |
|
|
| Aire | -0.439 |
|
|
| Gli1 | -0.445 |
|
|
| Zfp524 | -0.451 |
|
|
| Nfkb2 | -0.466 |
|
|
| Sp100 | -0.483 |
|
|
| Ascl2 | -0.494 |
|
|
| Ppara | -0.495 |
|
|
| Gzf1 | -0.503 |
|
|
| Esr2 | -0.508 |
|
|
| Nkx2-6 | -0.515 |
|
|
| Olig2_Olig3 | -0.518 |
|
|
| Sox4 | -0.527 |
|
|
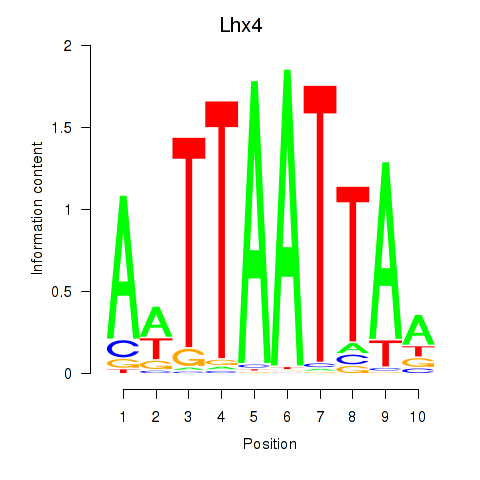
| Lhx4 | -0.527 |
|
|
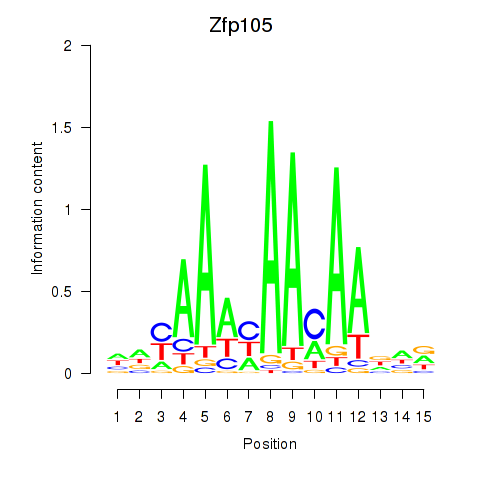
| Zfp105 | -0.531 |
|
|
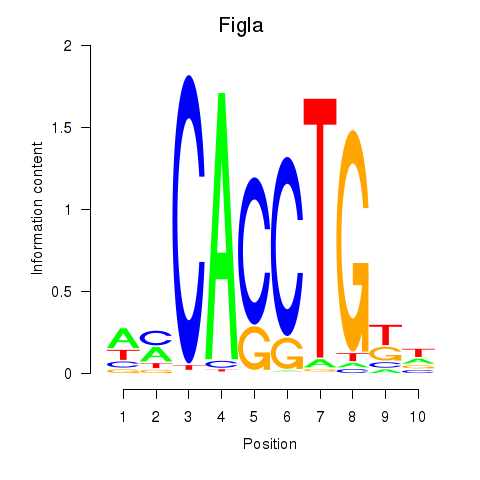
| Figla | -0.534 |
|
|
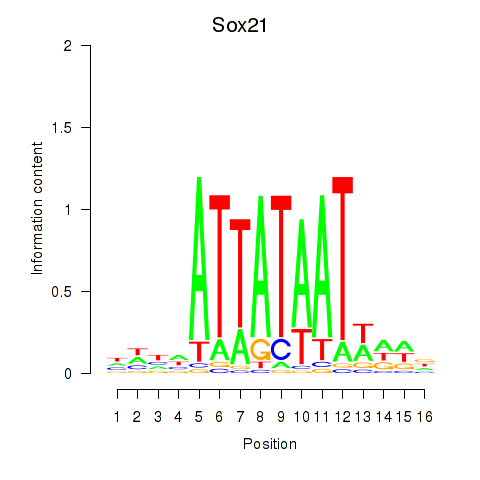
| Sox21 | -0.534 |
|
|
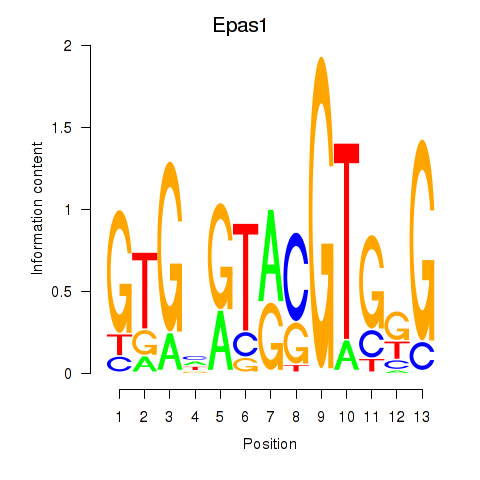
| Epas1_Bcl3 | -0.535 |
|
|
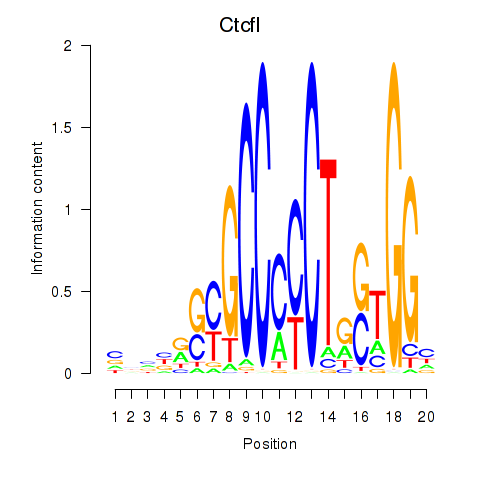
| Ctcfl_Ctcf | -0.539 |
|
|
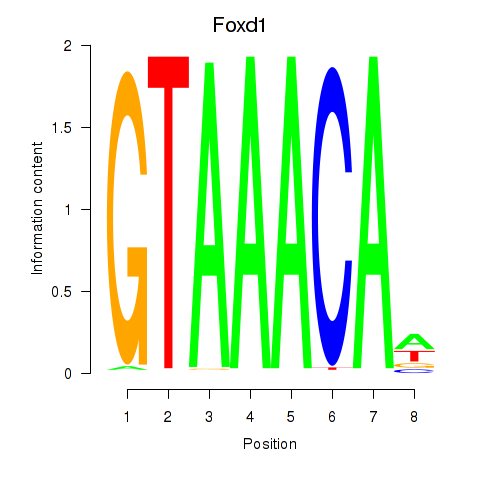
| Foxd1 | -0.542 |
|
|
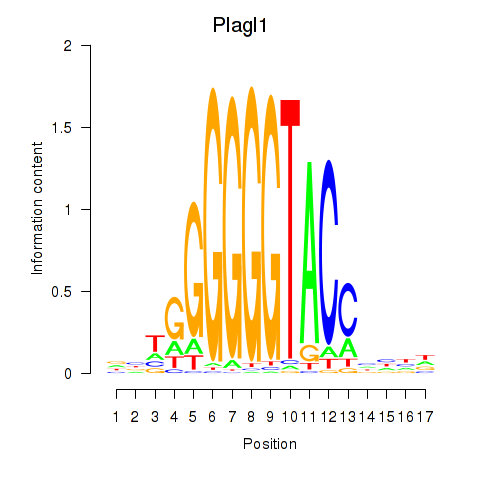
| Plagl1 | -0.556 |
|
|
| Hmx3 | -0.558 |
|
|
| Tfeb_Usf1_Srebf1_Usf2_Bhlhe41_Srebf2 | -0.561 |
|
|
| Ar | -0.562 |
|
|
| Tead1 | -0.564 |
|
|
| Elf3 | -0.568 |
|
|
| Hivep1 | -0.571 |
|
|
| Brca1 | -0.574 |
|
|
| Pou2f2_Pou3f1 | -0.582 |
|
|
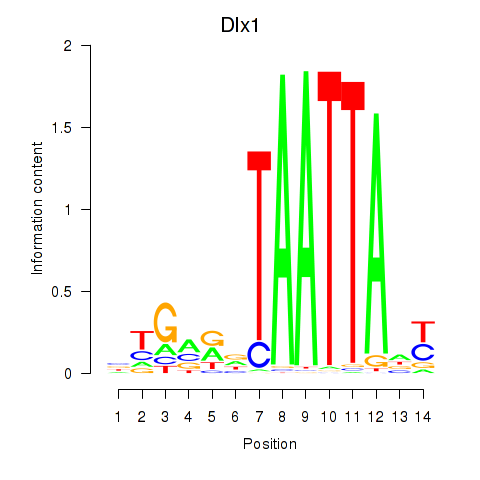
| Dlx1 | -0.595 |
|
|
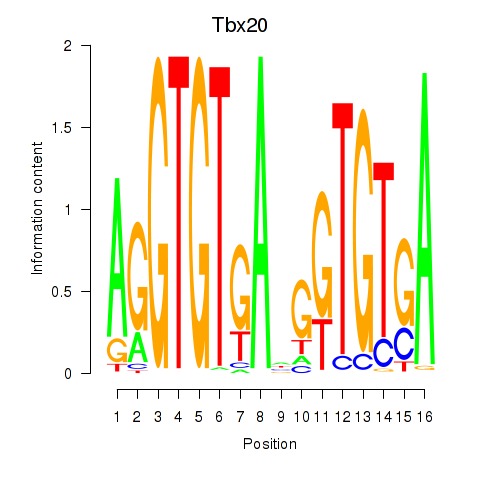
| Tbx20 | -0.598 |
|
|
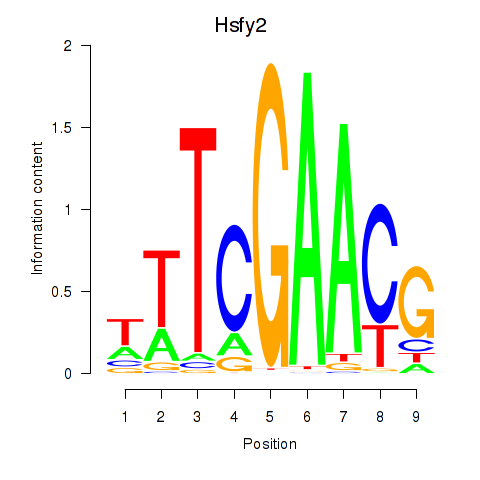
| Hsfy2 | -0.600 |
|
|
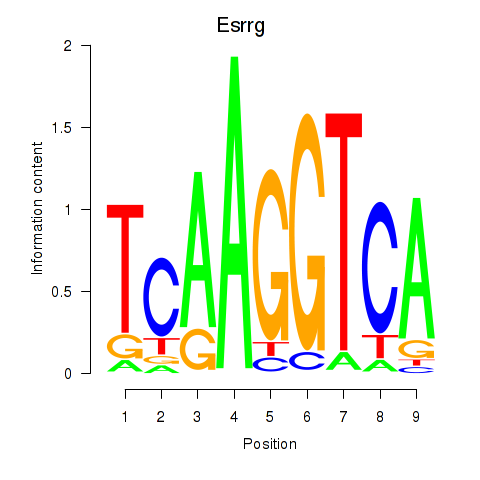
| Esrrg | -0.601 |
|
|
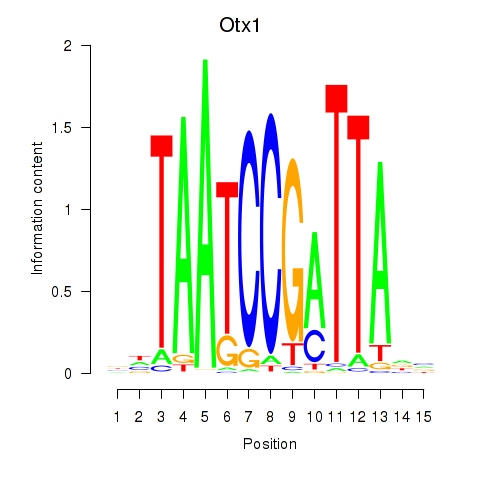
| Otx1 | -0.601 |
|
|
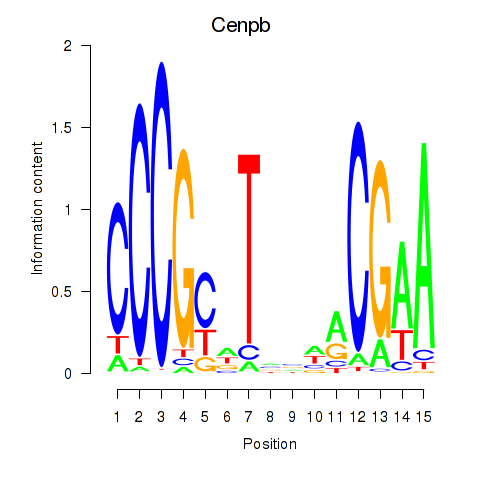
| Cenpb | -0.612 |
|
|
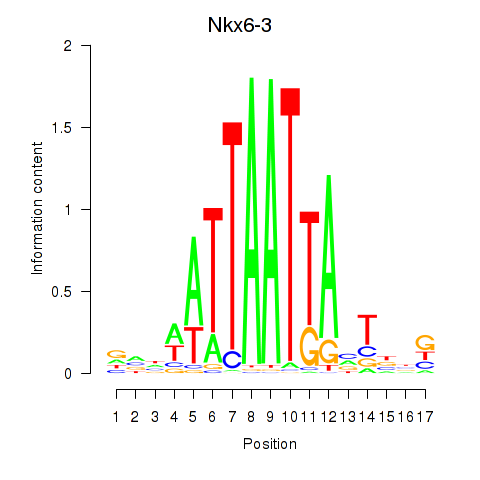
| Nkx6-3_Dbx2_Barx2 | -0.613 |
|
|
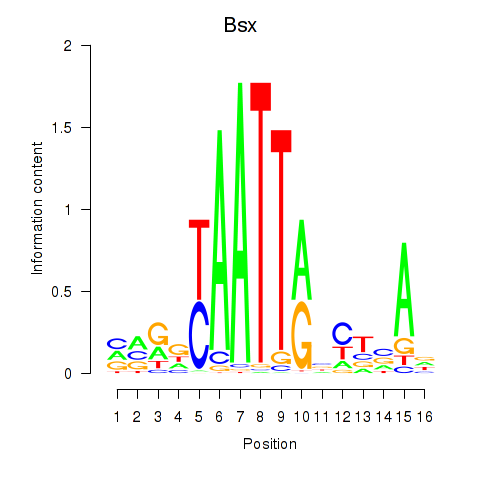
| Bsx | -0.622 |
|
|
| Nr4a3 | -0.640 |
|
|
| Zbtb18 | -0.641 |
|
|
| Dlx5_Dlx4 | -0.646 |
|
|
| Gli3_Zic1 | -0.652 |
|
|
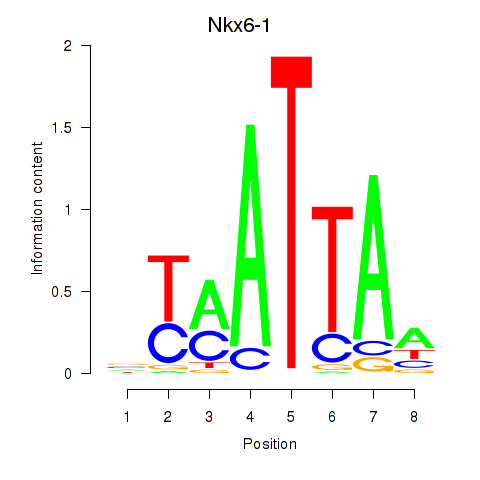
| Nkx6-1_Evx1_Hesx1 | -0.655 |
|
|
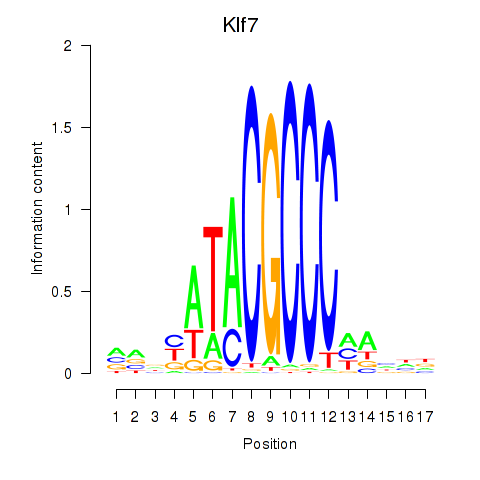
| Klf7 | -0.658 |
|
|
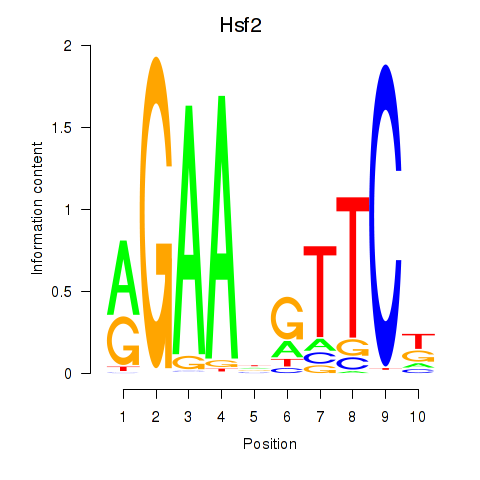
| Hsf2 | -0.660 |
|
|
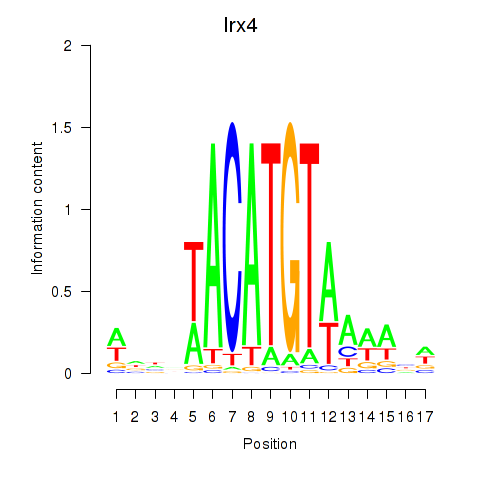
| Irx4 | -0.670 |
|
|
| Pou3f3 | -0.691 |
|
|
| Nkx2-1 | -0.699 |
|
|
| Foxd2 | -0.709 |
|
|
| Msx3 | -0.710 |
|
|
| Cpeb1 | -0.710 |
|
|
| Hif1a | -0.713 |
|
|
| Zbtb7c | -0.718 |
|
|
| Hoxd9 | -0.722 |
|
|
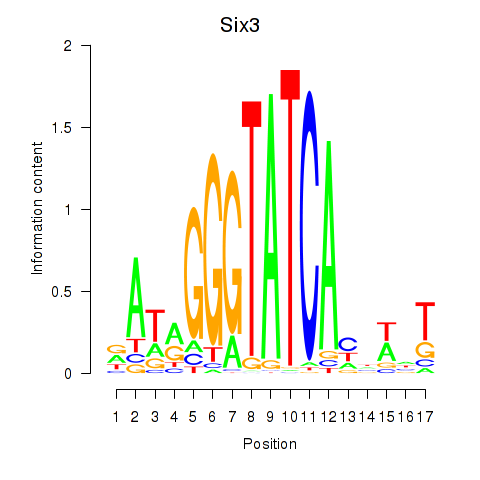
| Six3_Six1_Six2 | -0.730 |
|
|
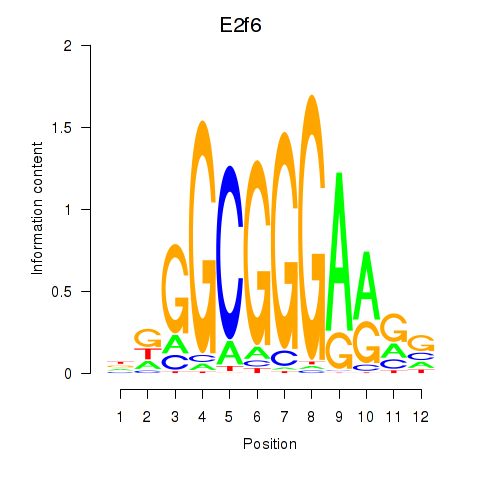
| E2f6 | -0.736 |
|
|
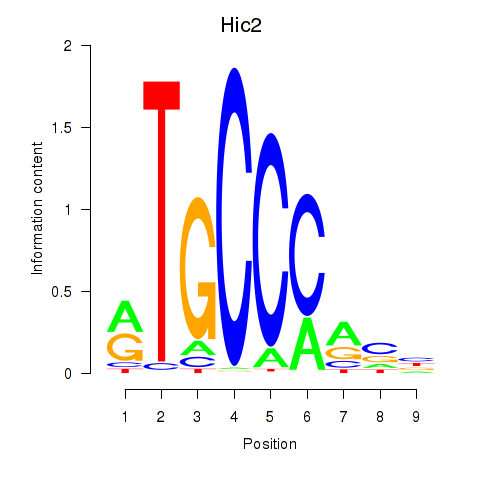
| Hic2 | -0.740 |
|
|
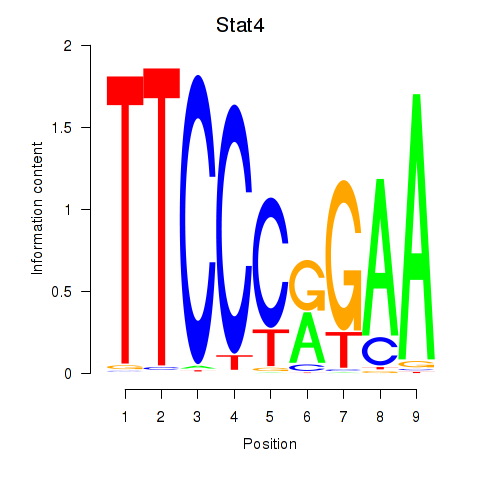
| Stat4_Stat3_Stat5b | -0.747 |
|
|
| Egr4 | -0.749 |
|
|
| Hoxd1 | -0.758 |
|
|
| Pax4 | -0.760 |
|
|
| Ikzf2 | -0.762 |
|
|
| Gata6 | -0.813 |
|
|
| Hoxc10 | -0.829 |
|
|
| Runx1 | -0.833 |
|
|
| Mga | -0.866 |
|
|
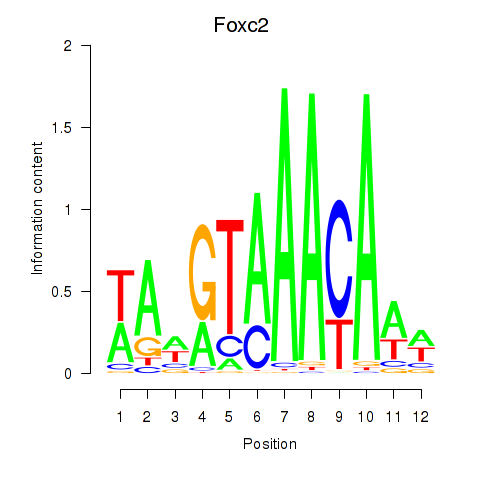
| Foxc2 | -0.869 |
|
|
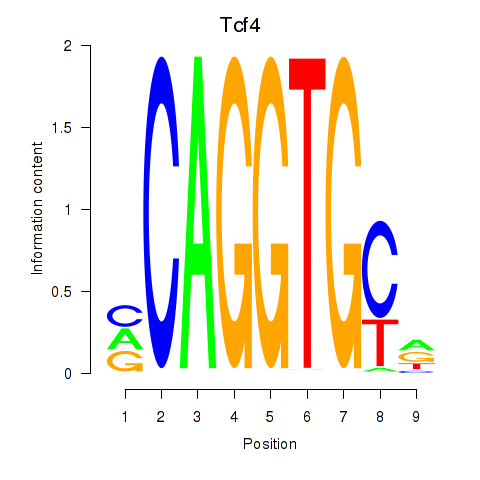
| Tcf4_Mesp1 | -0.885 |
|
|
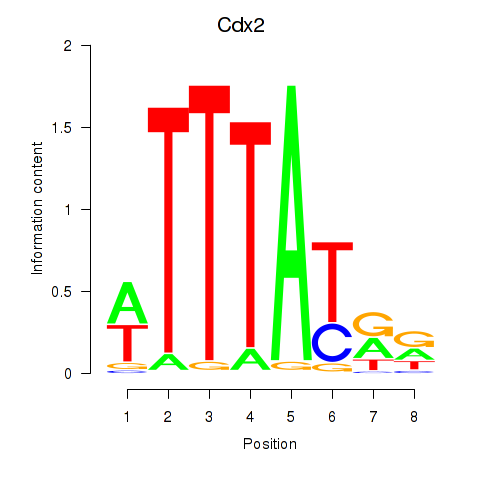
| Cdx2 | -0.900 |
|
|
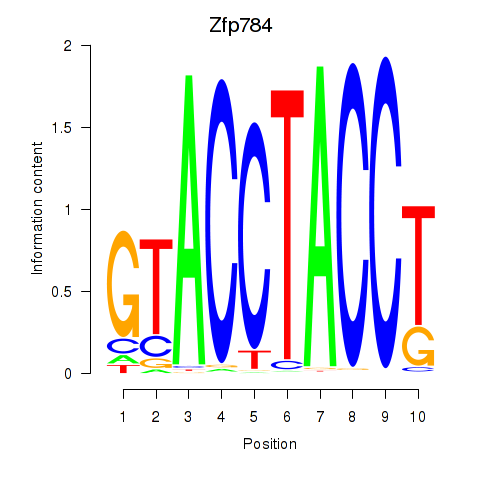
| Zfp784 | -0.912 |
|
|
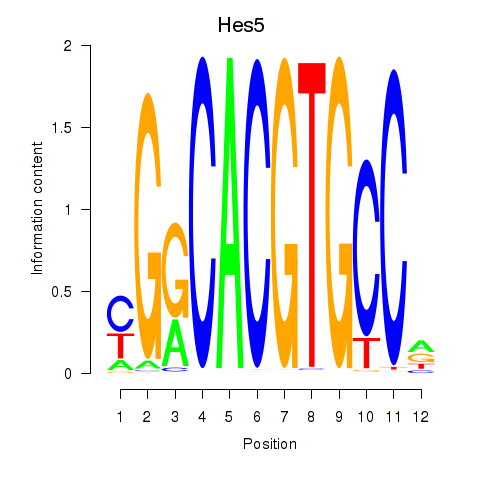
| Hes5_Hes7 | -0.914 |
|
|
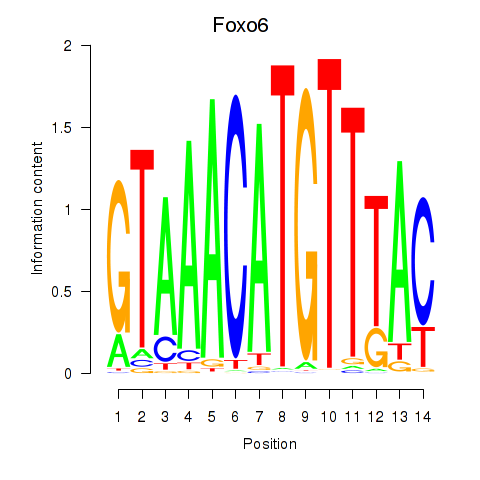
| Foxo6 | -0.918 |
|
|
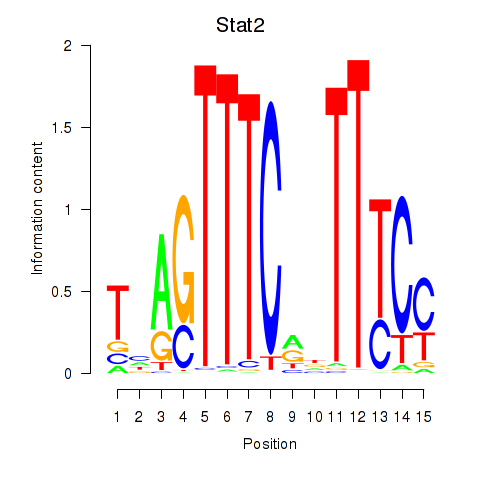
| Stat2 | -0.920 |
|
|
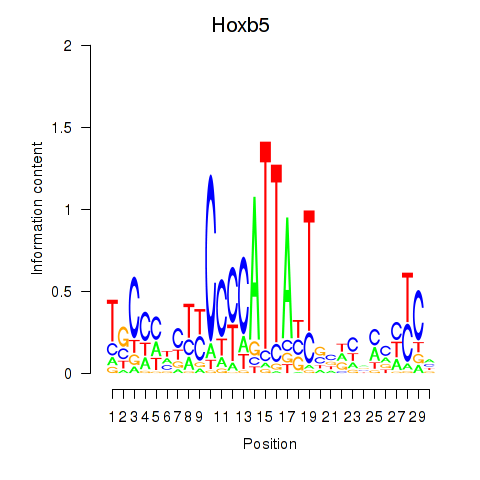
| Hoxb5 | -0.925 |
|
|
| Irf3 | -0.925 |
|
|
| Zfp423 | -0.937 |
|
|
| Gcm2 | -0.939 |
|
|
| Rfx2_Rfx7 | -0.953 |
|
|
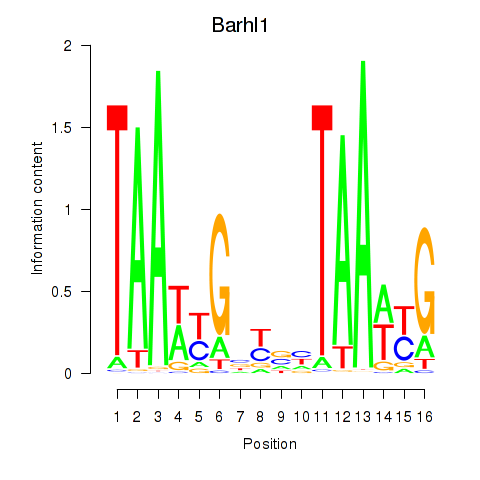
| Barhl1 | -0.966 |
|
|
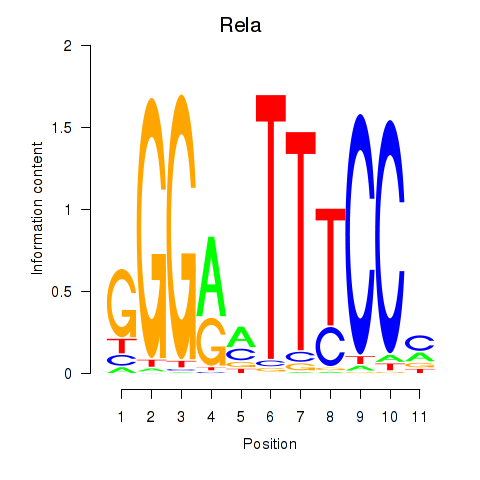
| Rela_Rel_Nfkb1 | -0.981 |
|
|
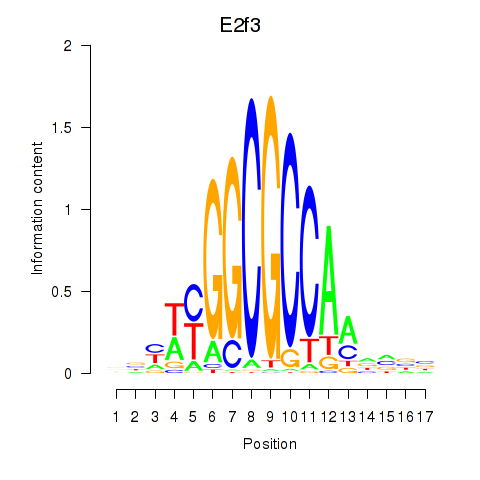
| E2f3 | -0.987 |
|
|
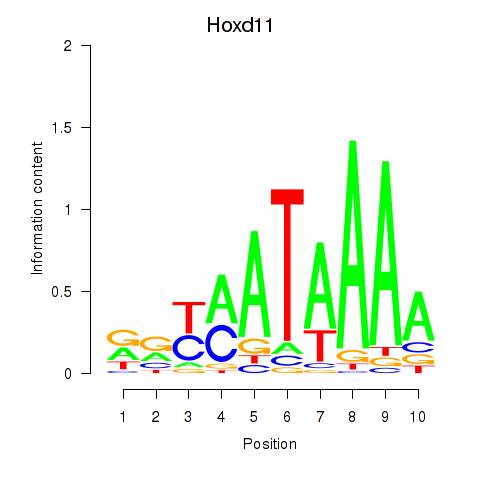
| Hoxd11_Cdx1_Hoxc11 | -0.996 |
|
|
| Mzf1 | -1.007 |
|
|
| Zkscan3 | -1.020 |
|
|
| Mnx1_Lhx6_Lmx1a | -1.053 |
|
|
| Ubp1 | -1.059 |
|
|
| Myod1 | -1.065 |
|
|
| Zfp128 | -1.066 |
|
|
| Etv1_Etv5_Gabpa | -1.068 |
|
|
| Smad1 | -1.085 |
|
|
| Glis2 | -1.090 |
|
|
| Nr2e3 | -1.090 |
|
|
| Pbx1_Pbx3 | -1.107 |
|
|
| Atf4 | -1.108 |
|
|
| Nr2c1 | -1.117 |
|
|
| Etv4 | -1.121 |
|
|
| Hey2 | -1.167 |
|
|
| Trp73 | -1.175 |
|
|
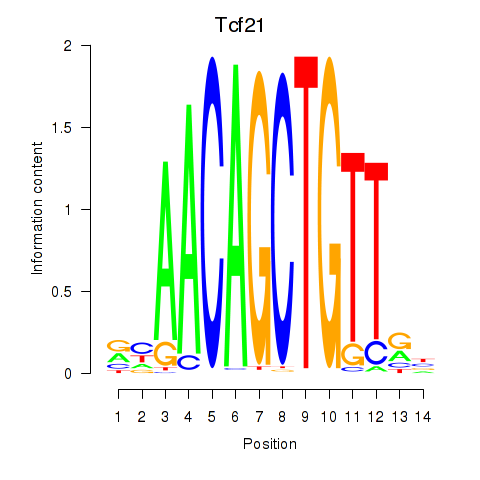
| Tcf21_Msc | -1.179 |
|
|
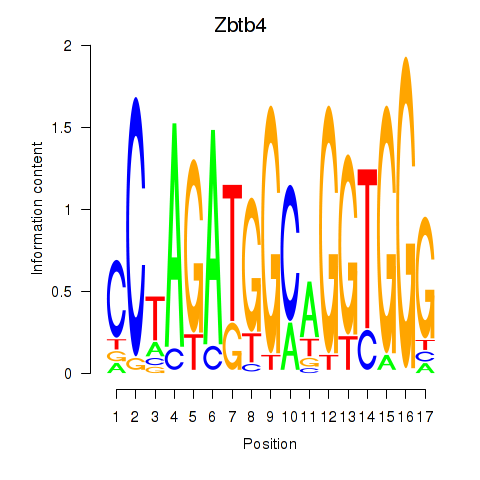
| Zbtb4 | -1.207 |
|
|
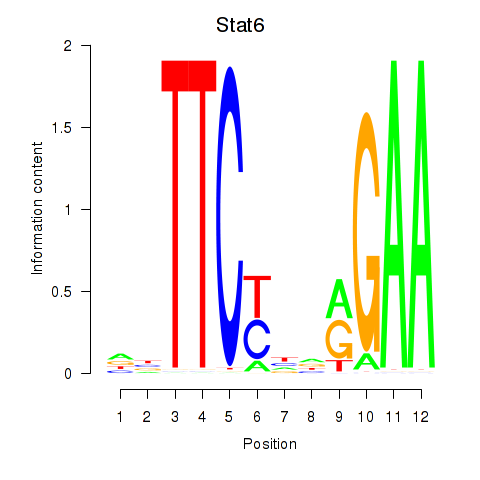
| Stat6 | -1.207 |
|
|
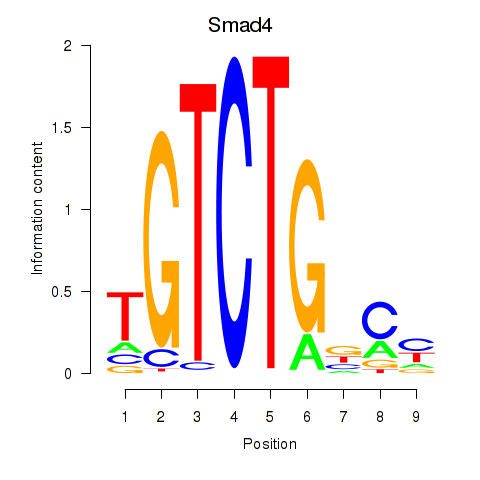
| Smad4 | -1.217 |
|
|
| Fosl2_Bach2 | -1.223 |
|
|
| Trp53 | -1.227 |
|
|
| Pou5f1 | -1.237 |
|
|
| Alx4 | -1.253 |
|
|
| Nkx3-2 | -1.294 |
|
|
| Nkx6-2 | -1.301 |
|
|
| Zfp691 | -1.305 |
|
|
| Rarg | -1.338 |
|
|
| Bcl6 | -1.377 |
|
|
| Egr1 | -1.392 |
|
|
| Nkx3-1 | -1.469 |
|
|
| Maff | -1.517 |
|
|
| Tfap2b | -1.523 |
|
|
| Foxk1_Foxj1 | -1.541 |
|
|
| Prox1 | -1.565 |
|
|
| Zbtb7a | -1.586 |
|
|
| Insm1 | -1.593 |
|
|
| Zic2 | -1.618 |
|
|
| Tlx2 | -1.645 |
|
|
| Pou2f3 | -1.648 |
|
|
| Esr1 | -1.658 |
|
|
| Nr2f6 | -1.660 |
|
|
| Hinfp | -1.669 |
|
|
| Mnt | -1.736 |
|
|
| Fos | -1.746 |
|
|
| Myog_Tcf12 | -1.761 |
|
|
| Hmx1 | -1.766 |
|
|
| Srf | -1.831 |
|
|
| Tbx5 | -1.864 |
|
|
| Cebpb | -1.878 |
|
|
| Gata4 | -1.910 |
|
|
| Snai1_Zeb1_Snai2 | -1.919 |
|
|
| Tfap2c | -1.941 |
|
|
| Nr5a2 | -1.942 |
|
|
| Tbx21 | -1.950 |
|
|
| Six6 | -1.968 |
|
|
| Tcf3 | -2.013 |
|
|
| E2f7 | -2.053 |
|
|
| Nfic_Nfib | -2.168 |
|
|
| Klf1 | -2.216 |
|
|
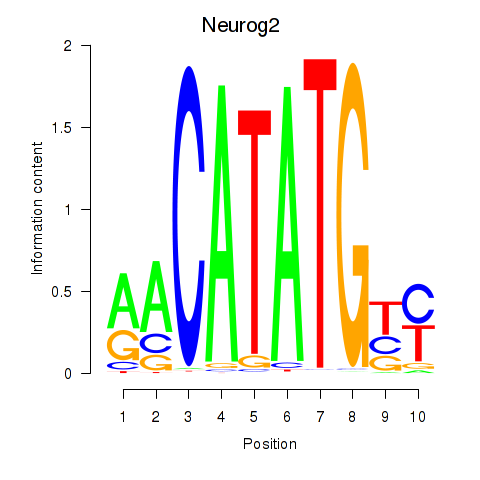
| Neurog2 | -2.240 |
|
|
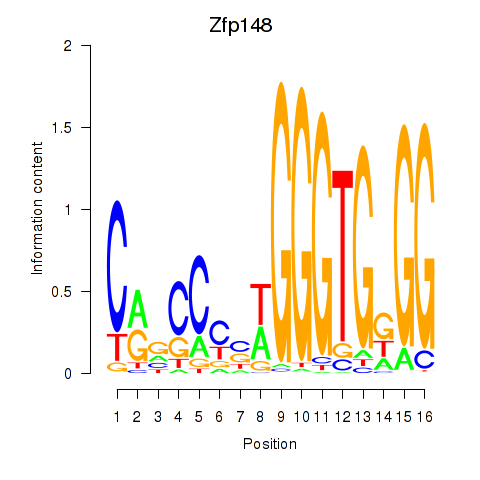
| Zfp148 | -2.291 |
|
|
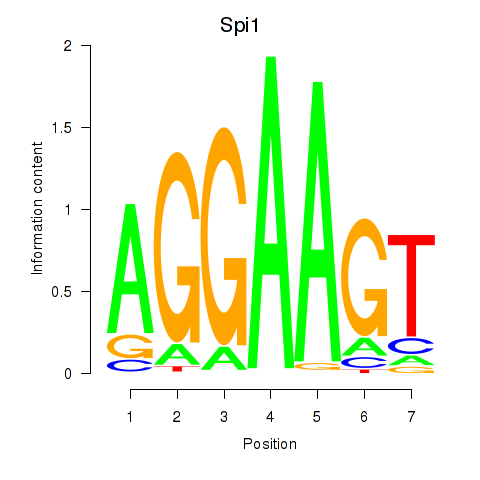
| Spi1 | -2.292 |
|
|
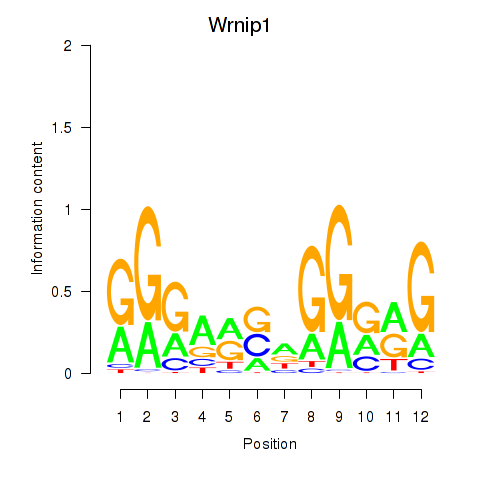
| Wrnip1_Mta3_Rcor1 | -2.378 |
|
|
| Max_Mycn | -2.423 |
|
|
| Creb3l2 | -2.433 |
|
|
| Ptf1a | -2.434 |
|
|
| Ebf3 | -2.454 |
|
|
| Ebf1 | -2.488 |
|
|
| Mybl2 | -2.682 |
|
|
| Foxj3_Tbl1xr1 | -2.738 |
|
|
| Mtf1 | -2.776 |
|
|
| Gata5 | -2.808 |
|
|
| Tfcp2 | -2.814 |
|
|
| Klf4_Sp3 | -2.838 |
|
|
| Ets1 | -2.876 |
|
|
| Myb | -2.914 |
|
|
| Pitx2_Otx2 | -3.029 |
|

|
| Erg | -3.144 |
|
|
| Tfdp1_Wt1_Egr2 | -3.151 |
|
|
| Spib | -3.198 |
|
|
| E2f8 | -3.334 |
|
|
| Maz_Zfp281 | -3.473 |
|
|
| Mybl1 | -3.580 |
|
|
| Elf1_Elf2_Etv2_Elf4 | -3.822 |
|
|
| Sox2 | -3.904 |
|
|
| Runx2_Bcl11a | -4.114 |
|
|
| Tal1 | -4.236 |
|
|
| Tbp | -4.416 |
|

|
| Spic | -4.434 |
|
|
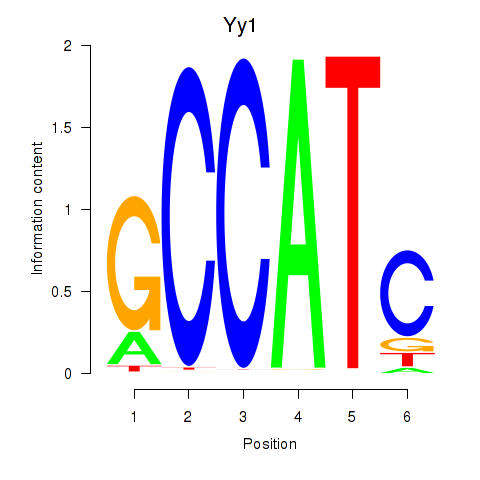
| Yy1_Yy2 | -4.913 |
|
|
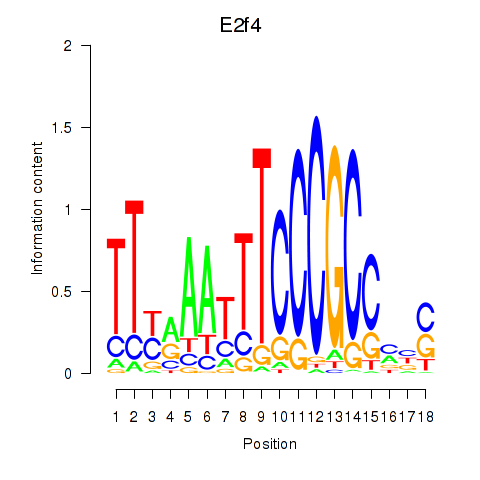
| E2f4 | -5.331 |
|
|
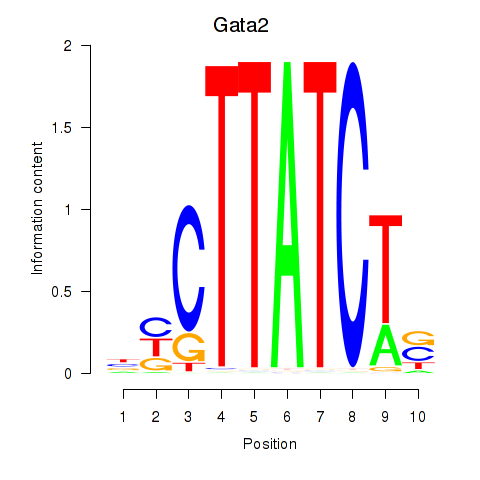
| Gata2_Gata1 | -5.938 |
|
|
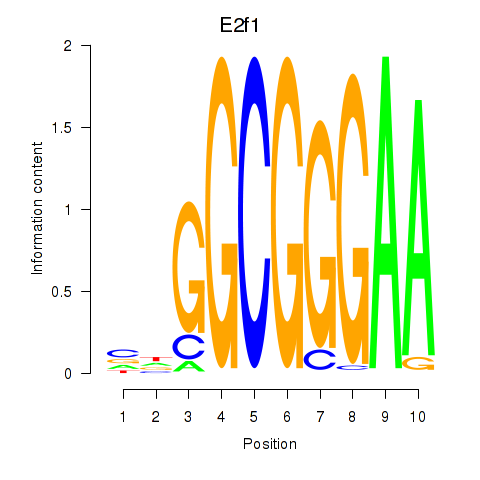
| E2f1 | -6.042 |
|
|
| Ybx1_Nfya_Nfyb_Nfyc_Cebpz | -6.114 |
|
|
| E2f2_E2f5 | -8.310 |
|
|