Project
Inflammatory response time course, HUVEC (Wada, 2009)
Navigation
Downloads
Sample name: TNFa_3h_15min
Sorted Z-values for TNFa_3h_15min
| WM name | Z-value | Associated genes | Logo |
|---|---|---|---|
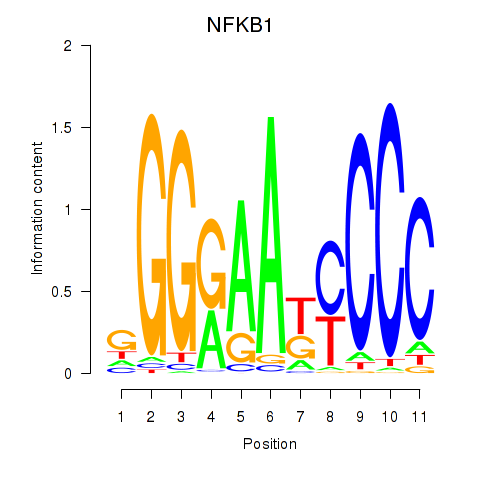
| NFKB1 | 4.151 |
|
|
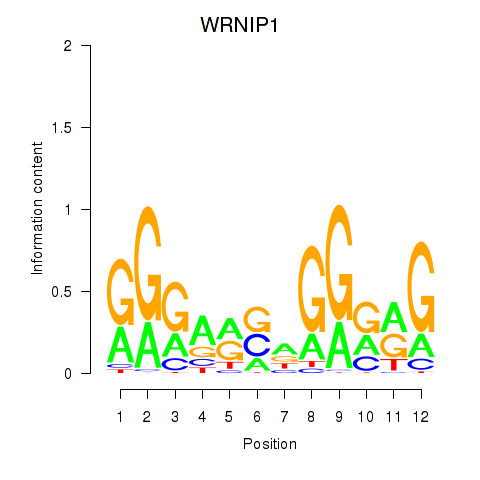
| WRNIP1 | 3.768 |
|
|
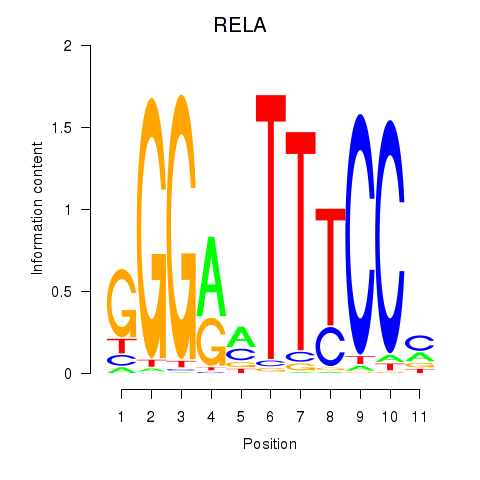
| RELA | 3.684 |
|
|
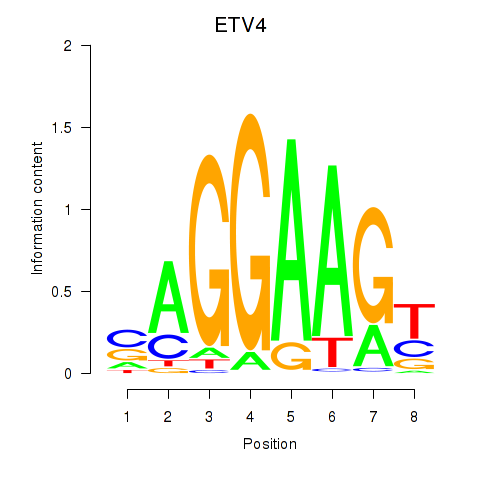
| ETV4_ETS2 | 3.337 |
|
|
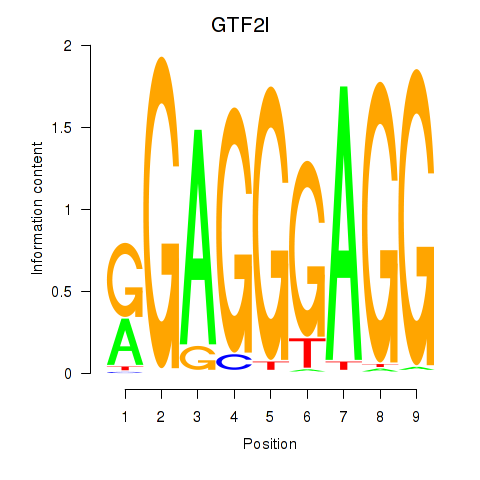
| GTF2I | 3.336 |
|
|
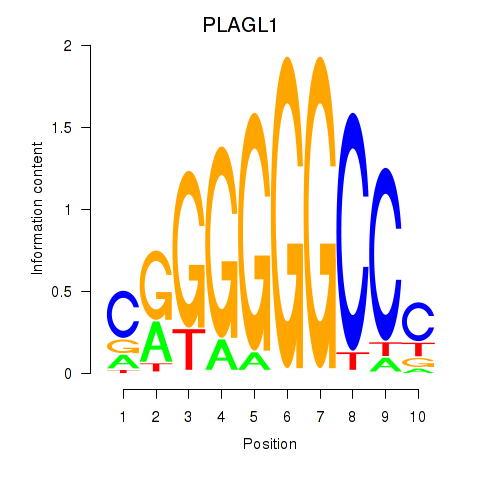
| PLAGL1 | 3.166 |
|
|
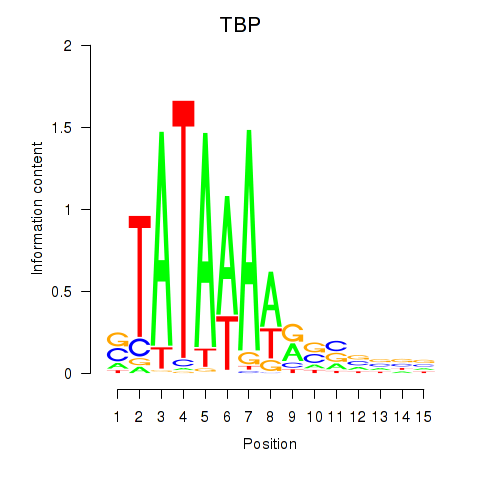
| TBP | 3.029 |
|
|
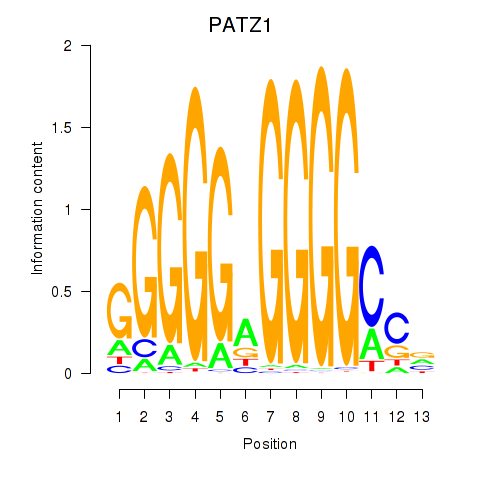
| PATZ1_KLF4 | 3.024 |
|
|
| HIC2 | 3.003 |
|
|
| EGR3_EGR2 | 2.981 |
|
|
| HIVEP1 | 2.874 |
|
|
| GATA3 | 2.591 |
|
|
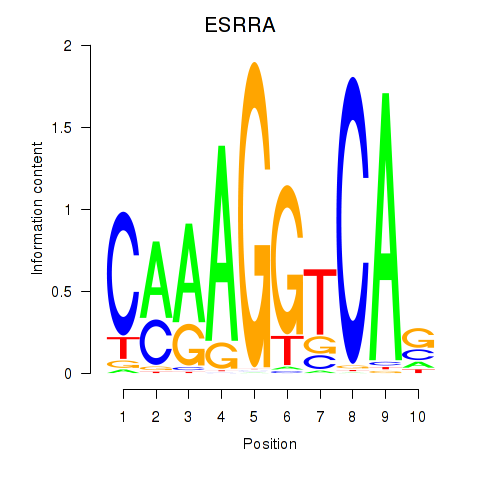
| ESRRA_ESR2 | 2.342 |
|
|
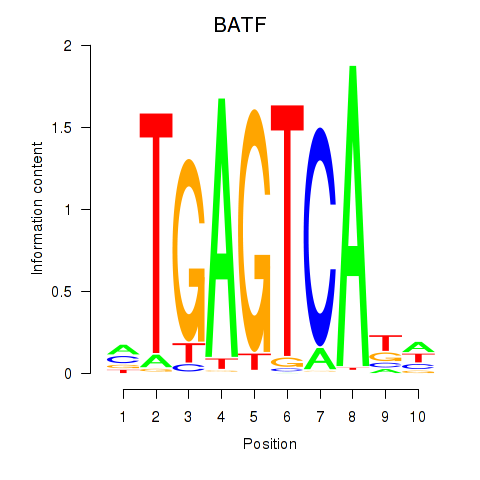
| BATF | 2.326 |
|
|
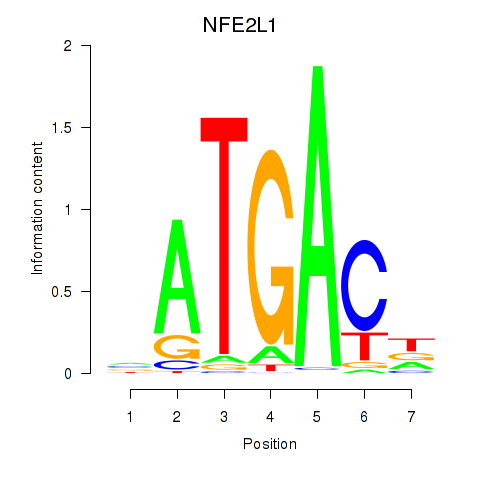
| NFE2L1 | 2.288 |
|
|
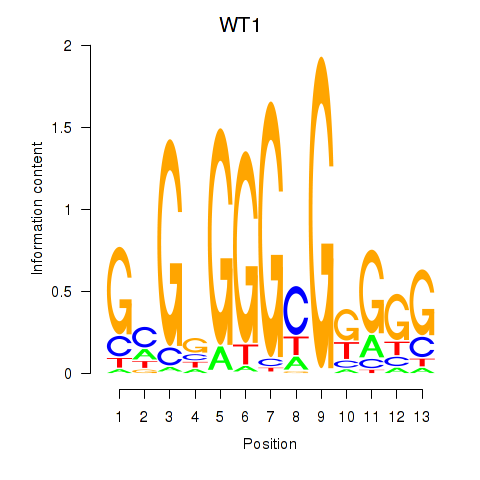
| WT1_MTF1_ZBTB7B | 2.275 |
|
|
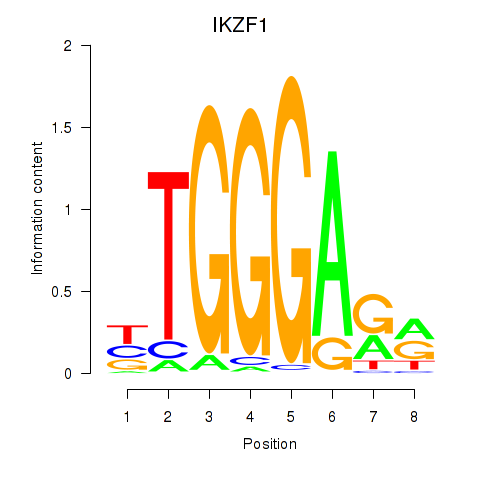
| IKZF1 | 2.239 |
|
|
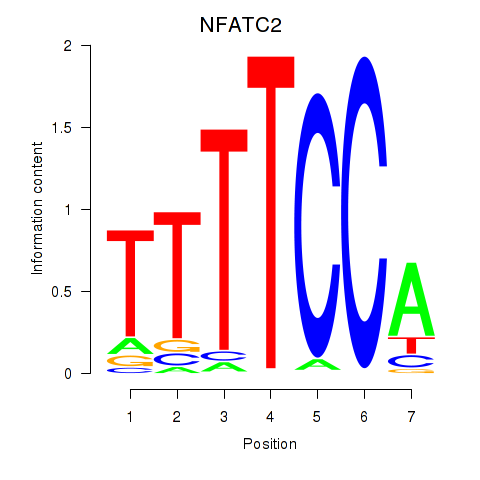
| NFATC2_NFATC3 | 2.210 |
|
|
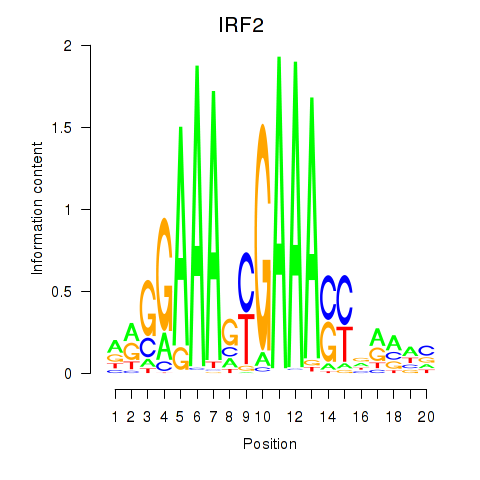
| IRF2_STAT2_IRF8_IRF1 | 2.175 |
|
|
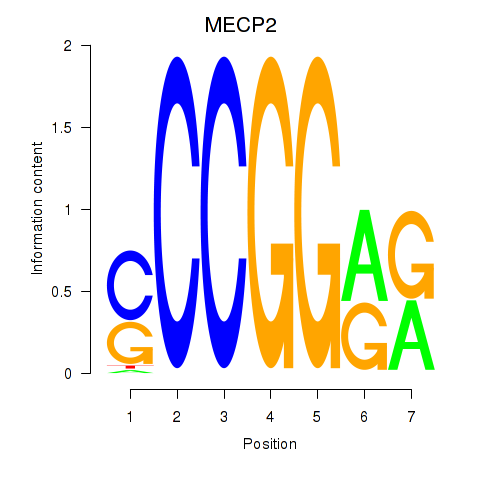
| MECP2 | 2.016 |
|
|
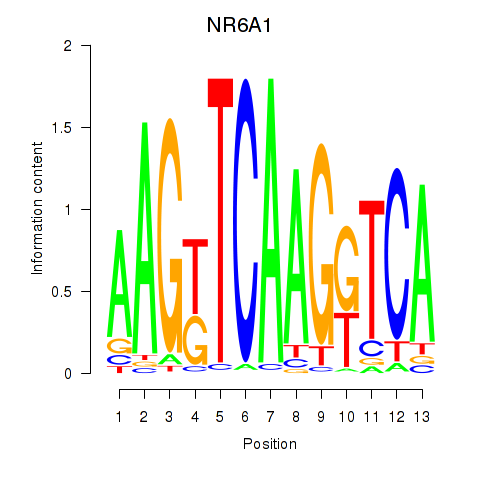
| NR6A1 | 1.820 |
|
|
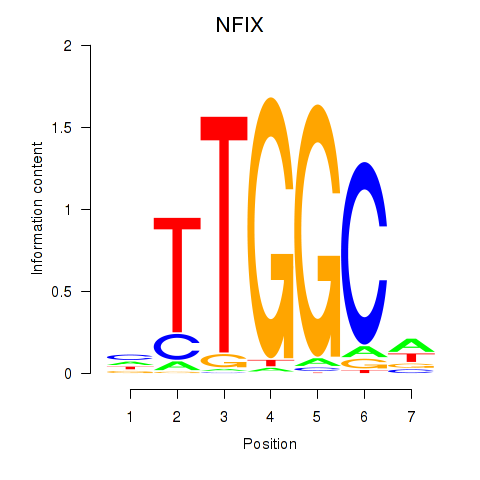
| NFIX_NFIB | 1.819 |
|
|
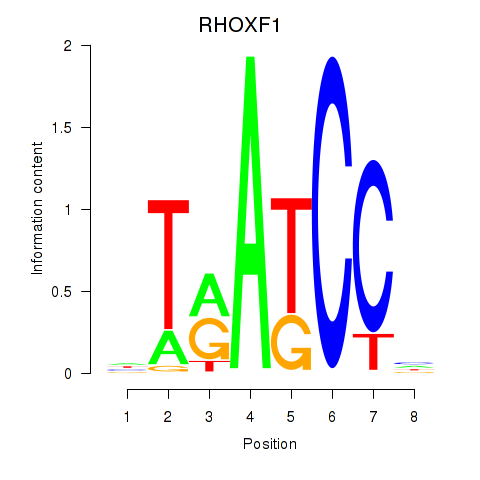
| RHOXF1 | 1.818 |
|
|
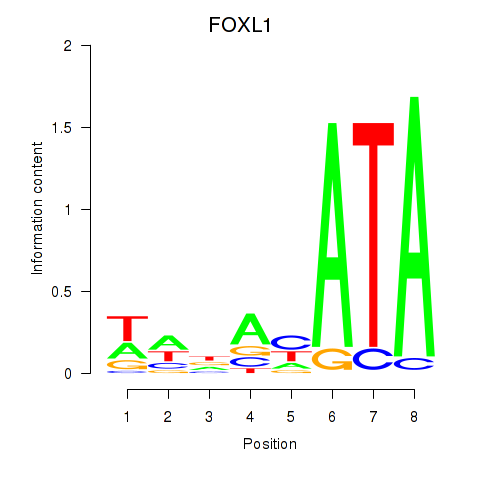
| FOXL1 | 1.799 |
|
|
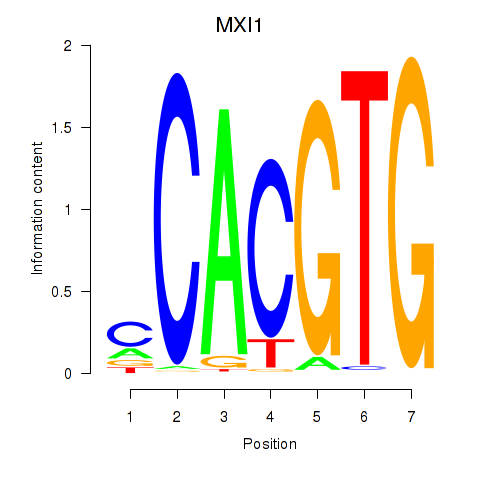
| MXI1_MYC_MYCN | 1.793 |
|
|
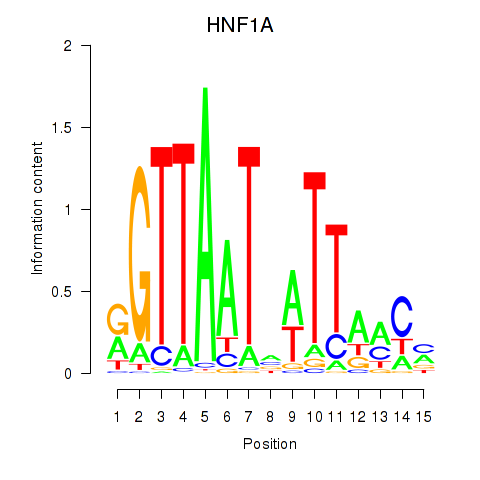
| HNF1A_HNF1B | 1.752 |
|
|
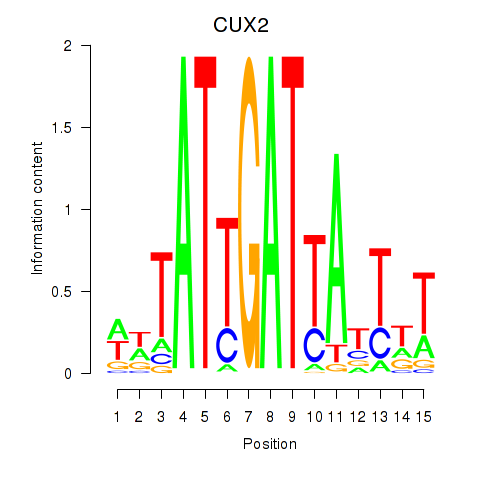
| CUX2 | 1.705 |
|
|
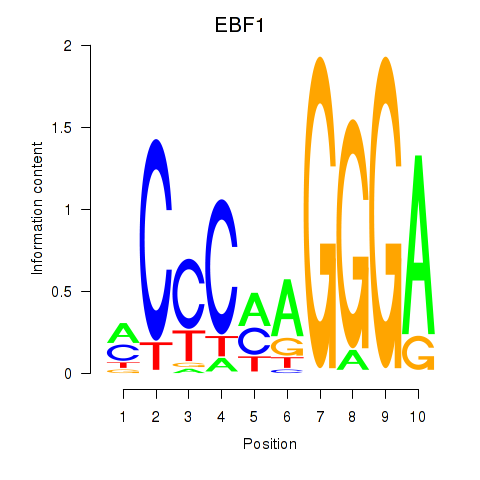
| EBF1 | 1.695 |
|
|
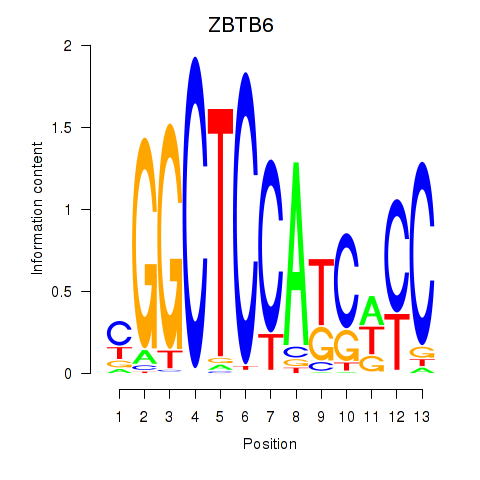
| ZBTB6 | 1.592 |
|
|
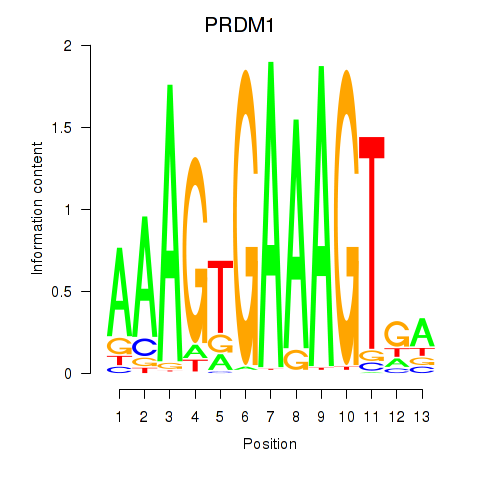
| PRDM1 | 1.591 |
|
|
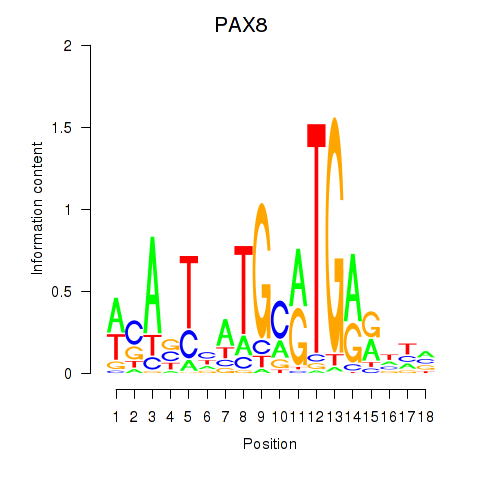
| PAX8 | 1.586 |
|
|
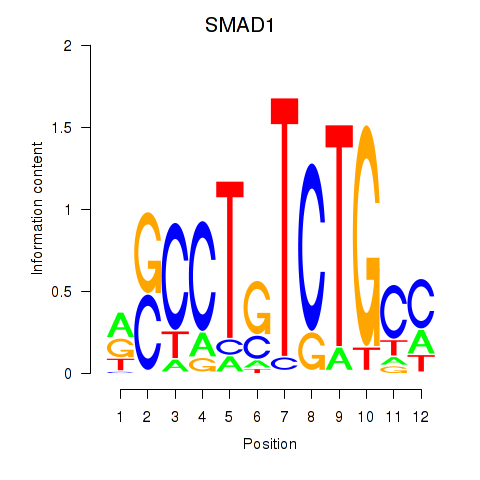
| SMAD1 | 1.581 |
|
|
| SP3 | 1.558 |
|
|
| SOX3_SOX2 | 1.557 |
|
|
| MZF1 | 1.556 |
|
|
| EZH2 | 1.539 |
|
|
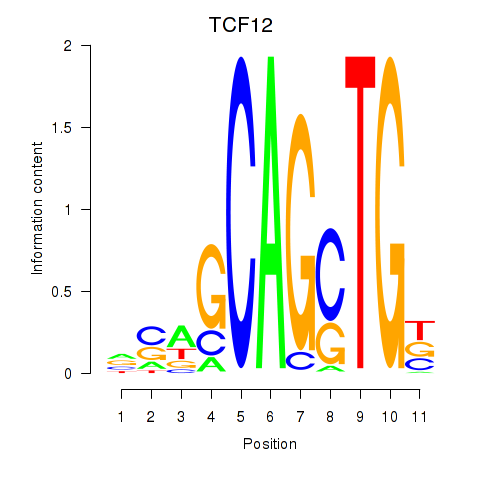
| TCF12_ASCL2 | 1.526 |
|
|
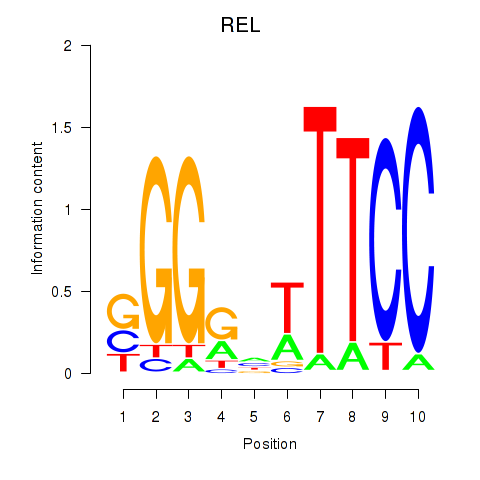
| REL | 1.517 |
|
|
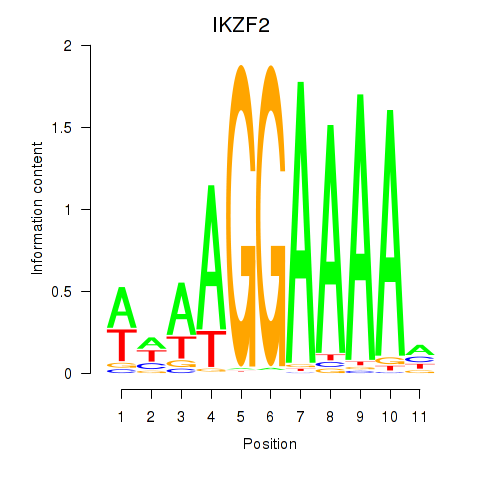
| IKZF2 | 1.485 |
|
|
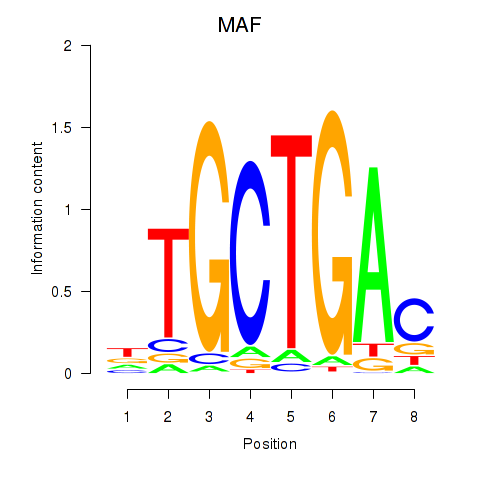
| MAF_NRL | 1.451 |
|
|
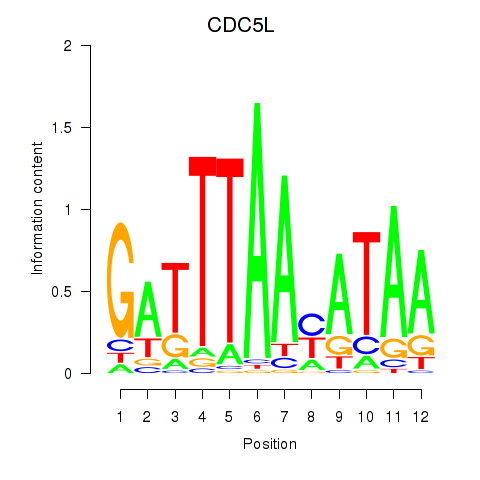
| CDC5L | 1.428 |
|
|
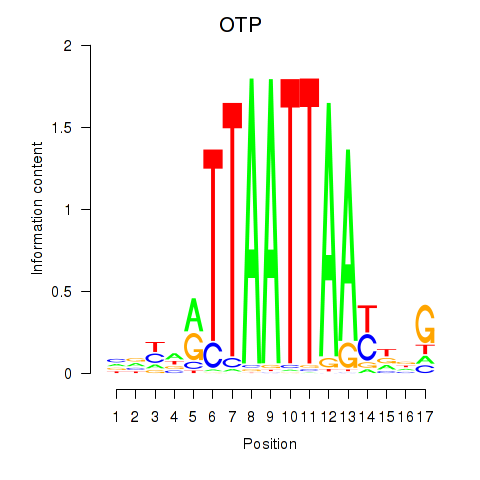
| OTP_PHOX2B_LHX1_LMX1A_LHX5_HOXC4 | 1.390 |
|
|
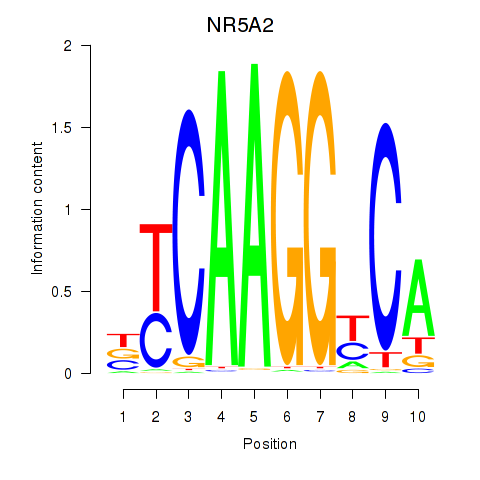
| NR5A2 | 1.343 |
|
|
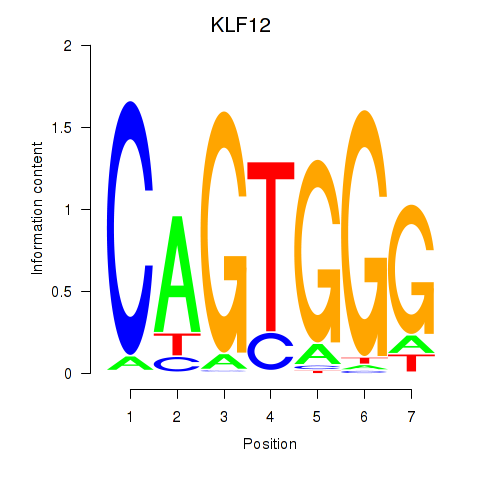
| KLF12 | 1.329 |
|
|
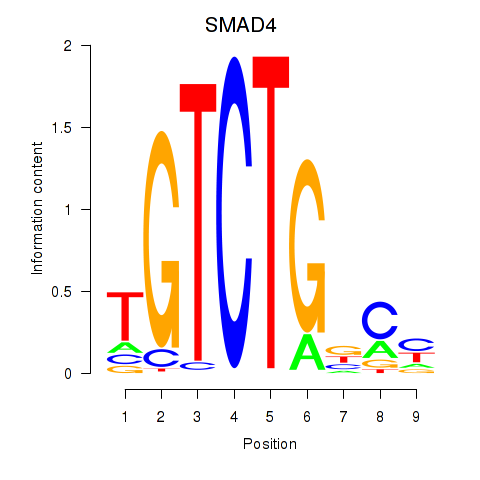
| SMAD4 | 1.312 |
|
|
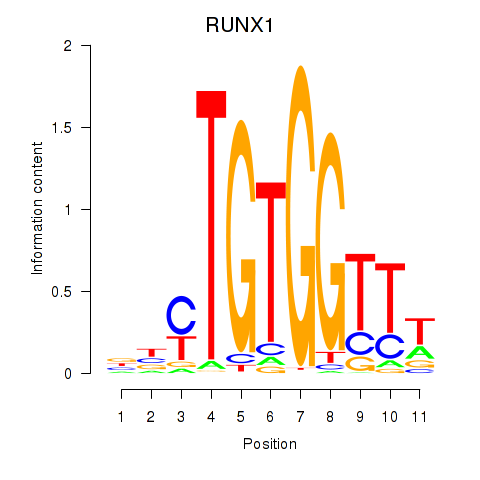
| RUNX1_RUNX2 | 1.311 |
|
|
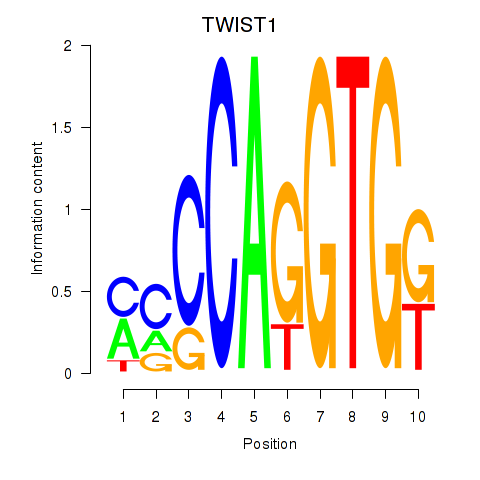
| TWIST1_SNAI1 | 1.274 |
|
|
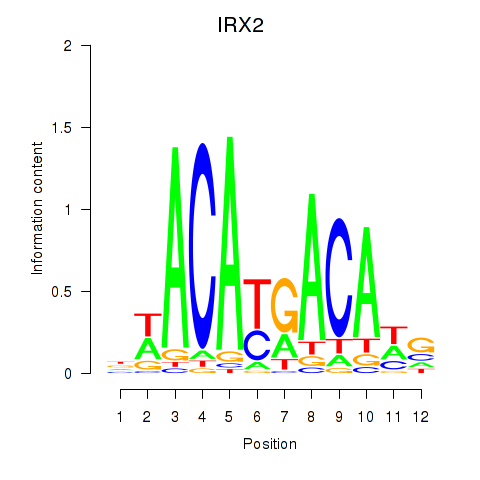
| IRX2 | 1.224 |
|
|
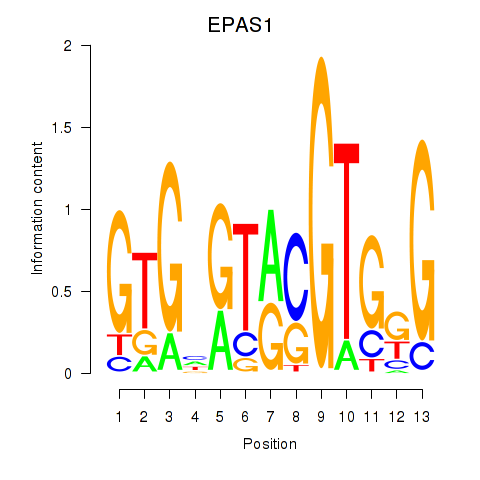
| EPAS1_BCL3 | 1.200 |
|
|
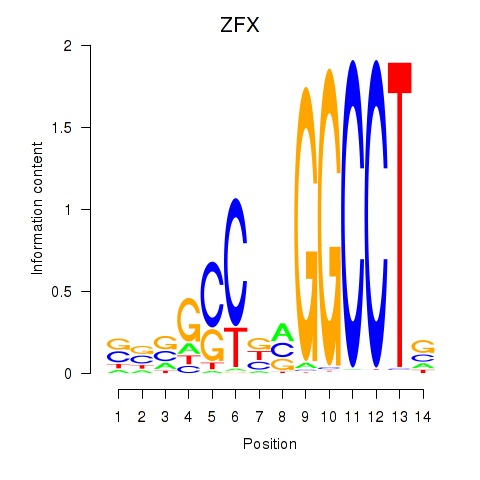
| ZFX | 1.188 |
|
|
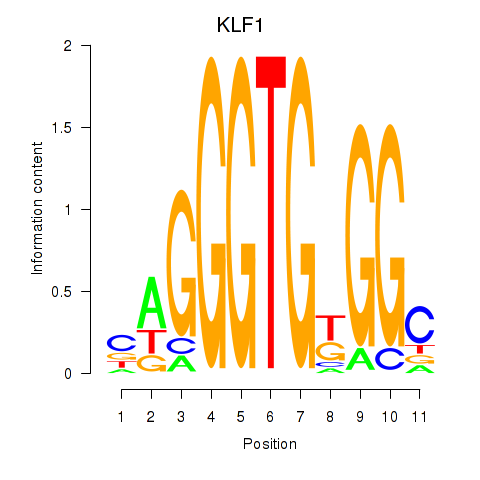
| KLF1 | 1.167 |
|
|
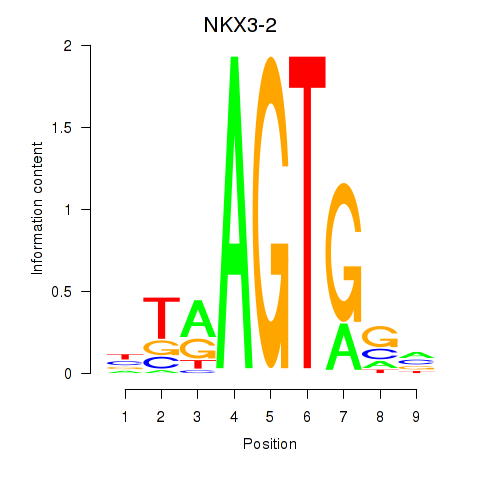
| NKX3-2 | 1.165 |
|
|
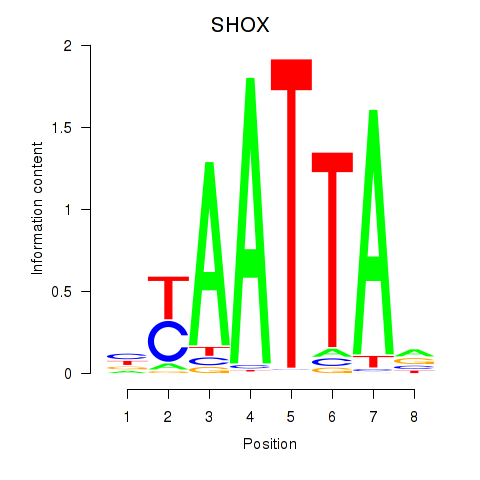
| SHOX | 1.155 |
|
|
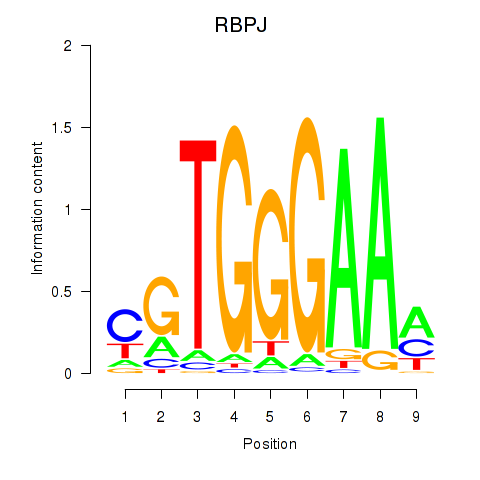
| RBPJ | 1.131 |
|
|
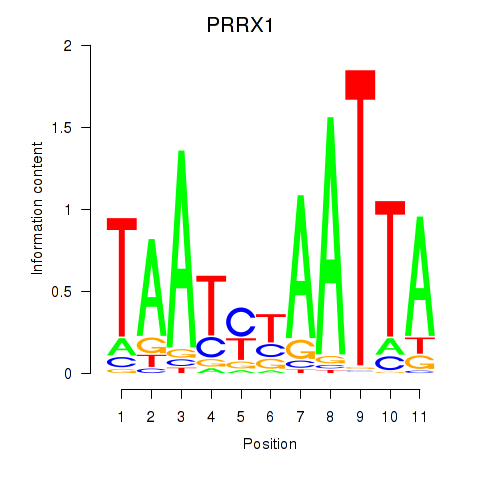
| PRRX1_ALX4_PHOX2A | 1.108 |
|
|
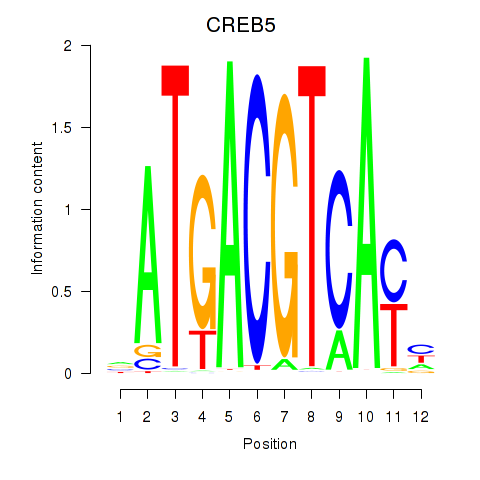
| CREB5_CREM_JUNB | 1.101 |
|
|
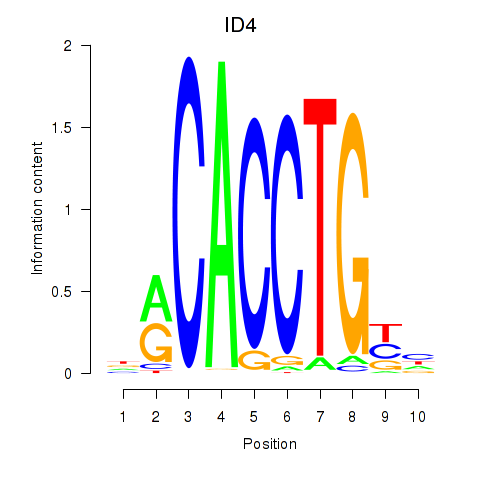
| ID4_TCF4_SNAI2 | 1.100 |
|
|
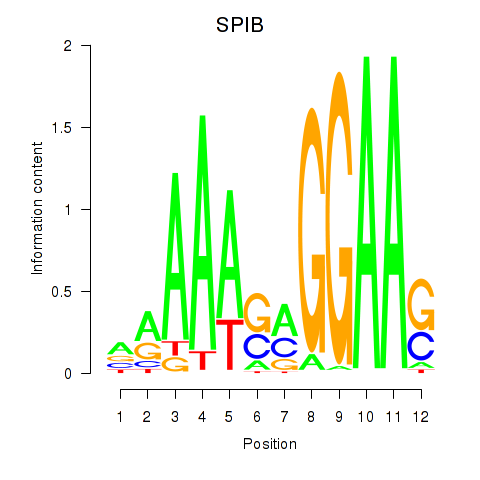
| SPIB | 1.100 |
|
|
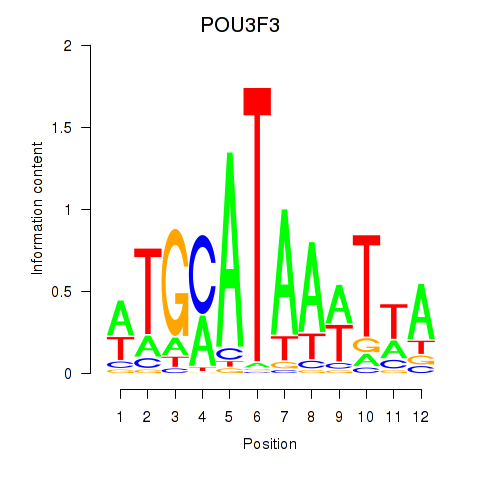
| POU3F3_POU3F4 | 1.086 |
|
|
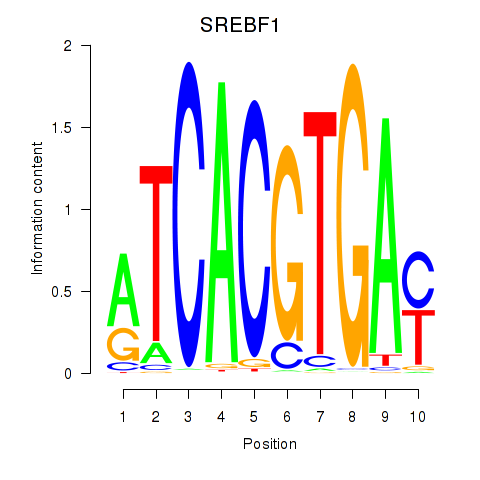
| SREBF1_TFE3 | 1.069 |
|
|
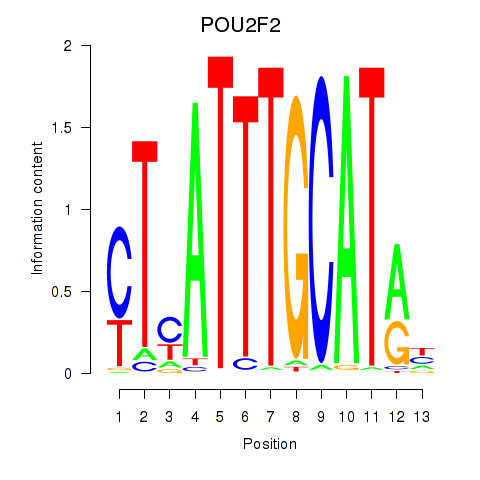
| POU2F2_POU3F1 | 1.050 |
|
|
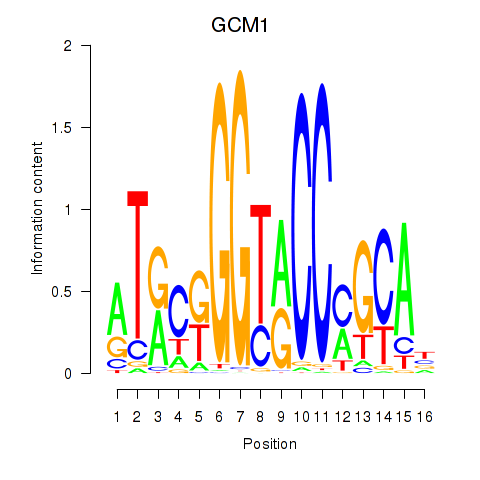
| GCM1 | 1.034 |
|
|
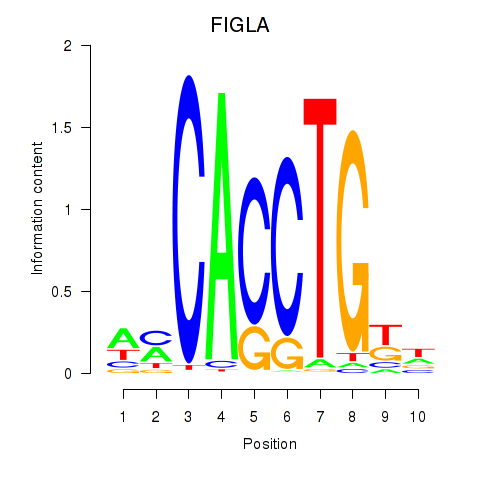
| FIGLA | 1.032 |
|
|
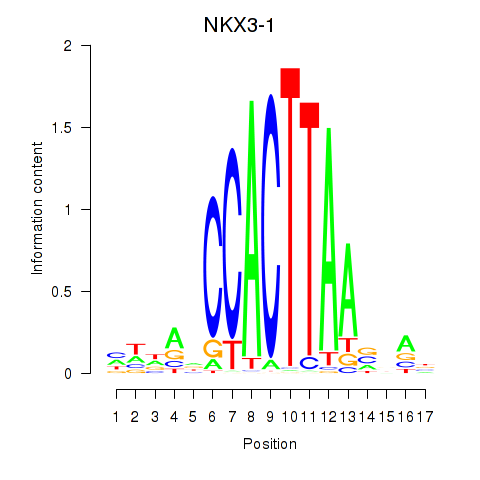
| NKX3-1 | 1.016 |
|
|
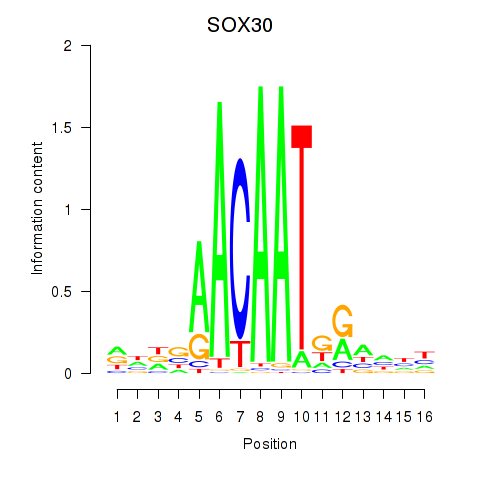
| SOX30 | 1.002 |
|
|
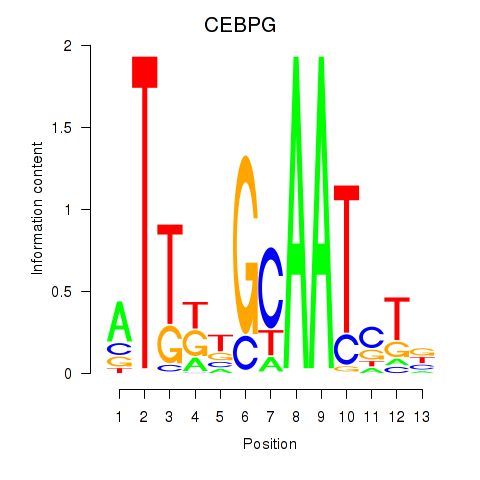
| CEBPG | 1.001 |
|
|
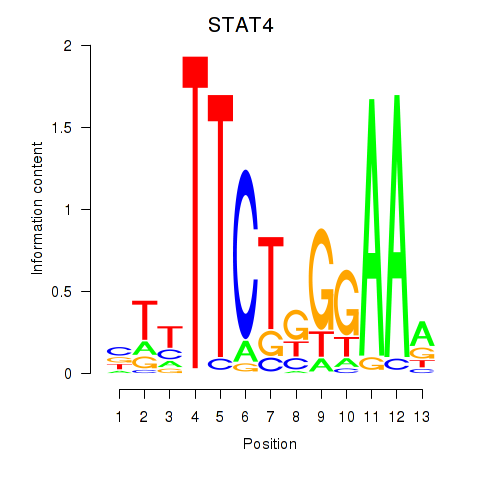
| STAT4 | 0.995 |
|
|
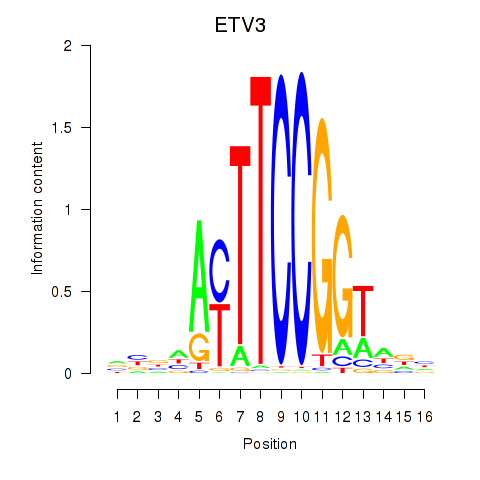
| ETV3 | 0.963 |
|
|
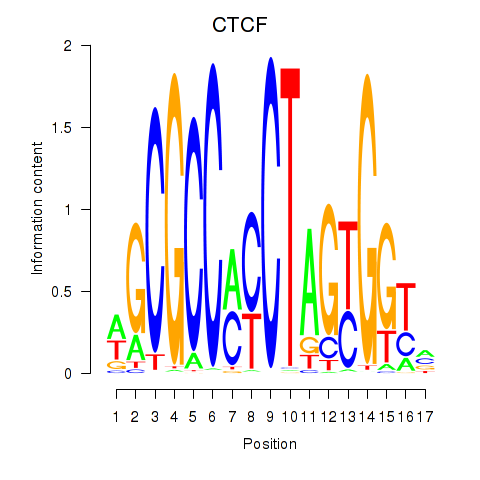
| CTCF_CTCFL | 0.948 |
|
|
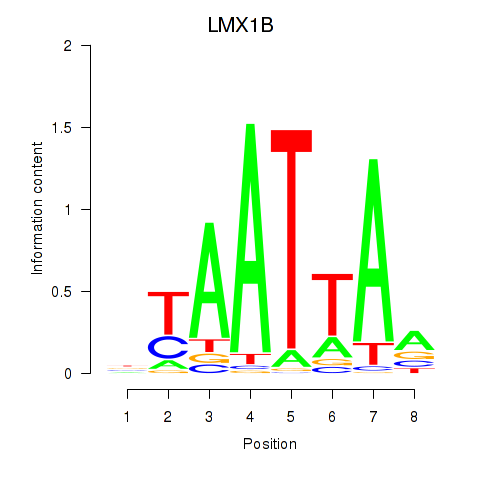
| LMX1B_MNX1_RAX2 | 0.945 |
|
|
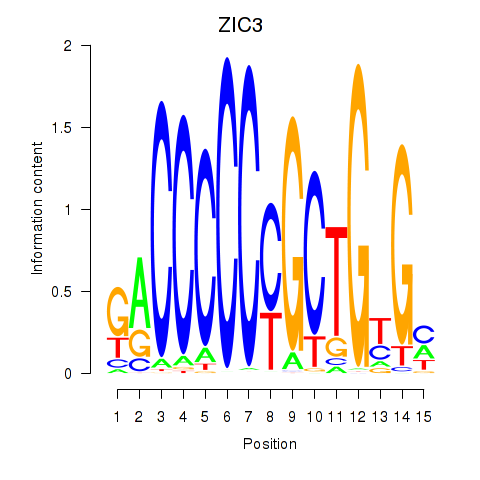
| ZIC3_ZIC4 | 0.944 |
|
|
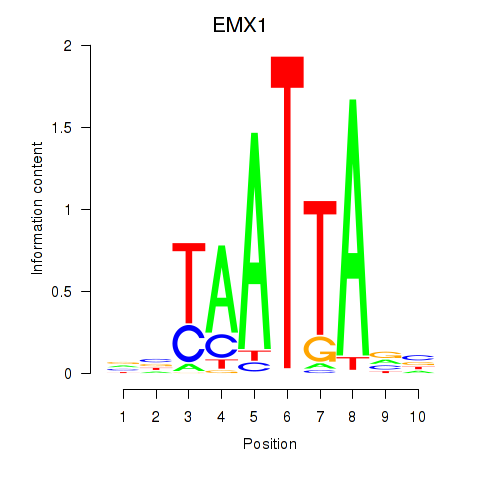
| EMX1 | 0.934 |
|
|
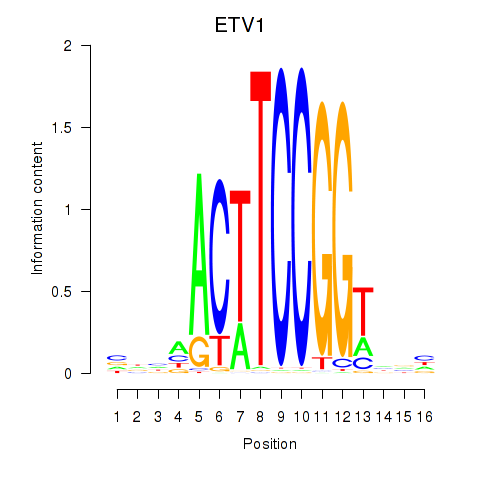
| ETV1_ERF_FEV_ELF1 | 0.923 |
|
|
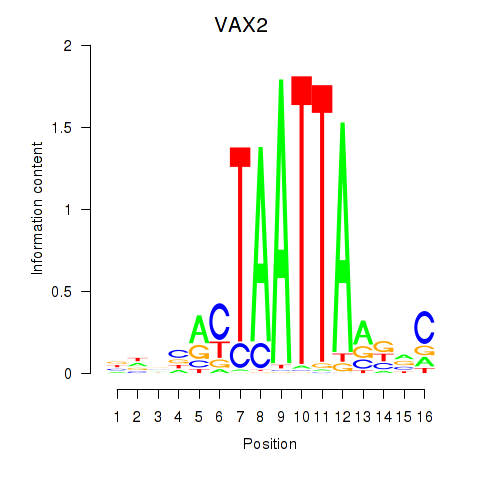
| VAX2_RHOXF2 | 0.914 |
|
|
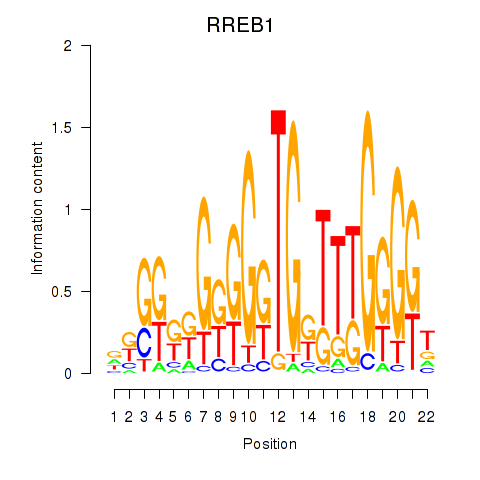
| RREB1 | 0.903 |
|
|
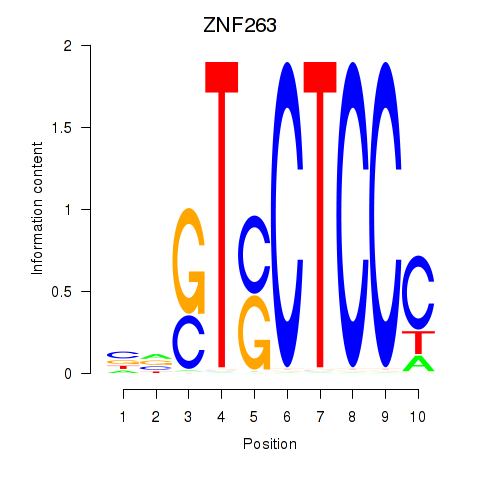
| ZNF263 | 0.903 |
|
|
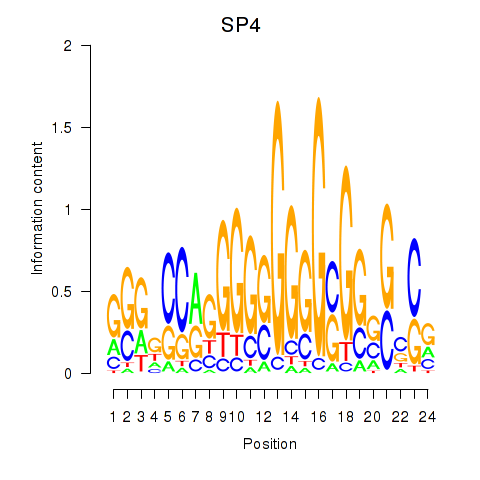
| SP4_PML | 0.896 |
|
|
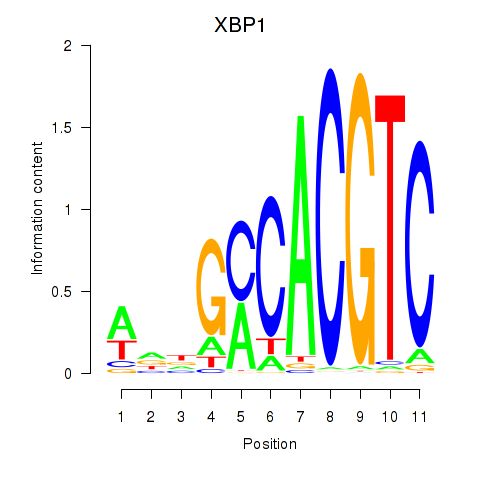
| XBP1 | 0.886 |
|
|
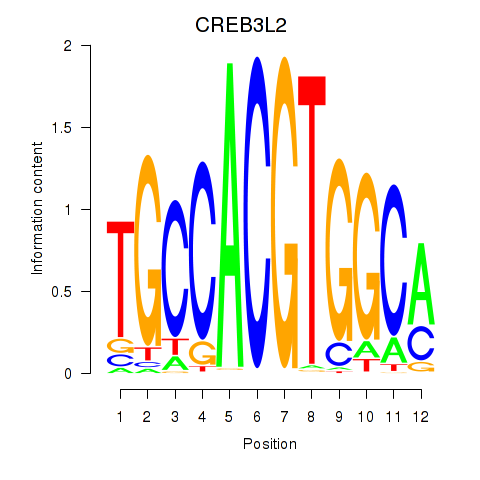
| CREB3L2 | 0.885 |
|
|
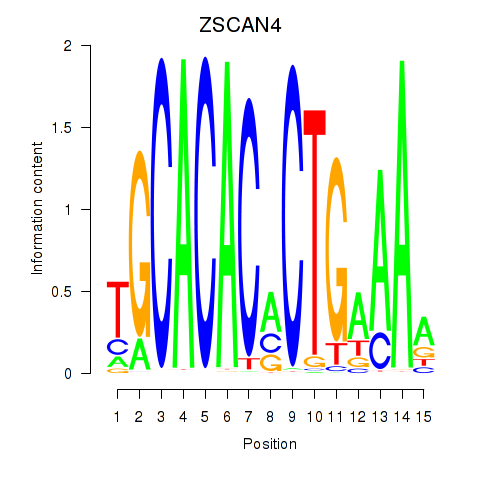
| ZSCAN4 | 0.880 |
|
|
| TBX1 | 0.870 |
|
|
| FOSL2_SMARCC1 | 0.865 |
|
|
| GCUGGUG | 0.864 |
|

|
| T | 0.860 |
|
|
| CEBPB | 0.860 |
|
|
| SIX1_SIX3_SIX2 | 0.856 |
|
|
| GLIS2 | 0.855 |
|
|
| CUX1 | 0.854 |
|
|
| ZBTB18 | 0.849 |
|
|
| NFATC1 | 0.837 |
|
|
| HMX1 | 0.835 |
|
|
| NFAT5 | 0.831 |
|
|
| NR2E1 | 0.830 |
|
|
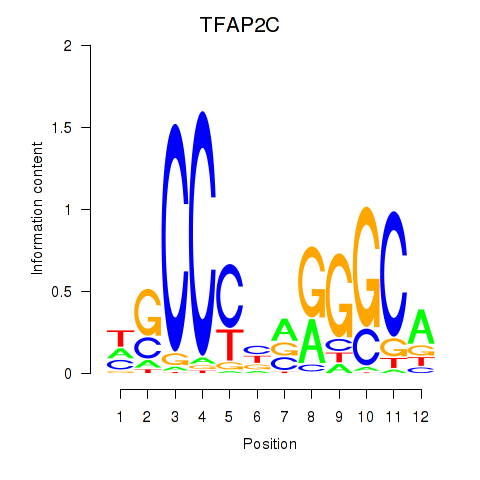
| TFAP2C | 0.829 |
|
|
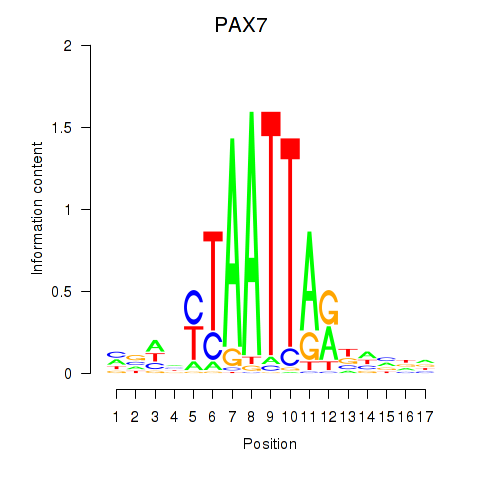
| PAX7_NOBOX | 0.801 |
|
|
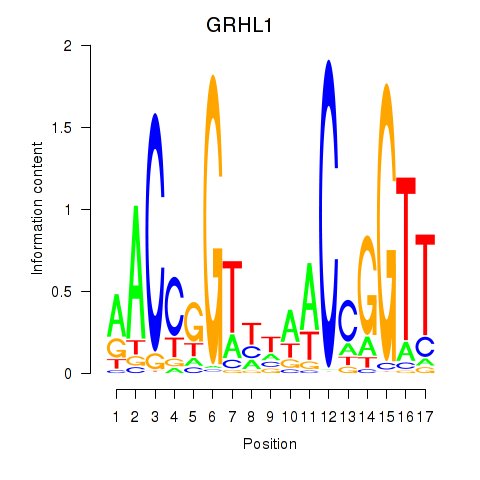
| GRHL1 | 0.797 |
|
|
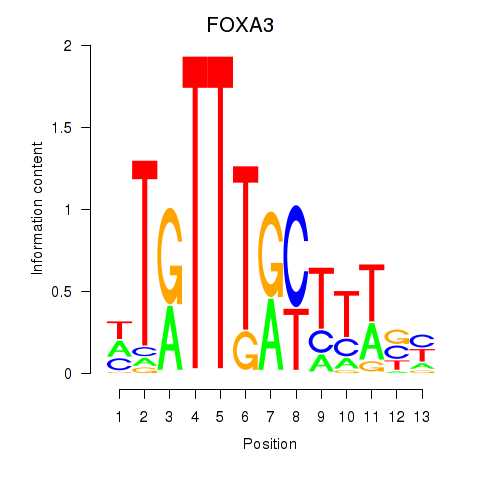
| FOXA3_FOXC2 | 0.791 |
|
|
| HSF1 | 0.786 |
|
|
| PKNOX1_TGIF2 | 0.776 |
|
|
| NR4A2 | 0.773 |
|
|
| TLX1_NFIC | 0.755 |
|
|
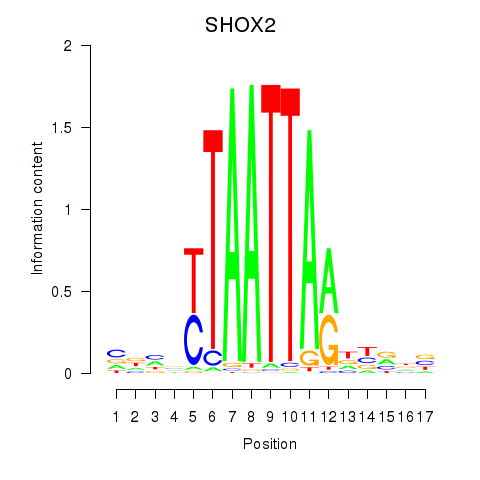
| SHOX2_HOXC5 | 0.753 |
|
|
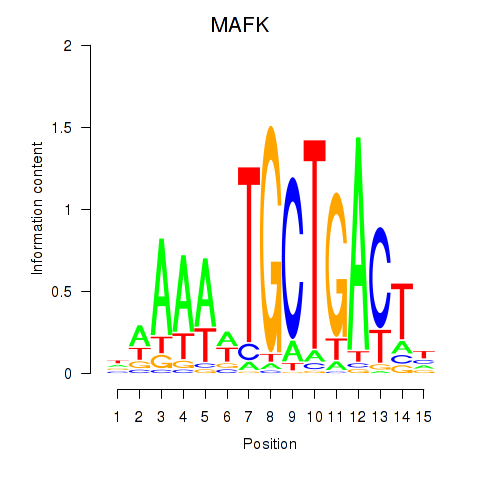
| MAFK | 0.751 |
|
|
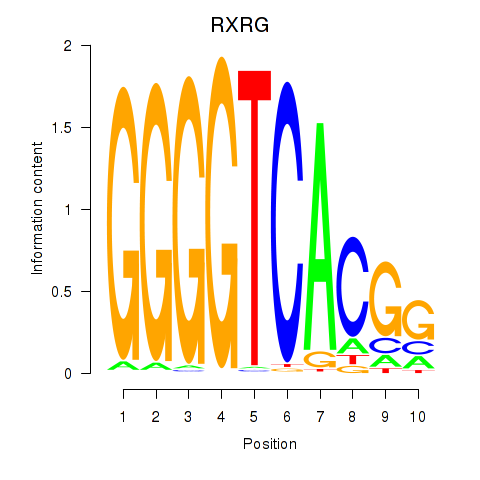
| RXRG | 0.751 |
|
|
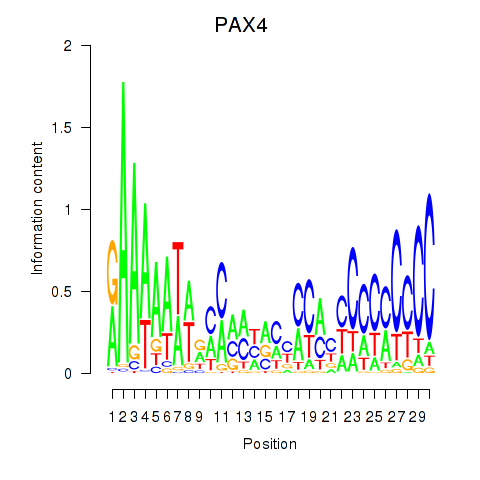
| PAX4 | 0.749 |
|
|
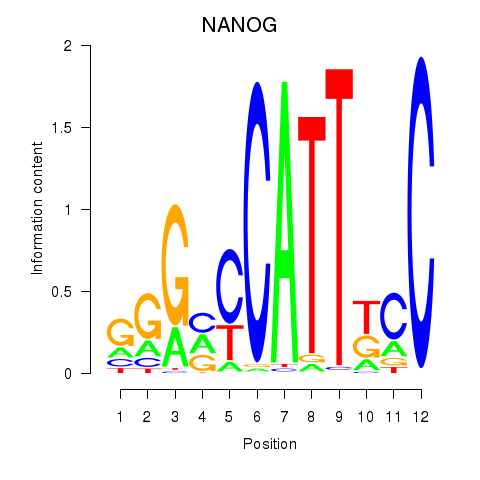
| NANOG | 0.736 |
|
|
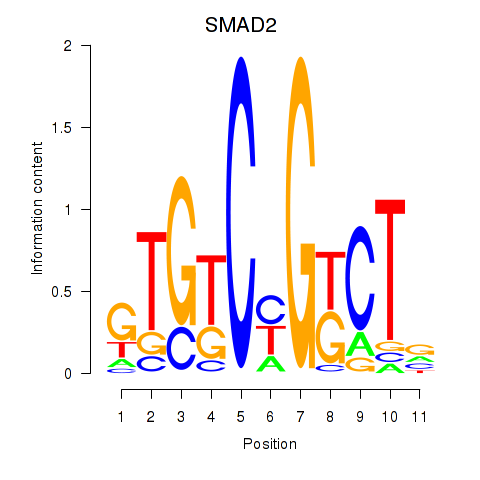
| SMAD2 | 0.734 |
|
|
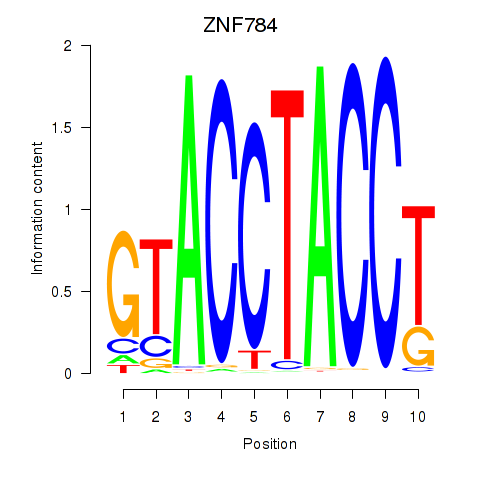
| ZNF784 | 0.732 |
|
|
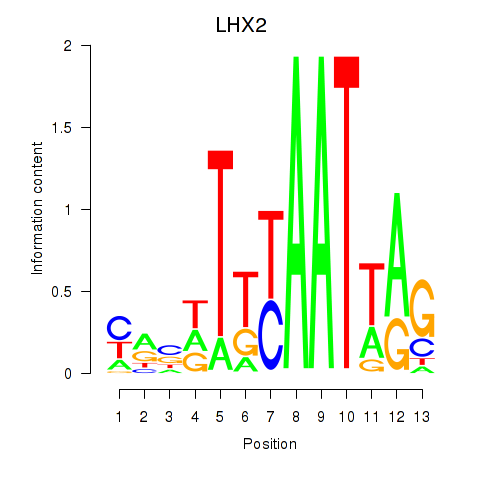
| LHX2 | 0.731 |
|
|
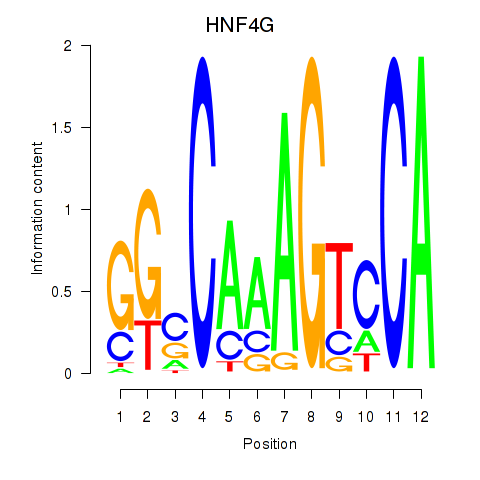
| HNF4G | 0.729 |
|
|
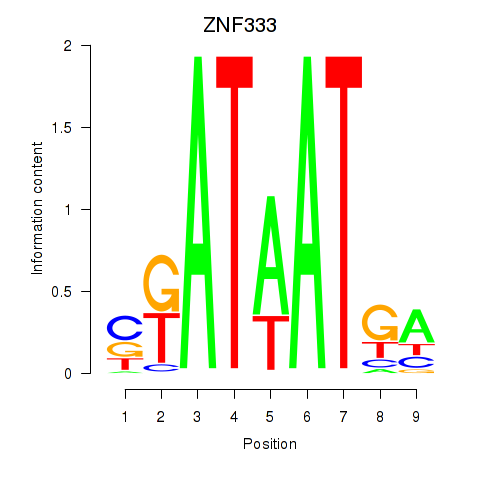
| ZNF333 | 0.729 |
|
|
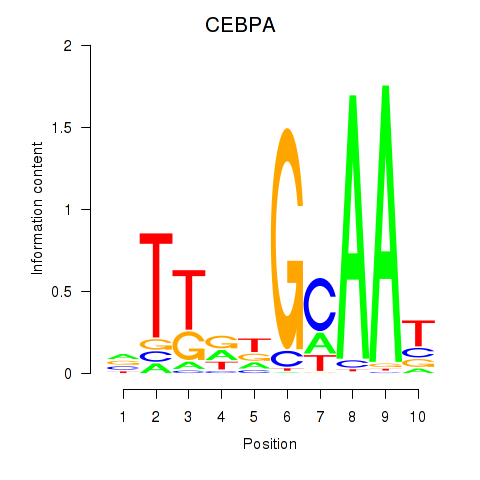
| CEBPA | 0.711 |
|
|
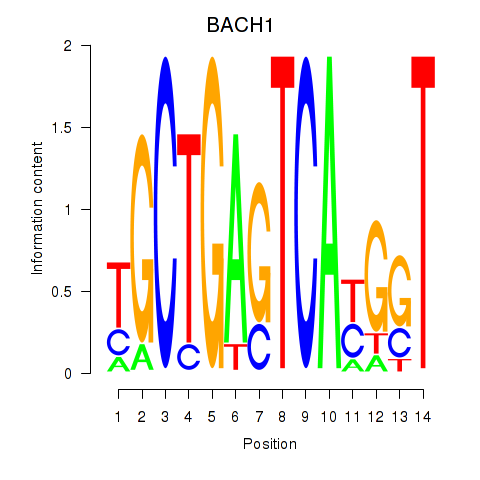
| BACH1_NFE2_NFE2L2 | 0.709 |
|
|
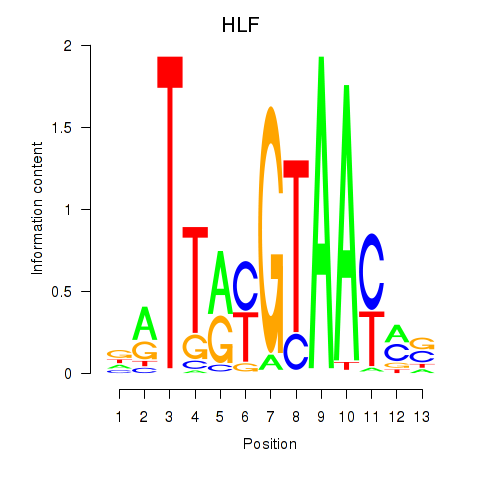
| HLF_TEF | 0.704 |
|
|
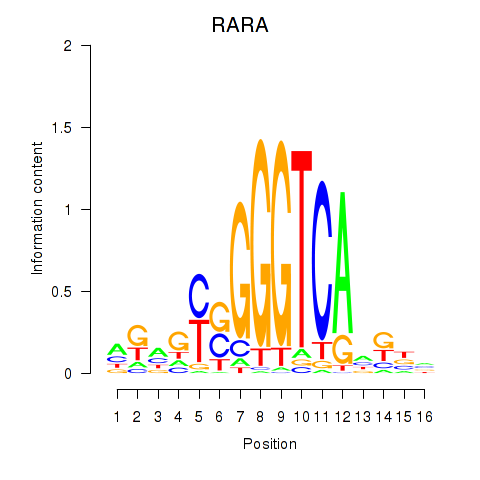
| RARA | 0.689 |
|
|
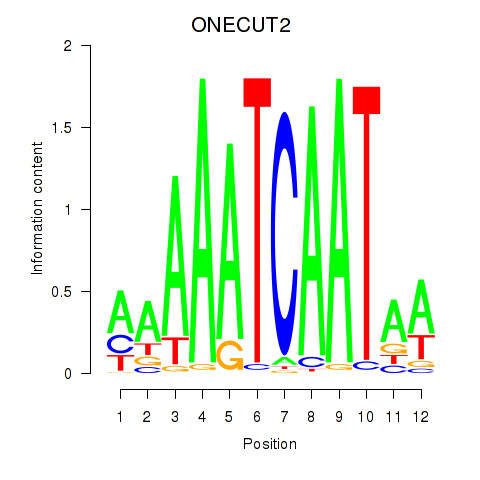
| ONECUT2_ONECUT3 | 0.676 |
|
|
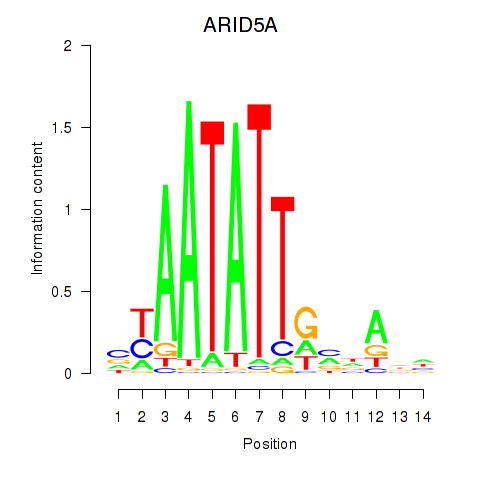
| ARID5A | 0.673 |
|
|
| CUGGCUG | 0.669 |
|

|
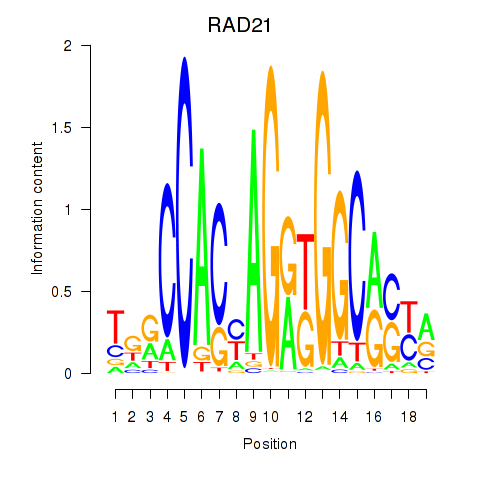
| RAD21_SMC3 | 0.661 |
|
|
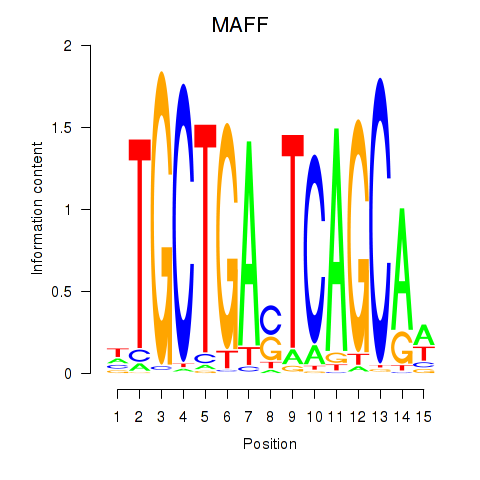
| MAFF_MAFG | 0.657 |
|
|
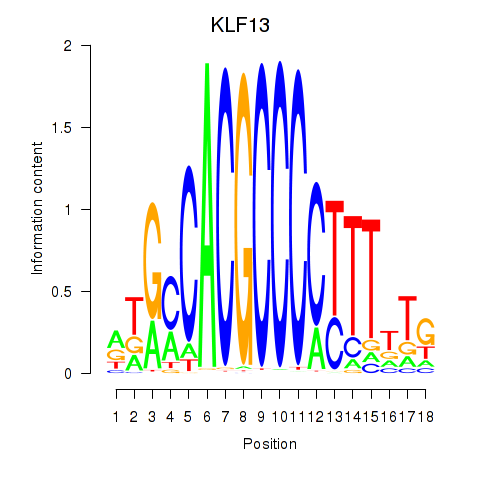
| KLF13 | 0.652 |
|
|
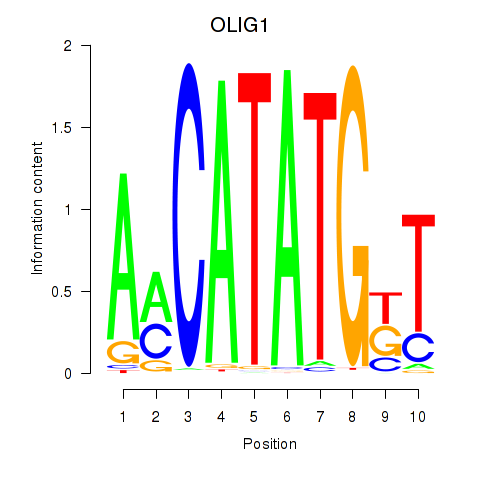
| OLIG1 | 0.650 |
|
|
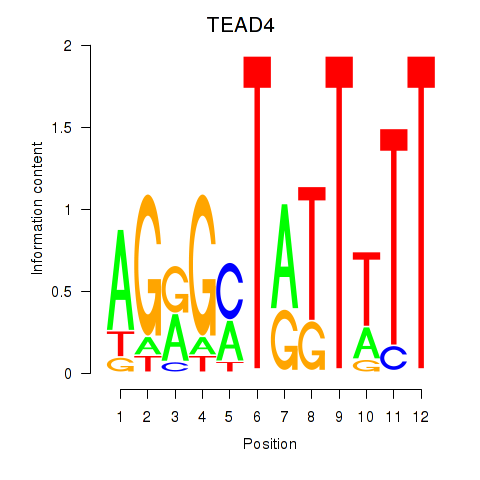
| TEAD4 | 0.648 |
|
|
| CCCUGAG | 0.644 |
|

|
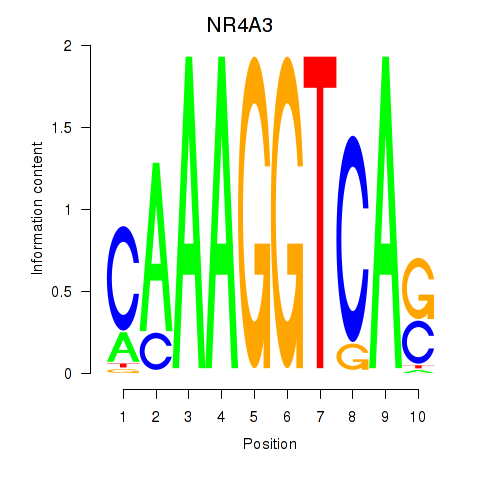
| NR4A3 | 0.643 |
|
|
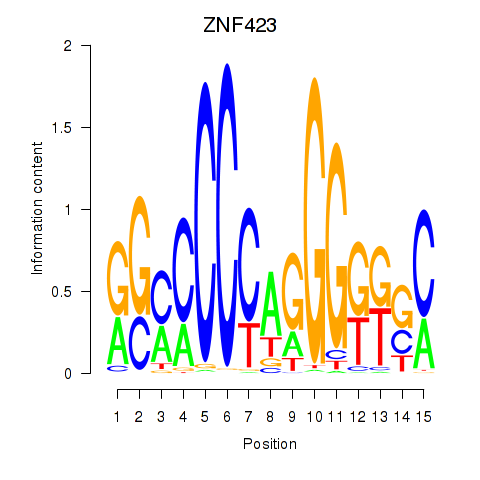
| ZNF423 | 0.631 |
|
|
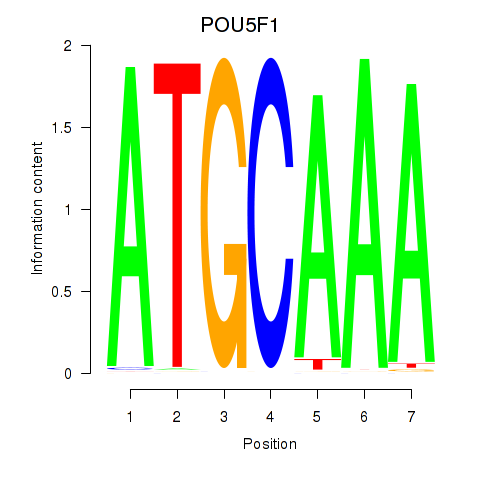
| POU5F1_POU2F3 | 0.628 |
|
|
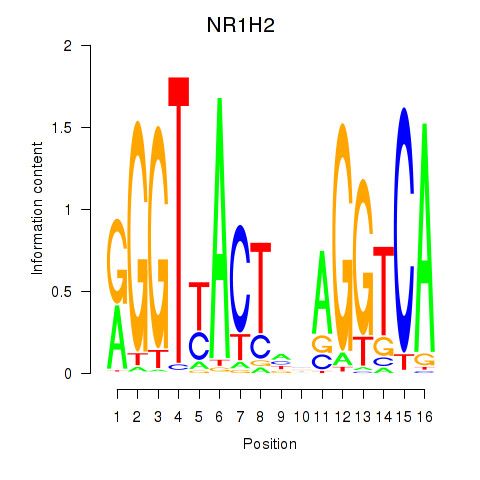
| NR1H2 | 0.596 |
|
|
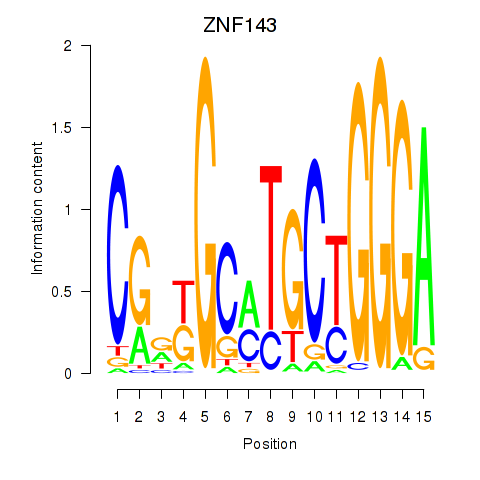
| ZNF143 | 0.595 |
|
|
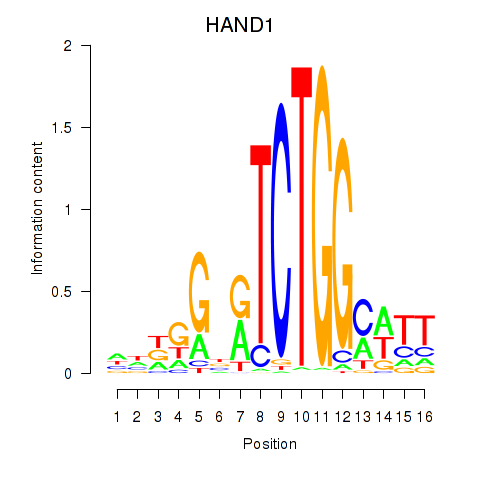
| HAND1 | 0.594 |
|
|
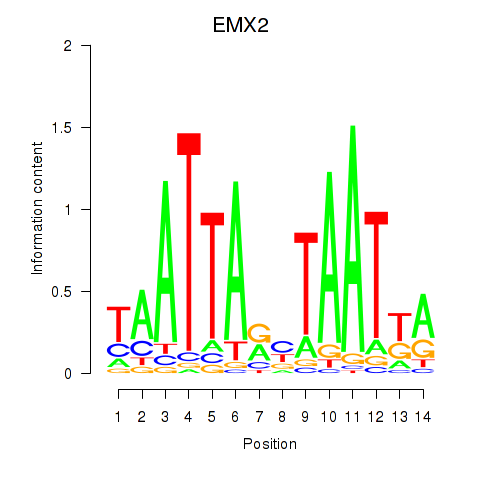
| EMX2 | 0.594 |
|
|
| GSC_GSC2 | 0.570 |
|
|
| AAAGUGC | 0.568 |
|

|
| RORC | 0.557 |
|
|
| ETV2 | 0.555 |
|
|
| MEF2B | 0.549 |
|
|
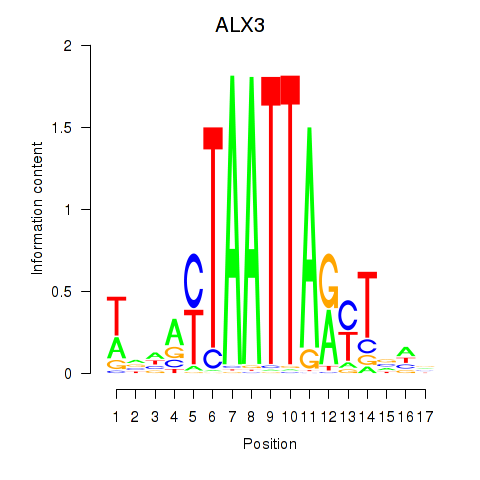
| ALX3 | 0.526 |
|
|
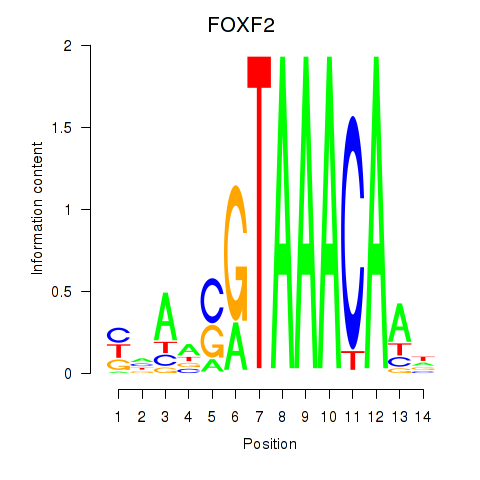
| FOXF2_FOXJ1 | 0.522 |
|
|
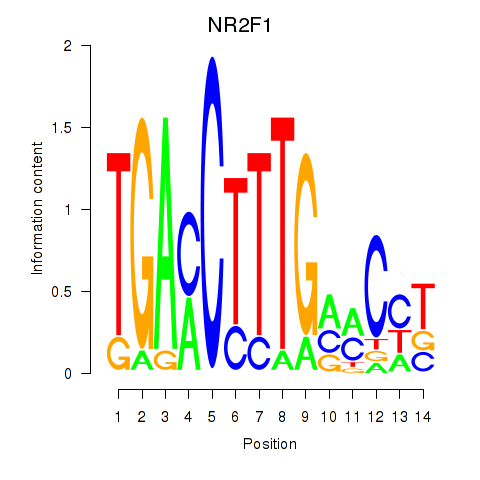
| NR2F1 | 0.511 |
|
|
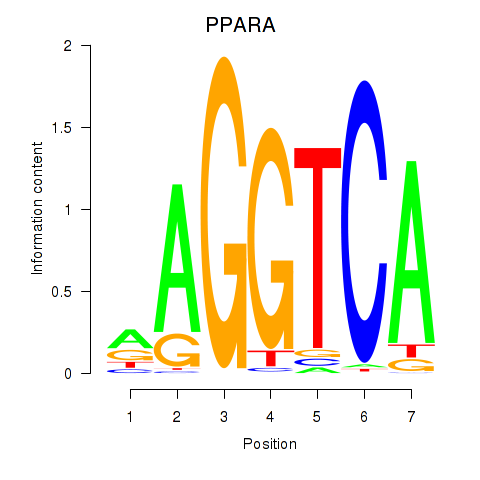
| PPARA | 0.505 |
|
|
| BBX | 0.498 |
|
|
| FOXJ2 | 0.493 |
|
|
| CCACAGG | 0.486 |
|

|
| GGCUCAG | 0.484 |
|

|
| LHX3 | 0.481 |
|
|
| STAT5A | 0.477 |
|
|
| ZNF691 | 0.477 |
|
|
| PAX3 | 0.470 |
|
|
| UGGCACU | 0.460 |
|

|
| BHLHE40 | 0.460 |
|
|
| ZNF652 | 0.459 |
|
|
| ETV6 | 0.455 |
|
|
| NR1I3 | 0.452 |
|
|
| ZBTB3 | 0.444 |
|
|
| RFX5 | 0.442 |
|
|
| TBX5 | 0.440 |
|
|
| ZBTB4 | 0.439 |
|
|
| HOXC6_HOXA7 | 0.436 |
|
|
| STAT6 | 0.435 |
|
|
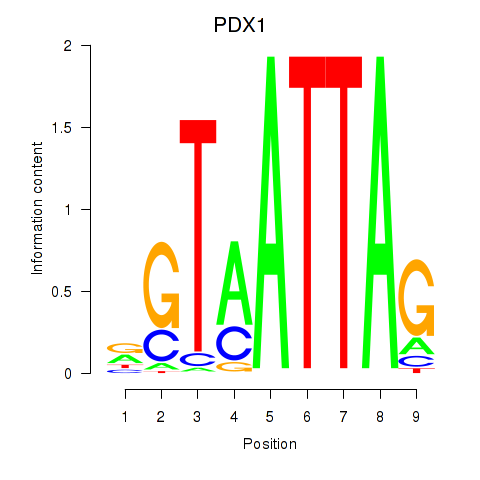
| PDX1 | 0.432 |
|
|
| CCAGUGU | 0.427 |
|

|
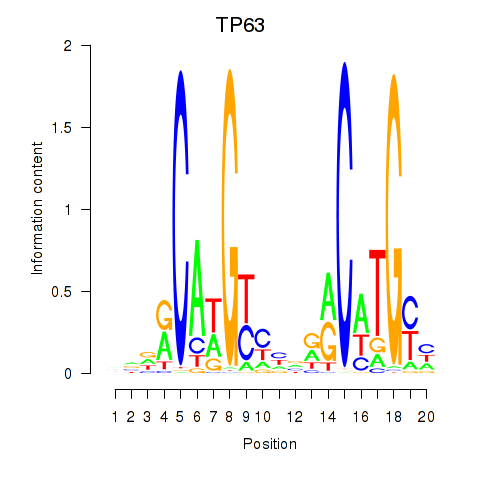
| TP63 | 0.418 |
|
|
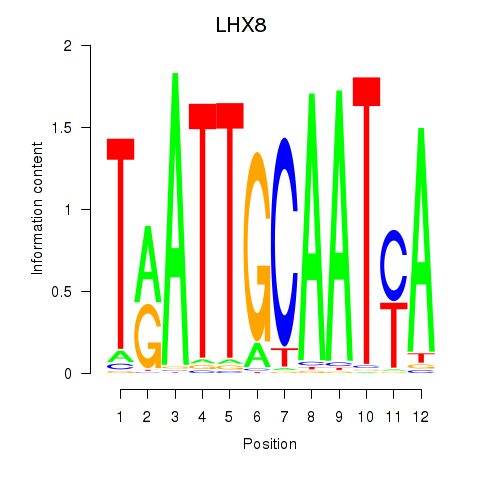
| LHX8 | 0.416 |
|
|
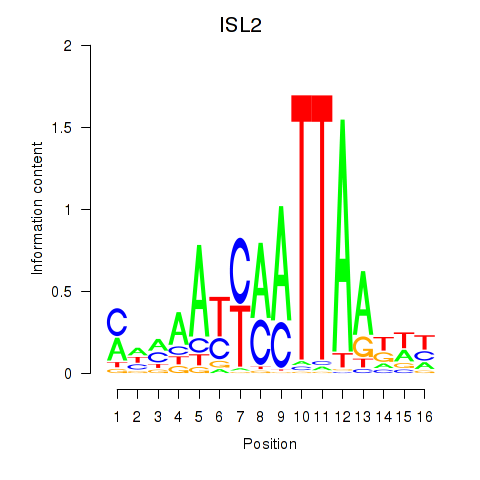
| ISL2 | 0.413 |
|
|
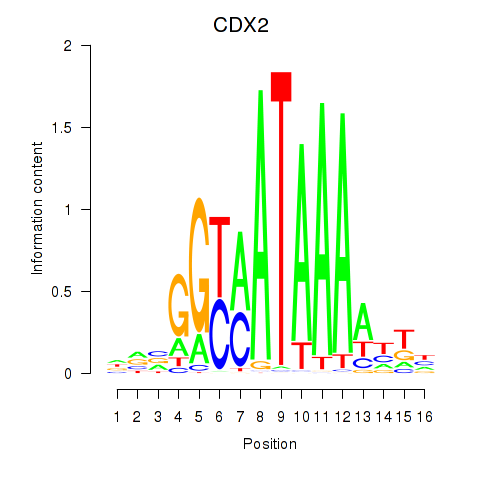
| CDX2 | 0.402 |
|
|
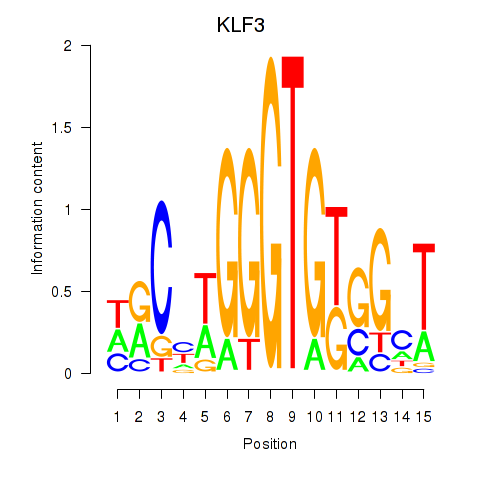
| KLF3 | 0.401 |
|
|
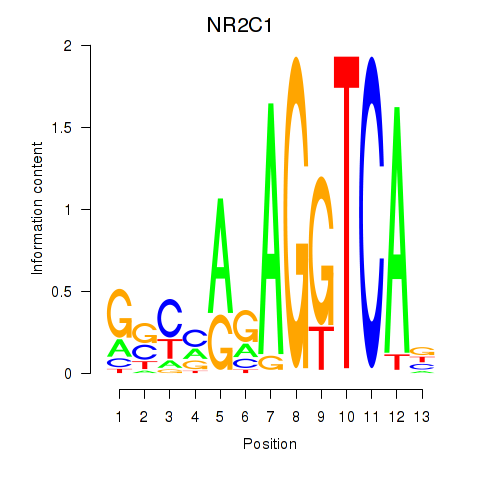
| NR2C1 | 0.388 |
|
|
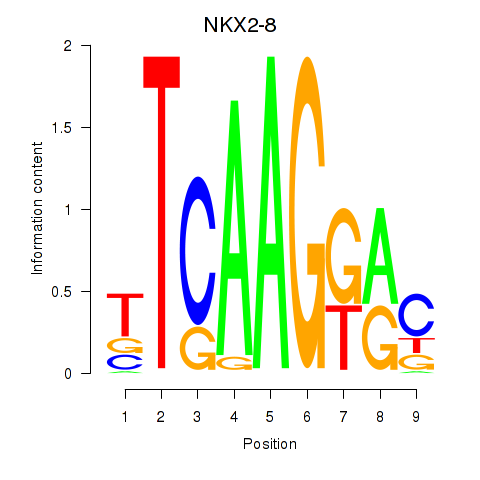
| NKX2-8 | 0.388 |
|
|
| SOX1 | 0.386 |
|
|
| UUGGCAC | 0.386 |
|

|
| MIXL1_GSX1_BSX_MEOX2_LHX4 | 0.385 |
|
|
| HSF4 | 0.383 |
|
|
| FOXD3_FOXI1_FOXF1 | 0.376 |
|
|
| IRF3 | 0.376 |
|
|
| HOXC10_HOXD13 | 0.373 |
|
|
| MSX1 | 0.371 |
|
|
| MAFA | 0.365 |
|
|
| E4F1 | 0.364 |
|
|
| EP300 | 0.360 |
|
|
| VDR | 0.358 |
|
|
| ETV7 | 0.358 |
|
|
| RFX7_RFX4_RFX1 | 0.357 |
|
|
| FOSB | 0.356 |
|
|
| HIC1 | 0.352 |
|
|
| HOXA5 | 0.351 |
|
|
| SOX6 | 0.348 |
|
|
| JUN | 0.346 |
|
|
| SIX6 | 0.339 |
|
|
| HOXC11 | 0.339 |
|
|
| SMAD3 | 0.334 |
|
|
| RELB | 0.329 |
|
|
| GAGGUAG | 0.323 |
|

|
| MEF2C | 0.322 |
|
|
| SOX17 | 0.318 |
|
|
| ZKSCAN1 | 0.318 |
|
|
| ZBTB7A_ZBTB7C | 0.318 |
|
|
| FOXA1 | 0.317 |
|
|
| SPI1 | 0.312 |
|
|
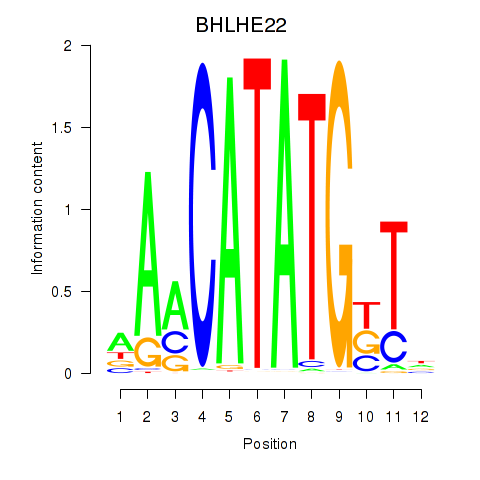
| BHLHE22_BHLHA15_BHLHE23 | 0.310 |
|
|
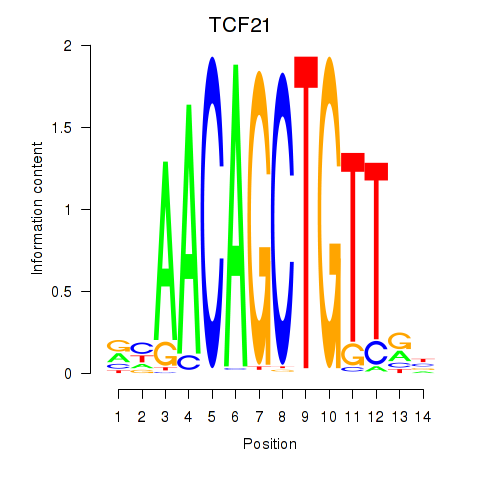
| TCF21 | 0.305 |
|
|
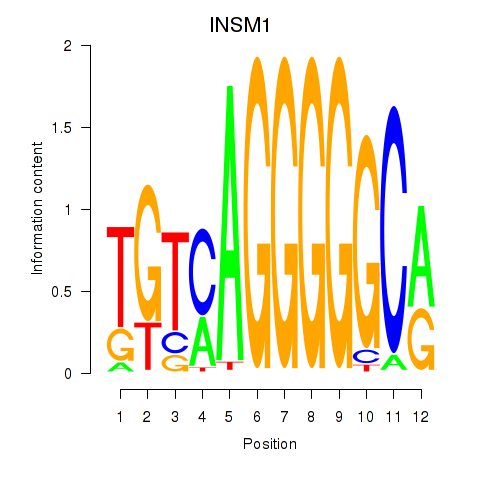
| INSM1 | 0.304 |
|
|
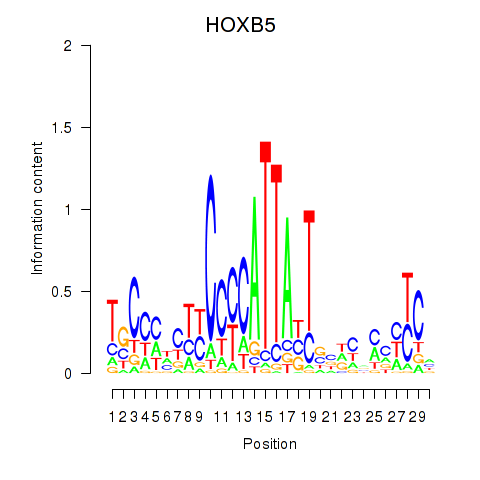
| HOXB5 | 0.304 |
|
|
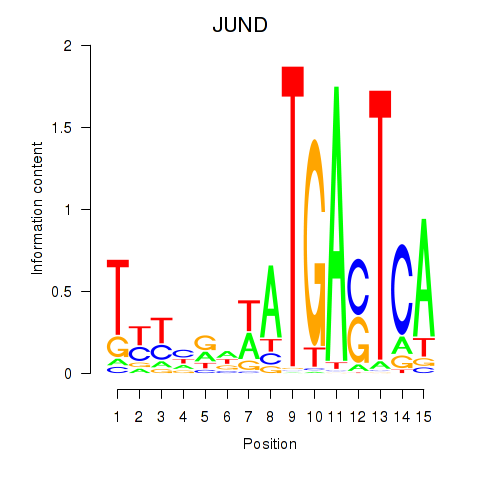
| JUND | 0.302 |
|
|
| UGGUCCC | 0.299 |
|

|
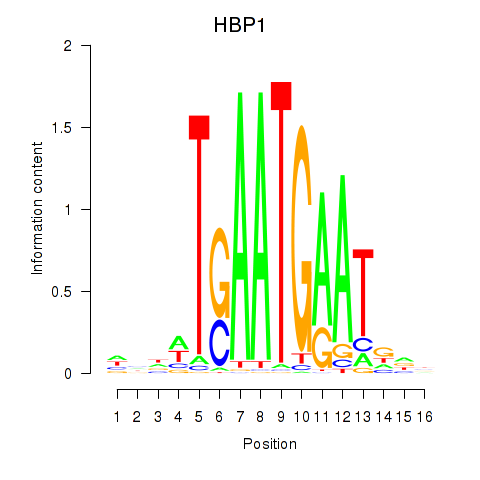
| HBP1 | 0.296 |
|
|
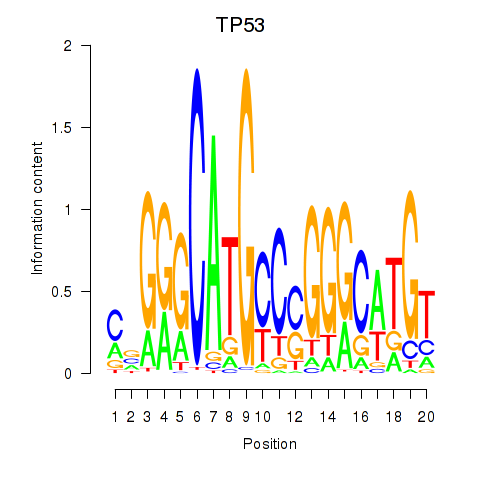
| TP53 | 0.296 |
|
|
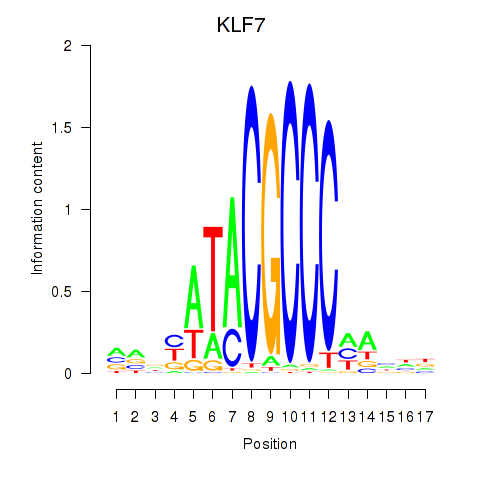
| KLF7 | 0.281 |
|
|
| CAGUCCA | 0.279 |
|

|
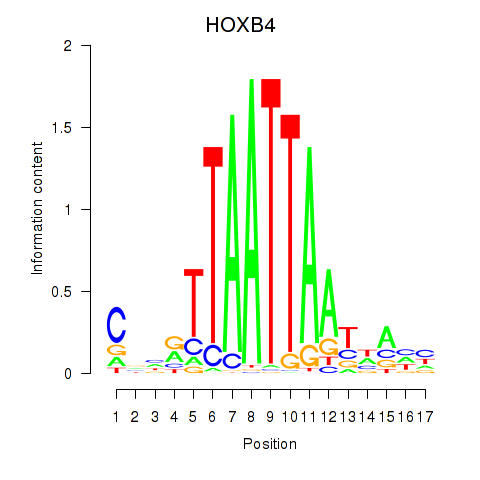
| HOXB4_LHX9 | 0.276 |
|
|
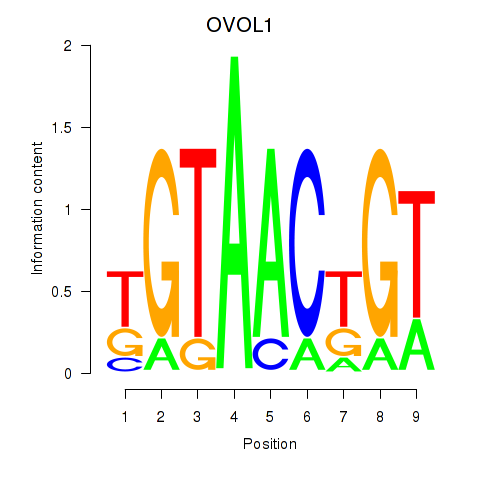
| OVOL1 | 0.274 |
|
|
| AGCUGCC | 0.262 |
|

|
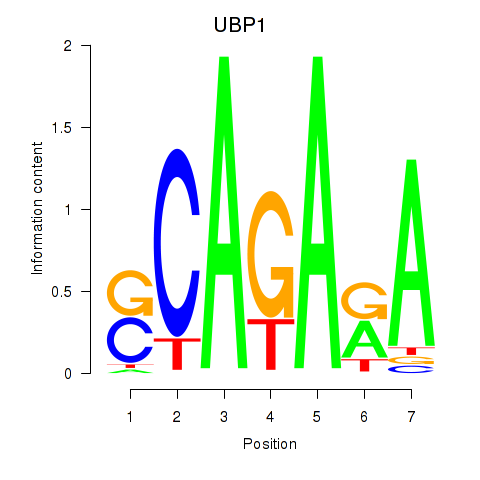
| UBP1 | 0.261 |
|
|
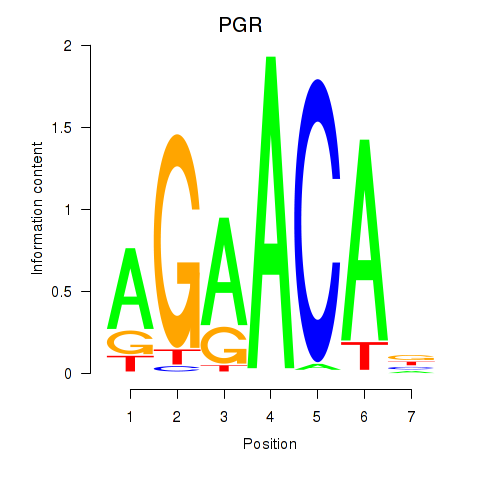
| PGR | 0.259 |
|
|
| NOTO_VSX2_DLX2_DLX6_NKX6-1 | 0.254 |
|
|
| ISL1 | 0.246 |
|
|
| DDIT3 | 0.242 |
|
|
| AUGUGCC | 0.235 |
|

|
| NKX2-6 | 0.231 |
|
|
| TFAP2B | 0.230 |
|
|
| BARHL2 | 0.229 |
|
|
| MEIS3_TGIF2LX | 0.228 |
|
|
| GGCAAGA | 0.226 |
|

|
| ZNF410 | 0.218 |
|
|
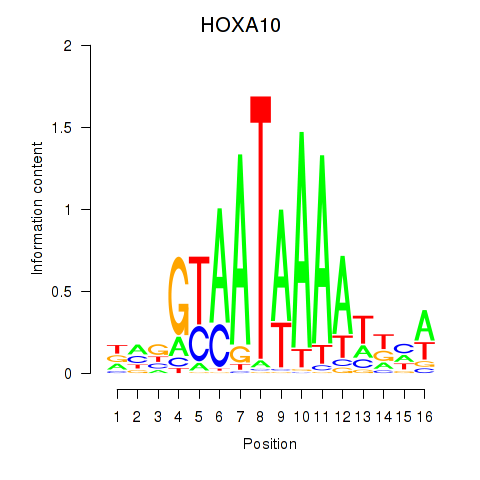
| HOXA10_HOXB9 | 0.208 |
|
|
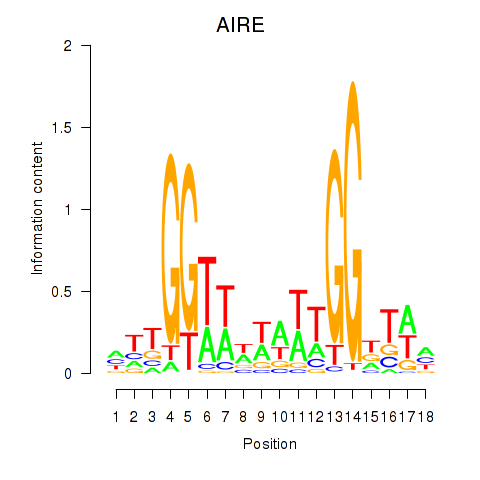
| AIRE | 0.206 |
|
|
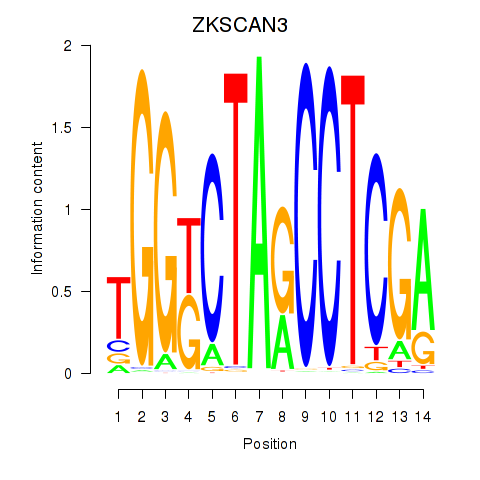
| ZKSCAN3 | 0.195 |
|
|
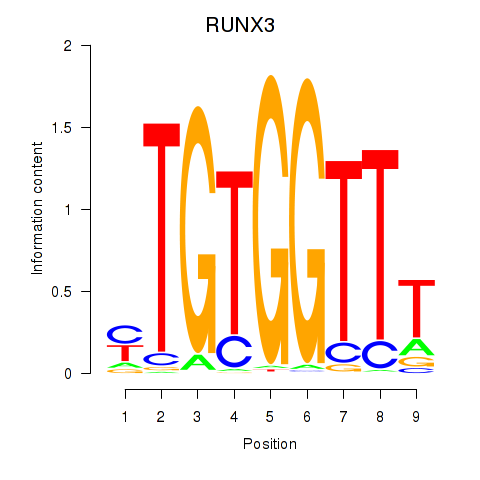
| RUNX3_BCL11A | 0.193 |
|
|
| EN2_GBX2_LBX2 | 0.190 |
|
|
| CENPB | 0.188 |
|
|
| MECOM | 0.186 |
|
|
| E2F8 | 0.181 |
|
|
| ZNF232 | 0.180 |
|
|
| ALX1_ARX | 0.178 |
|
|
| ELF3_EHF | 0.178 |
|
|
| HMBOX1 | 0.177 |
|
|
| NR1I2 | 0.174 |
|
|
| HOXD10 | 0.173 |
|
|
| SOX9 | 0.171 |
|
|
| NKX6-3 | 0.170 |
|
|
| GCAGCAU | 0.161 |
|

|
| ACCCUGU | 0.160 |
|

|
| VAX1_GSX2 | 0.159 |
|
|
| POU4F2 | 0.155 |
|
|
| ACUGGCC | 0.146 |
|

|
| SCRT1_SCRT2 | 0.142 |
|
|
| HOXB13 | 0.141 |
|
|
| LEF1 | 0.138 |
|
|
| ZBED1 | 0.137 |
|
|
| FOXO3_FOXD2 | 0.134 |
|
|
| CACCUCC | 0.130 |
|

|
| NKX1-1 | 0.126 |
|
|
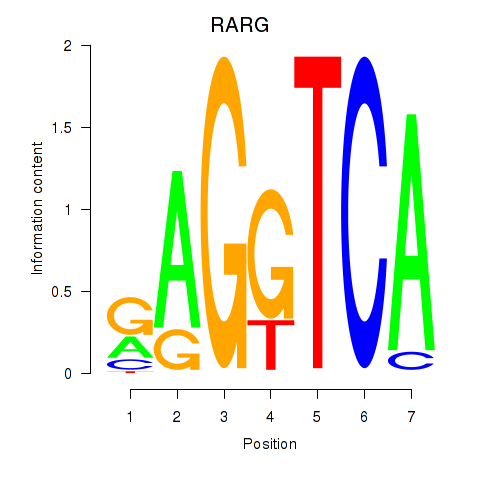
| RARG | 0.121 |
|
|
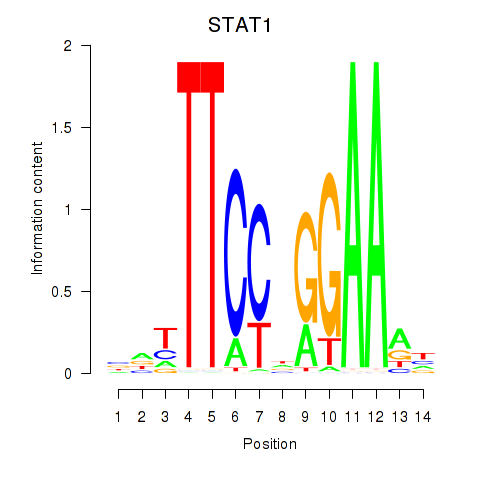
| STAT1_STAT3_BCL6 | 0.120 |
|
|
| CGUACCG | 0.119 |
|

|
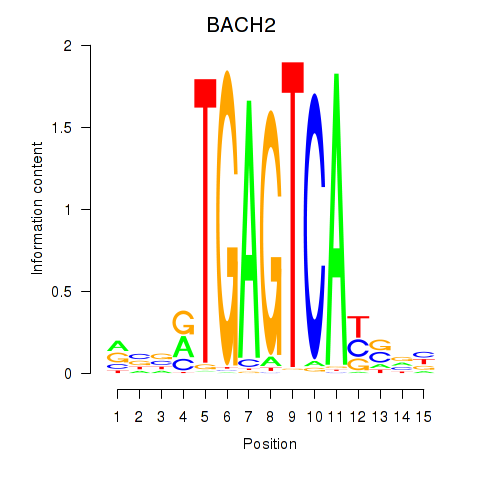
| BACH2 | 0.116 |
|
|
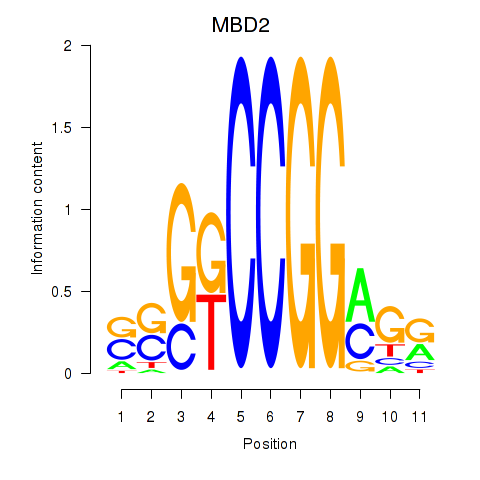
| MBD2 | 0.115 |
|
|
| ATF2_ATF1_ATF3 | 0.115 |
|
|
| NFATC4 | 0.114 |
|
|
| FOXD1_FOXO1_FOXO6_FOXG1_FOXP1 | 0.109 |
|
|
| GGAGUGU | 0.100 |
|

|
| GATA5 | 0.100 |
|
|
| TFDP1 | 0.099 |
|
|
| VENTX | 0.097 |
|
|
| BRCA1 | 0.088 |
|
|
| YY1_YY2 | 0.083 |
|
|
| DMC1 | 0.083 |
|
|
| NKX2-3 | 0.081 |
|
|
| HINFP1 | 0.081 |
|
|
| DPRX | 0.080 |
|
|
| HIF1A | 0.068 |
|
|
| RORA | 0.062 |
|
|
| GCCUGUC | 0.061 |
|

|
| CAGUGCA | 0.060 |
|

|
| OTX2_CRX | 0.054 |
|
|
| SRY | 0.052 |
|
|
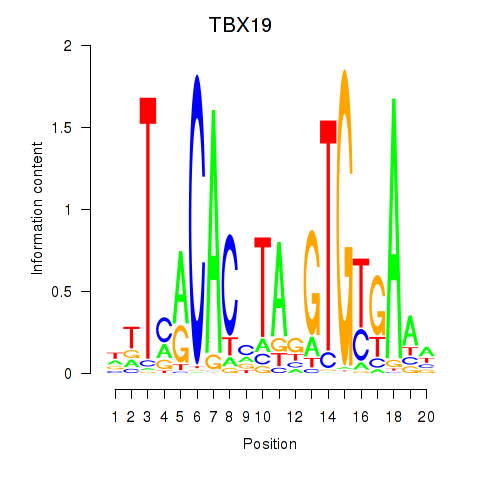
| TBX19 | 0.050 |
|
|
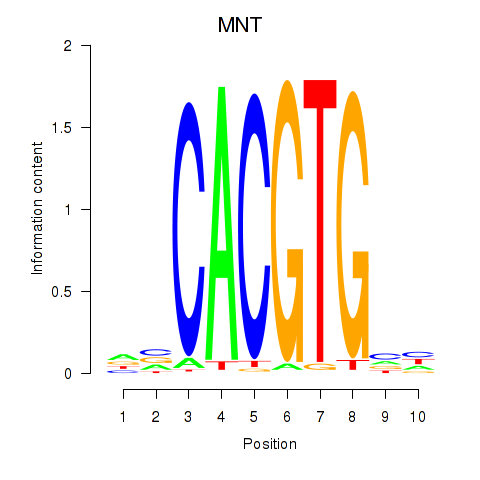
| MNT_HEY1_HEY2 | 0.047 |
|
|
| UGCAGUC | 0.045 |
|

|
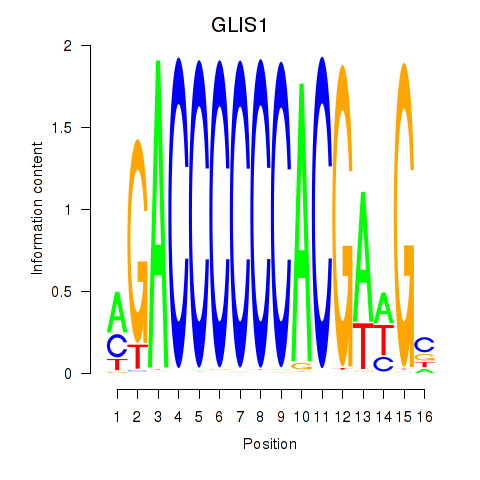
| GLIS1 | 0.044 |
|
|
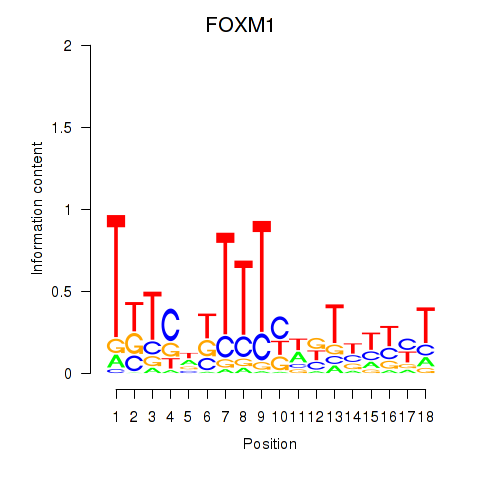
| FOXM1_TBL1XR1 | 0.044 |
|
|
| NR3C1 | 0.030 |
|
|
| NKX6-2 | 0.029 |
|
|
| CREB3L1_CREB3 | 0.028 |
|
|
| CCUUGGC | 0.027 |
|

|
| NHLH1 | 0.024 |
|
|
| AACCGUU | 0.021 |
|

|
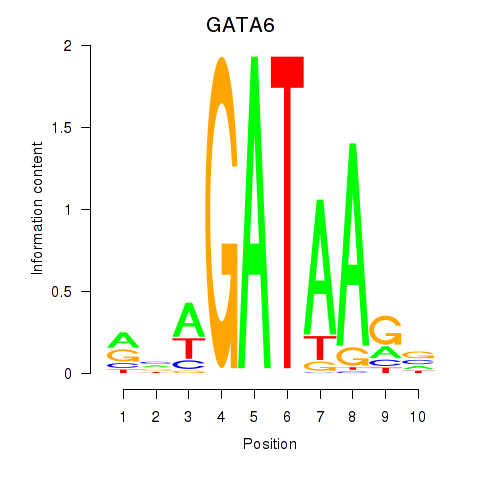
| GATA6 | 0.020 |
|
|
| AGUGGUU | 0.018 |
|

|
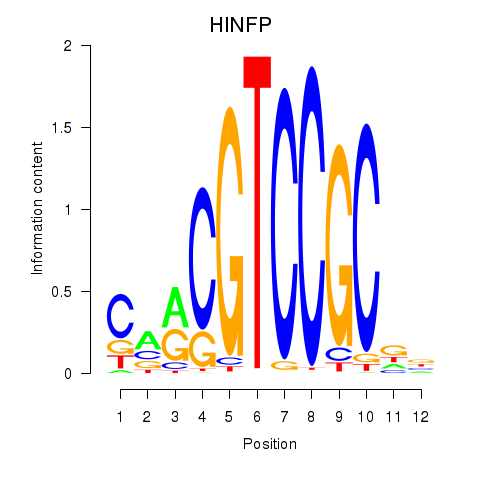
| HINFP | 0.012 |
|
|
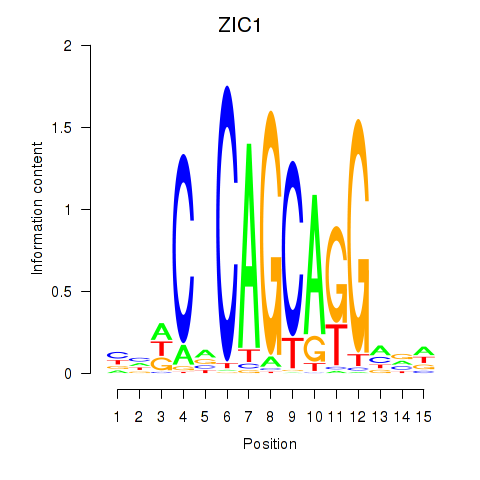
| ZIC1 | 0.012 |
|
|
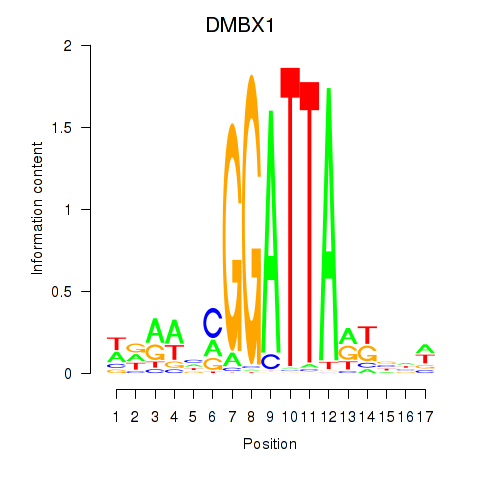
| DMBX1 | 0.008 |
|
|
| DRGX_PROP1 | 0.007 |
|
|
| ETS1 | 0.006 |
|
|
| GATA1_GATA4 | 0.003 |
|
|
| GGACGGA | 0.001 |
|

|
| PBX2 | 0.001 |
|
|
| DBP | -0.003 |
|
|
| GGAAGAC | -0.004 |
|

|
| AACGGAA | -0.006 |
|

|
| UGACCUA | -0.008 |
|

|
| TP73 | -0.009 |
|
|
| GUACCGU | -0.010 |
|

|
| AGAUCAG | -0.011 |
|

|
| ACCACAG | -0.013 |
|

|
| DLX3_EVX1_MEOX1 | -0.016 |
|
|
| UAAUGCU | -0.017 |
|

|
| FOXC1 | -0.023 |
|
|
| GAUCAGA | -0.025 |
|

|
| UUUUUGC | -0.026 |
|

|
| AACCUGG | -0.029 |
|

|
| CGUGUCU | -0.034 |
|

|
| UGUGCGU | -0.034 |
|

|
| BPTF | -0.037 |
|
|
| GLI3 | -0.038 |
|
|
| HOXC9 | -0.039 |
|
|
| ACCCGUA | -0.040 |
|

|
| HOXB7 | -0.043 |
|
|
| UGACAUC | -0.043 |
|

|
| TCF7L1 | -0.044 |
|
|
| VSX1 | -0.044 |
|
|
| AUGACAC | -0.046 |
|

|
| GLI2 | -0.048 |
|
|
| UAAGACU | -0.052 |
|

|
| UUGGUCC | -0.052 |
|

|
| SOX4 | -0.055 |
|
|
| DLX1_HOXA3_BARX2 | -0.057 |
|
|
| GFI1B | -0.057 |
|
|
| FOXK1_FOXP2_FOXB1_FOXP3 | -0.064 |
|
|
| ZNF524 | -0.066 |
|
|
| CCAGCAU | -0.076 |
|

|
| GAGAUGA | -0.077 |
|

|
| PAX1_PAX9 | -0.081 |
|
|
| GAUAUGU | -0.084 |
|

|
| ZNF8 | -0.086 |
|
|
| CUACAGU | -0.088 |
|

|
| NKX2-2 | -0.091 |
|
|
| PAX5 | -0.091 |
|
|
| UAAGGCA | -0.092 |
|

|
| MAX_TFEB | -0.095 |
|
|
| AGCUUAU | -0.099 |
|

|
| UCACAGU | -0.100 |
|

|
| ZBTB12 | -0.104 |
|
|
| GAGAACU | -0.107 |
|

|
| NFIL3 | -0.110 |
|
|
| AAGGCAC | -0.110 |
|

|
| ARID5B | -0.116 |
|
|
| UAAGACG | -0.117 |
|

|
| IRX5 | -0.123 |
|
|
| UGUGCUU | -0.124 |
|

|
| HOXA4 | -0.128 |
|
|
| AGUGCUU | -0.132 |
|

|
| E2F6 | -0.135 |
|
|
| TGIF1 | -0.152 |
|
|
| GUAGUGU | -0.156 |
|

|
| HOMEZ | -0.160 |
|
|
| NR2E3 | -0.161 |
|
|
| DLX5 | -0.161 |
|
|
| ZNF274 | -0.163 |
|
|
| POU2F1 | -0.165 |
|
|
| ZNF350 | -0.167 |
|
|
| IRX6_IRX4 | -0.170 |
|
|
| ATF5 | -0.172 |
|
|
| AACAGUC | -0.176 |
|

|
| CCUUCAU | -0.178 |
|

|
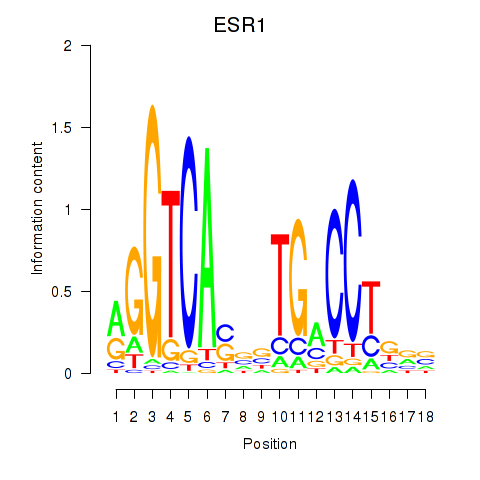
| ESR1 | -0.178 |
|
|
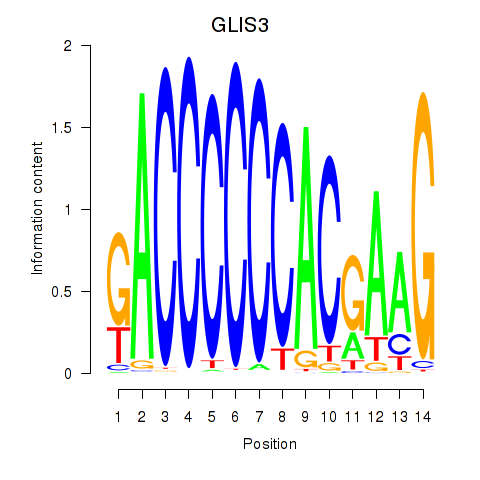
| GLIS3 | -0.180 |
|
|
| AAGUGCU | -0.182 |
|

|
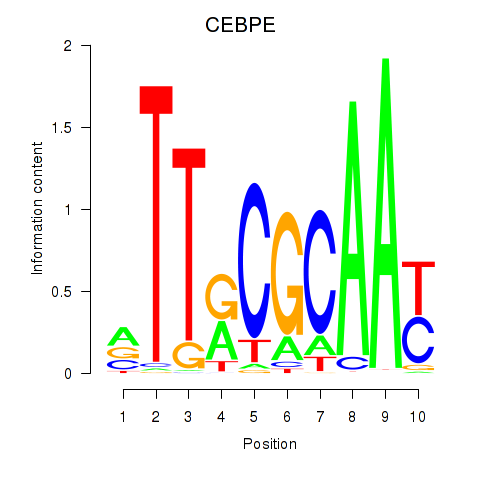
| CEBPE_CEBPD | -0.182 |
|
|
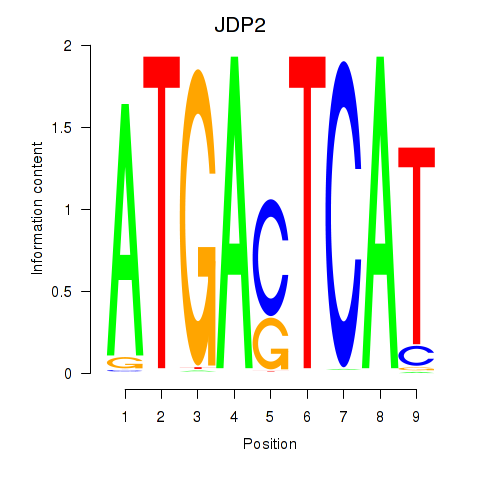
| JDP2 | -0.184 |
|
|
| PLAG1 | -0.184 |
|
|
| HOXD1 | -0.187 |
|
|
| HES7_HES5 | -0.192 |
|
|
| SOX5 | -0.195 |
|
|
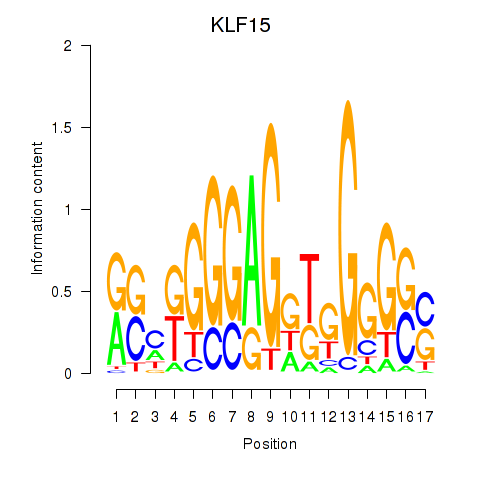
| KLF15 | -0.199 |
|
|
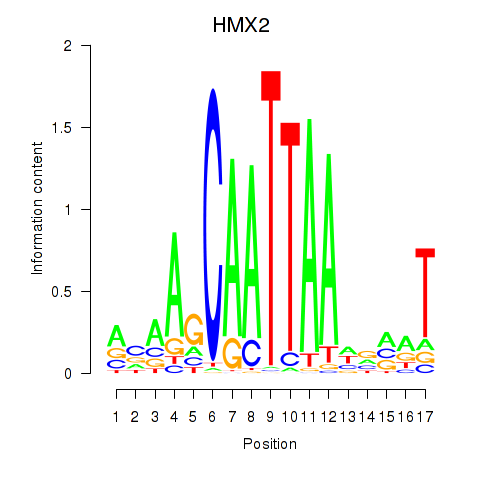
| HMX2 | -0.201 |
|
|
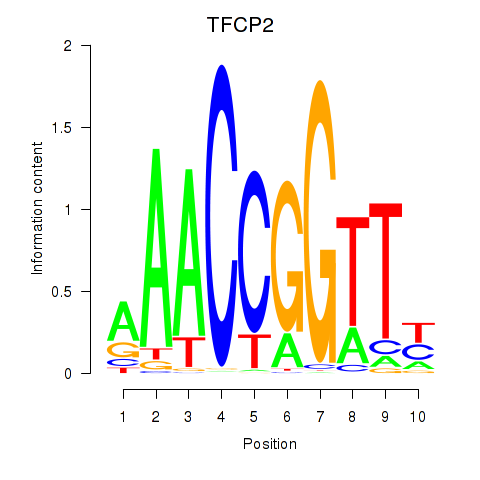
| TFCP2 | -0.202 |
|
|
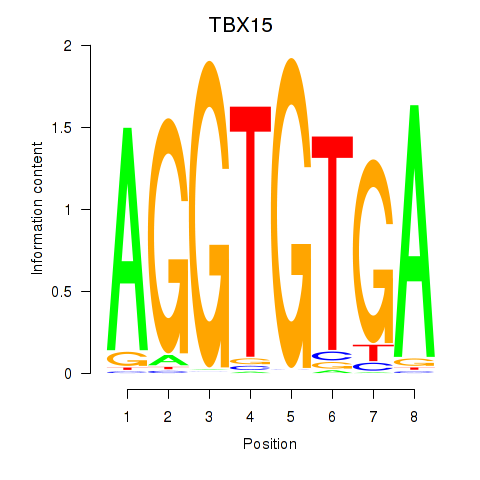
| TBX15_MGA | -0.205 |
|
|
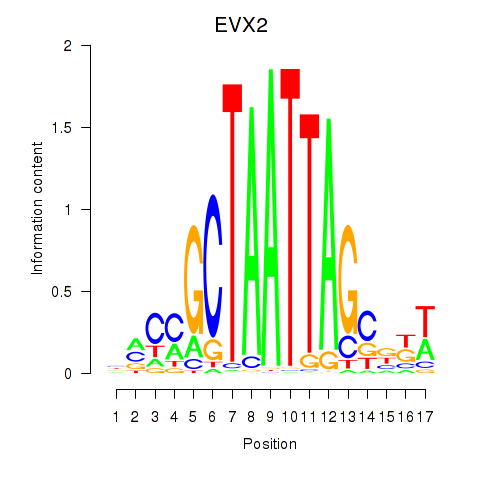
| EVX2 | -0.209 |
|
|
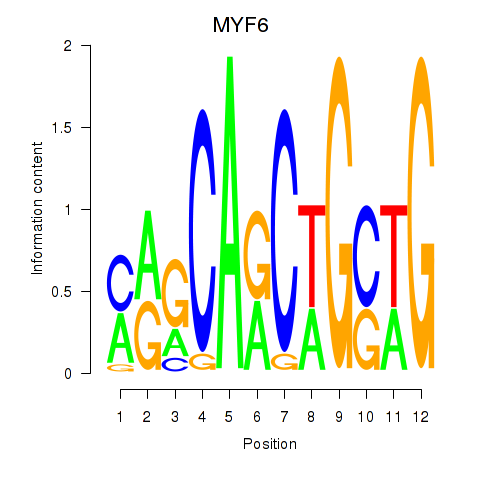
| MYF6 | -0.215 |
|
|
| AAUCUCU | -0.216 |
|

|
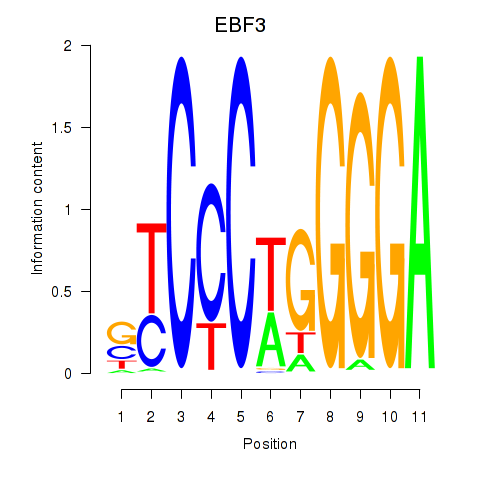
| EBF3 | -0.217 |
|
|
| AAUCUCA | -0.217 |
|

|
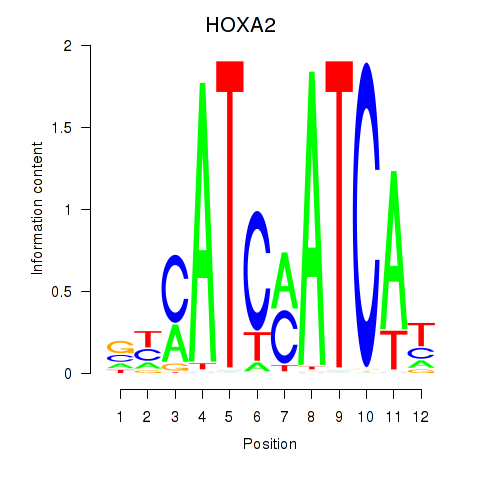
| HOXA2_HOXB1 | -0.219 |
|
|
| UUGUUCG | -0.219 |
|

|
| UCCAGUU | -0.222 |
|

|
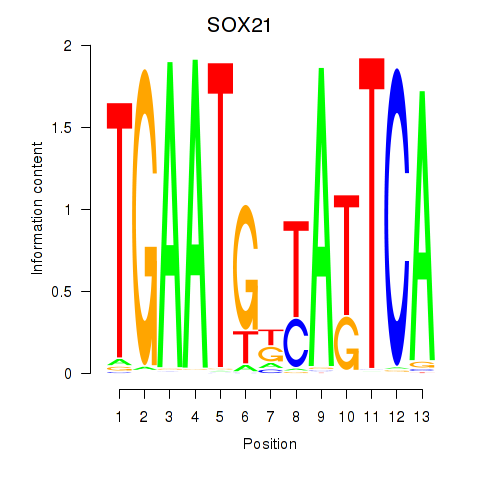
| SOX21 | -0.222 |
|
|
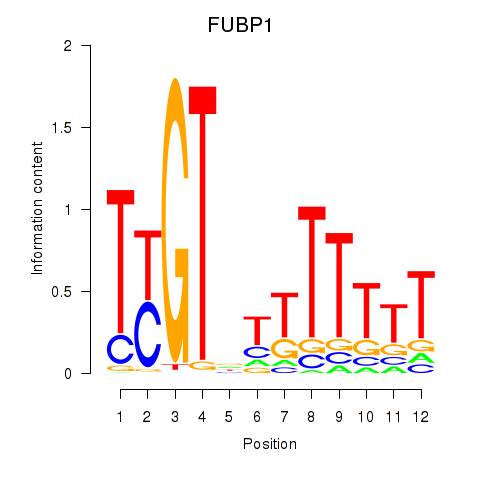
| FUBP1 | -0.226 |
|
|
| CUUUGGU | -0.227 |
|

|
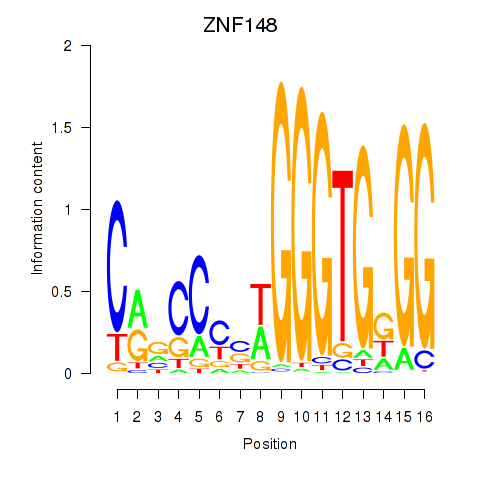
| ZNF148 | -0.230 |
|
|
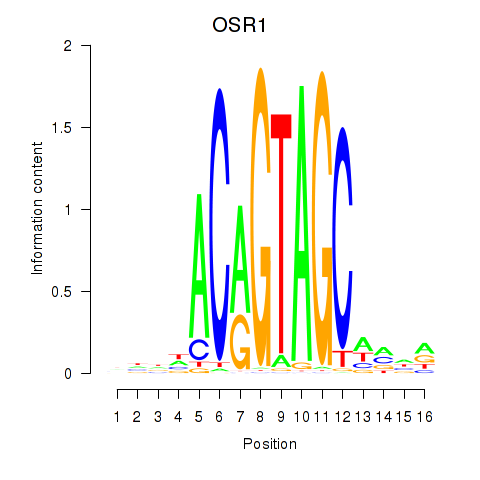
| OSR1_OSR2 | -0.233 |
|
|
| AGCCCUU | -0.234 |
|

|
| TFAP2E | -0.248 |
|
|
| POU1F1 | -0.252 |
|
|
| GUAACAG | -0.256 |
|

|
| HDX | -0.259 |
|
|
| TBX3 | -0.262 |
|
|
| MAFB | -0.264 |
|
|
| OLIG2_NEUROD1_ATOH1 | -0.266 |
|
|
| DLX4_HOXD8 | -0.267 |
|
|
| TFAP4_MSC | -0.270 |
|
|
| CREB1 | -0.270 |
|
|
| UGCAUAG | -0.275 |
|

|
| MEIS1 | -0.283 |
|
|
| HMGA1 | -0.291 |
|
|
| HSFY2 | -0.295 |
|
|
| SOX10_SOX15 | -0.296 |
|
|
| HMGA2 | -0.297 |
|
|
| NKX2-4 | -0.300 |
|
|
| UAUUGCU | -0.303 |
|

|
| PRDM4 | -0.304 |
|
|
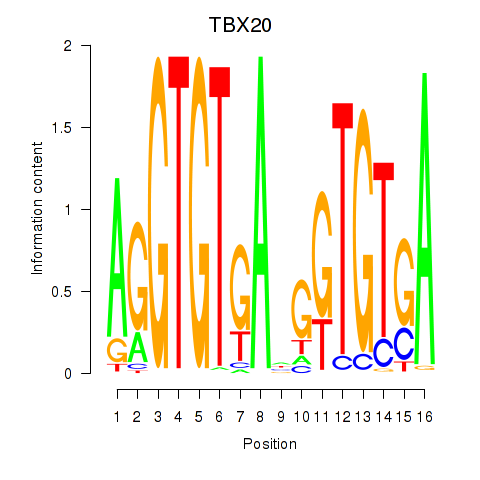
| TBX20 | -0.304 |
|
|
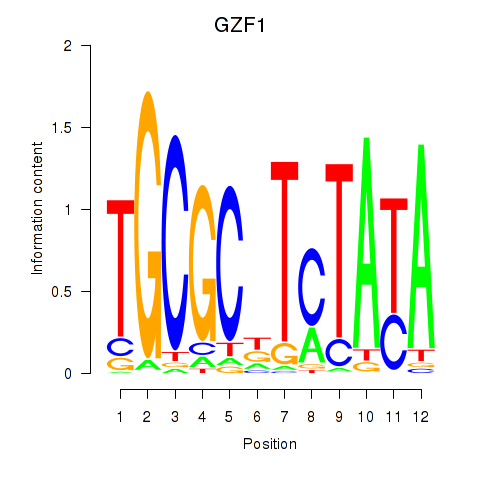
| GZF1 | -0.309 |
|
|
| ACUGCAU | -0.309 |
|

|
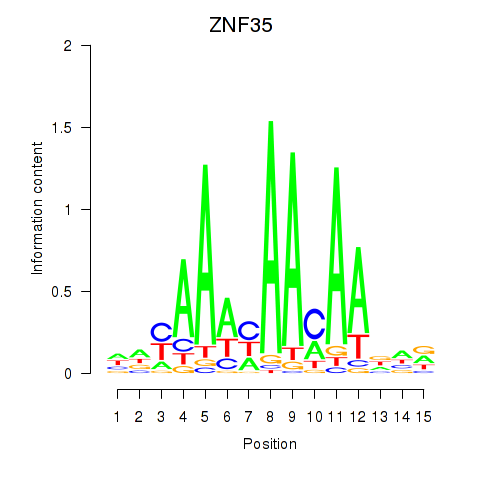
| ZNF35 | -0.311 |
|
|
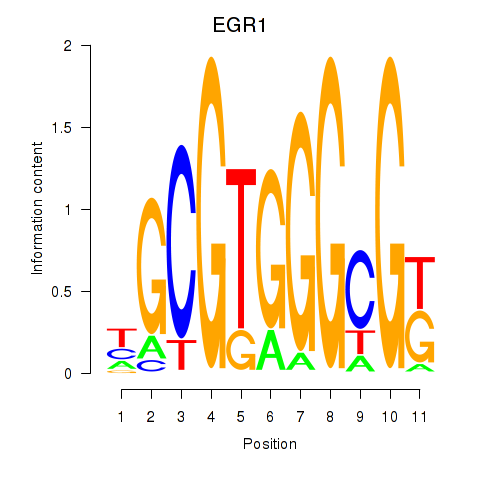
| EGR1_EGR4 | -0.313 |
|
|
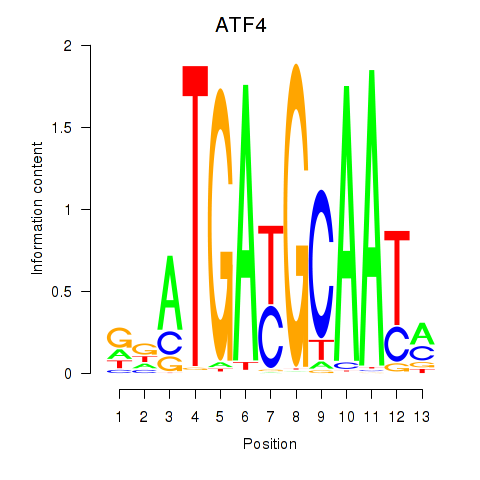
| ATF4 | -0.314 |
|
|
| UGCAUUG | -0.317 |
|

|
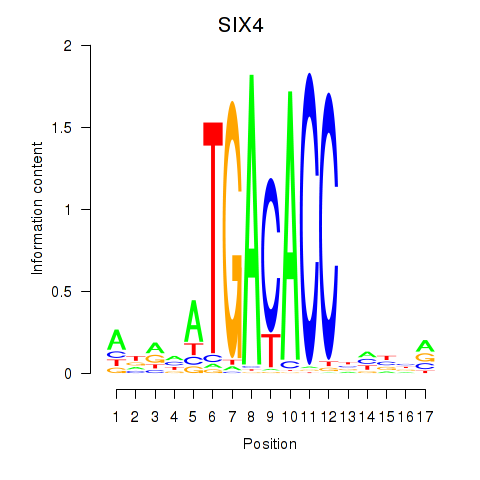
| SIX4 | -0.320 |
|
|
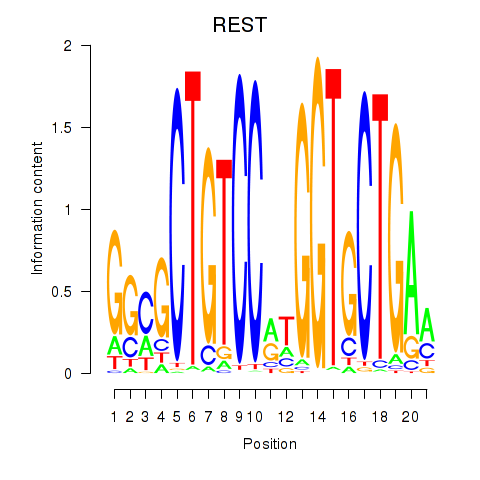
| REST | -0.322 |
|
|
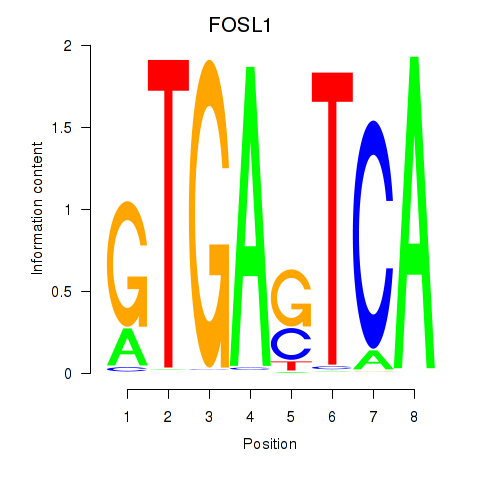
| FOSL1 | -0.328 |
|
|
| AACACUG | -0.331 |
|

|
| AAGGUGC | -0.338 |
|

|
| PRDM14 | -0.339 |
|
|
| NKX2-5 | -0.343 |
|
|
| HOXB8 | -0.346 |
|
|
| BATF3 | -0.347 |
|
|
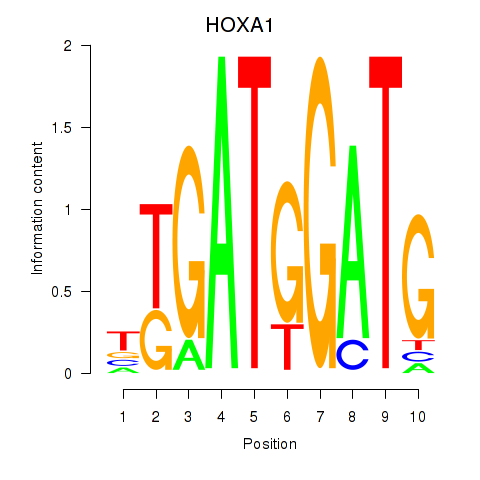
| HOXA1 | -0.352 |
|
|
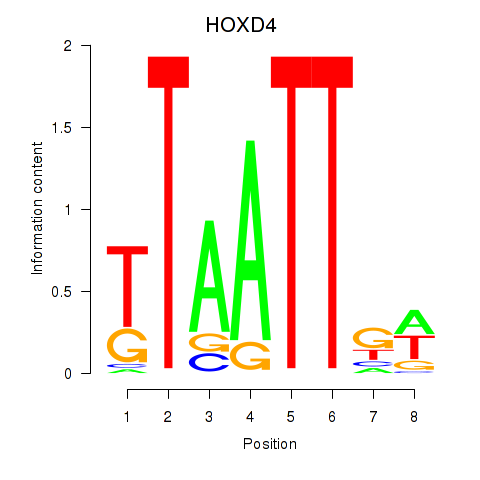
| HOXD4 | -0.354 |
|
|
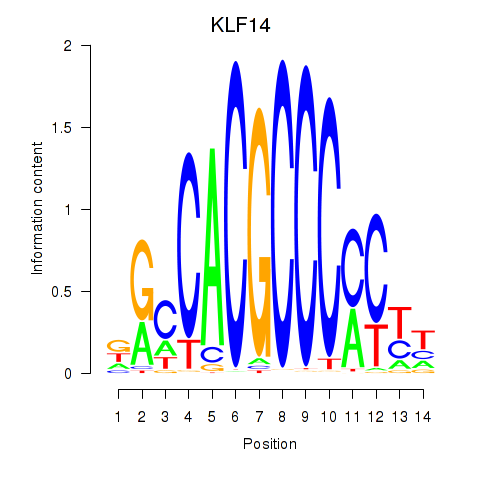
| KLF14_SP8 | -0.355 |
|
|
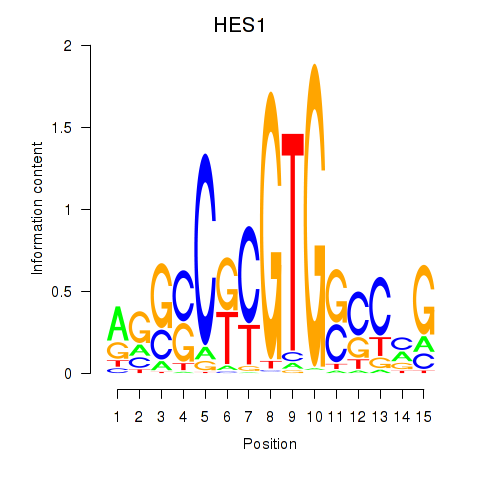
| HES1 | -0.358 |
|
|
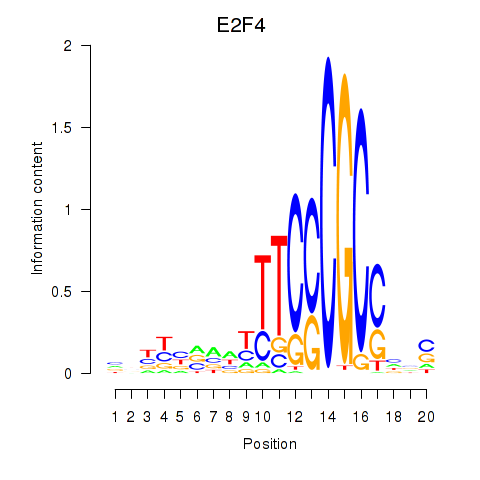
| E2F4 | -0.366 |
|
|
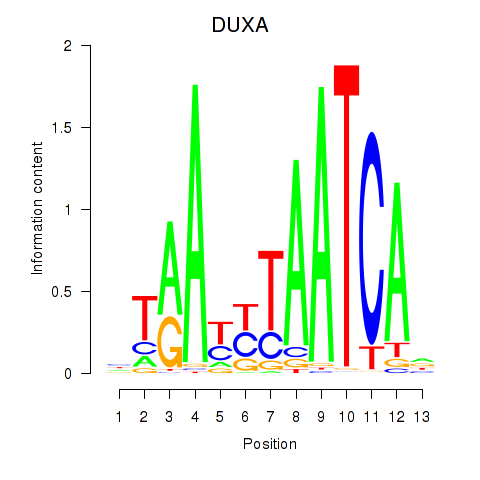
| DUXA | -0.372 |
|
|
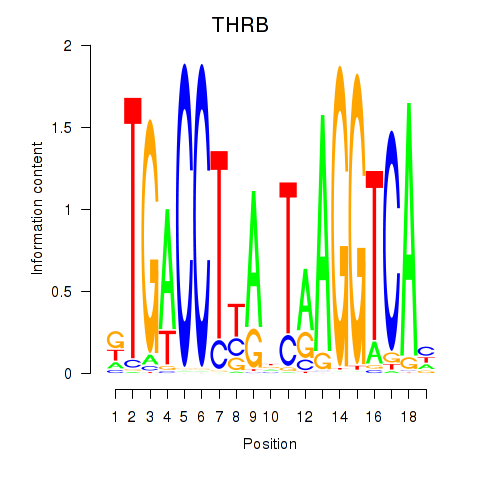
| THRB | -0.374 |
|
|
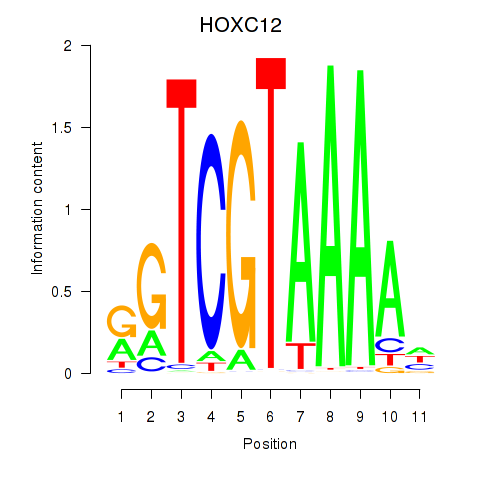
| HOXC12_HOXD12 | -0.381 |
|
|
| UUGGCAA | -0.388 |
|

|
| SOX11 | -0.390 |
|
|
| HOXA9 | -0.393 |
|
|
| POU4F1_POU4F3 | -0.397 |
|
|
| TBX21_TBR1 | -0.398 |
|
|
| ZNF282 | -0.403 |
|
|
| OTX1 | -0.406 |
|
|
| GCUACAU | -0.413 |
|

|
| GAUUGUC | -0.419 |
|

|
| MSX2 | -0.420 |
|
|
| HSF2 | -0.423 |
|
|
| ZBTB49 | -0.430 |
|
|
| AAUGCCC | -0.437 |
|

|
| IRF9 | -0.446 |
|
|
| PKNOX2 | -0.449 |
|
|
| CAGUAGU | -0.451 |
|

|
| ACAGUAU | -0.451 |
|

|
| DBX2_HLX | -0.451 |
|
|
| AUGGCUU | -0.452 |
|

|
| IRF7 | -0.455 |
|
|
| SOX14 | -0.457 |
|
|
| SREBF2 | -0.460 |
|
|
| CACAGUG | -0.463 |
|

|
| AUAAAGU | -0.464 |
|

|
| CPEB1 | -0.466 |
|
|
| STAT5B | -0.470 |
|
|
| ATF6 | -0.477 |
|
|
| ARID3A | -0.478 |
|
|
| RFX3_RFX2 | -0.483 |
|
|
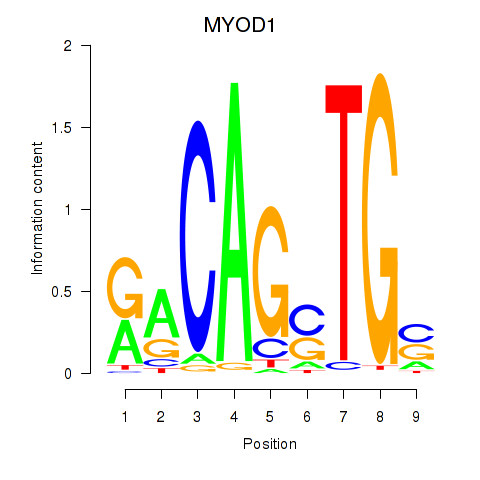
| MYOD1 | -0.488 |
|
|
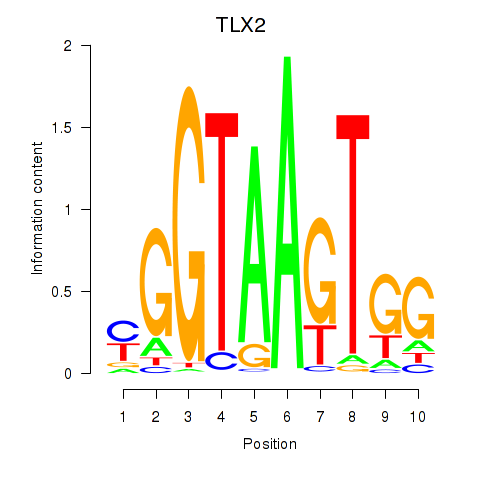
| TLX2 | -0.489 |
|
|
| GGCAGUG | -0.489 |
|

|
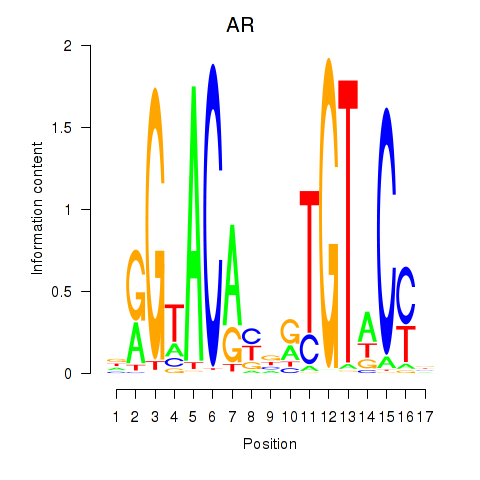
| AR_NR3C2 | -0.500 |
|
|
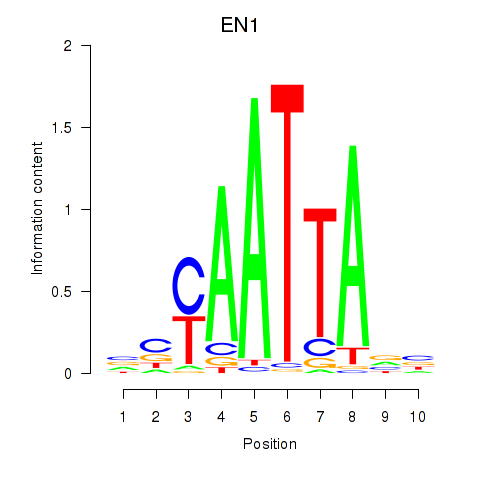
| EN1_ESX1_GBX1 | -0.503 |
|
|
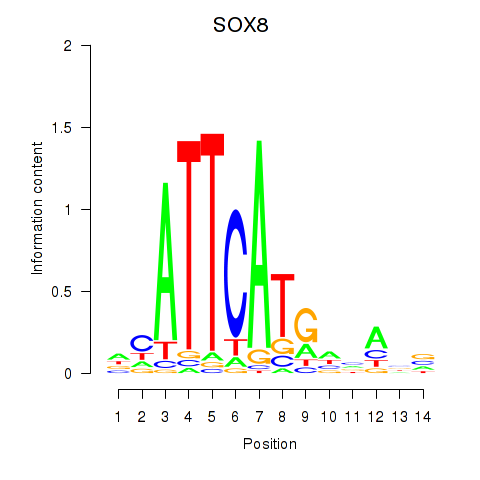
| SOX8 | -0.503 |
|
|
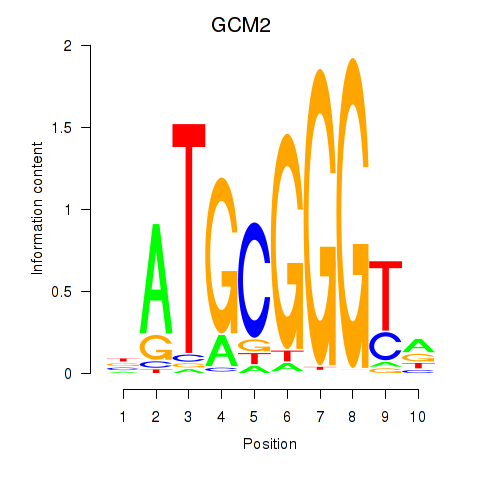
| GCM2 | -0.504 |
|
|
| GUCAGUU | -0.506 |
|

|
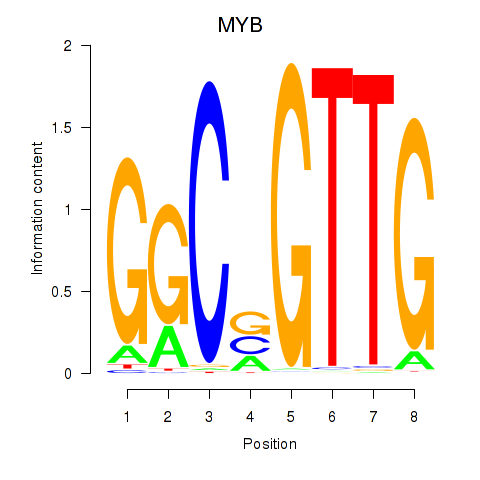
| MYB | -0.507 |
|
|
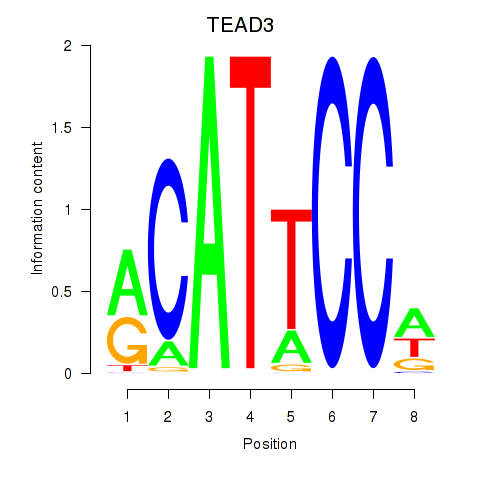
| TEAD3_TEAD1 | -0.513 |
|
|
| AGCAGCA | -0.523 |
|

|
| AGCACCA | -0.535 |
|

|
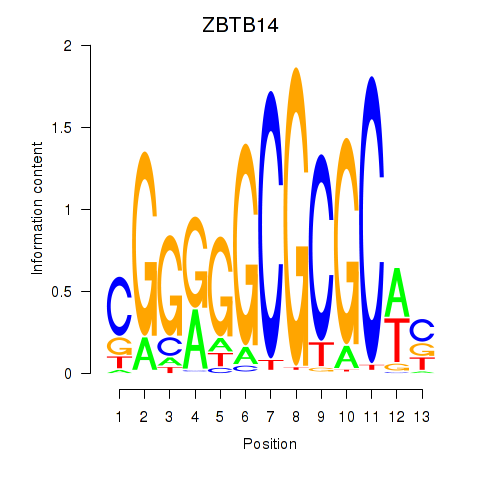
| ZBTB14 | -0.544 |
|
|
| AGCAGCG | -0.544 |
|

|
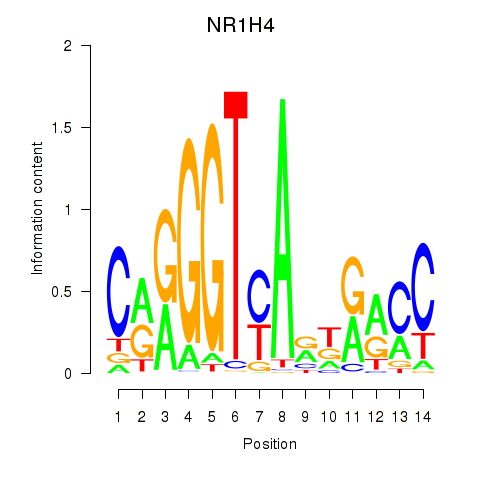
| NR1H4 | -0.546 |
|
|
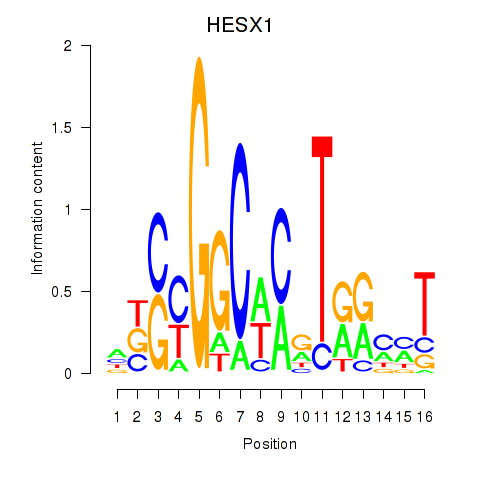
| HESX1 | -0.549 |
|
|
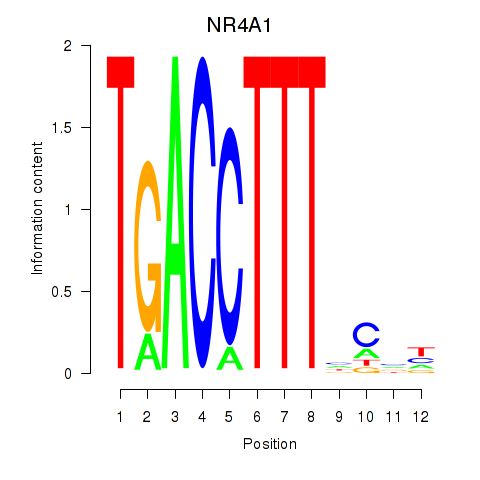
| NR4A1 | -0.551 |
|
|
| UCCCUUU | -0.554 |
|

|
| POU6F1 | -0.558 |
|
|
| PPARD | -0.562 |
|
|
| PITX1 | -0.562 |
|
|
| NFKB2 | -0.563 |
|
|
| TCF7L2 | -0.565 |
|
|
| RXRA_NR2F6_NR2C2 | -0.574 |
|
|
| CAGUAAC | -0.576 |
|

|
| ZFHX3 | -0.578 |
|
|
| PAX6 | -0.593 |
|
|
| AGUGCAA | -0.596 |
|

|
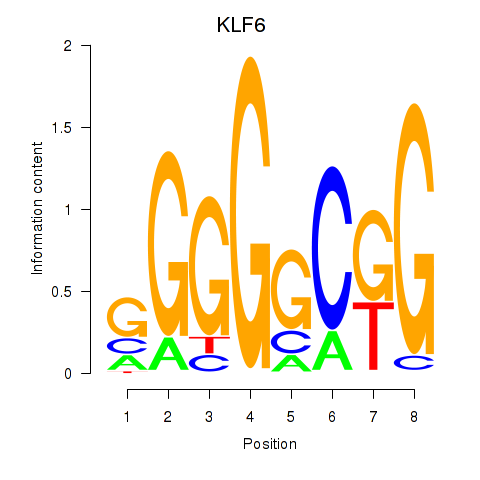
| KLF6 | -0.611 |
|
|
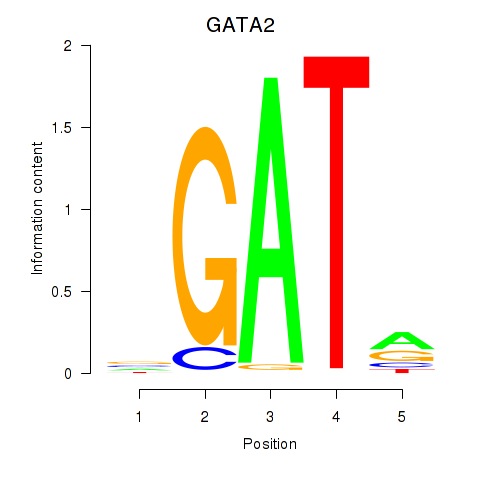
| GATA2 | -0.613 |
|
|
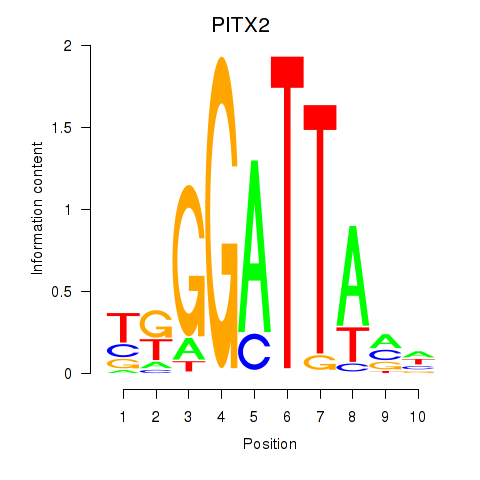
| PITX2 | -0.617 |
|
|
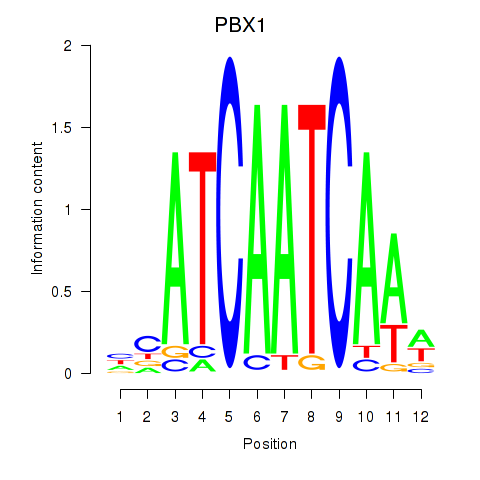
| PBX1 | -0.623 |
|
|
| KLF8 | -0.625 |
|
|
| TFCP2L1 | -0.636 |
|
|
| ZEB1 | -0.638 |
|
|
| FLI1 | -0.638 |
|
|
| SPIC | -0.643 |
|
|
| BCL6B | -0.653 |
|
|
| MEIS2 | -0.669 |
|
|
| SOX7 | -0.681 |
|
|
| CBFB | -0.685 |
|
|
| GGAAUGU | -0.688 |
|

|
| HOXC13 | -0.689 |
|
|
| GMEB1 | -0.710 |
|
|
| MESP1 | -0.720 |
|
|
| MLX_USF2_USF1_PAX2 | -0.727 |
|
|
| ISX | -0.728 |
|
|
| FOXN1 | -0.730 |
|
|
| NKX1-2_RAX | -0.737 |
|
|
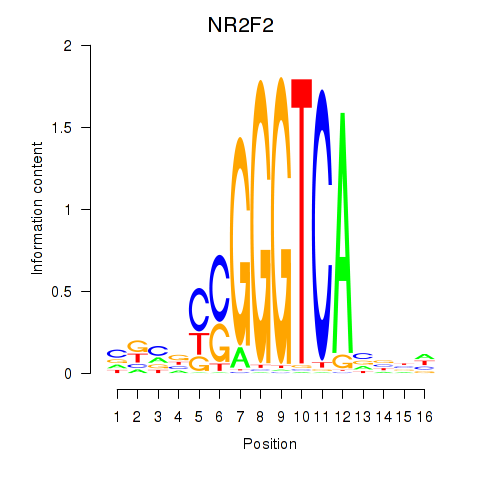
| NR2F2 | -0.739 |
|
|
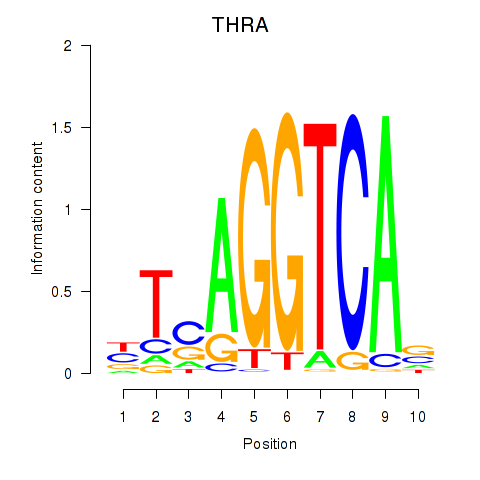
| THRA_RXRB | -0.746 |
|
|
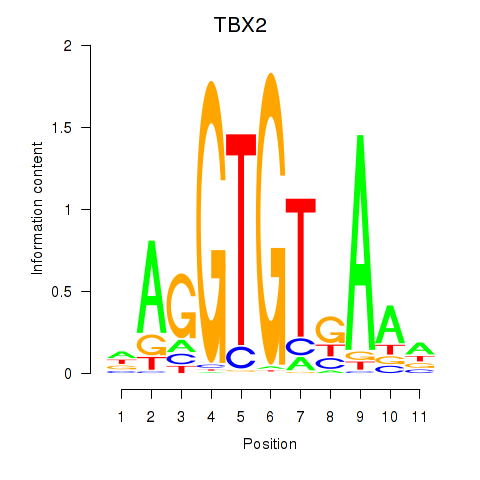
| TBX2 | -0.747 |
|
|
| UAGUGUU | -0.754 |
|

|
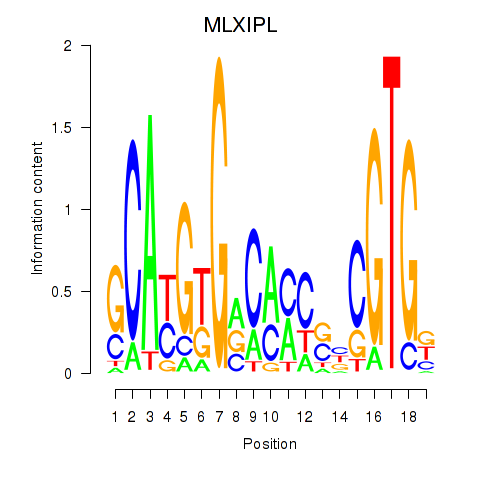
| MLXIPL | -0.759 |
|
|
| LHX6 | -0.773 |
|
|
| FOXQ1 | -0.778 |
|
|
| TCF3_MYOG | -0.785 |
|
|
| UCACAUU | -0.818 |
|

|
| E2F2_E2F5 | -0.819 |
|
|
| SOX18 | -0.820 |
|
|
| HMX3 | -0.826 |
|
|
| HOXD9 | -0.827 |
|
|
| UGAAAUG | -0.839 |
|

|
| CDX1 | -0.844 |
|
|
| UACAGUA | -0.851 |
|

|
| NR0B1 | -0.859 |
|
|
| NR1D1 | -0.861 |
|
|
| TAL1 | -0.876 |
|
|
| AGGUAGU | -0.888 |
|

|
| TCF7 | -0.894 |
|
|
| HOXB2_UNCX_HOXD3 | -0.897 |
|
|
| TBX4 | -0.908 |
|
|
| TAF1 | -0.913 |
|
|
| IRF6_IRF4_IRF5 | -0.931 |
|
|
| AAUACUG | -0.932 |
|

|
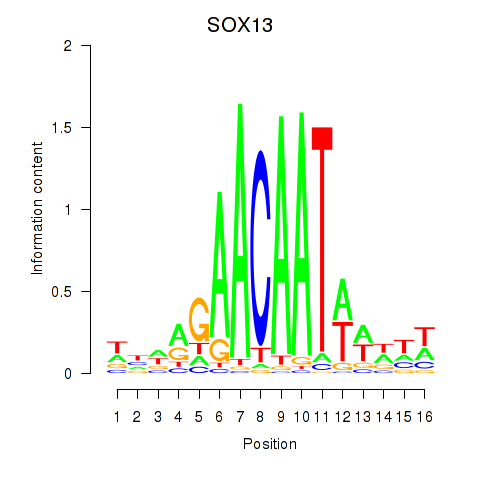
| SOX13_SOX12 | -0.947 |
|
|
| AUGGCAC | -0.955 |
|

|
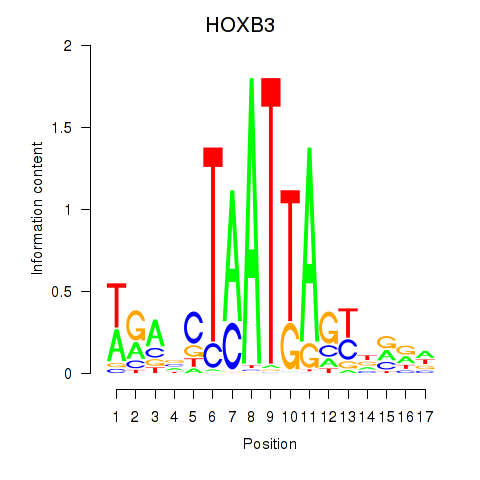
| HOXB3 | -0.963 |
|
|
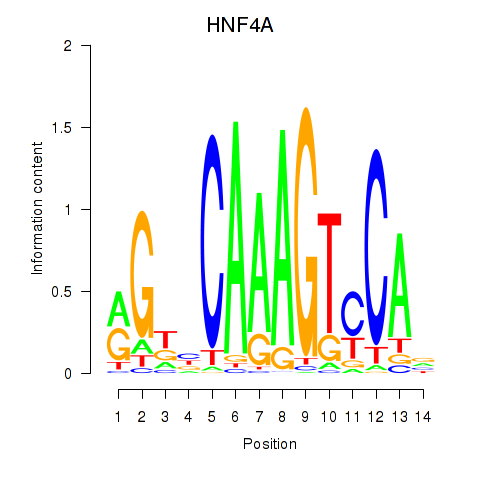
| HNF4A | -0.968 |
|
|
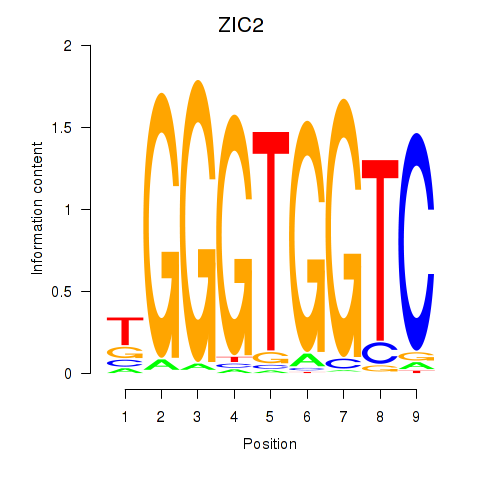
| ZIC2_GLI1 | -0.969 |
|
|
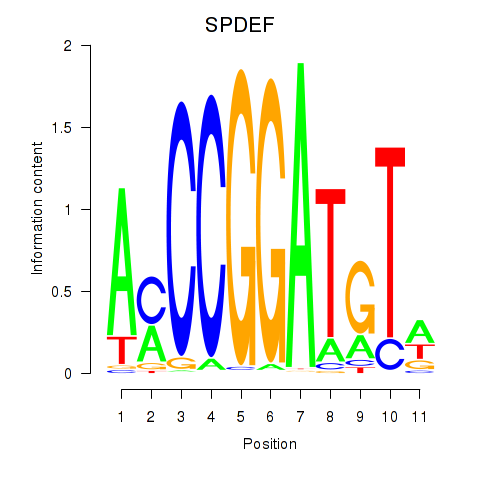
| SPDEF | -1.012 |
|
|
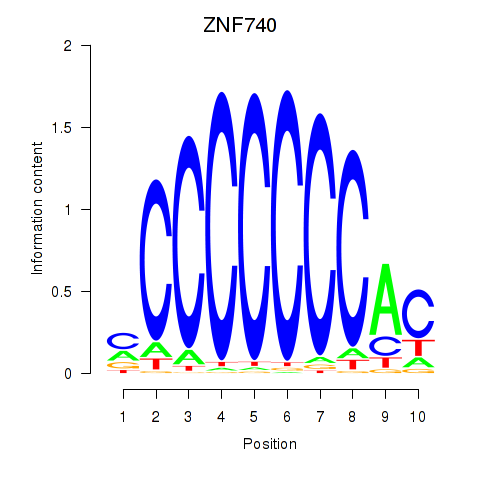
| ZNF740_ZNF219 | -1.016 |
|
|
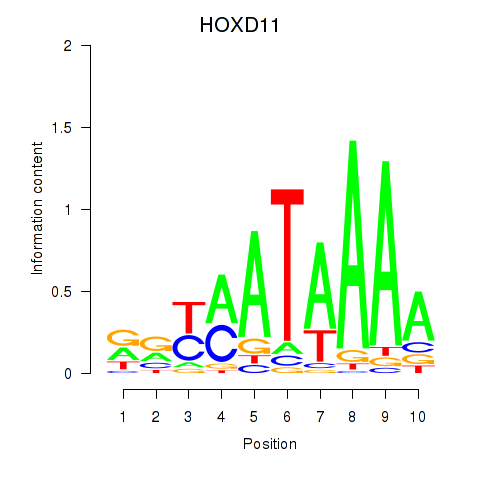
| HOXD11_HOXA11 | -1.022 |
|
|
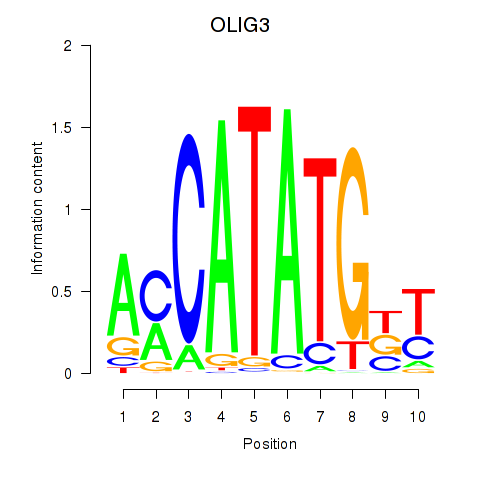
| OLIG3_NEUROD2_NEUROG2 | -1.031 |
|
|
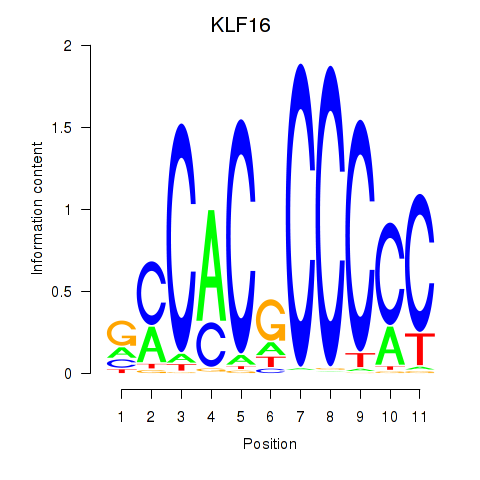
| KLF16_SP2 | -1.033 |
|
|
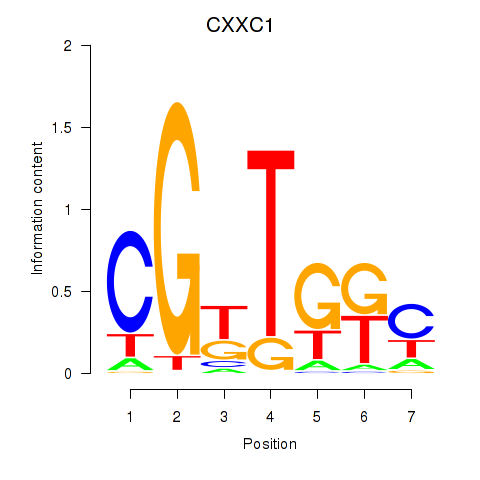
| CXXC1 | -1.049 |
|
|
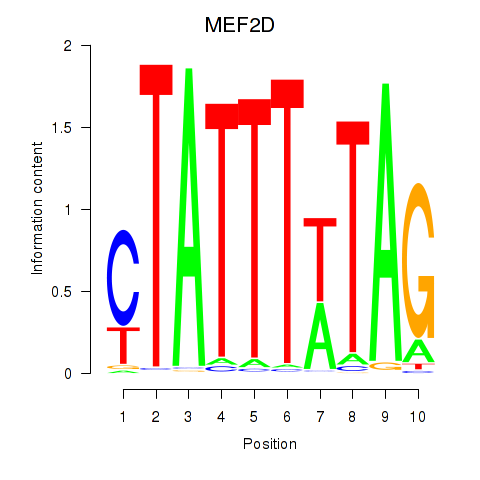
| MEF2D_MEF2A | -1.059 |
|
|
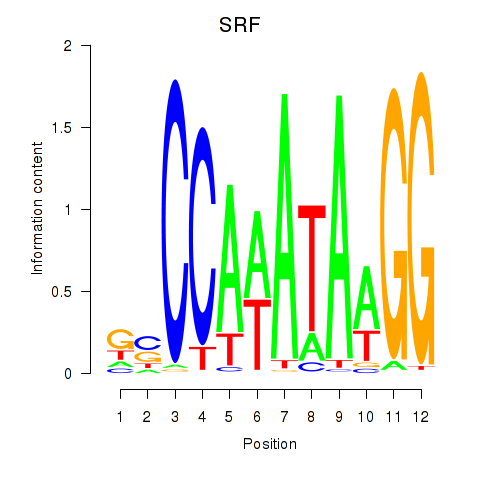
| SRF | -1.061 |
|
|
| BARX1 | -1.066 |
|
|
| ZBTB16 | -1.082 |
|
|
| PTF1A | -1.083 |
|
|
| CLOCK | -1.087 |
|
|
| POU6F2 | -1.095 |
|
|
| NKX2-1 | -1.099 |
|
|
| ATF7 | -1.106 |
|
|
| HOXA6 | -1.109 |
|
|
| ONECUT1 | -1.115 |
|
|
| YBX1_FOS_NFYC_NFYA_NFYB_CEBPZ | -1.138 |
|
|
| GUGCAAA | -1.159 |
|

|
| UCAAGUA | -1.169 |
|

|
| FOXA2_FOXJ3 | -1.187 |
|
|
| SIX5_SMARCC2_HCFC1 | -1.225 |
|
|
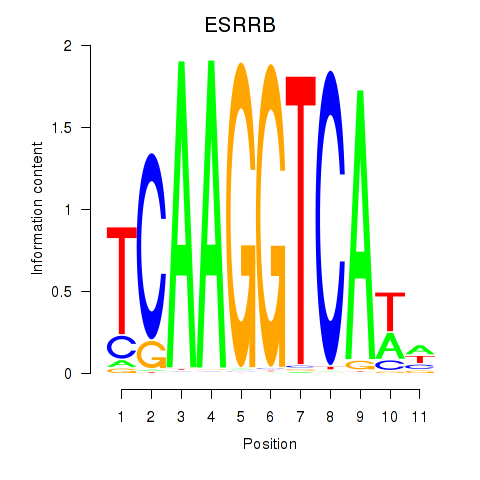
| ESRRB_ESRRG | -1.226 |
|
|
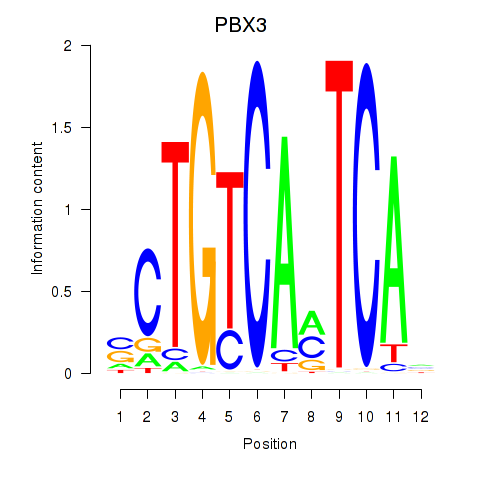
| PBX3 | -1.232 |
|
|
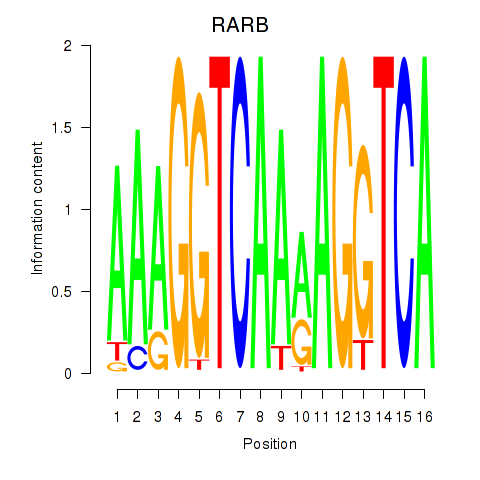
| RARB | -1.241 |
|
|
| ACAUUCA | -1.262 |
|

|
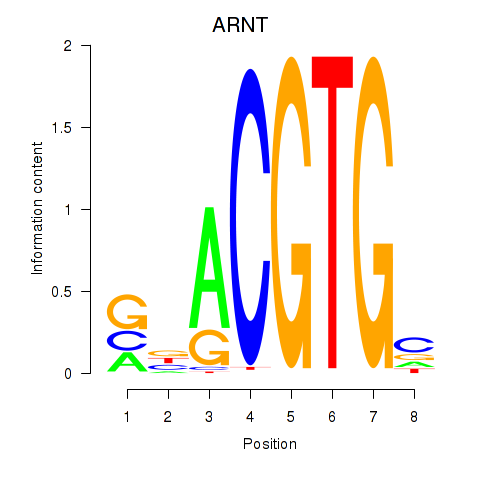
| ARNT | -1.293 |
|
|
| ACAGUAC | -1.320 |
|

|
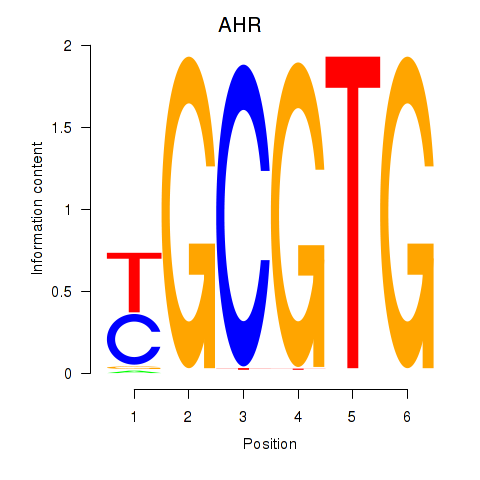
| AHR_ARNT2 | -1.324 |
|
|
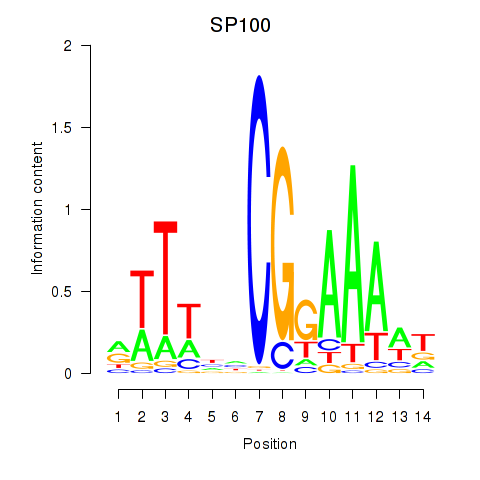
| SP100 | -1.345 |
|
|
| GAAAUGU | -1.374 |
|

|
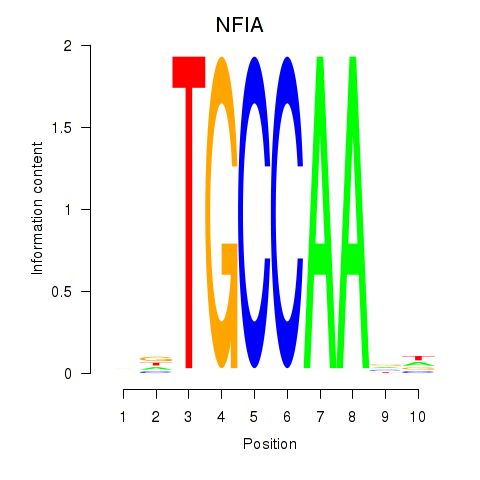
| NFIA | -1.381 |
|
|
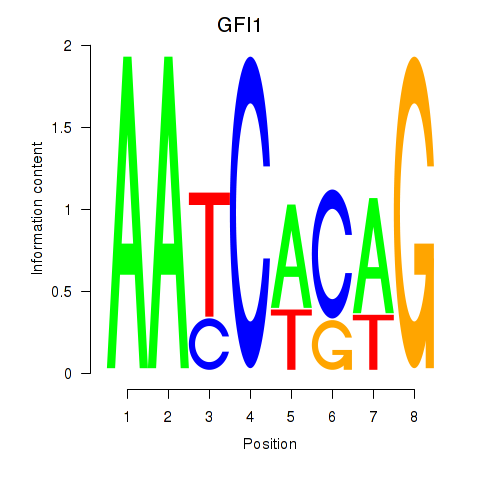
| GFI1 | -1.407 |
|
|
| SP1 | -1.453 |
|
|
| MYBL2 | -1.476 |
|
|
| PITX3 | -1.486 |
|
|
| POU3F2 | -1.489 |
|
|
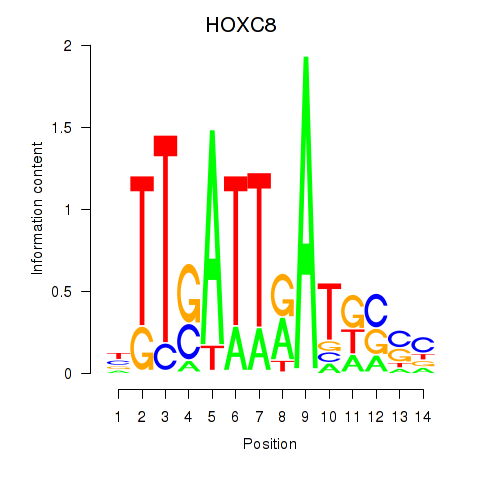
| HOXC8 | -1.554 |
|
|
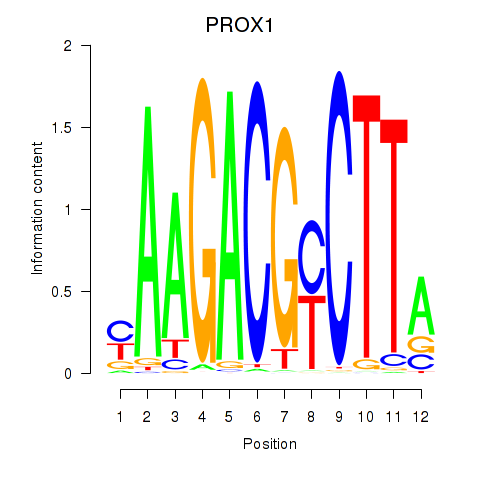
| PROX1 | -1.581 |
|
|
| AUUGCAC | -1.623 |
|

|
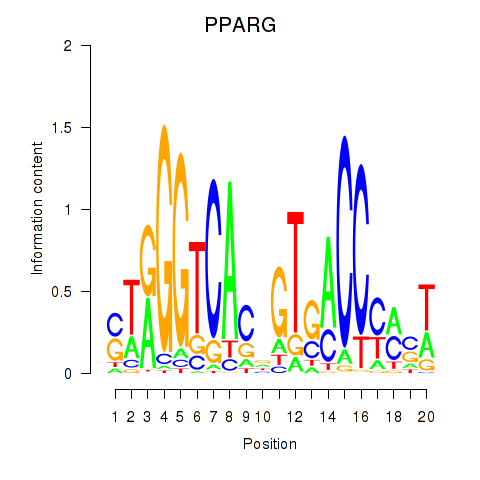
| PPARG | -1.623 |
|
|
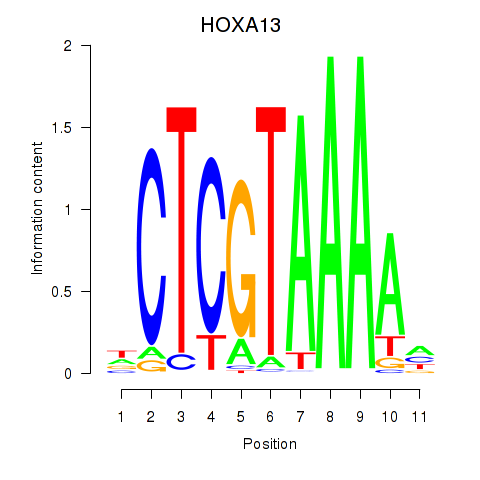
| HOXA13 | -1.659 |
|
|
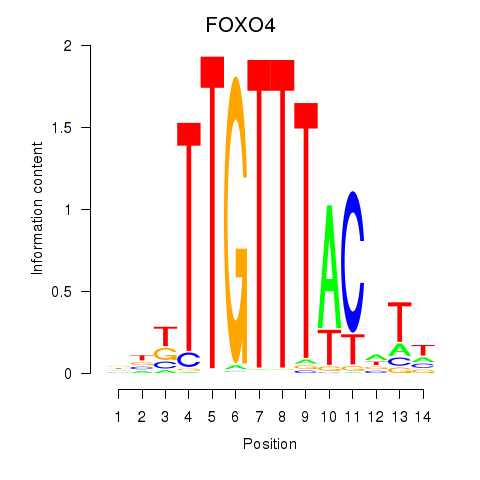
| FOXO4 | -1.675 |
|
|
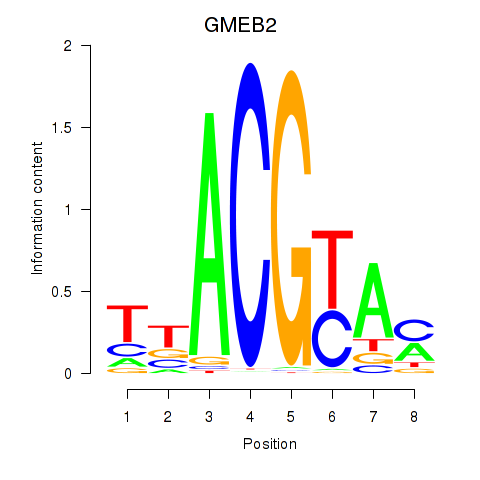
| GMEB2 | -1.680 |
|
|
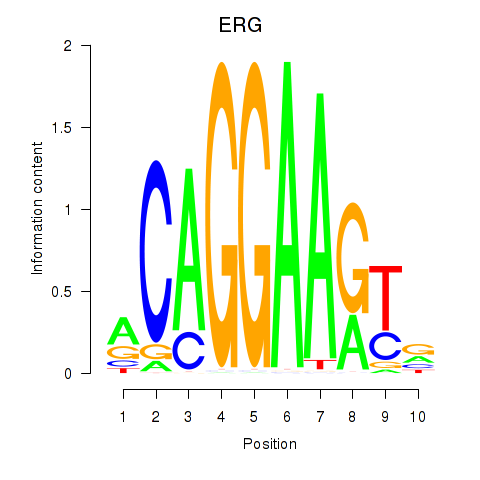
| ERG | -1.727 |
|
|
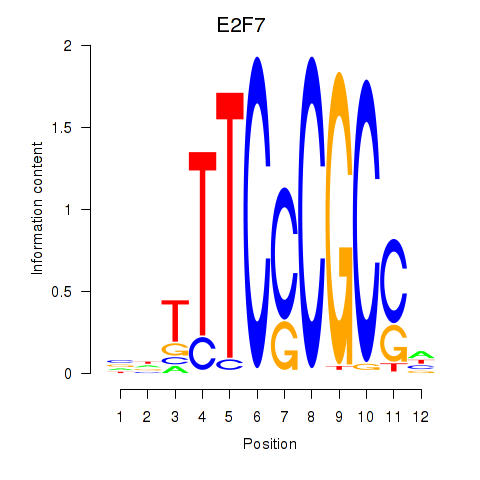
| E2F7_E2F1 | -1.735 |
|
|
| ZNF384 | -1.759 |
|
|
| IRX3 | -1.818 |
|
|
| TFEC_MITF_ARNTL_BHLHE41 | -1.862 |
|
|
| ZNF711_TFAP2A_TFAP2D | -1.941 |
|
|
| GUAAACA | -2.001 |
|

|
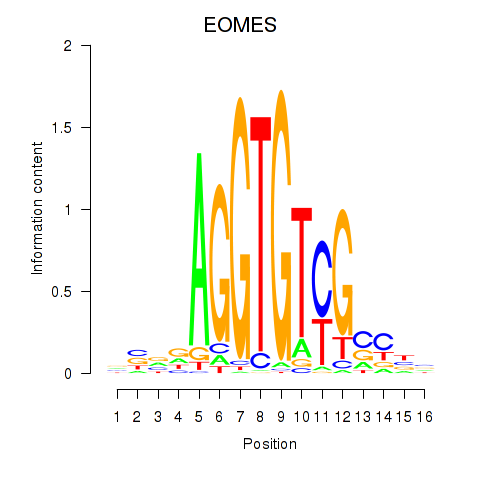
| EOMES | -2.232 |
|
|
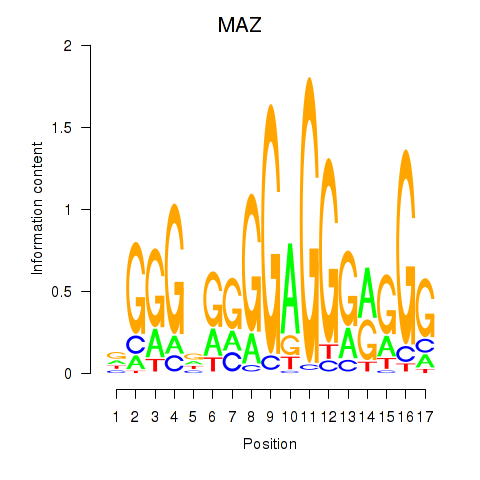
| MAZ_ZNF281_GTF2F1 | -2.378 |
|
|
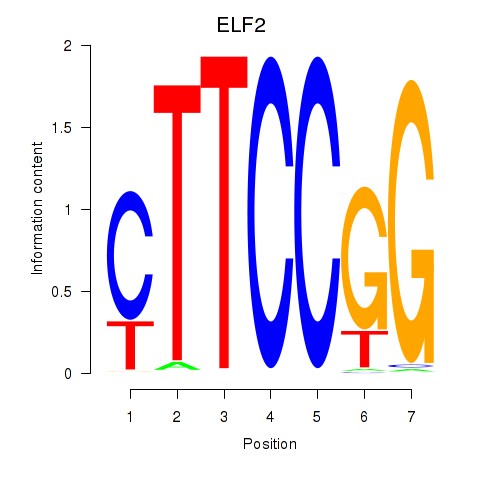
| ELF2_GABPA_ELF5 | -2.491 |
|
|
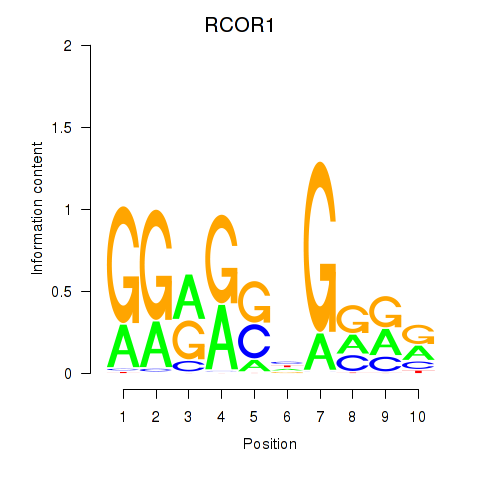
| RCOR1_MTA3 | -2.534 |
|
|
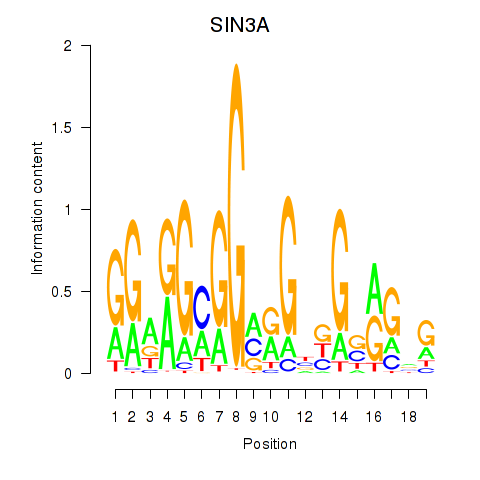
| SIN3A_CHD1 | -2.557 |
|
|
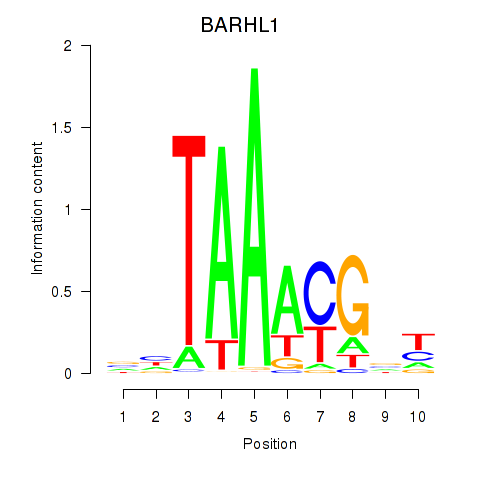
| BARHL1 | -2.730 |
|
|
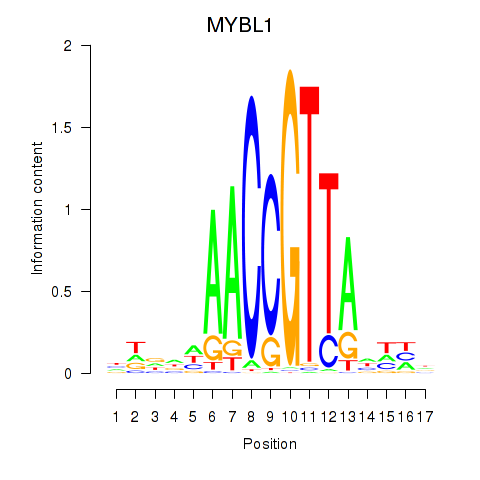
| MYBL1 | -2.766 |
|
|
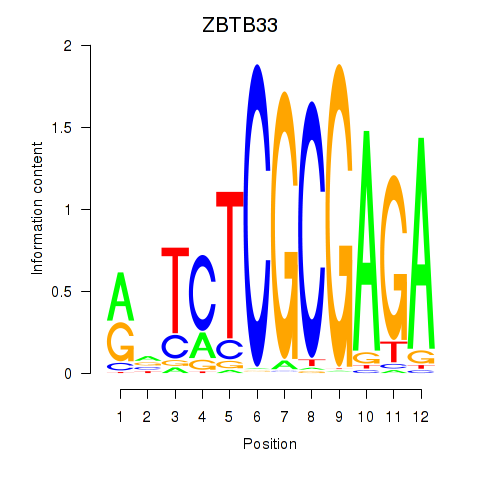
| ZBTB33_CHD2 | -2.831 |
|
|
| ELK4_ETV5_ELK1_ELK3_ELF4 | -3.166 |
|
|
| HOXB6_PRRX2 | -3.480 |
|
|
| E2F3 | -3.546 |
|
|
| NRF1 | -3.653 |
|
|